

Abstract
Background
Extensive evidence indicates that cortical connectivity patterns are abnormal in autism spectrum disorders (ASD), showing both over- and under-connectivity. Since, however, studies to date focused on either spatial or spectral dimensions, but not both simultaneously, much remains unknown about the nature of these abnormalities. In particular, it remains unknown whether abnormal connectivity patterns in ASD are driven by specific frequency bands, by spatial network properties, or by some combination of these factors.
Methods
Magnetoencephalography (MEG) recordings (15 ASD, 15 controls) mapped back onto cortical space were used to study resting state networks in ASD with both spatial and spectral specificity. The data were quantified using graph theoretic metrics.
Results
The two major factors that drove the nature of connectivity abnormalities in ASD were the mediating frequency band and whether the network included frontal nodes. These factors determined whether clustering and integration were increased or decreased in cortical resting state networks in ASD. These measures also correlated with abnormalities in the developmental trajectory of resting state networks in ASD. Lastly, these measures correlated with ASD severity in some frequency bands and spatially specific sub-networks.
Conclusions
Our findings suggest that network abnormalities in ASD are widespread, are more likely in subnetworks that include the frontal lobe, and can be opposite in nature depending on the frequency band. These findings thus elucidate seemingly contradictory prior findings of both over- and under- connectivity in ASD.
Keywords: development, autism, cortex, MEG activity, connectivity, resting state
Introduction
Multiple studies have documented abnormal functional connectivity in the brains of individuals diagnosed with autism spectrum disorders (ASD) (1–3). Many of these studies focused on functional connectivity in resting state networks (RSNs), which is particularly relevant for understanding autism because they are involved in self-reflection, social cognition [4, 5, 6], and theory of mind [7, 8], which are abnormal in ASD.
Most studies of RSNs functional connectivity in ASD find widespread functional under-connectivity [9, 10, 11], but some studies show a mixed picture, finding both under- and over-connectivity between different region pairs [12, 13]. Another study found no abnormalities at the whole-brain level, and predominantly reduced local connectivity in frontal and temporal regions [14].
The emergent picture of RSNs functional connectivity in ASD is thus not cohesive. It is further complicated by the fact that different studies used different age groups, as the developmental trajectory of these networks seems to be different in ASD individuals than in typical adolescents [15, 16]. Furthermore, motion artifacts can hinder accurate measurements of functional connectivity [14, 17], and the selected fMRI analysis method can also affect the results [18, 19]. Functional connectivity is mediated by various rhythms of cortical oscillations [20, 21, 22]. Building a neurophysiological model of ASD requires that we understand the specific functional abnormalities associated with different frequency bands, which cannot be accomplished with fMRI. However, to date, few studies have examined RSNs in ASD with high spectro-temporal resolution. One electroencephalography (EEG) based study found reduced functional connectivity in ASD during the resting state in the α band [23]. A series of studies of ASD using magnetoencephalography (MEG) found increased short-range and reduced long-range functional connectivity in the δ band [24], broadband abnormalities [25, 26, 27], decreased coherence in lower frequency bands [28], and abnormalities limited again just to the α band [26]. However, all of these studies lacked spatial specificity. Furthermore, none of the high spectro-temporal resolution studies looked at developmental trajectories of RSNs in ASD.
Since prior studies of RSNs in ASD focused on either the spatial domain (fMRI) or the spectral domain (EEG/MEG), the relationship between the two domains has also remained unknown. Such information is critical because brain networks are dynamic and complex in both space and time. As our recent studies of task-related functional connectivity have shown, studying brain networks simultaneously in space and time can greatly increase our understanding of the network abnormalities associated with ASD [29, 30].
Here, we further addressed these gaps by studying functional connectivity in RSNs in ASD with both spectro-temporal and spatial resolution, which was achieved using MEG with the signals mapped from the sensors onto cortical space. Specifically, we tested how functional connectivity in RSNs in ASD differs globally, locally, and across different frequency bands in the cortex. We also examined how these network properties changed with age and ASD severity.
To characterize the connectivity data within each frequency band, we used graph theory. Graph theory captures the essence of the multitude of interconnections between all areas on the cortex, which would otherwise be intractable. It reduces the dimensionality of the problem to a finite set of descriptive graph properties, and its mathematical underpinnings are well documented [31, 32]. The advantage of graph theory over analyses based on seeds or regions of interest is that it allows the study of multiple network properties simultaneously and on several spatial scales. Importantly, a previous task-based study has shown that global graph properties are qualitatively similar when calculated in either sensor or cortical space, demonstrating that the transformation from sensors to sources conserves the most fundamental properties of the network and is valid for this type of analysis [33].
In this study, our goal was to understand how network properties in ASD vary with spatial location and across different frequency bands. We hypothesized that resting state connectivity both between and within regions will be more impacted in frontal regions [12, 11]. We further hypothesized, based on current fMRI studies [15, 16], that while RSN connectivity in TD individuals evolves with age, such developmental changes will be attenuated in ASD individuals. Lastly, we hypothesized that ASD severity and network connectivity will be inversely correlated.
Materials and Methods
Participants, Experimental Paradigm, and Data Acquisition
The participants were 15 males aged 6–21 years and diagnosed with ASD and 15 matched TD males (Table S1 in Supplement 1). Participants with ASD had a prior clinical diagnosis of ASD and met a cutoff of > 15 on the Social Communication Questionnaire (SCQ), Lifetime Version, and ASD criteria on the ADOS. Individuals with autism-related medical conditions (e.g., fragile X syndrome, tuberous sclerosis) and other risk factors (e.g., premature birth) were excluded. All protocols were approved by the Massachusetts General Hospital Institutional Review Board, and informed consent was obtained from all participants.
MRI and MEG resting state data acquisition
T1-weighted, high-resolution, Magnetization-Prepared Rapid-Gradient Echo (MPRAGE) structural images were acquired on a 3.0T Siemens Trio whole-body MRI scanner (Siemens Medical Systems) using a 32-channel head coil. MEG data were acquired inside a magnetically shielded room (IMEDCO) using a whole-head Elekta Neuromag VectorView system composed of 306 sensors arranged in 102 triplets of two orthogonal planar gradiometers and one magnetometer. The resting state paradigm consisted of a red fixation cross at the center of the screen, presented for 5 minutes continuously.
Data cleaning and motion correction
The data were spatially filtered using the signal space separation (SSS) method [34, 35] (Maxfilter software; Elekta Neuromag) to suppress noise generated by sources outside the brain. Head position was acquired at 200 ms time intervals using 4 HPI (head position indicator) coils, and the SSS procedure corrected for the participants’ head motion. Artifacts from heartbeats and eye blinks were identified and removed using signal space projection (SSP; see SI and [36]).
Mapping MEG data to cortical space
For analysis in cortical space, the MEG data were mapped from the sensors onto a high-resolution cortical surface generated by FreeSurfer [37], using minimum-norm estimate [see section 3.1 in Supplement 1 and (38)]. For the analysis, the dipole timeseries were extracted for each vertex within a region.
Time series cleaning and analysis
The timeseries were band-pass filtered and downsampled for faster processing. The chosen frequency bands were δ (1–2 Hz), θ(3–7 Hz), α (8–12 Hz), β (13–30 Hz), and γ (30–70 Hz). For each individual frequency band the analytic signal X̂(t) was calculated. Signal spikes, dropouts, and epochs with excessive head movement were removed. The amount of data lost through cleaning was well below 10%, and did not differ between groups. We used orthogonal correlations [39] to compute the connectivity metric. This approach addresses the field spread issue [40] (but see also [41]). See section 4.2 in Supplement 1 for additional details.
Networks in anatomical space
Figure Figure 0 was generated by using a connectivity array of dimension N×N×Ntime×Nband for each subject. For each band and each time point the corresponding N×N slice of this array represents a connectivity matrix. See section 4.3 in Supplement 1 for additional details.
Graph analysis of the full network
The graph analysis [42, 43] was based on the group networks in cortical (source) space (Figure 0). The graph density was kept constant at 10% by choosing a threshold such that the number of edges was 1/10 th of the possible number of edges (connections) between the N nodes defined by the Freesurfer template. The analysis was repeated for cost values of 5% and 20% [see (44) and section 5.4 in Supplement 1].
The graph theoretic metrics we used are defined in detail in section 5.2 in Supplement 1.
Graph analysis of sub-networks
We subdivided the network by anatomical regions: frontal (F), parietal (P), temporal (T), occipital (O), cingulate (C), and insula (I) (Table S2 in Supplement 1). A subset of the graph metrics described above were then applied to the individual sub-networks that can be formed from all possible pairs of anatomical regions, such as F:F, F:P, P:O, etc. Note that the results are independent of the ordering of the pairs.
Statistical analysis and correlations with age and ADOS
We used nested bootstrapping with 256 bootstrap realizations to assess statistical significance in Figures 2–5. The p-values were calculated using these bootstrap results, and further corrected for multiple comparisons across independent measurements. For Figures 1,2,4, which consist of group comparisons (Figures 1,2) or within group calculations (Figure 4), the p-values were multiplied by 5, to account for 5 independent measurements across different frequency bands. For Figure 3, the p-values were multiplied by 10, to further account for the independent measurements for the two group. The results were then further validated by repeating the analysis of Figure 1 on surrogate data, where subjects were given arbitrary group assignments. As expected, no group difference was observed (SI Figure S4).
Figure 2.

Network properties in the five frequency bands. The cost was fixed at 10% across groups. Error bars denote standard error. Corrected p-values are denoted by symbols * p < .05, ** p < .01, *** p < .001
Figure 5.


Sub-network costs, measured in terms of weighted graph density, as function of mean ADOS scores. Only frequency bands that showed significant group differences are plotted. X-axis denotes the mean total ADOS score. Y-axis denotes weighted graph density. The data points are shown as a 2D histogram, where each point corresponds to one realization of the bootstrap procedure (256 realization total). The solid lines are linear-regression results of weighted graph density vs age. Dotted lines show the 99% percentile. Star symbols denote corrected p-values (** p < 0.01) and R is the explained variance (only shown for R > 0.35).
Figure 1.

Sensor (top) and cortical space (bottom) networks in each of the five frequency bands. Average networks for the TD group (TD). Average network for the ASD group (ASD). Networks stronger in the TD group than the ASD group (TD > ASD). Networks stronger in the ASD group than in the TD group (ASD > TD). Only edges which were significant at an FDR corrected p-value of 0.1 are plotted.
Figure 4.
Sub-network costs, measured in terms of weighted graph density, as function of mean age. Only frequency bands that showed significant group differences were plotted. X-axis denotes the mean age. Y-axis denotes weighted graph density. The data points are shown as a 2D histogram, where each point corresponds to one realization of the bootstrap procedure (256 realization total). The solid lines are linear-regression results of weighted graph density vs age; dotted lines show the 99% percentile. Star symbols denote corrected p-values (** p < 0.01) and R is the explained variance (only shown for R > 0.35).
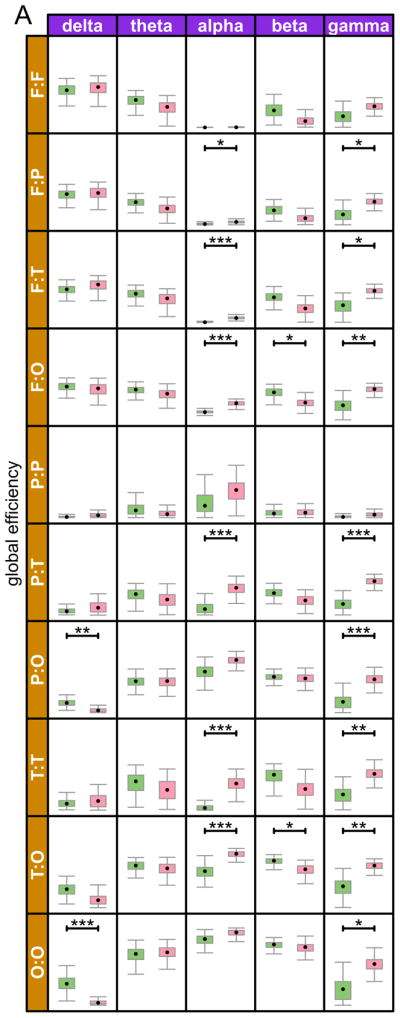
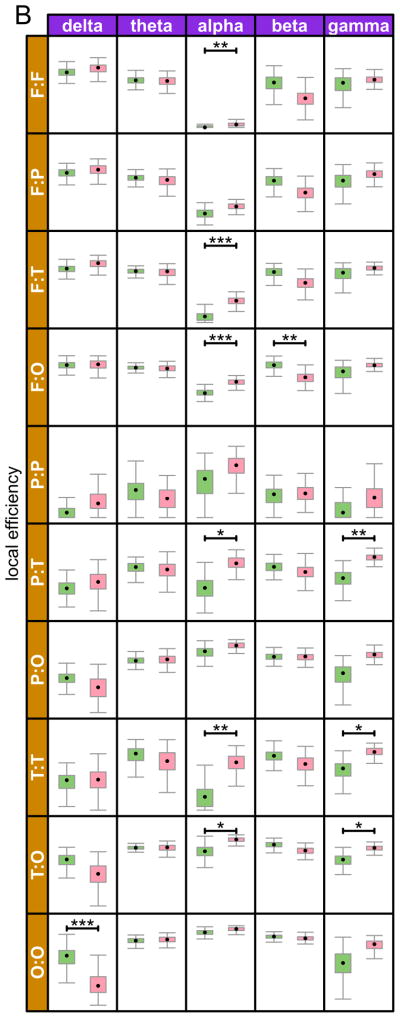
Figure 3.

Sub-network global and local efficiencies in each of the five different frequency bands. Pairwise sub-networks are defined by the nodes in either of the paired regions and all of the edges between them. The regions are Frontal, Parietal, Temporal, Occipital, and Cingulate. Corrected p-values are denoted by symbols * p < .05, ** p < .01, *** p < .001
For the within-group analysis of age and ADOS dependence on network connectivity, our metric of choice was weighted graph density ρw (also called weighted cost and sometimes interchangeably used with the phrase connectivity strength; see [45]), since it is the most general, robust, and direct connectivity measure which retains the maximum amount of information (after thresholding), providing increased sensitivity to our within-group analysis. However, it should be noted that ρw is a pure connectivity measure and thus less sensitive to graph topology.
For each of the 256 bootstrap realizations per group, we calculated the average ρw and age, and subsequently visualized the value pairs as a two-dimensional histogram. We fitted a linear-regression of log(ρw) versus age and calculated the ratio R of explained variance. The procedure was identical for the analysis of dependence on ADOS autism severity scores (see also section 5.5 in Supplement 1).
Results
Resting state connectivity matrix
We first examined connectivity within each of the five frequency bands, for each group, using the data as measured at the MEG sensors (sensor space).
Group differences were band specific and particularly clear in the higher frequency bands (Figure 0A). In γ, connectivity was stronger in the ASD group, whereas in β the TD group showed stronger connectivity overall, particularly in the frontal, temporal, and medial (cingulate) regions. The α band showed strong intra-posterior connectivity in both groups, but significantly more in the ASD group. In particular, the ASD group showed many more connections from the occipital areas to the parietal, temporal, and frontal regions.
We then mapped the data from the sensors onto the cortex, and repeated the same analysis in cortical space (Figure 0B). The network patterns were overall consistent but clearer in the source space analysis than in the sensor space analysis, thus further validating this already well-validated approach of mapping MEG data onto cortical space [46, 47, 48, 49, 50, 38, 33].
To quantify the group differences observed in Figure 0B, we focused on graph theoretic metrics, outlined and explained in Table 1. Several group differences emerged, indicating multiple abnormalities in the ASD group.
Table 1.
Summary of graph metrics
| Measure | Definition | Informs about |
|---|---|---|
| Shortest path length | ℓ Equation S3 | mean topological path length between all network nodes |
| Global efficiency | Eglob; Equation S6 | global integration across network |
| Clustering | C; Equation S5 | local clustering around nodes across network |
| Local efficiency | Eloc; Equation S7 | local segregation across network |
| Mean anatomical distance | SI 5.3 | mean cartesian distance of all edges in anatomical space |
| % within- module edges | SI 5.3 | modularity, fraction of “within module” versus “between module” edges |
The mean shortest path length was significantly reduced in the ASD group in the γ band only (Figure 1A). The global efficiency measure showed more efficient network in the γ and α bands, and a less efficient network in the β band in the ASD group (Figure 1B). For clustering, significant group differences emerged only in the γ band, where the ASD group showed increased clustering (Figure 1C). Local efficiency was significantly higher in the ASD group in the α band, and significantly lower in the β band (Figure 1D).
For our anatomical measures, the mean anatomical distance between nodes was increased in ASD in the α and γ bands, and reduced in the β band (Figure 1E). Modularity (the percentage of within module edges) in the α band was significantly reduced in the ASD group (Figure 1F).
In summary, we found the strongest differences in network properties in the high frequency bands. In α and γ band the networks were more efficient, more integrated, and more distributed in the ASD group, while in the β band the network was less efficient, less clustered, less integrated, and less pervasive in ASD subjects.
Sub-network differences between groups
It is clear from Figure 0 that resting-state networks in different cortical regions are impacted differently in ASD. To take full advantage of the spatial resolution afforded us by mapping the MEG signal onto cortical space, we subdivided the network by anatomical regions: frontal, parietal, temporal, occipital, cingulate, and insula.
Our analysis of sub-network differences focused on two of our graph-theoretic measures: global efficiency and local efficiency. We chose these two measures for three reasons. First, these measures are more robust and stable with respect to the addition or removal of individual edges than shortest path length and clustering. Second, they are meaningful when referring to a smaller anatomical region where anatomical measures such as mean distance are artificially restricted. Lastly, these two measures showed the greatest group differences in the full network analysis, probably due to their relative robustness. Roughly speaking, for the smaller sub-networks too, global efficiency measures the degree to which these anatomically confined short- and medium-range networks are integrated, while local efficiency measures the extent to which they are segregated.
We computed global and local efficiency within each of our anatomically defined regions and pairwise between all region pairs (Figure 2). The majority of group differences for both metrics were in the γ band, followed by the β and α bands. Fewest differences were observed in the δ band, and none at all in the θ band. In the δ band, the differences were anatomically confined to the occipital region (within occipital, and between occipital and other regions), with reduced efficiency (both local and global) in the ASD group. In the α band, both local and global efficiencies were increased in the ASD group, within and across several different anatomical regions. In the γ band, as in the α band, multiple within and across regions networks again showed increased efficiency, both local and global, in the ASD group, with the exception of local efficiency in networks involving the frontal regions, where no group differences were found. Lastly, while there were fewer group differences in the beta band, when such differences did emerge the results were complimentary to those of the alpha and gamma bands, showing reduced global and local efficiency in the ASD group. The only network in which no group differences were observed for either metric, in any frequency band, was confined to the parietal region.
Sub-network topology changes with age
The age range of the participants was from 6 to 21 years, which allowed us to study the impact of age on RSNs. We used weighted graph density (ρw; [see also (45) and Equation S2 in Supplement 1] as our metric, since it reflects the connectivity of the network most generally and directly. We found a very consistent trend in the data. All networks that involved the frontal region, i.e. the within frontal networks as well networks from frontal to other regions, showed a clear trend of decreasing ρw with age in the β, θ, and δ bands in the TD group. No such trend was observed in the ASD group, where ρw remained consistently lower and constant with age (Figure 3).
Sub-network topology correlates with ADOS score
Finally, we investigated whether ρw also correlated with the severity of ASD symptoms as measured behaviorally using the ADOS. We found such correlations in several of the subnetworks (Figure 4), all in the γ and β bands, where the greatest differences in ρw were observed. Consistent with the data shown in Figure 2, ρw in the γ band was positively correlated with ADOS scores, while ρw in the β band was negatively correlated with ADOS scores.
Discussion
Our findings suggest a highly complex picture of functional connectivity abnormalities in ASD. In the α and γ band the networks were more integrated, more efficient, and more distributed in the ASD group, while in the β band the networks were more globally integrated, more locally efficient, and more clustered in the TD group (see Table 2).
Table 2.
Summary of changes in ASD group relative to TD group in all bands.
| Properties | Location | Age | ADOS | ||
|---|---|---|---|---|---|
| δ | integration | ↓ | occipital | ✓(−) | X |
| segregation | ↓ | frontal | |||
| θ | X | X | ✓(−) | X | |
| frontal | |||||
| α | integration | ↑ | widespread | X | X |
| segregation | ↑ | ||||
| β | integration | ↓ | frontal & occipital | ✓ (−) | ✓ (↓) |
| segregation | ↓ | frontal | |||
| γ | integration | ↑ | widespread | X | ✓ (↑) |
| segregation | ↑ | temporal & parietal |
The overall increase of connectivity in α band seen in our study aligns well with the increase of α power during resting state in ASD previously reported by [51]. Also consistent, task-based studies of γ band abnormalities in ASD [52, 53] show a diverse picture of both increased [54] and decreased [55] γ power. At least one task based study [56] and one resting-state study [57] also found an increase of functional connectivity in the ASD group in some areas.
Recently, [27] analyzed band specific connectivity differences between TD and ASD in sensor space, using synchronization likelihood (SL) as a metric of functional connectivity. The focus of their study was on measures of complexity and the only graph metric they calculated was cumulative nodal strength. Despite these methodological differences, their finding of increased connectivity in the ASD group in δ and α bands is in striking agreement with our results.
The patterns we observed in the β band abnormalities were consistently in the opposite direction to those observed in other frequency bands. One possible interpretation of this finding is an imbalance in ASD between bottom-up and top-down processing. Studies of attention have shown that the β band is of particular importance for top-down feedback processing (58,59), while bottom-up feedforward processing is thought to be mainly mediated in γ band [60, 61], and subject to selective suppression controlled by α band oscillations [62]. This interplay between feedforward processing in γ band and feedback processing in β band dynamically controls the focus of attention [58].
In the workspace model [63], modular feedforward processors working in parallel independent networks are dynamically bound into one serial central network through higher level feedback processes. In this context, our results are consistent with ASD being associated with increased activity in modular feedforward processors, mediated via the γ band, concomitant with reduced binding of these modules into a central network [64, 65, 66], which is mediated by feedback processes in the β band [67, 68].
Results in the anatomically defined sub-networks were similar to those in the whole cortex with respect to frequency band analyses, but the increased spatial specificity allowed us to identify the regions and region pairs that made the greatest contributions to the differences in graph topology. In the γ band, we found increased global network efficiency in the ASD group across almost all regions and region pairs. We also found increased local efficiency (and thus clustering) in all sub-networks, except those networks that involve the frontal regions. Again, the picture was almost exactly reversed in the β band, where connectivity within and with frontal regions was associated with reduced global efficiency and reduced local efficiency in the ASD group. Unlike in the full network analysis, we found reduced global efficiency in the δ band in most subnetworks that included the occipital region, with reduced local efficiency in two of those local networks.
These findings are consistent with the interpretation proposed at the whole network level. Namely, we saw enhanced modular and feedforward processing mediated by the γ band in ASD, and reduced cognitive binding and feedback processing mediated by the β band. Furthermore, we saw far greater reliance on frontal processes in the TD group than the ASD group, again supporting the hypothesis that feedback processes are reduced in ASD while feedforward processes are enhanced in ASD.
In agreement with two recent fMRI studies [16, 15], we found reduced maturation of RSNs in ASD. Specifically, in the TD group we found decreasing connectivity strength with age in the β, θ, and δ bands in networks that involved the frontal region, i.e. both the within-frontal network and networks between the frontal and other regions. No such trend was observed in the ASD group, where connectivity remained consistently lower and constant with age.
These findings might be interpreted as a “fine tuning” of the cognitive networks in healthy controls, such that with age smaller populations of neurons need to be recruited for long-range information integration [69]. Whereas in typical subjects the networks involving frontal regions start out strongly connected but evolve towards a less, and presumably more specifically, connected configuration, in the ASD group these same networks are only weakly connected to begin with and do not show any further development. This interpretation is consistent with the maturation track of the frontal lobe [70, 71], and associated abnormalities in ASD [72, 73, 74, 75].
The spectral components of our findings were perhaps less predictable. Group differences in developmental trajectory were observed only in the β, θ, and δ bands, and no age-related differences in the γ band. One possible interpretation may be that the γ-mediated feedforward processes are less adversely affected in ASD, while the β-mediated feedback processes are more adversely affected in ASD. We also documented age-related group differences in the δ and θ bands in sub-networks that included the frontal lobe. This was surprising because these same sub-networks showed no global group differences in either the θ or δ bands. This finding suggests that group differences in these bands and cortical regions are likely more subtle and likely become more pronounced with age. When a large age range is averaged, therefore, the signal is not strong enough to pick up on these group differences.
More generally, frequency band based developmental analysis is further complicated by developmental trajectories of the different frequency bands, that themselves mature with unique trajectories across bands and across different individuals. This issue becomes more prominent over wider age ranges, and of course with smaller group sizes. Thus, while the effects we observed as significant were robust, it is highly likely that we missed other, more subtle effects, that would require a more refined age based analysis, and much larger group sizes to detect. Another limitation of this work is that the group sizes are relatively small. However, in particular with respect to the developmental results, we believe that the fact that our results are in agreement with prior findings from fMRI studies [16, 15], both of which used similar age groups (6–17 and 10–18 respectively), and had larger group sizes, strongly support our conclusions.
Lastly, we found that local network properties correlated with ASD severity, following the same trends as seen between TD and ASD subjects. In the γ band, the highest connectivity within the ASD group was found in those individuals with the highest severity as measured by the ADOS score. Conversely, in the β band the most strongly connected networks were found in individuals on the least severe end of the spectrum. These results provide additional evidence that the network differences we documented are indeed specific to ASD. The implication for cognitive processing is that ASD individuals who are more affected by the condition behaviorally have a greater increase of feedforward processing and decrease of feedback processing, which is consistent with the notion that reduced cognitive binding is a correlate of ASD severity.
Conclusions
In summary, we found that abnormalities associated with RSNs in ASD varied with cortical location, and that the nature of the abnormality (e.g., increased or decreased efficiency), if one existed, was consistent within each frequency band. Furthermore, sub-networks that included the frontal cortex were more likely to be abnormal and to develop abnormally in ASD.
Taken in combination, our findings suggest that network abnormalities in ASD are widespread, are more likely in sub-networks that include the frontal lobe, and can be opposite in nature depending on the frequency band. We found increased efficiency when we considered connectivity in the γ band, which likely mediates bottom-up processes and modular processing, and decreased efficiency in the β band, which likely mediates top-down processes and binding. These findings thus elucidate seemingly contradictory prior findings of both over- and under- connectivity in ASD.
Supplementary Material
Acknowledgments
We gratefully acknowledge the financial support from the Nancy Lurie Marks Foundation without which this work would not have been possible.
Footnotes
Financial Disclosures
Authors received research funding from the following organisations and funding bodies:
The Nancy Lurie Marks Family Foundation (TK, MGK), Autism Speaks (TK), The National Center for Research Resources (P41RR14075, MSH), National Institute for Biomedical Imaging and Bioengineering (5R01EB009048, MSH), and the Cognitive Rhythms Collaborative: A Discovery Network (NFS 1042134, MSH)
The authors report no biomedical financial interests or other potential conflicts of interest.
Publisher's Disclaimer: This is a PDF file of an unedited manuscript that has been accepted for publication. As a service to our customers we are providing this early version of the manuscript. The manuscript will undergo copyediting, typesetting, and review of the resulting proof before it is published in its final citable form. Please note that during the production process errors may be discovered which could affect the content, and all legal disclaimers that apply to the journal pertain.
References
- 1.Wass S. Distortions and disconnections: disrupted brain connectivity in autism. Brain and cognition. 2011;75:18–28. doi: 10.1016/j.bandc.2010.10.005. [DOI] [PubMed] [Google Scholar]
- 2.Müller R, Shih P, Keehn B, Deyoe JR, Leyden KM, Shukla DK. Underconnected, but How? A Survey of Functional Connectivity MRI Studies in Autism Spectrum Disorders. Cerebral Cortex. 2011;21(10):2233–2243. doi: 10.1093/cercor/bhq296. [DOI] [PMC free article] [PubMed] [Google Scholar]
- 3.Vissers ME, Cohen MX, Geurts HM. Brain connectivity and high functioning autism: a promising path of research that needs refined models, methodological convergence, and stronger behavioral links. Neuroscience and biobehavioral reviews. 2012;36:604–25. doi: 10.1016/j.neubiorev.2011.09.003. [DOI] [PubMed] [Google Scholar]
- 4.Greicius MD, Menon V. Default-Mode Activity during a Passive Sensory Task: Uncoupled from Deactivation but Impacting Activation. Journal of Cognitive Neuroscience. 2004;16(9):1484–1492. doi: 10.1162/0898929042568532. [DOI] [PubMed] [Google Scholar]
- 5.Kim H. Dissociating the roles of the default-mode, dorsal, and ventral networks in episodic memory retrieval. NeuroImage. 2010;50(4):1648–1657. doi: 10.1016/j.neuroimage.2010.01.051. [DOI] [PubMed] [Google Scholar]
- 6.Kim H, Daselaar SM, Cabeza R. Overlapping brain activity between episodic memory encoding and retrieval: Roles of the task-positive and task-negative networks. NeuroImage. 2010;49(1):1045–1054. doi: 10.1016/j.neuroimage.2009.07.058. [DOI] [PMC free article] [PubMed] [Google Scholar]
- 7.Saxe R, Kanwisher N. People thinking about thinking people: The role of the temporo-parietal junction in “theory of mind”. NeuroImage. 2003;19(4):1835–1842. doi: 10.1016/s1053-8119(03)00230-1. [DOI] [PubMed] [Google Scholar]
- 8.Spreng RN, Grady CL. Patterns of Brain Activity Supporting Autobiographical Memory, Prospection, and Theory of Mind, and Their Relationship to the Default Mode Network. Journal of Cognitive Neuroscience. 2009;22(6):1112–1123. doi: 10.1162/jocn.2009.21282. [DOI] [PubMed] [Google Scholar]
- 9.Cherkassky VL, Kana RK, Keller TA, Just MA. Functional connectivity in a baseline resting-state network in autism. Neuroreport. 2006;17:1687–90. doi: 10.1097/01.wnr.0000239956.45448.4c. [DOI] [PubMed] [Google Scholar]
- 10.Kennedy DP, Courchesne E. Functional abnormalities of the default network during self- and other-reflection in autism. Social Cognitive and Affective Neuroscience. 2008;3(2):17–190. doi: 10.1093/scan/nsn011. [DOI] [PMC free article] [PubMed] [Google Scholar]
- 11.Weng SJ, Wiggins JL, Peltier SJ, Carrasco M, Risi S, Lord C, Monk CS. Alterations of resting state functional connectivity in the default network in adolescents with autism spectrum disorders. Brain Res. 2010;1313:202–14. doi: 10.1016/j.brainres.2009.11.057. [DOI] [PMC free article] [PubMed] [Google Scholar]
- 12.Monk CS, Peltier SJ, Wiggins JL, Weng S, Carrasco M, Risi S, Lord C. Abnormalities of intrinsic functional connectivity in autism spectrum disorders. Neuroimage. 2009;47:764–772. doi: 10.1016/j.neuroimage.2009.04.069. [DOI] [PMC free article] [PubMed] [Google Scholar]
- 13.Ebisch SJ, Gallese V, Willems RM, Mantini D, Groen WB, Romani GL, Buitelaar JK, Bekkering H. Altered intrinsic functional connectivity of anterior and posterior insula regions in high-functioning participants with autism spectrum disorder. Hum Brain Mapp. 2011;32:1013–28. doi: 10.1002/hbm.21085. [DOI] [PMC free article] [PubMed] [Google Scholar]
- 14.Tyszka JM, Kennedy DP, Paul LK, Adolphs R. Largely Typical Patterns of Resting-State Functional Connectivity in High-Functioning Adults with Autism. Cereb Cortex. doi: 10.1093/cercor/bht040. [DOI] [PMC free article] [PubMed] [Google Scholar]
- 15.Wiggins JL, Peltier SJ, Ashinoff S, Weng SJ, Carrasco M, Welsh RC, Lord C, Monk CS. Using a self-organizing map algorithm to detect age-related changes in functional connectivity during rest in autism spectrum disorders. Brain Res. 2011;1380:187–97. doi: 10.1016/j.brainres.2010.10.102. [DOI] [PMC free article] [PubMed] [Google Scholar]
- 16.Washington SD, Gordon EM, Brar J, Warburton S, Sawyer AT, Wolfe A, Mease-Ference ER, Girton L, Hailu A, Mbwana J, Gaillard WD, Kalbfleisch ML, Vanmeter JW. Dysmaturation of the default mode network in autism. Hum Brain Mapp. doi: 10.1002/hbm.22252. [DOI] [PMC free article] [PubMed] [Google Scholar]
- 17.Van Dijk KR, Sabuncu MR, Buckner RL. The influence of head motion on intrinsic functional connectivity MRI. NeuroImage. 2012;59(1):431–438. doi: 10.1016/j.neuroimage.2011.07.044. [DOI] [PMC free article] [PubMed] [Google Scholar]
- 18.Jones TB, Bandettini PA, Kenworthy L, Case LK, Milleville SC, Martin A, Birn RM. Sources of group differences in functional connectivity: An investigation applied to autism spectrum disorder. Neuroimage. 2010;49:401–414. doi: 10.1016/j.neuroimage.2009.07.051. [DOI] [PMC free article] [PubMed] [Google Scholar]
- 19.Nair A, Keown CL, Datko M, Shih P, Keehn B, Müller R. Impact of methodological variables on functional connectivity findings in autism spectrum disorders: FcMRI Methods in Autism. Human Brain Mapping. 2014 doi: 10.1002/hbm.22456. n/a–n/a. [DOI] [PMC free article] [PubMed] [Google Scholar]
- 20.Uhlhaas P, Singer W. Neural Synchrony in Brain Disorders: Relevance for Cognitive Dysfunctions and Pathophysiology. Neuron. 2006;52:155–168. doi: 10.1016/j.neuron.2006.09.020. [DOI] [PubMed] [Google Scholar]
- 21.Uhlhaas PJ, Roux F, Rodriguez E, Rotarska-Jagiela A, Singer W. Neural synchrony and the development of cortical networks. Trends in Cognitive Sciences. 2010;14(2):72–80. doi: 10.1016/j.tics.2009.12.002. [DOI] [PubMed] [Google Scholar]
- 22.Uhlhaas PJ, Singer W. Abnormal neural oscillations and synchrony in schizophrenia. Nat Rev Neurosci. 2010;11:100–13. doi: 10.1038/nrn2774. [DOI] [PubMed] [Google Scholar]
- 23.Murias M, Webb SJ, Greenson J, Dawson G. Resting State Cortical Connectivity Reflected in EEG Coherence in Individuals With Autism. Biological Psychiatry. 2007;62(3):270–273. doi: 10.1016/j.biopsych.2006.11.012. [DOI] [PMC free article] [PubMed] [Google Scholar]
- 24.Barttfeld P, Wicker B, Cukier S, Navarta S, Lew S, Sigman M. A big-world network in ASD: Dynamical connectivity analysis reflects a deficit in long-range connections and an excess of short-range connections. Neuropsychologia. 2011;49(2):254–263. doi: 10.1016/j.neuropsychologia.2010.11.024. [DOI] [PubMed] [Google Scholar]
- 25.Pollonini L, Patidar U, Situ N, Rezaie R, Papanicolaou AC, Zouridakis G. Functional connectivity networks in the autistic and healthy brain assessed using Granger causality. Conf Proc IEEE Eng Med Biol Soc. 2010;1:1730–3. doi: 10.1109/IEMBS.2010.5626702. [DOI] [PubMed] [Google Scholar]
- 26.Tsiaras V, Simos PG, Rezaie R, Sheth BR, Garyfallidis E, Castillo EM, Papanicolaou AC. Extracting biomarkers of autism from MEG resting-state functional connectivity networks. Computers in Biology and Medicine. doi: 10.1016/j.compbiomed.2011.04.004. In Press, Corrected Proof. [DOI] [PubMed] [Google Scholar]
- 27.Ghanbari Y, Bloy L, Edgar JC, Blaskey L, Verma R, Roberts TPL. Joint Analysis of Band-Specific Functional Connectivity and Signal Complexity in Autism. Journal of Autism and Developmental Disorders. 2013:1–17. doi: 10.1007/s10803-013-1915-7. [DOI] [PMC free article] [PubMed] [Google Scholar]
- 28.Peters JM, Taquet M, Vega C, Jeste SS, Fernandez IS, Tan J, Nelson CA, Sahin M, Warfield SK. Brain functional networks in syndromic and non-syndromic autism: a graph theoretical study of EEG connectivity. BMC Med. 2013;11:54. doi: 10.1186/1741-7015-11-54. [DOI] [PMC free article] [PubMed] [Google Scholar]
- 29.Kenet T, Orekhova EV, Bharadwaj H, Shetty NR, Israeli E, Lee AK, Agam Y, Elam M, Joseph RM, Hämäläinen MS, Manoach DS. Disconnectivity of the cortical ocular motor control network in autism spectrum disorders. NeuroImage. 2012;61(4):1226–1234. doi: 10.1016/j.neuroimage.2012.03.010. [DOI] [PMC free article] [PubMed] [Google Scholar]
- 30.Khan S, Gramfort A, Shetty NR, Kitzbichler MG, Ganesan S, Moran JM, Lee SM, Gabrieli JDE, Tager-Flusberg HB, Joseph RM, Herbert MR, Hämäläinen MS, Kenet T. Local and long-range functional connectivity is reduced in concert in autism spectrum disorders. Proceedings of the National Academy of Sciences. doi: 10.1073/pnas.1214533110. [DOI] [PMC free article] [PubMed] [Google Scholar]
- 31.Erdös P, Rényi A. On the strength of connectedness of a random graph. Acta Mathematica Hungarica. 1961;12:261–267. [Google Scholar]
- 32.Diestel R. Graph Theory {Graduate Texts in Mathematics; 173} Springer-Verlag Berlin and Heidelberg GmbH & Company KG; 2000. [Google Scholar]
- 33.Palva JM, Monto S, Kulashekhar S, Palva S. Neuronal synchrony reveals working memory networks and predicts individual memory capacity. Proceedings of the National Academy of Sciences of the United States of America. 2010;107:7580–5. doi: 10.1073/pnas.0913113107. [DOI] [PMC free article] [PubMed] [Google Scholar]
- 34.Taulu S, Kajola M, Simola J. Suppression of interference and artifacts by the Signal Space Separation Method. Brain topography. 2004;16:269–75. doi: 10.1023/b:brat.0000032864.93890.f9. [DOI] [PubMed] [Google Scholar]
- 35.Taulu S, Simola J. Spatiotemporal signal space separation method for rejecting nearby interference in MEG measurements. Physics in medicine and biology. 2006;51:1759–68. doi: 10.1088/0031-9155/51/7/008. [DOI] [PubMed] [Google Scholar]
- 36.Nolte G, Hamalainen MS. Partial signal space projection for artefact removal in MEG measurements: a theoretical analysis. Phys Med Biol. 2001;46:2873–87. 11. doi: 10.1088/0031-9155/46/11/308. [DOI] [PubMed] [Google Scholar]
- 37.Fischl B. FreeSurfer. NeuroImage. 2012;62(2):774–781. doi: 10.1016/j.neuroimage.2012.01.021. [DOI] [PMC free article] [PubMed] [Google Scholar]
- 38.Lin FH, Wald LL, Ahlfors SP, Hämäläinen MS, Kwong KK, Belliveau JW. Dynamic magnetic resonance inverse imaging of human brain function. Magn Reson Med. 2006;56:787–802. doi: 10.1002/mrm.20997. [DOI] [PubMed] [Google Scholar]
- 39.Hipp JF, Hawellek DJ, Corbetta M, Siegel M, Engel AK. Large-scale cortical correlation structure of spontaneous oscillatory activity. Nature Neuroscience. doi: 10.1038/nn.3101. [DOI] [PMC free article] [PubMed] [Google Scholar]
- 40.Schoffelen JM, Gross J. Source connectivity analysis with MEG and EEG. Hum Brain Mapp. doi: 10.1002/hbm.20745. [DOI] [PMC free article] [PubMed] [Google Scholar]
- 41.Palva S, Palva JM. Discovering oscillatory interaction networks with M/EEG: challenges and breakthroughs. Trends in Cognitive Sciences. doi: 10.1016/j.tics.2012.02.004. [DOI] [PubMed] [Google Scholar]
- 42.Watts DJ, Strogatz SH. Collective dynamics of “small-world” networks. Nature. 1998;393:440–442. doi: 10.1038/30918. [DOI] [PubMed] [Google Scholar]
- 43.Sporns O. Graph theory methods for the analysis of neural connectivity patterns. Neuroscience databases: A practical guide. 2002:171–186. [Google Scholar]
- 44.Ginestet CE, Nichols TE, Bullmore ET, Simmons A. Brain Network Analysis: Separating Cost from Topology using Cost-integration. :1104.3707. doi: 10.1371/journal.pone.0021570. [DOI] [PMC free article] [PubMed] [Google Scholar]
- 45.Ginestet CE, Fournel AP, Simmons A. Statistical Network Analysis for Functional MRI: Summary Networks and Group Comparisons. doi: 10.3389/fncom.2014.00051. arXiv:1308.2577 [q-bio, stat] [DOI] [PMC free article] [PubMed] [Google Scholar]
- 46.Hamalainen M, Sarvas J. Realistic conductivity geometry model of the human head for interpretation of neuromagnetic data. IEEE Transactions on Biomedical Engineering. 1989;36(2):165–171. doi: 10.1109/10.16463. [DOI] [PubMed] [Google Scholar]
- 47.Hämäläinen M, Hari R, Ilmoniemi RJ, Knuutila J, Lounasmaa OV. Magnetoencephalography—theory, instrumentation, and applications to noninvasive studies of the working human brain. Reviews of Modern Physics. 1993;65(2):413–497. [Google Scholar]
- 48.Dale AM, Sereno MI. Improved Localizadon of Cortical Activity by Combining EEG and MEG with MRI Cortical Surface Reconstruction: A Linear Approach. Journal of Cognitive Neuroscience. 1993;5(2):162–176. doi: 10.1162/jocn.1993.5.2.162. [DOI] [PubMed] [Google Scholar]
- 49.Fischl B, Sereno MI, Tootell RB, Dale AM. High-resolution intersubject averaging and a coordinate system for the cortical surface. Hum Brain Mapp. 1999;8:272–84. doi: 10.1002/(SICI)1097-0193(1999)8:4<272::AID-HBM10>3.0.CO;2-4. [DOI] [PMC free article] [PubMed] [Google Scholar]
- 50.Dale AM, Liu AK, Fischl BR, Buckner RL, Belliveau JW, Lewine JD, Halgren E. Dynamic Statistical Parametric Mapping: Combining fMRI and MEG for High-Resolution Imaging of Cortical Activity. Neuron. 2000;26(1):55–67. doi: 10.1016/s0896-6273(00)81138-1. [DOI] [PubMed] [Google Scholar]
- 51.Cornew L, Roberts T, Blaskey L, Edgar J. Resting-State Oscillatory Activity in Autism Spectrum Disorders. Journal of Autism and Developmental Disorders. 2011:1–11. doi: 10.1007/s10803-011-1431-6. [DOI] [PMC free article] [PubMed] [Google Scholar]
- 52.Brown C, Gruber T, Boucher J, Rippon G, Brock J. Gamma Abnormalities During Perception of Illusory Figures in Autism. Cortex. 2005;41(3):364–376. doi: 10.1016/s0010-9452(08)70273-9. [DOI] [PubMed] [Google Scholar]
- 53.Braeutigam S, Swithenby SJ, Bailey AJ. Contextual integration the unusual way: a magnetoencephalographic study of responses to semantic violation in individuals with autism spectrum disorders. The European journal of neuroscience. 2008;27:1026–36. doi: 10.1111/j.1460-9568.2008.06064.x. [DOI] [PubMed] [Google Scholar]
- 54.Orekhova EV, Stroganova TA, Nygren G, Tsetlin MM, Posikera IN, Gillberg C, Elam M. Excess of high frequency electroencephalogram oscillations in boys with autism. Biol Psychiatry. 2007;62:1022–9. 9. doi: 10.1016/j.biopsych.2006.12.029. [DOI] [PubMed] [Google Scholar]
- 55.Wilson TW, Rojas DC, Reite ML, Teale PD, Rogers SJ. Children and Adolescents with Autism Exhibit Reduced MEG Steady-State Gamma Responses. Biological Psychiatry. 2007;62(3):192–197. doi: 10.1016/j.biopsych.2006.07.002. [DOI] [PMC free article] [PubMed] [Google Scholar]
- 56.Perez Velazquez J, Barcelo F, Hung Y, Leshchenko Y, Nenadovic V, Belkas J, Raghavan V, Brian J, Garcia Dominguez L. Decreased brain coordinated activity in autism spectrum disorders during executive tasks: Reduced long-range synchronization in the fronto-parietal networks. International Journal of Psychophysiology. 2009;73(3):341–349. doi: 10.1016/j.ijpsycho.2009.05.009. [DOI] [PubMed] [Google Scholar]
- 57.Sheikhani A, Behnam H, Mohammadi MR, Noroozian M, Mohammadi M. Detection of Abnormalities for Diagnosing of Children with Autism Disorders Using of Quantitative Electroencephalography Analysis. Journal of Medical Systems. 2012;36(2):957–963. doi: 10.1007/s10916-010-9560-6. [DOI] [PubMed] [Google Scholar]
- 58.Buschman TJ, Miller EK. Top-Down Versus Bottom-Up Control of Attention in the Prefrontal and Posterior Parietal Cortices. Science. 2007;315(5820):1860–1862. doi: 10.1126/science.1138071. [DOI] [PubMed] [Google Scholar]
- 59.Miller EK, Buschman TJ. Cortical circuits for the control of attention. Current Opinion in Neurobiology. 2013;23(2):216–222. doi: 10.1016/j.conb.2012.11.011. [DOI] [PMC free article] [PubMed] [Google Scholar]
- 60.Buffalo EA, Fries P, Landman R, Buschman TJ, Desimone R. Laminar differences in gamma and alpha coherence in the ventral stream. Proceedings of the National Academy of Sciences. 2011;108(27):11262–11267. doi: 10.1073/pnas.1011284108. [DOI] [PMC free article] [PubMed] [Google Scholar]
- 61.Buzsaki G, Wang XJ. Mechanisms of Gamma Oscillations. Annual review of neuroscience. doi: 10.1146/annurev-neuro-062111-150444. [DOI] [PMC free article] [PubMed] [Google Scholar]
- 62.Buschman TJ, Denovellis EL, Diogo C, Bullock D, Miller EK. Synchronous Oscillatory Neural Ensembles for Rules in the Prefrontal Cortex. Neuron. 2012;76(4):838–846. doi: 10.1016/j.neuron.2012.09.029. [DOI] [PMC free article] [PubMed] [Google Scholar]
- 63.Dehaene S, Kerszberg M, Changeux JP. A neuronal model of a global workspace in effortful cognitive tasks. Proceedings of the National Academy of Sciences of the United States of America. 1998;95:14529–34. doi: 10.1073/pnas.95.24.14529. [DOI] [PMC free article] [PubMed] [Google Scholar]
- 64.Frith U. Autism: Explaining the enigma. Wiley Online Library; 1989. [Google Scholar]
- 65.Brock J, Brown CC, Boucher J, Rippon G. The temporal binding deficit hypothesis of autism. Dev Psychopathol. 2002;14:209–24. 2. doi: 10.1017/s0954579402002018. [DOI] [PubMed] [Google Scholar]
- 66.Foss-Feig JH, Kwakye LD, Cascio CJ, Burnette CP, Kadivar H, Stone WL, Wallace MT. An extended multisensory temporal binding window in autism spectrum disorders. Experimental brain research Experimentelle Hirnforschung Experimentation cerebrale. 2010;203:381–9. doi: 10.1007/s00221-010-2240-4. [DOI] [PMC free article] [PubMed] [Google Scholar]
- 67.Kopell N, Ermentrout GB, Whittington MA, Traub RD. Gamma rhythms and beta rhythms have different synchronization properties. Proc Natl Acad Sci (USA) 2000;97(4):1867. doi: 10.1073/pnas.97.4.1867. [DOI] [PMC free article] [PubMed] [Google Scholar]
- 68.Kitzbichler MG, Henson RNA, Smith ML, Nathan PJ, Bullmore ET. Cognitive Effort Drives Workspace Configuration of Human Brain Functional Networks. The Journal of Neuroscience. 2011;31(22):8259–8270. doi: 10.1523/JNEUROSCI.0440-11.2011. [DOI] [PMC free article] [PubMed] [Google Scholar]
- 69.Uddin LQ, Supekar K, Menon V. Typical and Atypical Development of Functional Human Brain Networks: Insights from Resting-State fMRI. Frontiers in Systems Neuroscience. 4 doi: 10.3389/fnsys.2010.00021. [DOI] [PMC free article] [PubMed] [Google Scholar]
- 70.Sowell ER, Thompson PM, Holmes CJ, Jernigan TL, Toga AW. In vivo evidence for post-adolescent brain maturation in frontal and striatal regions. Nat Neurosci. 1999;2:859–861. 10. doi: 10.1038/13154. [DOI] [PubMed] [Google Scholar]
- 71.Sowell ER, Delis D, Stiles J, Jernigan TL. Improved memory functioning and frontal lobe maturation between childhood and adolescence: a structural MRI study. J Int Neuropsychol Soc. 2001;7:312–22. doi: 10.1017/s135561770173305x. [DOI] [PubMed] [Google Scholar]
- 72.Mundy P. Annotation: the neural basis of social impairments in autism: the role of the dorsal medial-frontal cortex and anterior cingulate system. J Child Psychol Psychiatry. 2003;44:793–809. doi: 10.1111/1469-7610.00165. [DOI] [PubMed] [Google Scholar]
- 73.Courchesne E, Redcay E, Morgan JT, Kennedy DP. Autism at the beginning: microstructural and growth abnormalities underlying the cognitive and behavioral phenotype of autism. Dev Psychopathol. 2005;17:577–97. 3. doi: 10.1017/S0954579405050285. [DOI] [PubMed] [Google Scholar]
- 74.Lee PS, Yerys BE, Della Rosa A, Foss-Feig J, Barnes KA, James JD, VanMeter J, Vaidya CJ, Gaillard WD, Kenworthy LE. Functional connectivity of the inferior frontal cortex changes with age in children with autism spectrum disorders: a fcMRI study of response inhibition. Cereb Cortex. 2009;19:1787–94. doi: 10.1093/cercor/bhn209. [DOI] [PMC free article] [PubMed] [Google Scholar]
- 75.Koshino H, Kana RK, Keller TA, Cherkassky VL, Minshew NJ, Just MA. fMRI investigation of working memory for faces in autism: visual coding and underconnectivity with frontal areas. Cereb Cortex. 2008;18:289–300. doi: 10.1093/cercor/bhm054. [DOI] [PMC free article] [PubMed] [Google Scholar]
Associated Data
This section collects any data citations, data availability statements, or supplementary materials included in this article.