

Abstract
Phylostratigraphy is a method for dating the evolutionary emergence of a gene or gene family by identifying its homologs across the tree of life, typically by using BLAST searches. Applying this method to all genes in a species, or genomic phylostratigraphy, allows investigation of genome-wide patterns in new gene origination at different evolutionary times and thus has been extensively used. However, gene age estimation depends on the challenging task of detecting distant homologs via sequence similarity, which is expected to have differential accuracies for different genes. Here, we evaluate the accuracy of phylostratigraphy by realistic computer simulation with parameters estimated from genomic data, and investigate the impact of its error on findings of genome evolution. We show that 1) phylostratigraphy substantially underestimates gene age for a considerable fraction of genes, 2) the error is especially serious when the protein evolves rapidly, is short, and/or its most conserved block of sites is small, and 3) these errors create spurious nonuniform distributions of various gene properties among age groups, many of which cannot be predicted a priori. Given the high likelihood that conclusions about gene age are faulty, we advocate the use of realistic simulation to determine if observations from phylostratigraphy are explainable, at least qualitatively, by a null model of biased measurement, and in all cases, critical evaluation of results.
Keywords: BLAST, gene age, phylogenetic dating
Introduction
The term phylostratigraphy was first introduced in 2007 to refer to a method of dating the emergence of genes and gene families (Domazet-Lošo et al. 2007). The method actually predates the term and has been used to approach a large number of questions. For example, phylostratigraphic analyses showed that, compared with relatively old genes, relatively young genes evolve faster (Albà and Castresana 2005), have lower expressions (Wolf et al. 2009; Cai and Petrov 2010), encode shorter proteins (Wolf et al. 2009), are subject to weaker purifying selection and stronger positive selection (Cai and Petrov 2010), are less likely to be associated with human disease (Domazet-Lošo and Tautz 2008), are less frequently expressed during the phylotypic stage in animal embryonic development (Domazet-Lošo and Tautz 2010), and have different synonymous codon usage (Prat et al. 2009). The method has also been applied to investigate the modes of gene origination (Carvunis et al. 2012), the life cycle of genes (Abrusán 2013), and the evolution of developmental structures and cell types in a variety of taxa (Hemmrich et al. 2012; Sestak et al. 2013).
Each phylostratigraphic study has a focal species. The age of a gene from the focal species is defined by the time since the divergence between the focal species and its most distantly related taxon in which a homolog of the gene is found. This exercise requires a method for homolog detection, for which the most common tool by far is Basic Local Alignment Search Tool (BLAST) (Altschul et al. 1990) and its derivatives (blast.ncbi.nlm.nih.gov/Blast.cgi, last accessed October 15, 2014). We present below a highly simplified overview of the BLAST algorithm for reference (Camacho et al. 2009). BLAST is a heuristic algorithm for homolog detection that relies on both overall sequence similarity between a query and a database entry and multiple high-scoring matches. BLAST begins its homolog search by taking “words” of a user-defined length from the query sequence and searching for high-scoring matches to these words among the entries in the database. All database entries containing a user-defined (default = 3) number of high-scoring matches with individual words are further investigated by extending the alignment and using a dynamic programming algorithm to score the alignment. Missing a true homolog may result in gene age underestimation (if the most distant true homolog is missed) or a false conclusion that a particular lineage has lost a gene (if a homolog is not found in a species but found in a more distant species). Therefore, conclusions based on phylostratigraphic analysis critically rely on the correct identification of homologs by BLAST.
Importantly, BLAST error may vary nonrandomly among genes and create biased results. For instance, because detection of homologs is affected by sequence similarity and because sequence similarity is lost faster for rapidly evolving genes than for slowly evolving genes, the former are expected to have a higher BLAST error rate than the latter, which would create a spurious pattern of faster evolution of younger genes. This possibility was investigated by Elhaik et al. (Elhaik et al. 2006) using computer simulation. Specifically, they simulated DNA sequence evolution along an evolutionary tree and used BLAST to search for homologs that were generated in the simulation. False negative error rates as high as 100% were observed, with quickly evolving genes having larger errors and hence looking younger.
Elhaik et al.’s study, however, was criticized for two reasons (Albà and Castresana 2007). First, they simulated nucleotide sequence evolution, but amino acid sequences allow for more sensitive detection of distant homologs and are preferred in phylostratigraphy. Second, all sites in a sequence had the same evolutionary rate in the simulation, a major deviation from the general observation in real gene and protein sequences that the evolutionary rate varies among sites, often referred to as “among-site rate heterogeneity” (Zhang and Gu 1998). The rate heterogeneity is important in homolog detection, because BLAST relies on highly conserved words among homologs. Even very short conserved sequences (e.g., three letters) can greatly enhance BLAST’s performance. Because of these two major weaknesses, Elhaik et al.’s results were considered unreliable and a new simulation was conducted by Albà and Castresana (2007). These authors estimated the among-site rate heterogeneity of 14 proteins and simulated protein sequence evolution either with or without rate heterogeneity. They reported that gene age was underestimated by BLAST, but the fraction of genes affected is small when the sequences were simulated with rate heterogeneity. They concluded that BLAST error is not an important element in phylostratigraphic analysis. Although Albà and Castresana’s simulation is more realistic, it also has serious drawbacks. First, their simulation was based on only 14 real genes, which may not be representative. Second and more importantly, the rate heterogeneity patterns were derived from the multiple sequence alignments of either seven vertebrates with an approximately 450 My-old common ancestor or nine bilaterians with an approximately 980 My-old common ancestor. Thus, their study actually excluded those rapidly evolving genes whose vertebrate or bilaterian homologs are missed by BLAST. In other words, they studied a biased sample of relatively slowly evolving genes, which would lead to an underestimation of BLAST error.
Because of the widespread use of phylostratigraphy, understanding how BLAST error affects the reliability of phylostratigraphy will have important implications for a diverse array of evolutionary studies. Given the limitations of the previous researches on the subject, we undertake a genome-scale investigation. We simulate the evolution of protein sequences using parameters estimated from the alignments of 6,695 orthologous genes found in 12 Drosophila species. These species share a most recent common ancestor approximately 62 Ma (Tamura et al. 2004), allowing for the study of both slowly evolving genes and faster-evolving genes than were represented in Albà and Castresana (2007). We simulate evolution across a wide range of divergence times and hence can gauge gene age estimation error with a greater precision than previous studies. We report that BLAST error is abundant and may be responsible for many patterns of genome evolution previously identified in phylostratigraphic studies.
Results
Characterizing Gene Age Estimation Errors
We acquired from FlyBase (St Pierre et al. 2014) 6,695 orthologous protein alignments from 12 Drosophila species that diverged approximately 62 Ma (Tamura et al. 2004). For each protein, we used TreePuzzle (Schmidt et al. 2002) to classify all sites into 16 rate bins according to a discrete gamma model of among-site rate heterogeneity and estimated the relative rates of the 16 bins. We also inferred the mean absolute evolutionary rate across all sites of a protein by dividing the number of substitutions per site in the protein between Drosophila melanogaster and D. grimshawi by 2 × 62 My (Tamura et al. 2004). Using all of these parameters, we simulated the evolution of 6,695 proteins using ROSE (Stoye et al. 1998) along a tree with 11 taxa, representing species from fruit fly to bacteria (fig. 1A). The divergence times among these taxa were assumed to equal what TimeTree (Hedges et al. 2006) estimated (see Materials and Methods). Using the extant sequences generated from the simulation, we constructed protein databases and used BLASTP, a derivative of BLAST for searching protein homologs, to detect orthologs of the simulated fruit fly queries in the other ten extant taxa. Unless necessary for distinction, we simply refer to BLASTP as BLAST in this article. Because in the simulation all genes originated in the common ancestor of eukaryotes and bacteria, any inferred gene age other than that was considered an estimation error. Following Albà and Castresana (2007), we repeated this simulation ten times to examine the stochasticity of the obtained results. Unless otherwise noted, the averages from the ten simulations were presented.
Fig. 1.

BLAST error rates at different divergence times. (A) Phylogeny showing the relationship of simulated sequences in this study. Organism names are for reference only. Branch lengths are proportional to divergence times, the sources of which are detailed in Materials and Methods. INT1 and INT2 are not true taxa, but are equally spaced between plant and bacterial divergence to allow a smoother range of distances. (B) Fraction (f) of proteins from a taxon that are missed by BLAST increases nonlinearly with the time (t) since the divergence between the taxon and the query taxon (fruit fly). We found that the relationship between f and t is better described by a log-linear function than a linear function, with the Akaike information criterion (AIC) of the former 23.87 units smaller than the latter. Shown are the averages from ten simulations, with the error bars depicting the range from the ten simulations.
BLAST searches require specifying an E value cutoff to guard against false positives. Because it was suggested that the E value cutoff of 1E-3 be used in phylostratigraphy (Domazet-Lošo and Tautz 2003), we used this cutoff in our simulation unless otherwise mentioned. We found from our simulation that in 13.85% of cases a homolog was not detected in the most distant taxa (table 1). This indicates that age estimation error is a relatively common phenomenon. We also found that in 2.77% of cases no homolog was found in any taxon (table 1), indicating that age underestimation can be extreme.
Table 1.
False Negative Error Rates of BLAST at Various E Value Cutoffs.
| E value Cutoff | 1E-1 | 1E-2 | 1E-3 | 1E-4 | 1E-5 | 1E-6 | 1E-7 | 1E-8 | 1E-9 | 1E-10 |
|---|---|---|---|---|---|---|---|---|---|---|
| Fly homolog not found in bacteria | 12.78%a (0.11%)b | 13.33% (0.11%) | 13.85% (0.14%) | 14.32% (0.18%) | 14.78% (0.18%) | 15.22% (0.15%) | 15.67% (0.17%) | 16.10% (0.17%) | 16.53% (0.13%) | 16.96% (0.10%) |
| Fly homolog not found in any taxon | 2.18% (0.09%) | 2.48% (0.10%) | 2.77% (0.11%) | 3.05% (0.14%) | 3.32% (0.13%) | 3.58% (0.13%) | 3.85% (0.10%) | 4.11% (0.12%) | 4.34% (0.10%) | 4.62% (0.11%) |
| Bacterial homolog not found in any taxon | 10.85% (0.12%) | 11.47% (0.09%) | 12.03% (0.12%) | 12.46% (0.11%) | 12.88% (0.08%) | 13.28% (0.09%) | 13.73% (0.12%) | 14.12% (0.10%) | 14.51% (0.11%) | 14.87% (0.12%) |
aMean error rate over ten simulations.
bStandard deviation of the error rate among ten simulations.
To examine the frequency of gene age underestimation under different E value cutoffs, we tried cutoffs from 1E-1 to 1E-10. Because we are examining false negative errors, the error rate should increase as the E value cutoff becomes smaller. This is indeed the case, although the variation in error rate under different cutoffs is relatively small (table 1).
It might be justifiably argued that in real phylostratigraphy there can be numerous potential orthologs that correspond to a particular divergence time (e.g., many bacteria rather than one), which may improve age estimation. In order to examine the error rate under this scenario, we performed an additional database search using the simulated bacterial protein as the query and the simulated proteins for all other taxa as the database, providing ten representatives of the “most distant homolog.” We found that in 12.03% of cases, no homologs were found (under the E value cutoff of 1E-3). Thus, the use of multiple species for a given divergence has virtually no impact on the error rate.
Although it is expected that more distant homologs are more difficult to detect, the exact relationship between divergence time and mean detectability for a group of genes has not been examined. Using the simulated data, we plotted the fraction of fruit fly genes whose homologs are not detected in a taxon as a function of the time since the separation between that taxon and fruit fly (fig. 1B). Although the probability of missing a homolog by BLAST clearly increases with the divergence time, the relationship is decidedly nonlinear (F = 333.5, P = 7.1 × 10⁻⁷, Ramsey RESET test, [Ramsey 1969]). Rather, it can be approximated by a log-linear curve, with a faster increase in error rates for shorter divergence times and a slower increase for longer divergence times (fig. 1B).
Properties of Genes That Influence Its Age Underestimation
We sought to determine which properties of a gene influence its age underestimation by BLAST. Due to the way the BLAST algorithm works, two likely candidates are the rate of protein sequence evolution and the length of the protein. Indeed, we found highly significant correlations between the inferred gene age and both rate (Spearman’s ρ = −0.57, P < 2.2 × 10−308; fig. 2A) and protein length (ρ = 0.19, P < 1.1 × 10−53; fig. 2B). Both of these associations have been noted before in real phylostratigraphic studies (Wolf et al. 2009; Cai and Petrov 2010), but are replicated by our simulation where all genes are equally old. Hence, the trends previously observed in phylostratigraphic analyses may be entirely due to BLAST errors. We further reasoned that, because of the requirement for high-scoring matches of words in BLAST searches, longer stretches of conserved blocks would result in fewer BLAST errors. Indeed, we find the error rate to increase quickly as the maximum length of the stretch of the most conserved category of sites decreases, especially when the mean evolutionary rate is high (fig. 2C).
Fig. 2.

Gene age inference by BLAST is influenced by (A) protein evolutionary rate, (B) protein length, and (C) the maximum length of the block of the most conserved sites in the protein. Presented are the average results from ten simulations. In (A) and (B), each dot represents one fruit fly protein, whose age equals the average inferred age over ten simulations. In (C), each row and each column represents an equal number of genes. The number in each bin corresponds to the fraction of genes from ten simulations that fall into the bin. The color of each bin represents the average error rate in that bin, with the color scheme shown on the right of the figure. Error was considered when a gene was inferred to have originated after the separation between bacteria and eukaryotes. Max length is in the unit of amino acid, whereas evolutionary rate is in the unit of number of substitutions per site per My. As shown in the main text by partial correlations, each of the three factors has a significant contribution to BLAST error even when the other two are controlled.
To examine if the above three protein characteristics (mean evolutionary rate, protein length, and maximum length of the stretch of the most conserved category of sites) have independent contributions to gene age underestimation, we conducted a partial correlation between each of these characteristics and the inferred gene age, after controlling the other two characteristics. Significant partial correlations were found for evolutionary rate (ρ = −0.32, P < 1.3 × 10−171), protein length (ρ = 0.11, P < 5.5 × 10⁻¹⁹), and maximum length of the stretch of the most conserved category of sites (ρ = 0.21, P = 4.2 × 10−68), demonstrating that these factors have independent influences on gene age underestimation.
The above simulation assumed that a site has a constant evolutionary rate throughout the tree, which may not be true in reality because of potential evolutionary alterations in the functional constraint of the site due to either protein functional changes (Zhang 2006) or epistasis (Breen et al. 2012). To examine the level of gene age underestimation under this scenario, we simulated a covarion model of sequence evolution (Fitch 1971; Penny et al. 2001) along the tree in figure 1A. To implement this model, at certain evolutionary times, we randomly picked a subset of sites and shuffled their rate categories. This was done for a total of 1%, 2%, or 5% of sites every 50 My of evolution. As a negative control, 0% of sites were shuffled in rate categories. We then attempted to detect the bacterial homologs of fruit fly proteins. We found that the covarion evolution substantially increases the BLAST error rate. When 5% of sites are shuffled in their evolutionary rates per 50 My, more than 67% of bacterial homologs could not be detected, compared with 14% when no site is shuffled (table 2). Even a tiny amount of covarion evolution (1% per 50 My) increases the probability of gene age underestimation by more than a factor of 0.25 (table 2). Considering that functionally critical residues in a protein may be largely immune to covarion evolution, we conducted an additional simulation shuffling 0%, 1%, 2%, or 5% of sites every 50 My, but excluding the sites belonging to the lowest one or two rate categories from being picked for rate shuffling. Our result showed only a small increase in age estimation error by these constrained covarion models, compared with no rate shuffling (table 2). The reality is probably somewhere between the full convarion model and the constrained covarion models, although the fraction of sites subject to covarion evolution and the frequency of rate changes are currently unknown.
Table 2.
BLAST Error Rates under Covarion Evolutiona.
| Rates Shuffled per 50 My | All Rate Categories Shuffled (%) | Lowest Rate Category Cannot Be Shuffled (%) | Lowest Two Rate Categories Cannot Be Shuffled (%) |
|---|---|---|---|
| 0% of sites | 14.05 | 14.05 | 14.05 |
| 1% of sites | 17.81 | 14.97 | 14.51 |
| 2% of sites | 32.97 | 15.24 | 15.23 |
| 5% of sites | 67.08 | 16.60 | 16.52 |
aPresented are the mean fractions of fruit fly proteins whose bacterial homologs are not found, determined from ten simulations.
Gene Age Underestimation Generates Spurious Patterns of Genome Evolution
Because phylostratigraphy by homology detection underestimates gene age and because the probability and extent of the underestimation vary among genes, it is possible for phylostratigraphic errors to create spurious patterns of genome evolution. As demonstrated in our simulation, the observations that young genes evolve rapidly (Albà and Castresana 2005) or encode short proteins (Wolf et al. 2009) are explainable by gene age estimation error. Although one can predict a priori, based on how BLAST works, that these correlations are likely artifacts, whether many other phylostraigraphy-based discoveries are genuine or artifactual cannot be easily predicted. Below we chose three such phylostraigraphy-based discoveries and examined whether they could have resulted from gene age underestimations.
We first examined two genomic patterns reported in Domazet-Lošo et al. (2007), a paper of special importance to the phylostratigraphy field because the term phylostratigraphy was coined in this paper. Using D. melanogaster as the focal species, these authors reported a peak in the number of new gene originations per My in the common ancestor of bilateria, and a nonrandom age distribution of genes expressed in ectoderm, mesoderm, and endoderm during Drosophila development. Because these authors used a phylogeny that is different from the one used in our main simulation, we conducted another simulation using their tree (fig. 3A).
Fig. 3.
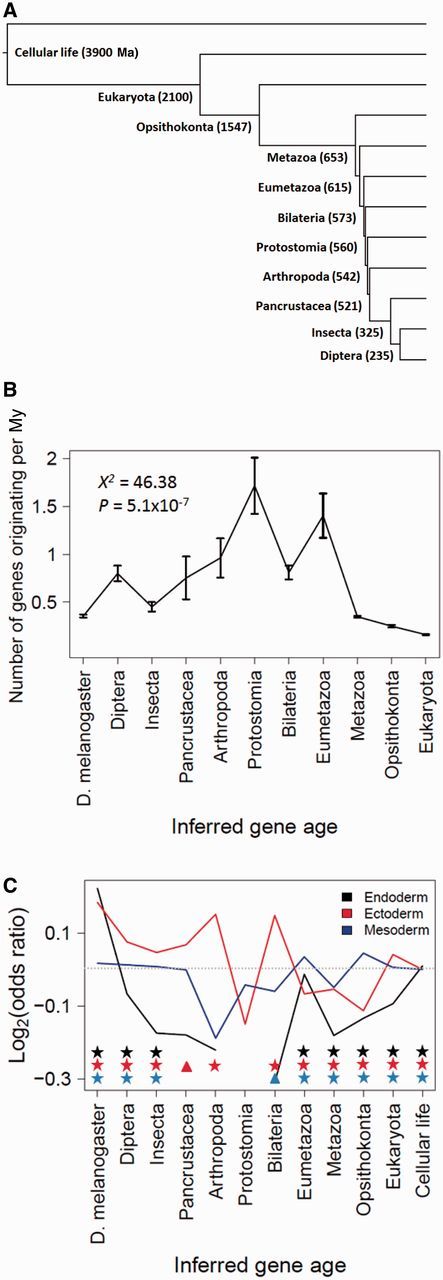
BLAST error mimics findings in Drosophila genomic phylostratigraphy. Shown are results from analysis of simulated data, in which all proteins originated in the common ancestor of cellular life. (A) Phylogeny along which protein evolution is simulated. Both the tree topology and node ages (shown in parentheses) are from Domazet-Lošo et al. (2007). (B) The inferred number of new gene originations per My determined by dividing the number of genes inferred to have originated in a tree branch by the time represented by the branch, averaged over ten simulations. Error bars represent standard deviations. The null hypothesis of equal numbers of gene originations per My across all strata was examined by a chi-squared test. (C) Over and underrepresentation of genes of certain ages at three expression sites during Drosophila embryonic development. Positive values of log (odds ratio) indicate overrepresentation, whereas negative values indicate underrepresentation. The dotted line indicates log (odds ratio) = 0. Protostomia did not have any new gene that is expressed in the endoderm, and thus produced an undefined log (odds ratio), which was not presented. Triangles denote a P value of < 0.025, whereas stars denote an associated P value of < 0.001. See Materials and Methods for calculation of log(odds ratio).
Although all genes were simulated to have originated in the common ancestor of all cellular life, 17% were inferred by phylostratigraphy to have originated more recently. More disturbingly, the inferred number of new gene originations per My is not uniform throughout evolution (X2 = 46.38, P = 5.1 × 10⁻⁷, chi-squared test), creating an intriguing pattern of rapid new gene origination at certain evolutionary times and slow new gene origination at other times (fig. 3B). Nevertheless, we did not observe in our simulation the peak of gene origination in the common ancestor of bilateria as reported by Domazet-Lošo et al. (2007). Inaccuracies in tree topology and divergence times may account for the disparity between our simulation result and what was discovered by Domazet-Lošo et al., given that the divergence times surrounding the ancestral node of the common ancestor of bilateria are relatively short (fig. 3A).
We also found statistically significant over and underrepresentations of genes from certain age groups that are expressed in ectoderm, mesoderm, and endoderm (hypergeometric two-tailed test with Bonferroni correction) (fig. 3C). Although the observed patterns do not perfectly match those reported by Domazet-Lošo et al. (2007), the observation of a nonuniform age distribution demonstrates that errors can produce “interesting” patterns that are purely artifactual and that the specific nonrandom pattern caused by phylostratigraphic error can be complex and hard to predict a priori. Additionally, we were unable to acquire the exact data set used in the original paper, so differences may be partially due to our use of a newer expression profile. Note that Domazet-Lošo et al. found greater overrepresentations of ectodermal genes among young genes than what our simulation showed, suggesting that it may be a real biological signal, but more studies would be required to confirm it.
All of the above simulations and analyses used D. melanogaster as the focal species. It would be important to examine if our findings apply to other species. To this end, we used simulation to examine a result from Domazet-Lošo and Tautz (2008). These authors reported that disease genes tend to be older, and found a remarkable dearth of disease genes in the youngest group of genes. We conducted a simulation according to the species relationships considered in their paper and constructed this tree using divergence time estimates from TimeTree (fig. 4). Using human as the focal species, we acquired orthologous proteins from OrthoMaM (Ranwez et al. 2007) using taxa diverged as much as 92 My from human. We inferred evolutionary rate and rate heterogeneity using TreePuzzle, evolved sequences using ROSE, and detected homologs using BLASTP. From the simulated data, we observed a positive correlation between the inferred age of a gene and its probability of being a disease gene (Spearman’s ρ = 0.623, P = 0.004; fig. 4). Because the true ages of all genes are the same in our simulation, our finding demonstrates that Domazet-Lošo and Tautz’s finding was at least partly an artifact of gene age estimation error.
Fig. 4.

BLAST error mimics the finding in human genomic phylostratigraphy that old genes are more likely than young genes to be disease genes. Shown are results from analysis of simulated data, in which all proteins originated in the common ancestor of eukaryotes and bacteria. The time (in My) since divergence between each taxon and human is from TimeTree and is shown in parentheses.
Discussion
Homology detection programs make a major common assumption. If two sequences are similar enough on some measure, they are homologs—they share a common ancestry. The researcher has freedom in deciding where the similarity cutoff should be. This does not imply the inverse assumption—that is, if sequences are not similar then they do not share a common ancestry. However, in phylostratigraphy this second assumption is made, because genes are grouped and analyzed based on their detected homologs. It is thus critical to understand the amount of type-II error (i.e., false negatives) in homology detection used for phylostratigraphic analyses.
We have systematically quantified the bias and effects of false negative errors of BLAST homolog detection on gene age estimation. Under our model of sequence evolution, BLAST results in frequent gene age underestimations, some of which are extreme. For four reasons, our results are likely to be conservative. First, our simulation used parameters estimated from proteins that can be detected from all 12 Drosophila genomes. There are proteins that cannot be detected from all 12 Drosophila genomes (Palmieri et al. 2014). Apart from the true gene loss or new gene origination, some of them may actually exist in all 12 genomes but are undetectable due to the limited power of homology detection. Not including such genes in our simulation reduces the apparent error rate of BLAST. Second, we estimated protein evolutionary rate per My by comparing two Drosophila species and assumed that this rate applies to other organisms including fungi and bacteria. Because mutation rate tends to be constant per cell division (Lynch 2010) and the average (germline) cell cycle tends to be shorter in smaller organisms, mutation rate per year is expected to be much higher in smaller organisms such as bacteria than in Drosophila. In other words, we underestimated the amount of BLAST error for a protein by assuming a constant evolutionary rate per My across the tree of life. Third, our main simulation assumed that the evolutionary rate of a site relative to the average of all sites in a protein is a constant. When this assumption is violated, BLAST error tends to increase, as shown in our simulation of the covarion evolution. Fourth, our simulation parameters were estimated from one-to-one orthologous proteins and the simulation considered neither gene duplication nor gene loss. In reality, gene duplication is quite common in genome evolution (Zhang 2003; Wolfe 2004) and it often results in a change in evolutionary rate associated with postduplication changes in gene function (Zhang et al. 1998; Pegueroles et al. 2013). This rate change will likely increase the BLAST error rate. Gene loss can further compromise gene age estimation if a gene loss occurs to the most distant taxa where the homolog would otherwise be detected. Taken together, it is most likely that the actual frequency of gene age underestimation by BLAST is greater than what is shown in this study.
There also exists the possibility of overestimation of gene age, especially in the context of horizontal gene transfer. Imagine a gene that originated recently in bacteria but was horizontally transferred to some eukaryotes. Phylostraigraphy could mistakenly date the gene to the common ancestor of eukaryotes and bacteria. In future research, it would be important to explore the impacts of increasingly accurate and complex models of sequence and genomic evolution mentioned above on gene age estimation.
By itself, the high error rate should encourage skepticism toward the statement that any gene is of a particular age. We find, however, that this error is associated with the mean evolutionary rate of the protein, protein length, and the maximum length of the most conserved stretch of sites. Thus, one may be able to temper this skepticism by further analyses (e.g., by controlling the confounding factors). However, additional research will be needed to determine if these qualities can be parsed away from the effects of true gene age.
We demonstrated in some cases that the gene age estimation error can result in statistically highly significant and biologically intriguing findings without any true biological meaning or, at the very least, with misinterpreted biological meaning. Some of these spurious patterns may be predicted a priori given our understanding of how BLAST works and the correlates of factors that most seriously impact the performance of BLAST. For instance, given that fast protein sequence evolution leads to gene age underestimation and that lowly expressed genes tend to evolve rapidly (Pal et al. 2001), one could predict that phylostratigraphic bias would create a positive correlation between gene expression level and age. Thus, the report that young genes tend to be lowly expressed (Wolf et al. 2009) may be entirely artifactual. Because gene expression level is correlated with codon usage bias, phylostratigraphic bias would also lead to the observation that genes with different ages have different codon usage (Prat et al. 2009). Similarly, because the evolutionary rate of a protein is negatively correlated with the strength of purifying selection and positively correlated with the strength of positive selection acting on the protein, the discovery that, compared with old genes, young genes are subject to weaker purifying selection and stronger positive selection (Cai and Petrov 2010) can be artifactual. However, not all patterns created by phylostratigraphic bias can be predicted a priori, such as the different age distributions of genes expressed in the ectoderm, mesoderm, and endoderm during Drosophila development. It is therefore crucial to consider phylostratigraphic error as the first possible cause of any nonrandom pattern observed in phylostratigraphic studies. Further, many phylostratigraphic studies did not start with clear hypotheses, but attempted to explain whatever patterns that were observed in such studies. The danger of offering post hoc explanations has been eloquently discussed in the context of gene ontology analysis (Pavlidis et al. 2012) and applies to phylostratigraphy.
Nevertheless, we do not imply that all phylostratigraphic results are artifacts. In fact, most of our simulations do not exactly recapitulate empirical findings, although one cannot exclude the possibility that the disparity is due to the use of inaccurate parameters (e.g., divergence times between taxa) and/or simplified models (e.g., constant evolutionary rate for a site) in the simulations. Some of the disparities are so large that it is highly probable that true biological signals exist. For instance, the age distribution of D. melanogaster genes in real phylostratigraphic analysis shows a peak for very young genes, but the corresponding distribution based on the simulated data does not have this peak (fig. 5). Because it is improbable for BLAST to miss the honeybee homolog of a Drosophila gene if the homolog truly exists, the most likely cause of the disparity is an unusually high rate of new gene origination in Drosophila after its separation from the honeybee. Furthermore, because the BLAST error rate increases with (real) gene age (fig. 1B), the overall error will be smaller than what is shown here if a large fraction of genes in a genome are younger than what was assumed in our simulation. But, due to the BLAST error, it is difficult to know the true gene age and hence difficult to assess the likelihood of this scenario.
Fig. 5.

Phylostratigraphy produces signals beyond what BLAST error can account for. Black bars represent the percentage of fruit fly genes inferred to be in each phylostratum based on the real phylostratigraphic analysis of Domazet-Lošo et al. (2007). Gray bars represent the percentage of fruit fly genes inferred to be in each phylostratum in our simulated phylostratigraphic analysis. The simulation is the same as in figure 3.
In order to analyze the effects of phylostratigraphic error on any particular data set, one must assess the probability that a given gene has been subject to BLAST error. This is most easily determined by a simulation of protein evolution, but simulation has its own limitations. For instance, it requires at least the knowledge of the protein’s rate of evolution and rate heterogeneity, typically inferred from the multiple sequence alignment of homologs. But this begs the question, as the purpose of BLAST is to identify these homologs. One could attempt to estimate rate heterogeneity of genes by using homologs detectable by BLAST, but this may produce biased estimates. Furthermore, due to the limited understanding of the evolutionary models of individual proteins, investigators tend to assume relatively simple models, which can result in biased parameter estimation and unreliable simulations (Zhang 1999). Additionally, in the case of true orphan genes, these homologs do not even exist in principle, independent of our ability to find them. More studies are needed to design methods that differentiate true biological signals from artifacts in phylostratigraphic analysis.
We must also note that we studied only false negative errors in homolog search. In real phylostratigraphic analysis, the only indicator for gene age classification is how far out a hit is found. This method does not and cannot differentiate between the hit of a true homolog and a false one. In our analysis, we were not able to assess the degree of false positive errors. This is because the starting point for our protein evolution included a number of paralogous proteins, for which we would expect to find BLAST hits. We did not bypass this problem by using random sequences, because these sequences might not represent real functional constraints and cannot represent convergent sequence evolution that may happen in nature (Zhang and Kumar 1997). We see this as an open problem in future research.
Our analysis focused on BLAST, because this is the method that has been used in the vast majority of phylostratigraphic studies. Future studies should explore whether other homolog detection methods such as HMMer (Finn et al. 2011) and PSI-BLAST (Altschul et al. 1997) perform better than BLAST for gene age estimation.
Materials and Methods
Simulation of Protein Sequence Evolution
We acquired 6,698 protein alignments among the 12 Drosophila species from FlyBase (ftp://ftp.flybase.net/genomes/12_species_analysis/clark_eisen/alignments/all_species.guide_tree.longest.translation.tar.gz, last accessed October 15, 2014). The 12 species are D. simulans, D. sechellia, D. melanogaster, D. yakuba, D. erecta, D. ananassae, D. pseudoobscura, D. persimilis, D. willistoni, D. mojavensis, D. virilis, and D. grimshawi. We also acquired 5,217 protein alignments among 12 mammalian species from OrthoMaM (Ranwez et al. 2007). The mammalian species were chosen such that there were 12 species and we retained at least 5,000 proteins which had a full alignment. This resulted in selecting species that diverged as much as 92 Ma. The species included are rhesus macaque (Macaca mulatta), treeshrew (Tupaia belangeri), orangutan (Pongo pygmaeus), galago (Otolemur garnettii), rat (Rattus norvegicus), squirrel (Ictidomys tridecemlineatus), marmoset (Callithrix jacchus), guinea pig (Cavia porcellus), rabbit (Oryctolagus cuniculus), gibbon (Nomascus leucogenys), human (Homo sapiens), and mouse (Mus musculus).
We estimated among-site rate heterogeneity, amino acid frequency, and D. melanogaster–D.grimshawi or human–mouse genetic distance (i.e., number of substitutions per site) for each protein using TreePuzzle (Schmidt et al. 2002). We used the JTT-f matrix (Jones et al. 1992) with the observed amino acid frequencies in the protein and a discrete gamma model with 16 rate categories for parameter estimation. Three alignments were excluded from the Drosophila data due to one or more species having only gaps or ambiguous characters for the entire alignment.
We used three evolutionary guide trees. The first tree (fig. 1A) was constructed according to the divergence times estimated in TimeTree (Hedges et al. 2006). For each species, we used the mean estimate of divergence time from D. melanogaster, with the following exceptions. Nematode and sponge average divergence times were swapped, because they had very wide margins on their estimates and the average divergence times would misplace them compared with the known phylogeny. INT1 and INT2 were entirely fictional, providing a smoother range of divergence times for a more informative analysis. The second guide tree (fig. 3A) was constructed according to the divergence times provided by Domazet-Lošo et al. (2007). The third guide tree (fig. 4) was constructed using TimeTree divergence time estimates for a phylogeny provided by Domazet-Lošo and Tautz (2008).
Once the above information was acquired, we simulated sequence evolution using ROSE (Stoye et al. 1998), which allows the evolutionary rate for each site to be specified by the user. Additionally, following Albà and Castresana (2007), we set an insertion and deletion (indel) threshold to 0.0001. For each branch in the simulation, the expected number of insertion attempts and the expected number of deletion attempts both equal the expected number of amino acid substitutions for that branch times 0.0001. A random location along the protein is chosen to place an indel. If the amino acid substitution rate at the random location is greater than the average substitution rate for the protein, the indel occurs; otherwise, the indel does not occur. A proposed indel length between 1 and 14 amino acids is decided based on a predetermined probability function. In our simulation, the probability was set at 0.1 for any length between 1 and 6 amino acids and 0.05 for any length between 7 and 14 amino acids. In the case of a deletion, only those sites with amino acid substitution rates higher than the average for the protein will be deleted, with the occurrence of a site with a lower-than-average rate truncating the deletion. In the case of an insertion, all new sites are set to have amino acid substitution rates equal to the average substitution rate of the protein. For each protein, we simulated its evolution using a JTT-f matrix with observed amino acid frequencies from the alignment. We calculated the mean evolutionary rate of a protein by the number of substitutions per site per My between D. melanogaster and D. grimshawi or between human and mouse. Based on TimeTree, the former pair of species diverged 62 Ma and the latter 92 Ma. The sequence provided as the start sequence for evolution was the D. melanogaster sequence or human sequence. The simulation of sequence evolution was performed ten times for each protein.
Covarion Model of Sequence Evolution
Under the covarion model, we simulated sequence evolution in 50 My chunks. After each 50 My iteration, we selected a subset of sites accounting for y = 0%, 1%, 2%, or 5% of the protein length, and shuffled their evolutionary rates. We then continued evolution along that lineage for another 50 My and repeated until the entire lineage had been evolved. In cases where we were required to evolve for x < 50 My, (xy/50)% of sites were shuffled in their evolutionary rates. We also ran simulations in which we excluded the most conserved one or two rate categories from being shuffled. In these constrained covarion models, at each 50 My iteration, we selected 0%, 1%, 2%, or 5% of sites such that no sites from the most conserved one or two rate categories were selected but the appropriate percentage of the full protein length was selected and shuffled. Evolution was continued according to this pattern until the entire lineage had been evolved.
BLASTP Detection of Homologs
We downloaded BLASTP (version 2.2.28+) from NCBI. For each run, we took the simulation-generated fruit fly (or human) database consisting of 6,695 (or 5,217) protein sequences and performed BLASTP searches against the simulation-generated sequence database from each of the other species for that run. We used an E value cutoff of 1E-3 unless otherwise mentioned. Results of true homologs found were stored. We then dated each gene to the common ancestor of the query species and all taxa in which true positive hits were found. This represented the “age” of the protein for that run.
Analysis of BLAST Results: Rate of New Gene Origination
We divided the average number of new gene originations in a tree branch over ten simulations by the evolutionary time represented by the branch. This is not identical to the method used by Domazet-Lošo et al. (2007), who corrected for paralogs. But, because our study did not involve gene duplication, we did not perform this correction.
Analysis of BLAST Results: Gene Expression during Fruit Fly Development
We acquired gene expression patterns via FlyBase (St Pierre et al. 2014) using the QuickSearch expression tool. We set stage to “embryonic” and tissue to ectoderm, mesoderm, or endoderm, and downloaded the gene list from each search. We then calculated, for each phylostratum, the mean number of genes expressed during development in each tissue, determined from ten simulations. We defined the odds ratio for each tissue for each phylostratum by
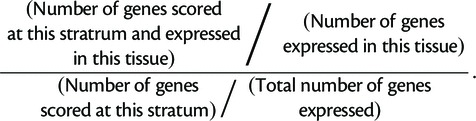 |
We tested for significance of enrichment via a two-tailed hypergeometric test (Kachitvichyanukul and Schmeiser 1985) with Bonferroni correction (Hommel 1988).
Analysis of BLAST Results: Human Disease Genes
We downloaded the MORBIDMap (Hamosh et al. 2005), and restricted the data to only those genes marked with “[3]” (mutation was positioned by mapping the wild-type gene and the mutation is associated with the disorder). We then determined which genes in each age group were disease genes and plotted the percentage of such genes against phylostratum. We further used Spearman’s rank correlation to determine if there was a significant correlation between the inferred age of a gene and its status as disease gene.
Acknowledgments
The authors thank Meg Bakewell for her pilot work on the subject, Jian-Rong Yang for technical assistance, members of the Zhang lab for discussion, and Wei-Chin Ho, Jian-Rong Yang, and three anonymous reviewers for valuable comments on the manuscript. This work was supported in part by the U.S. National Institutes of Health (NIH) research grant R01GM103232 to J.Z. B.A.M. was supported by the NIH training grant in genome sciences (T32HG000040).
References
- Abrusán G. Integration of new genes into cellular networks, and their structural maturation. Genetics. 2013;195:1407–1417. doi: 10.1534/genetics.113.152256. [DOI] [PMC free article] [PubMed] [Google Scholar]
- Albà MM, Castresana J. Inverse relationship between evolutionary rate and age of mammalian genes. Mol Biol Evol. 2005;22:598–606. doi: 10.1093/molbev/msi045. [DOI] [PubMed] [Google Scholar]
- Albà MM, Castresana J. On homology searches by protein Blast and the characterization of the age of genes. BMC Evol Biol. 2007;7:53. doi: 10.1186/1471-2148-7-53. [DOI] [PMC free article] [PubMed] [Google Scholar]
- Altschul SF, Gish W, Miller W, Myers EW, Lipman DJ. Basic local alignment search tool. J Mol Biol. 1990;215:403–410. doi: 10.1016/S0022-2836(05)80360-2. [DOI] [PubMed] [Google Scholar]
- Altschul SF, Madden TL, Schäffer AA, Zhang J, Zhang Z, Miller W, Lipman DJ. Gapped BLAST and PSI-BLAST: a new generation of protein database search programs. Nucleic Acids Res. 1997;25:3389–3402. doi: 10.1093/nar/25.17.3389. [DOI] [PMC free article] [PubMed] [Google Scholar]
- Breen MS, Kemena C, Vlasov PK, Notredame C, Kondrashov FA. Epistasis as the primary factor in molecular evolution. Nature. 2012;490:535–538. doi: 10.1038/nature11510. [DOI] [PubMed] [Google Scholar]
- Cai JJ, Petrov DA. Relaxed purifying selection and possibly high rate of adaptation in primate lineage-specific genes. Genome Biol Evol. 2010;2:393–409. doi: 10.1093/gbe/evq019. [DOI] [PMC free article] [PubMed] [Google Scholar]
- Camacho C, Coulouris G, Avagyan V, Ma N, Papadopoulos J, Bealer K, Madden TL. BLAST+ architecture and applications. BMC Bioinformatics. 2009;10:421. doi: 10.1186/1471-2105-10-421. [DOI] [PMC free article] [PubMed] [Google Scholar]
- Carvunis A-R, Rolland T, Wapinski I, Calderwood M, Yildirim M, Simonis N, Charloteaux B, Hidalgo C, Barbette A, Santhanam B, et al. Proto-genes and de novo gene birth. Nature. 2012;487:370–374. doi: 10.1038/nature11184. [DOI] [PMC free article] [PubMed] [Google Scholar]
- Domazet-Lošo T, Brajkovic J, Tautz D. A phylostratigraphy approach to uncover the genomic history of major adaptations in metazoan lineages. Trends Genet. 2007;23:531–533. doi: 10.1016/j.tig.2007.08.014. [DOI] [PubMed] [Google Scholar]
- Domazet-Lošo T, Tautz D. An evolutionary analysis of orphan genes in Drosophila. Genome Res. 2003;13:2213–2219. doi: 10.1101/gr.1311003. [DOI] [PMC free article] [PubMed] [Google Scholar]
- Domazet-Lošo T, Tautz D. An ancient evolutionary origin of genes associated with human genetic diseases. Mol Biol Evol. 2008;25:2699–2707. doi: 10.1093/molbev/msn214. [DOI] [PMC free article] [PubMed] [Google Scholar]
- Domazet-Lošo T, Tautz D. A phylogenetically based transcriptome age index mirrors ontogenetic divergence patterns. Nature. 2010;468:815–818. doi: 10.1038/nature09632. [DOI] [PubMed] [Google Scholar]
- Elhaik E, Sabath N, Graur D. The “inverse relationship between evolutionary rate and age of mammalian genes” is an artifact of increased genetic distance with rate of evolution and time of divergence. Mol Biol Evol. 2006;23:1–3. doi: 10.1093/molbev/msj006. [DOI] [PubMed] [Google Scholar]
- Finn RD, Clements J, Eddy SR. HMMER web server: interactive sequence similarity searching. Nucleic Acids Res. 2011;39:W29–37. doi: 10.1093/nar/gkr367. [DOI] [PMC free article] [PubMed] [Google Scholar]
- Fitch WM. Rate of change of concomitantly variable codons. J Mol Evol. 1971;1:84–96. doi: 10.1007/BF01659396. [DOI] [PubMed] [Google Scholar]
- Hamosh A, Scott AF, Amberger JS, Bocchini CA, McKusick VA. Online Mendelian Inheritance in Man (OMIM), a knowledgebase of human genes and genetic disorders. Nucleic Acids Res. 2005;33:D514–7. doi: 10.1093/nar/gki033. [DOI] [PMC free article] [PubMed] [Google Scholar]
- Hedges SB, Dudley J, Kumar S. TimeTree: a public knowledge-base of divergence times among organisms. Bioinformatics. 2006;22:2971–2972. doi: 10.1093/bioinformatics/btl505. [DOI] [PubMed] [Google Scholar]
- Hemmrich G, Khalturin K, Boehm A-M, Puchert M, Anton-Erxleben F, Wittlieb J, Klostermeier U, Rosenstiel P, Oberg H-H, Domazet-Lošo T, et al. Molecular signatures of the three stem cell lineages in hydra and the emergence of stem cell function at the base of multicellularity. Mol Biol Evol. 2012;29:3267–3280. doi: 10.1093/molbev/mss134. [DOI] [PubMed] [Google Scholar]
- Hommel G. A stagewise rejective multiple test procedure based on a modified Bonferroni test. Biometrika. 1988;75:383–386. [Google Scholar]
- Jones DT, Taylor WR, Thornton JM. The rapid generation of mutation data matrices from protein sequences. Bioinformatics. 1992;8:275–282. doi: 10.1093/bioinformatics/8.3.275. [DOI] [PubMed] [Google Scholar]
- Kachitvichyanukul V, Schmeiser B. Computer generation of hypergeometric random variates. J Stat Comput Simul. 1985;22:127–145. [Google Scholar]
- Lynch M. Evolution of the mutation rate. Trends Genet. 2010;26:345–352. doi: 10.1016/j.tig.2010.05.003. [DOI] [PMC free article] [PubMed] [Google Scholar]
- Pal C, Papp B, Hurst LD. Highly expressed genes in yeast evolve slowly. Genetics. 2001;158:927–931. doi: 10.1093/genetics/158.2.927. [DOI] [PMC free article] [PubMed] [Google Scholar]
- Palmieri N, Kosiol C, Schlötterer C. The life cycle of Drosophila orphan genes. Elife. 2014;3:e01311. doi: 10.7554/eLife.01311. [DOI] [PMC free article] [PubMed] [Google Scholar]
- Pavlidis P, Jensen JD, Stephan W, Stamatakis A. A critical assessment of storytelling: gene ontology categories and the importance of validating genomic scans. Mol Biol Evol. 2012;29:3237–3248. doi: 10.1093/molbev/mss136. [DOI] [PubMed] [Google Scholar]
- Pegueroles C, Laurie S, Albà MM. Accelerated evolution after gene duplication: a time-dependent process affecting just one copy. Mol Biol Evol. 2013;30:1830–1842. doi: 10.1093/molbev/mst083. [DOI] [PubMed] [Google Scholar]
- Penny D, McComish BJ, Charleston MA, Hendy MD. Mathematical elegance with biochemical realism: the covarion model of molecular evolution. J Mol Evol. 2001;53:711–723. doi: 10.1007/s002390010258. [DOI] [PubMed] [Google Scholar]
- Prat Y, Fromer M, Linial N, Linial M. Codon usage is associated with the evolutionary age of genes in metazoan genomes. BMC Evol. Biol. 2009;9:285. doi: 10.1186/1471-2148-9-285. [DOI] [PMC free article] [PubMed] [Google Scholar]
- Ramsey JB. Tests for specification errors in classical linear least-squares regression analysis. J R Stat Soc. 1969;31:350–371. [Google Scholar]
- Ranwez V, Delsuc F, Ranwez S, Belkhir K, Tilak M-K, Douzery EJ. OrthoMaM: a database of orthologous genomic markers for placental mammal phylogenetics. BMC Evol Biol. 2007;7:241. doi: 10.1186/1471-2148-7-241. [DOI] [PMC free article] [PubMed] [Google Scholar]
- Schmidt HA, Strimmer K, Vingron M, von Haeseler A. TREE-PUZZLE: maximum likelihood phylogenetic analysis using quartets and parallel computing. Bioinformatics. 2002;18:502–504. doi: 10.1093/bioinformatics/18.3.502. [DOI] [PubMed] [Google Scholar]
- Sestak MS, Božičević V, Bakarić R, Dunjko V, Domazet-Lošo T. Phylostratigraphic profiles reveal a deep evolutionary history of the vertebrate head sensory systems. Front Zool. 2013;10:18. doi: 10.1186/1742-9994-10-18. [DOI] [PMC free article] [PubMed] [Google Scholar]
- St Pierre SE, Ponting L, Stefancsik R, McQuilton P. FlyBase 102—advanced approaches to interrogating FlyBase. Nucleic Acids Res. 2014;42:D780–D788. doi: 10.1093/nar/gkt1092. [DOI] [PMC free article] [PubMed] [Google Scholar]
- Stoye J, Evers D, Meyer F. Rose : generating sequence families. Bioinformatics. 1998;14:157–163. doi: 10.1093/bioinformatics/14.2.157. [DOI] [PubMed] [Google Scholar]
- Tamura K, Subramanian S, Kumar S. Temporal patterns of fruit fly (Drosophila) evolution revealed by mutation clocks. Mol Biol Evol. 2004;21:36–44. doi: 10.1093/molbev/msg236. [DOI] [PubMed] [Google Scholar]
- Wolf YI, Novichkov PS, Karev GP, Koonin E V, Lipman DJ. The universal distribution of evolutionary rates of genes and distinct characteristics of eukaryotic genes of different apparent ages. Proc Natl Acad Sci U S A. 2009;106:7273–7280. doi: 10.1073/pnas.0901808106. [DOI] [PMC free article] [PubMed] [Google Scholar]
- Wolfe K. Evolutionary genomics: yeasts accelerate beyond BLAST. Curr Biol. 2004;14:R392–4. doi: 10.1016/j.cub.2004.05.015. [DOI] [PubMed] [Google Scholar]
- Zhang J. Performance of likelihood ratio tests of evolutionary hypotheses under inadequate substitution models. Mol Biol Evol. 1999;16:868–875. doi: 10.1093/oxfordjournals.molbev.a026171. [DOI] [PubMed] [Google Scholar]
- Zhang J. Evolution by gene duplication: an update. Trends Ecol Evol. 2003;18:292–298. [Google Scholar]
- Zhang J. Parallel adaptive origins of digestive RNases in Asian and African leaf monkeys. Nat Genet. 2006;38:819–823. doi: 10.1038/ng1812. [DOI] [PubMed] [Google Scholar]
- Zhang J, Gu X. Correlation between the substitution rate and rate variation among sites in protein evolution. Genetics. 1998;149:1615–1625. doi: 10.1093/genetics/149.3.1615. [DOI] [PMC free article] [PubMed] [Google Scholar]
- Zhang J, Kumar S. Detection of convergent and parallel evolution at the amino acid sequence level. Mol Biol Evol. 1997;14:527–536. doi: 10.1093/oxfordjournals.molbev.a025789. [DOI] [PubMed] [Google Scholar]
- Zhang J, Rosenberg HF, Nei M. Positive Darwinian selection after gene duplication in primate ribonuclease genes. Proc Natl Acad Sci U S A. 1998;95:3708–3713. doi: 10.1073/pnas.95.7.3708. [DOI] [PMC free article] [PubMed] [Google Scholar]