

Abstract
The error-prone RNA-dependent RNA polymerase (RdRP) and external selective pressures are the driving forces for RNA viral diversity. When confounded by selective pressures, it is difficult to assess if influenza A viruses (IAV) that have a wide host range possess comparable or distinct spontaneous mutational frequency in their RdRPs. We used in-depth bioinformatics analyses to assess the spontaneous mutational frequencies of two RdRPs derived from human seasonal (A/Wuhan/359/95; Wuhan) and H5N1 (A/Vietnam/1203/04; VN1203) viruses using the mini-genome system with a common firefly luciferase reporter serving as the template. High-fidelity reverse transcriptase was applied to generate high-quality mutational spectra which allowed us to assess and compare the mutational frequencies and mutable motifs along a target sequence of the two RdRPs of two different subtypes. We observed correlated mutational spectra (τ correlation P < 0.0001), comparable mutational frequencies (H3N2:5.8 ± 0.9; H5N1:6.0 ± 0.5), and discovered a highly mutable motif “(A)AAG” for both Wuhan and VN1203 RdRPs. Results were then confirmed with two recombinant A/Puerto Rico/8/34 (PR8) viruses that possess RdRP derived from Wuhan or VN1203 (RG-PR8×WuhanPB2, PB1, PA, NP and RG-PR8×VN1203PB2, PB1, PA, NP). Applying novel bioinformatics analysis on influenza mutational spectra, we provide a platform for a comprehensive analysis of the spontaneous mutation spectra for an RNA virus.
Keywords: H5N1, bioinformatics, influenza A virus, mutational spectra, polymerase fidelity
INTRODUCTION
The continued evolution of the IAV is the main driving force underlying the emergence of annual human influenza epidemics and occasional pandemics (Webster et al. 1992). Similar to other RNA viruses, viral genetic diversity may impact on viral pathogenesis (Chen et al. 2004; Alonso and Fort 2010; Rajamani et al. 2010; Coffey et al. 2011), drug and vaccine resistance (Novella et al. 1995; Taboga et al. 1997), and host survival (Domingo and Holland 1997). The RdRP which lacks a proof reading mechanism is likely to be an important contributing factor to the overall virus genetic diversity (Holland et al. 1982). In addition, there are other intrinsic mechanisms that contribute to viral diversity, including RdRP replication speed, RNA genome structure and organization that permit recombination or reassortment (Elena et al. 2006; Holmes 2009). For influenza viruses with segmented genomes, genetic reassortment (McCullers et al. 1999; Tscherne and Garcia-Sastre 2011) and mutations generated by RdRP are likely to be two important contributing factors for the generation of genetic diversity.
Reassortment occurs during the reshuffling of gene segments that lead to the emergence of variant viruses that are different than the parental strain both in genotype and phenotype. The contribution of reassortment to the emergence of pandemic influenza viruses has been demonstrated in the 1957, 1968, and the recent 2009 pandemics (Scholtissek et al. 1978; Smith et al. 2009). In addition, genetic reassortment may allow generation of novel emerging viruses that cross species barrier to cause zoonotic human infections, as seen with the recent H7N9 (Lam et al. 2013) or H10N8 viruses (Chen et al. 2014). The mutation frequency of the influenza RdRP itself was not studied in detail due to the absence of methodology to accurately measure the mutation frequency of RNA viruses. Furthermore, the mutational frequencies can be confounded by host factors that either pose selection pressures on viral genomes (e.g., immune selection, receptor specificity) or have the ability to directly edit viral genomes as in host RNA-editing enzymes. ADAR-1 with the adenosine-to-inosine editing functions on dsRNA substrates plays a critical antiviral role during RNA virus infections. Specifically, ADAR-1 possesses hydrolytic deamination activity that leads to the change of adenosine to inosine in the template sequence. Since inosine is recognized as a guanine by many cellular processes, this would lead to base-pairing of inosine with cytidine to increase the occurrence of A-to-G mutations in the viral genome. ADAR-1 has been shown to induce A-to-G mutations in measles virus (Toth et al. 2009; Suspène et al. 2011; Ward et al. 2011), respiratory syncytial virus (Rueda et al. 1994; Martinez and Melero 2002), vesicular stomatitis virus (O'Hara et al. 1984), lymphocytic choriomeningitis virus (Zahn et al. 2007), hepatitis δ virus (Zahn et al. 2007), and IAV (Suspène et al. 2011). Due to these confounding factors, it is challenging to independently quantify spontaneous viral mutational frequency (Domingo and Holland 1997; Elena et al. 2006).
Computational methods have been frequently used for the analysis of mutation spectra (Rogozin and Pavlov 2003). One of the most successful examples is an analysis of mutational spectra of immunoglobulin genes that identified two mutable motifs, RGYW and WA (Rogozin et al. 2001b). In addition, statistical methods were used to determine the correlations of immunoglobulin mutational spectra with the polymerase η spectra (Rogozin et al. 2001b). This result suggests that error introduced by polymerase η when transcribing the DNA strand in variable regions contributes to somatic hypermutagenesis of immunoglobulin genes. Computational analyses were rarely performed for RNA sequences, including RNA virus genomes, as these analyses require high-quality sequence data with minimal background instrument mutational error (Tromas and Elena 2010). Bioinformatics analyses with statistical inferences for influenza viruses have been performed mostly to determine the phylogenetic relationship of isolates and they do not require high-quality spectral data. Here, we aim to assess the mutational frequencies and identify mutable motifs generated by RdRP of different IAV. Specifically, we aim to determine if RdRPs derived from two IAV with different adaptation history in humans and exhibiting varied pathogenicity in the human or mammalian hosts would possess different or comparable mutational frequency and spectra. They are A/Wuhan/359/95 (Wuhan) human H3N2 seasonal influenza virus and A/VN/1203/04 (VN1203) highly pathogenic avian H5N1 virus that displayed differences in pathogenicities (Salomon et al. 2006; Yen et al. 2007; McAuley et al. 2010). To address these questions, we minimized background errors to obtain high-quality mutational spectra, which were then analyzed by bioinformatics algorithms previously developed for human genetics. We assessed and compared the mutational frequencies, mutational bias, spectra correlations, and highly mutable motifs along target sequences generated by two influenza RdRPs. Mutation spectra were generated from different sources for consolidation of the scientific conclusions: a mini-genome system with a common luciferase reporter to generate polymerase-driven spectra, and recombinant IAV to generate virus spectra in in vitro and in mouse models.
RESULTS
Polymerase-driven spectra derived from Wuhan and VN1203 polymerase complexes
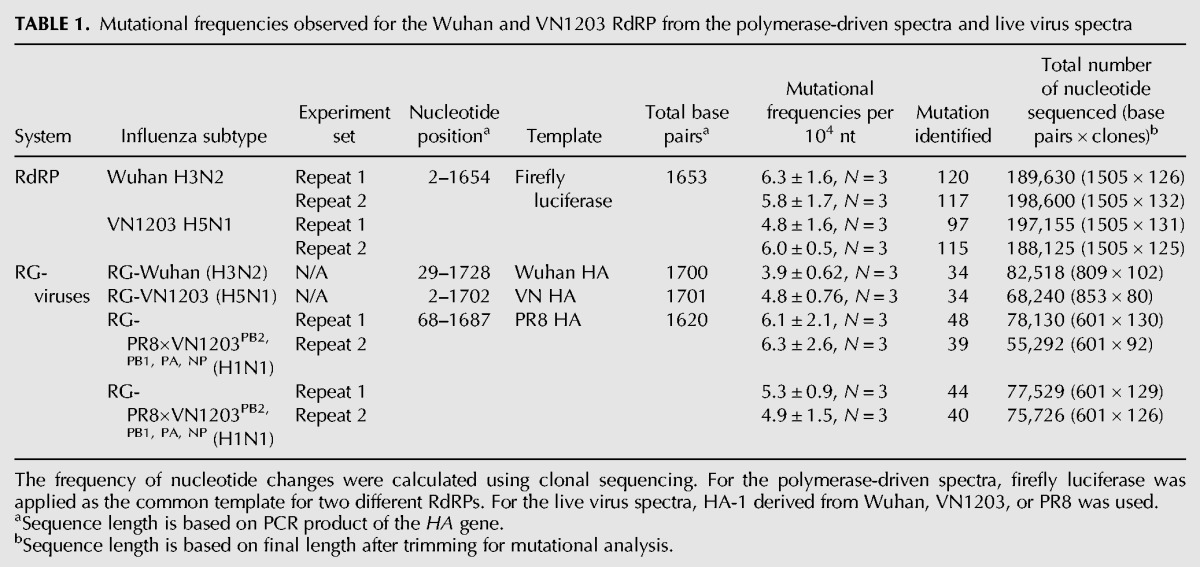
To assess the mutational frequency and spectra of RdRPs derived from two IAV with different adaptation history in humans and exhibiting varied pathogenicity, we first compared the polymerase-driven spectra generated by the polymerase complex of Wuhan and VN1203 using the mini-genome system with a common firefly luciferase reporter flanked by the noncoding region of influenza segment seven (M gene) serving as template. The mini-genome replicon assay was performed in parallel with negative controls (in the absence of the PB1 plasmid at transfection) to account for the background mutational rate of the experimental system. As no PCR product can be detected for the negative control transfection reaction (without PB1) below cycle 19 (Fig. 1A), a minimal PCR replication cycle (cycle 19) was applied to avoid amplification of plasmid DNA. The replication rate, a factor that may affect mutational frequency, was quantified to be comparable for Wuhan and VN1203 polymerase complexes in human 293T cells (Fig. 1B, left panel), although a slight difference was observed at the protein levels (Fig. 1B, right panel). We used the mRNA (as oligo(DT) was applied for cDNA synthesis) to generate mutational spectra. We analyzed the luciferase gene sequences recognized and amplified by the two different RdRPs. Clonal sequencing of a 1653-bp PCR product from the firefly luciferase gene (2–1654 bp) was applied to analyze the mutational frequency and mutational spectra. Total RNA derived from two independently performed mini-genome replicon assays were performed for Wuhan or VN1203 RdRPs, which yielded a total of 258 (126 + 132) and 256 (131 + 125) clonal sequences, respectively. The mutational frequency was calculated by dividing the total number of detected mutation by the total number of nucleotides sequenced. A comparable spontaneous mutational frequency was observed for the RdRPs derived from Wuhan and VN1203 viruses with different host range and pathogenic potentials. For the Wuhan polymerase complex, a total of 120 and 117 mutations were identified from 189,630 and 198,600 base sequenced, with a mutational frequency of 6.3 × 10⁻⁴ and 5.8 × 10⁻⁴ mutations per base sequenced (replicates 1 and 2, respectively). For the VN1203 polymerase complex, a total of 97 and 115 mutations were identified from 197,155 and 188,125 base sequenced (replicates 1 and 2, respectively), with a mutational frequency of 4.8 × 10⁻⁴ and 6.0 × 10⁻⁴ mutations per base sequenced (Table 1).
FIGURE 1.

Mini-genome system for assessing the intrinsic influenza polymerase mutation rate and mutational spectra. A mini-genome system was applied to assess the RdRP activity in human 293T cells using the reporter plasmid driven by human Polymerase I promoter encoding firefly luciferase flanked by the 3′- and 5′-noncoding regions of influenza segment seven. Human 293T cells were cotransfected with the PB2, PB1, PA, NP, and the firefly luciferase and the cells were lysed for total RNA isolation or for luciferase activity measurements at 24 h post-transfection. The negative control transfection contained no IAV PB1 plasmid. (A) PCR amplification of the luciferase reporter gene driven by the RdRPs derived from Wuhan (Wu) or VN1203 (VN) viruses. Transfections were performed in triplicates and the negative controls (without PB1) were included in parallel. (B) Real-time PCR assay for firefly luciferase mRNA quantification and firefly luciferase activity as a proximate for the polymerase activity of Wuhan and VN1203 RdRPs. The results shown (mean ± SD) were from triplicated wells in one out of two independently performed experiments.
TABLE 1.
Mutational frequencies observed for the Wuhan and VN1203 RdRP from the polymerase-driven spectra and live virus spectra
Mutational spectra were generated from the firefly luciferase clonal sequence alignment derived from the Wuhan (N = 258) and VN1203 (N = 256) polymerase complexes. We analyzed the frequency of the nucleotide changes and observed a mutational bias for both the Wuhan and VN1203 polymerase complexes. The mutational preference of the influenza polymerase complex was shown to favor the transition from A to G and from U to C, which is more frequent that the reverse G-to-A and C-to-U transition mutations (χ2, P < 0.0001) for both polymerase complexes (Fig. 2A).
FIGURE 2.
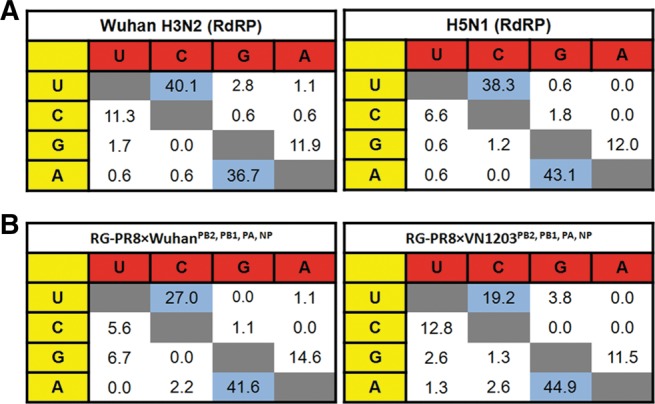
The two different RdRPs show comparable transition mutational bias in with the (A) polymerase-driven spectra and (B) live virus spectra. (A) Mutational preference of A/Wuhan/359/95 and A/Vietnam/1203/04 polymerase complexes. (B) Mutational preference of recombinant RG-PR8×WuhanPB2, PB1, PA, NP and RG-PR8×VN1203PB2, PB1, PA, NP viruses using the common HA gene as the template. The percentages (%) depict the specific nucleotide in yellow that mutate to the nucleotide in red, among the total number of nucleotide substitutions. Sequences generated from two independent experiments are pooled for the analysis.
The mutational profile of recombinant RG-Wuhan, RG-VN1203, RG-PR8×WuhanPB2, PB1, PA, NP, and RG-PR8×VN1203PB2, PB1, PA, NP viruses
We then applied live influenza viruses to confirm our observations from the mini-replicon system. Reverse genetics was used to generate recombinant A/Puerto Rico/8/34 (H1N1) (PR8) viruses that differ by the polymerase complex genes (PB2, PB1, PA, NP) from either Wuhan or VN1203. The four recombinant viruses: RG-Wuhan (H3N2), RG-VN1203 (H5N1), RG-PR8×WuhanPB2, PB1, PA, NP (H1N1), and RG-PR8×VN1203PB2, PB1, PA, NP (H1N1). RG-PR8×WuhanPB2, PB1, PA, NP and RG-PR8×VN1203PB2, PB1, PA, NP were generated to address the role of polymerase complex in viral diversity. All four viruses replicated to within one log difference in MDCK cells except for the RG-PR8×WuhanPB2, PB1, PA, NP virus (Table 2). This approach allowed us to compare the mutational spectra of the two viral polymerase complexes while reducing potential confounding factors in the experimental system, including selection pressure posed by the host cells such as receptor specificity. The HA gene spectra (68–1687 bp, total 1620 bp) can then be analyzed unbiasedly as a common template shared by RG-PR8×WuhanPB2, PB1, PA, NP and RG-PR8×VN1203PB2, PB1, PA, NP viruses. For comparison, the HA spectra from RG-Wuhan (H3) (29–1728 bp, total 1700 bp) and RG-VN1203 (H5) (2–1702 bp, total 1701 bp) were generated for comparison. To enhance the efficiency of the cloning process of the mutational analysis of all live viruses, an advanced method of rolling-circle amplification was used instead of growing bacterial stocks sufficient for plasmid DNA purification. Sanger sequencing was used with sequence-specific primers.
TABLE 2.
Viral titer of the four reverse-genetics rescued viruses after passages in MDCK cells at an MOI of 0.001
Mutational frequency for RG-Wuhan and RG-VN1203 were shown to be similar at 3.9 × 10⁻⁴ and 4.8 × 10⁻⁴ base sequenced, respectively. The mutational frequencies on the HA gene shared by the RG-PR8×WuhanPB2, PB1, PA, NP and RG-PR8×VN1203PB2, PB1, PA, NP viruses were also comparable (ranged from 4.9 to 6.3 × 10⁻⁴ base sequenced). Comparing the HA spectra generated from the recombinant RG-PR8×WuhanPB2, PB1, PA, NP and RG-PR8×VN1203PB2, PB1, PA, NP viruses, we confirmed the observation on the mutational preference of the influenza polymerase complex in favoring the transition change from A to G and from U to C (Fig. 2B).
Mutational spectra comparison
Comparative and systematic (with parallel model systems) mutational analysis was performed to address if Wuhan and VN1203 RdRPs share comparable mutational spectra at the level of the polymerase complexes and at the level of live recombinant viruses. In the presence of minimal selective pressure in the transfection system (Heaton et al. 2013), we performed two independent tests, the Kendall's τ correlation analysis and a linear correlation analysis (Table 3; Rogozin et al. 2014) to compare the polymerase-driven spectra derived from Wuhan and VN1203 polymerase complexes. We observed that the two spectra correlate significantly (P < 0.001) using firefly luciferase as the mutational template. For testing the heterogeneity between two mutational spectra a Monte Carlo approximation of the Fisher exact test was used (Adams and Skopek 1987; Rogozin and Kolchanov 1992; Rogozin et al. 2001b). It was found that two spectra are homogeneous (P < 0.01) and thus belong to the same general population. This suggests conserved mutational spectra being generated intrinsically by the polymerase complex. We continued to compare the mutational spectra of the four recombinant viruses to see if there was a statistically significant correlation. The results suggested that two spectra (HA from PR8 driven by Wuhan and VN1203 RdRPs) are homogeneous in both correlation tests, thus belong to the same general population. Overall, the recombinant live virus data consolidate the mini-genome data, both supporting a correlated spectra generated by Wuhan and VN1203 RdRPs.
TABLE 3.
τ Correlation and linear correlation tests were performed to determine the correlation between the spectra generated by Wuhan and VN1203 RdRPs, and between the spectra generated in vitro and in mouse
The mutational spectra in vitro was then compared with the spectra generated in mouse to evaluate if selective pressure in vivo would affect the formulation of the mutational spectra during the course of infection. RG-VN1203 virus passaged two times in MDCK cells was used to generate the in vitro mutational spectra as described previously. To generate the in vivo mutational spectra, C57BL/6 mice were inoculated with 10 or 100 pfu of RG-VN1203 virus, and RNA was isolated from homogenized lungs at 3 and 8 d post-inoculation for mutational analysis of the HA gene. Interestingly, we observed a correlation between the in vitro mutational spectra to that of the in vivo spectra derived from mouse lungs at day 3 post-inoculation (Table 3; P < 0.01, linear correlation; P < 0.01, τ correlation). However, this correlation was lost at a later time point of 8 d post-inoculation. The result suggests that selection pressures can affect the in vivo mutational spectra at later time points post infection.
Identification of mutational hotspots
Mutation hotspots were determined using a threshold (Sh) for the number of mutations at a detectable site (Glazko et al. 1998). For the combined spectra of Wuhan and VN1203 polymerase complexes CLUSTERM suggested four mutations as the hotspot threshold. The list of hotspot positions identified in the spectra is shown in Table 4. Using the MOTIFN program for further computational analysis, a highly mutable motif “AAAG” (and a shorter variant “AAG,” with hotspot position underlined) was discovered (Table 5; P < 0.001). The highly mutable motif was determined for the RdRP complex using firefly luciferase gene as the mutational template. For robustness, both independent experiments for each of the statistically correlated spectra for RG-Wuhan (H3N2) and RG-VN1203 (H5N1) were combined. We then extended the search for mutable motifs to all four live viruses, RG-Wuhan, RG-VN1203, RG-PR8×WuhanPB2, PB1, PA, NP, and RG-PR8×VN1203PB2, PB1, PA, NP and identified the same motifs AAAG (and AAG) as highly mutable in all spectra using both the HA and NA (RG-Wuhan only) genes, this result is statistically significant (Table 6). This suggests that the (A)AAG mutable motif is a reliable descriptor of mutagenesis for IAV, regardless of the template (firefly luciferase or influenza genome) being transcribed by the influenza polymerase complex.
TABLE 4.
Mutational hotspots identified through the polymerase-driven spectra generated by both Wuhan and VN1203 RdRPs
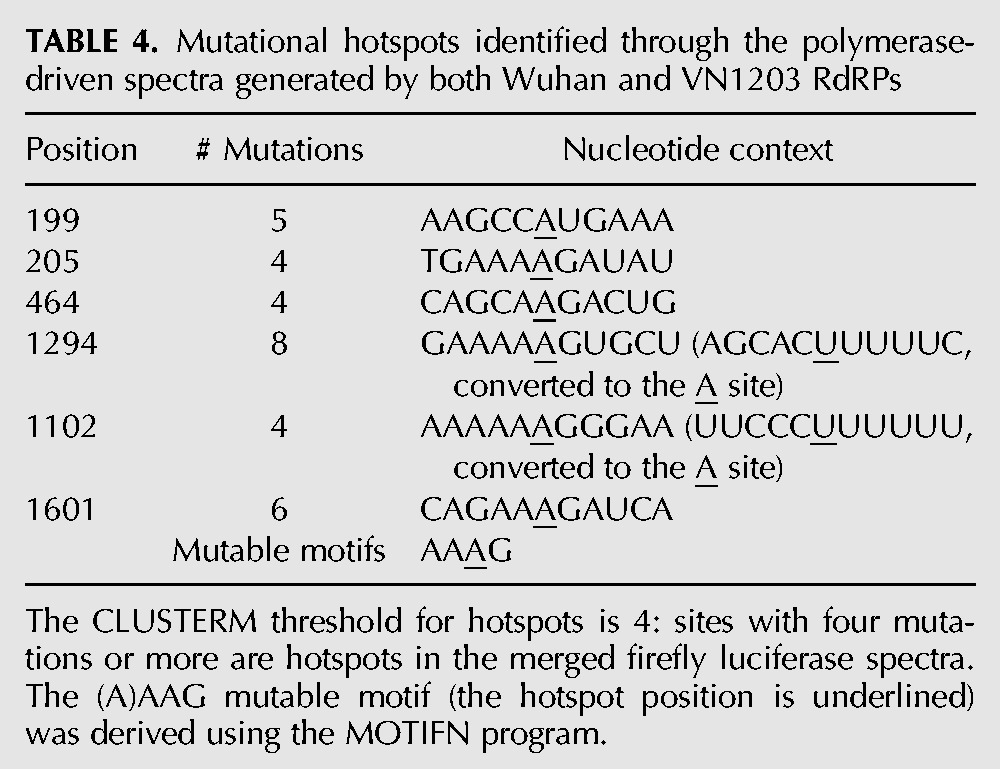
TABLE 5.
Highly mutable motifs discovered using the MOTIFN program
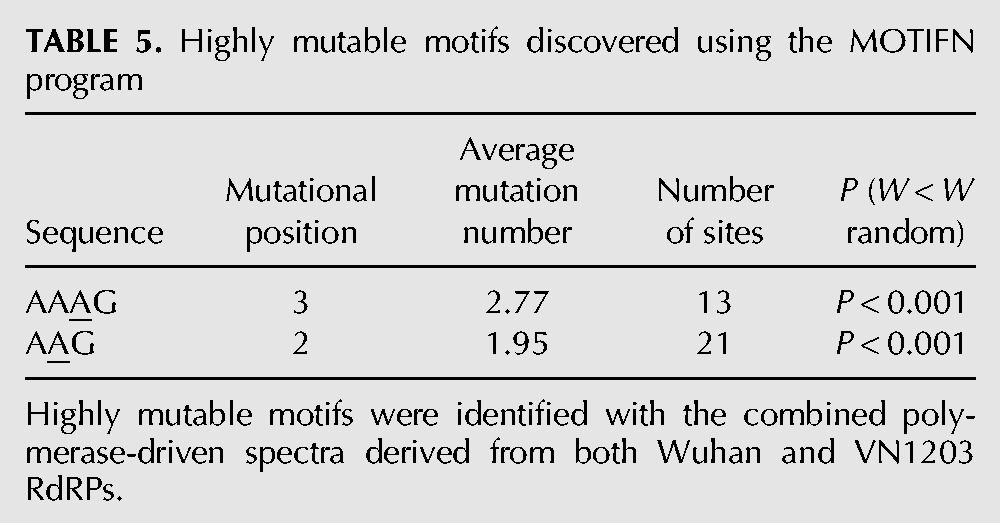
TABLE 6.
(A)AAG mutable motifs identified in the polymerase-driven and live virus spectra and correlation between computer-generated ADAR-1 spectra and actual experimental spectra from polymerase-driven and live virus spectra
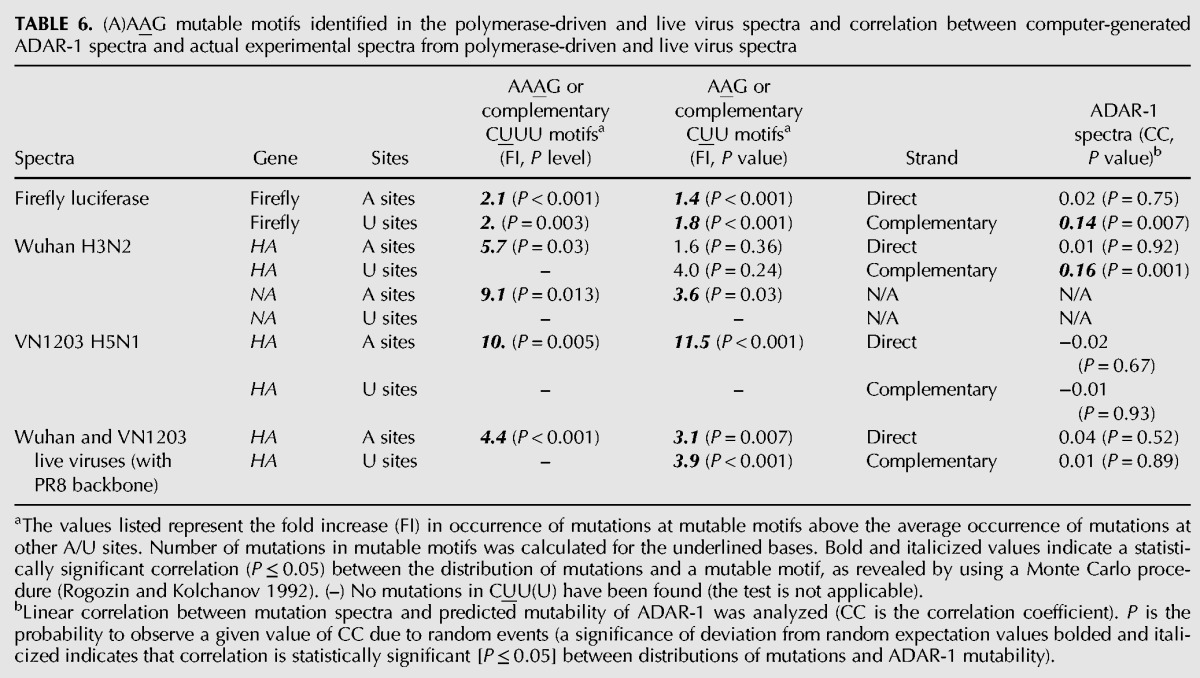
To account for the potential effects of A-to-I editing activity of the host ADAR-1 in the influenza mutational spectrum, we performed a correlation test between the influenza mutational spectra and that of a predicted ADAR-1 spectra on the firefly luciferase sequence using the InosinePredict software (Eggington et al. 2011). The spectra composed of a predicted probability score of being edited by ADAR-1 for each of the 1505 bp in the firefly luciferase gene, 809 bp in the HA of Wuhan, 853 bp in the HA of VN1203, and 601 bp in the HA of PR8 recombinant viruses. In majority of the cases, there were no correlation between the experimental influenza mutational spectra and the predicted ADAR-1 spectra. A strong correlation has only been observed for U complementary sites of firefly luciferase and Wuhan H3N2 spectra (Table 6). This result suggests that in some cases ADAR-1 editing may cause strand-specific mutations in viral RNA as the complimentary A sites are not statistically significant.
Finally, we analyzed influenza virus mutation spectra in C57BL/6 mice inoculated with 10 or 100 pfu of VN1203 virus to assess whether the highly mutable motif “(A)AAG” is present in vivo to consolidate the discovery and to determine the physiological relevance of such a motif. At day 3 post-inoculation, we found a statistical significant correlation between the (A)AAG mutable motif and the distribution of mutations, for A and U sites when 10-pfu inoculum was used, and for A site when 100 pfu inoculum was used (Table 7). No such correlation was observed at the later time point of 8 d post-inoculation in the presence of longer exposure to selective pressure. The amino acid changes identified in the spectra of VN1203 virus extracted from the lungs day 3 (10 and 100 pfu inoculation) and day 8 post-inoculation were tabulated in Table 8.
TABLE 7.
(A)AAG mutable motifs identified in VN1203 viruses collected from lung homogenates used for in vivo infection
TABLE 8.
Amino acid changes (H5 numbering) identified in the spectra of VN1203 virus isolated from mouse lungs
DISCUSSION
Studies analyzing the mutational spectra of RNA viruses are limited (Tromas and Elena 2010). Here, we applied a bioinformatics tool developed for human genetics for in-depth viral genomics analyses of the mutational profiles and spectra of two IAV of distinct phenotypes. While some of the previous studies have attempted to compare influenza RdRP mutational frequency (Nobusawa and Sato 2006; Wong et al. 2011), mutational bias in vitro or in vivo (Gutierrez et al. 2013), a systemic analysis with the application of sophisticated bioinformatics tools has not been performed. The system we have applied, the mini-genome system or the recombinant viruses, had minimal selective pressure bias and would allow minimizing the potential effect of selection pressure (receptor usage) on viral genomes. We believe that the results presented here would serve as baseline measurements for IAV RdRP and the effect of selection pressures on mutational frequency or mutable motifs when more complex systems are applied. We showed that the in vitro mutational spectra of influenza A virus polymerases derived from human seasonal H3N2 or highly pathogenic H5N1 influenza strains, assayed in the mini-genome system and with recombinant virus, were generally comparable. A high correlation between the in vitro and in vivo mutational spectra derived from RG-VN1203 inoculated mouse lungs at day 3 but not on day 8 post-inoculation suggest that selective pressure in vivo can significantly diverge the viral mutational spectra at later time points post-infection.
The mutational frequencies of influenza viruses have been estimated previously in three reports, with all three using plaque assay in which individual clones of virus grown in the presence of agarose overlay were isolated and RNA extracted for PCR amplification and sequencing (Parvin et al. 1986; Nobusawa and Sato 2006; Wong et al. 2011). There are limitations when using plaque assay to determine the mutational frequencies of viruses. The mutations identified by plaque assay used for mutational frequency calculations must retain replication competence, or else they will not be forming viable plaques. A bias for higher fitness variants is due to the exclusion of many mutations that are less fit which may form plaques too small to be detected. In addition, statistics has been rarely applied due to limited sample size (sequences) analyzed. Although bioinformatics analyses applying statistical inferences for have been performed to determine the phylogenetic relationship of influenza viruses isolates, those analyses do not require high-quality spectra data. In the present study, the mutational frequencies at the polymerase level did not differ between the RdRPs of the two viruses. The mutational frequencies of live recombinant viruses carrying the RdRPs of the H3N2 or the H5N1 viruses, either in their respective native genetic backbone or in a common H1N1 backbone, were compared to examine the effect of live virus infection of MDCK cells on the viral genetic diversity. Findings in the RdRP mini-genome system were analogous to the live viruses with either the native or H1N1 (PR8) backbone. The comparable mutational frequencies between H3N2 and H5N1 viruses at both the polymerase and live viruses levels suggest that the spontaneous mutational frequency of influenza viruses alone cannot determine the pathogenicity of the highly pathogenic H5N1 virus in vivo. This supports the idea that the error rates of single-stranded RNA viruses is optimized to allow for enough beneficial mutations to respond to changing environments, but not overly deviated from the error threshold (Duffy et al. 2008).
The ability to generate high-quality mutational spectra of influenza viruses provides an opportunity to apply bioinformatics and statistics used in eukaryote genetics to the mutational spectrum of viruses. We observed transition mutational biases of A to G and U to C with the polymerase-driven spectra and live virus spectra, confirming the results previously reported (Gutierrez et al. 2013). Such a bias could be a result of the A-to-I editing of ADAR-1, through the influenza polymerase, or both (Tenoever et al. 2007; Suspène et al. 2011; Ward et al. 2011). In addition, we identified potential highly mutable motifs with the polymerase-driven spectra and live virus spectra under minimal selection pressure. Previously, mutational hotspot of other viruses, namely herpes simplex virus (Sasadeusz et al. 1997), HIV, polyoma virus (Wilson et al. 1986) have been reported, but all these studies have examined viral genome under strong selective pressures. For example, the identification of acyclovir-resistant α-herpesvirus involves frame-shift mutations in two long homo-polymer nucleotides stretches within the thymidine kinase gene (Sasadeusz et al. 1997; Yamada et al. 2005). This frame-shift mutation has a functional consequence that leads to a nonfunctional, truncated protein against which the drug target acts, although the virus remains viable. Therefore, such hotspot is under selection to increase its occurrence because variants with this mutation have a survival advantage. Here, using the mini-genome system with minimal selective pressure and with the application of appropriate bioinformatics analysis tools, a highly mutable motif was identified for influenza virus. Discovery of such motifs can provide insights into the influenza RdRP mechanisms.
We hypothesize a possible mechanism for the (A)AAG highly mutable motif. We infer mechanistic insight from patterns of mutable motifs in organisms with DNA genomes. In species with DNA genomes, mutations on repetitive sequences are not dependent on the exact DNA sequence as rigid as restriction enzyme sites. Instead, it is the nature of a sequence motif that is being repeated. This is partly the reason we included the analysis on the complementary CUU(U) motif. The theoretical basis was that misalignment of the DNA strands during DNA replication can give rise to short insertions and deletions within homo-polymeric (homo-nucleotides) tracts (Streisinger et al. 1966). This misalignment leads to variability in the length of homo-polymeric tracts. Although we have detected additions and deletions in the analyzed spectra, their low frequency did not allow for statistical analysis to identify possible sequence motifs. However, in the polymerase-driven spectra (both H3N2 and H5N1), we observed that monotonous runs of nucleotides can lead to a higher probability for insertions or deletions, although in the live virus spectra, this phenomenon is more difficult to examine (Table 9). It should be emphasized that the frequency for deletion is ∼10-fold lower than the mutational frequency observed. In contrast to the misalignment mutagenesis mechanism for insertions and deletions, dislocation mutagenesis involves transient slippage of the DNA strand in a monotonous run of nucleotides at the site of the template or primer strand. This slippage is then followed by the incorporation of the next correct nucleotides (Kunkel 1985). This mechanism was postulated based on the in vitro experiments of the mutational spectra of rat DNA polymerase β (Kunkel 1985; Kunkel and Soni 1988), in which the template dislocation model explained a hotspot for T→G substitutions in the sequence 5′-gTtt-3′. However, for RdRP no evidence of such a phenomenon was shown, with the present study being the first. It is important to note that it is not certain that “AAAG and AAG” will be mutated into “AAGG” or “AGG,” although it is correct if the strand dislocation model is assumed. The sequence-specific motif is more certain, given that different types of replacements in the hotspot or mutable position can also be observed.
TABLE 9.
Deletions and insertions observed in the polymerase-driven and live virus spectra
ADAR-1 has been shown to contribute to the mutational spectra of IAV (Suspène et al. 2011), therefore it may be possible that it can affect the mutational spectra and hotspots analyzed in this study. To determine if ADAR-1 played a role in formulating the mutational spectra of influenza viruses at the polymerase level, the same correlation analysis was used to compare the homogeneity of the influenza RdRP spectra with the ADAR-1 mutational spectra compiled from an algorithm developed by fitting to editing sites that were determined experimentally using a carefully designed template as described by Eggington et al. (2011). Overall, we failed to identify a correlation between ADAR-1 spectra and both virus RdRP and live virus spectra, suggesting a minimal effect of ADAR-1 editing in the influenza diversity in vitro. However, this is an indirect method. A system where ADAR-1 gene expression is removed in gene knockout systems is required for further analysis. Nevertheless, the contribution of the RdRP in the diversity of the virus was then further studied by performing bioinformatics analysis of the recombinant viruses with Wuhan and VN1203 polymerase sharing the same common backbone of H1N1 PR8.
Overall, we determined the mutational frequencies and analyze the spectra of H3N2 and H5N1 polymerase complex driving the expression of luciferase gene in the mini-genome system, and live viruses with the native backbone and that of the common H1N1 (PR8) backbone. We observed that the H3N2 and highly pathogenic H5N1 RdRP showed comparable mutational frequencies, mutational bias, spectra correlations, and highly mutable motifs while being assessed at the level of the polymerase complex (mini-genome system) or by analyzing viral progenies. We have begun to apply this bioinformatics approach on mutation spectra generated by next-generation sequencing. The results suggest the importance for the polymerase between human and avian influenza viruses to maintain its mutational frequency within a controlled error threshold and highlight the potential host RNA-editing effect on viral genome evolution.
MATERIALS AND METHODS
Viruses and cells
Recombinant A/Wuhan/359/95 (Wuhan) (H3N2) and A/Vietnam/1203/04 (VN1203) (H5N1) viruses were generated by transfection of 293T cells using the eight-plasmid system as described (Hoffmann et al. 2000). Recombinant viruses (RG-PR8 × WuhanPB2, PB1, PA, NP and RG-PR8×VN1203PB2, PB1, PA, NP) that differed by the polymerase complex (PB2, PB1, PA, and NP) but share common HA, NA, M, and NS derived from the A/Puerto Rico/8/34 (PR8) (H1N1) virus were generated. The recombinant viruses were passaged in MDCK cell 2–3 times at the MOI of 0.001 plaque forming unit (PFU)/cell. Stock viruses were aliquoted and stored at −80°C. All viruses were sequenced before performing experiments to ensure no mutation in the PB2, PB1, PA, and NP gene segments observed. Madin–Darby canine kidney (MDCK) cells and 293T cells were obtained from ATCC and maintained in minimal essential media (MEM) and OPTI-MEM, respectively, supplemented with 10% fetal calf serum (FCS). Both MDCK and 293T cells were incubated at 37°C at 5% CO2.
Establishment of the high-fidelity platform for RdRP and viral mutational frequency/spectrum analysis
To generate the mutational spectra of the viral polymerase, oligo(DT)18 primer was used to reverse transcribe the mRNA, while excluding vRNA and cRNA. A two-step RT-PCR method was used to amplify the luciferase gene using oligo(DT)18 for cDNA synthesis. For negative control, we included a transfection system in the absence of PB1 gene for both Wuhan and VN1203 systems, performed in triplicates and pooled for mutational analysis. The number of PCR replication cycles was optimized to avoid amplification of plasmid DNA, and it was determined to be 19. Below cycle 19, no band was observed when no PB1 was cotransfected.
To determine if sufficient RNA was used for the RT-PCR reaction for the representation of the RNA sequence diversity of the viral population, 10- or 100-fold dilutions of the RNA was used for mutational analysis, and a detectable band was observed for the gel electrophoresis of the PCR product of the amplified HA gene. To minimize the carryover of the DNA plasmid that presumably remained throughout the reverse transcription and PCR process, an optimization experiment was performed using the negative control that lacks the PB1 gene. The number of PCR cycles was determine so that an extractable band for mutational analysis can be amplified in the PB1-containing system, but no observable band was observed in the system without PB1. Therefore, the mutational frequencies determined for the host polymerase I transcription of the vRNA and the commercial reverse transcriptase and PCR polymerase would be limited in our system.
Intrinsic polymerase mutational analysis
Sub-confluent human 293T cells were cotransfected with Trans-IT (Mirus) with pHW2000 plasmids encoding PB2, PB1, PA, and NP genes from either the Wuhan or the VN1203 viruses together with a reporter plasmid encoding the codon optimized firefly luciferase flanked by the noncoding region of influenza M gene segment driven by the human Polymerase I promoter (Hoffmann et al. 2000; Salomon et al. 2006). phRL-CMV (Promega) plasmid, which encodes the codon optimized renilla luciferase driven by the CMV promoter was transfected together to serve as transfection efficiency control. For negative control, 293T cells were transfected in the absence of the plasmid encoding for PB1, which is responsible for RNA transcript elongation. All experiments were performed in replicates of five. After 48 h of incubation at 37°C, two out five replicates were processed with passive lysis buffer and the firefly and renilla luciferase signals were quantified using the Dual-Glo Luciferase Assay System (Promega) as a proximate for polymerase replication and transcription efficiency (expressed by the ratio of firefly luciferase over renilla luciferase).
The remaining three out of five replicates of transfected 293T cells were lysed with RLT buffer, and total RNA was extracted with RNeasy kit (Qiagen). To remove potential DNA contamination from plasmids used to transfect the cells, 5 µg of extracted RNA was incubated for 3 h at 37°C with a mixture of 2 units of Turbo DNA-free DNase (Applied Biosystems) and 2 units of DpnI (NEB). Reverse transcription using High-fidelity Transcriptor Kit (Roche) was then performed with standardized amount of RNA using oligo(DT)18. cDNA made was then PCR amplified for 19 cycles, which was predetermined as described in the Result using total RNA isolated from the cells transfected in the absence of PB1 plasmid as negative control.
Triplicates of PCR was performed with Expand High Fidelity PCR System (Roche) to amplify the firefly luciferase mRNA as a common template for mutational profile analysis. PCR purification kit was used to purify the amplified product. 3′-A overhang was added using the dATP and Taq polymerase (Applied Biosystems) in triplicates. A standardized 60 ng of DNA was subjected to clonal sequence analysis using TOPO TA Cloning Kit (Invitrogen) in triplicates. Plasmid DNA from triplicates of 50 bacterial clones for each independent transfection was isolated, and the sequences were analyzed using 3730xl DNA Analyzer (Applied Biosystems). Each nucleotide was read twice with different primers for validation.
Mutational analysis for recombinant viruses that differ in their polymerase complex
To analyze the mutational spectrum, triplicates of T25 flask with monolayer of MDCK cells were infected in triplicate with each of the four recombinant viruses RG-Wuhan, RG-VN1203, RG-PR8×WuhanPB2, PB1, PA, NP, or RG-PR8×VN1203PB2, PB1, PA, NP at MOI of 0.01. After 72 h, supernatant was collected for collection of viral RNA using RNeasy (Qiagen). A standardized amount of 45 ng of RNA was used for reverse transcription using High-fidelity Transcriptor Kit (Roche) with random hexamer followed by Expand High-fidelity PCR System to amplify the HA gene using 10 µL of cDNA. The PCR product is purified and the 3′-A overhang was added using dATP and Taq polymerase as described. The PCR products (120 ng of DNA) were analyzed using clonal sequencing with the TOPO TA Cloning Kit (Invitrogen). To compare the mutational frequency and spectrum for the four different recombinant viruses, a total of 150 clones from each of the recombinant virus were sequenced using 3730xl DNA Analyzer (Applied Biosystems).
Experimental infection of A/Vietnam/1203/2004 (H5N1) viruses in mice
The animal experiments were conducted at the Biosafety Level-3 facility at the LKS Faculty of Medicine, The University of Hong Kong under applicable guidelines and ethics approved by the Committee on the Use of Live Animals in Teaching and Research (CULATR). Six weeks-old female C57BL/6 mice were anesthetized with ketamine and xylazine and inoculated intranasally with 10-fold serial diluted viruses in 25 µL of PBS. Mice were inoculated with either 10 or 100 pfu of VN1203 virus. At day 3 and 8 d post-inoculation, viral RNA was extracted from lung homogenate, and TOPO cloning was performed for the HA-1 gene as described above.
Correlation analysis of ADAR and RdRP mutational spectra
The firefly luciferase sequence that is 1653 bp in length was processed by the software algorithm named “InosinePredict,” which was used to predict the probability of ADAR editing by fitting to editing sites determined experimentally in a long and perfectly base-paired dsRNA, and also estimates ADAR preferences in the absence or minimal of the effects of RNA structure (Eggington et al. 2011). hADAR-1 instead of hADAR1-D was used because the latter is truncated to only contain the catalytic domain. The algorithms were tested for their accuracy in the prediction of ADAR-mediated editing reported previously for hADAR1 in 36- and 48-bp dsRNAs, as it was shown to successfully predicted sites for 27 out of 37 adenosines or 73% (Eggington et al. 2011). For each nucleotide, a predicted editing percentage is calculated. A spectra correlation analysis was performed as described below to determine if there exists a statistical correlation between ADAR-1 predicted luciferase mutational spectra and Wuhan and VN1203 combined mutational spectra.
Mutational spectrum and hotspot analyses
Fisher exact test was employed to compare substitutions frequencies of in A, C, U, and G sites. The Kendall's τ correlation coefficient (Babenko and Rogozin 1999; Rogozin et al. 2001a) and a Pearson χ2 test of spectra homogeneity with Monte Carlo modification (Adams and Skopek 1987) and were used to compare distribution of mutations along a target sequence. Calculations were performed using the CORR12 (Babenko and Rogozin 1999) and COLLAPSE (Khromov-Borisov et al. 1999) programs.
Mutational hotspots are defined by a threshold for how many mutations were observed at a site. By analyzing the frequency distribution of a mutational spectrum with the CLUSTERM program, the threshold is estimated (Glazko et al. 1998; Rogozin et al. 2001a). Briefly, this CLUSTERM deconstructs a mutation spectrum into multiple homogeneous classes of sites, using Poisson distribution to approximate every class. By definition, mutation frequencies vary randomly among sites of the same class. Mutation probability is equal among all sites within a class. In contrast, statistically significantly differences are seen between classes. Every site has a probability P(C) being assigned to class C. Classes having the highest mutational frequencies are called hotspot classes. Sites with P(Chotspot) ≥ 0.95 are considered as hotspot sites. This approach can ensure that these assignments are robust and with statistical significance reference (Rogozin et al. 2001a).
Mutational hotspots are often present due to neighboring nucleotides (Benzer 1961; Coulondre et al. 1978; Cooper and Youssoufian 1988; Horsfall et al. 1990; Rogozin and Kolchanov 1992; Krawczak et al. 1998; Zavolan and Kepler 2001). The context of hotspots being revealed in this way can be addressed by various methodologies (Rogozin and Pavlov 2003). We used two implementations of regression analysis of mutational spectra (Rogozin and Kolchanov 1992; Berikov and Rogozin 1999) to identify the mutational hotspot.
Features of a nucleotide sequence could be correlated with a mutation spectrum, and statistical tests can be used to determine if the correlation is statistically significant. The significance of correlations between mutations along a target sequence the distribution of mutable motifs and was calculated by a Monte Carlo procedure in the CONSEN program as reported in other studies (Rogozin and Kolchanov 1992; Rogozin et al. 2001b). This approach and algorithm take into consideration the probability of multiple mutations in one site, the context of the mutation sites, and the frequency of substitution for each nucleotide. The Monte Carlo simulation was processed with weighted sites, with the weight of a site defined as
 |
where Mj is equal to the number of mutations in site j. Weights Wj is a total of all sites in the sequence that results in the W being the total weight. The distribution of total weights Wrandom was then calculated for 10,000 target sequences obtained with the random shuffled mutational spectra. Every one of the random mutation spectra being generated would possess the same number of mutations as the observed spectrum with identical distribution of mutations over sites chosen randomly. The distribution of Wrandom was then used to determine the probability PW ≤ Wrandom. This probability equals to the fraction of random spectra in which the value Wrandom is ≥W. Small probability values in the range of (PW ≤ Wrandom ≤ 0.05) would indicate a significant correlation between mutational frequency and mutable motif (Rogozin and Kolchanov 1992; Rogozin et al. 2001b).
ACKNOWLEDGMENTS
We thank the Croucher Foundation for the Croucher-Butterfield Scholarship to P.P.C. This study was supported by the National Institutes of Health (NIAID contract HHSN272201400006C) and the Area of Excellence Scheme of the University Grants Committee (grant AoE/M-12/06) of the Hong Kong SAR Government. I.B.R. was supported by the Intramural Research Program of the National Library of Medicine at National Institutes of Health (US Department Health and Human Services). We thank Dr. Robert G. Webster at St. Jude Children's Research Hospital for providing the A/VN/1203/04 plasmids and the members of the HKU-Pasteur Research Pole and the Centre of Influenza Research for expert advice and helpful discussion.
Footnotes
Article published online ahead of print. Article and publication date are at http://www.rnajournal.org/cgi/doi/10.1261/rna.045369.114.
REFERENCES
- Adams WT, Skopek TR 1987. Statistical test for the comparison of samples from mutational spectra. J Mol Biol 194: 391–396. [DOI] [PubMed] [Google Scholar]
- Alonso J, Fort H 2010. Error catastrophe for viruses infecting cells: analysis of the phase transition in terms of error classes. Philos Trans A Math Phys Eng Sci 368: 5569–5582. [DOI] [PubMed] [Google Scholar]
- Babenko VN, Rogozin IB 1999. Application of the rank correlation coefficient for comparison of mutation spectra. Biofizika 44: 632–638. [PubMed] [Google Scholar]
- Benzer S 1961. On the topography of the genetic fine structure. Proc Natl Acad Sci 47: 403–415. [DOI] [PMC free article] [PubMed] [Google Scholar]
- Berikov VB, Rogozin IB 1999. Regression trees for analysis of mutational spectra in nucleotide sequences. Bioinformatics 15: 553–562. [DOI] [PubMed] [Google Scholar]
- Chen R, Quinones-Mateu ME, Mansky LM 2004. Drug resistance, virus fitness and HIV-1 mutagenesis. Curr Pharm Des 10: 4065–4070. [DOI] [PubMed] [Google Scholar]
- Chen H, Yuan H, Gao R, Zhang J, Wang D, Xiong Y, Fan G, Yang F, Li X, Zhou J, et al. 2014. Clinical and epidemiological characteristics of a fatal case of avian influenza A H10N8 virus infection: a descriptive study. Lancet 383: 714–721. [DOI] [PubMed] [Google Scholar]
- Coffey LL, Beeharry Y, Borderia AV, Blanc H, Vignuzzi M 2011. Arbovirus high fidelity variant loses fitness in mosquitoes and mice. Proc Natl Acad Sci 108: 16038–16043. [DOI] [PMC free article] [PubMed] [Google Scholar]
- Cooper DN, Youssoufian H 1988. The CpG dinucleotide and human genetic disease. Hum Genet 78: 151–155. [DOI] [PubMed] [Google Scholar]
- Coulondre C, Miller JH, Farabaugh PJ, Gilbert W 1978. Molecular basis of base substitution hotspots in Escherichia coli. Nature 274: 775–780. [DOI] [PubMed] [Google Scholar]
- Domingo E, Holland JJ 1997. RNA virus mutations and fitness for survival. Annu Rev Microbiol 51: 151–178. [DOI] [PubMed] [Google Scholar]
- Duffy S, Shackelton LA, Holmes EC 2008. Rates of evolutionary change in viruses: patterns and determinants. Nat Rev Genet 9: 267–276. [DOI] [PubMed] [Google Scholar]
- Eggington JM, Greene T, Bass BL 2011. Predicting sites of ADAR editing in double-stranded RNA. Nat Commun 2: 319. [DOI] [PMC free article] [PubMed] [Google Scholar]
- Elena SF, Carrasco P, Daròs JA, Sanjuán R 2006. Mechanisms of genetic robustness in RNA viruses. EMBO Rep 7: 168–173. [DOI] [PMC free article] [PubMed] [Google Scholar]
- Glazko GB, Milanesi L, Rogozin IB 1998. The subclass approach for mutational spectrum analysis: application of the SEM algorithm. J Theor Biol 192: 475–487. [DOI] [PubMed] [Google Scholar]
- Gutierrez RA, Viari A, Godelle B, Frutos R, Buchy P 2013. Biased mutational pattern and quasispecies hypothesis in H5N1 virus. Infect Genet Evol 15: 69–76. [DOI] [PMC free article] [PubMed] [Google Scholar]
- Heaton NS, Sachs D, Chen CJ, Hai R, Palese P 2013. Genome-wide mutagenesis of influenza virus reveals unique plasticity of the hemagglutinin and NS1 proteins. Proc Natl Acad Sci 110: 20248–20253. [DOI] [PMC free article] [PubMed] [Google Scholar]
- Hoffmann E, Neumann G, Kawaoka Y, Hobom G, Webster RG 2000. A DNA transfection system for generation of influenza A virus from eight plasmids. Proc Natl Acad Sci 97: 6108–6113. [DOI] [PMC free article] [PubMed] [Google Scholar]
- Holland J, Spindler K, Horodyski F, Grabau E, Nichol S, VandePol S 1982. Rapid evolution of RNA genomes. Science 215: 1577–1585. [DOI] [PubMed] [Google Scholar]
- Holmes EC 2009. The evolutionary genetics of emerging viruses. Annu Rev Ecol Evol Syst 40: 353–372. [Google Scholar]
- Horsfall MJ, Gordon AJ, Burns PA, Zielenska M, van der Vliet GM, Glickman BW 1990. Mutational specificity of alkylating agents and the influence of DNA repair. Environ Mol Mutagen 15: 107–122. [DOI] [PubMed] [Google Scholar]
- Khromov-Borisov NN, Rogozin IB, Pêgas Henriques JA, de Serres FJ 1999. Similarity pattern analysis in mutational distributions. Mutat Res 430: 55–74. [DOI] [PubMed] [Google Scholar]
- Krawczak M, Ball EV, Cooper DN 1998. Neighboring-nucleotide effects on the rates of germ-line single-base-pair substitution in human genes. Am J Hum Genet 63: 474–488. [DOI] [PMC free article] [PubMed] [Google Scholar]
- Kunkel TA 1985. The mutational specificity of DNA polymerases-α and -γ during in vitro DNA synthesis. J Biol Chem 260: 12866–12874. [PubMed] [Google Scholar]
- Kunkel TA, Soni A 1988. Mutagenesis by transient misalignment. J Biol Chem 263: 14784–14789. [PubMed] [Google Scholar]
- Lam TT, Wang J, Shen Y, Zhou B, Duan L, Cheung CL, Ma C, Lycett SJ, Leung CY, Chen X, et al. 2013. The genesis and source of the H7N9 influenza viruses causing human infections in China. Nature 502: 241–244. [DOI] [PMC free article] [PubMed] [Google Scholar]
- Martinez I, Melero JA 2002. A model for the generation of multiple A to G transitions in the human respiratory syncytial virus genome: predicted RNA secondary structures as substrates for adenosine deaminases that act on RNA. J Gen Virol 83(Pt 6): 1445–1455. [DOI] [PubMed] [Google Scholar]
- McAuley JL, Chipuk JE, Boyd KL, Van De Velde N, Green DR, McCullers JA 2010. PB1-F2 proteins from H5N1 and 20th century pandemic influenza viruses cause immunopathology. PLoS Pathog 6: e1001014. [DOI] [PMC free article] [PubMed] [Google Scholar]
- McCullers JA, Wang GC, He S, Webster RG 1999. Reassortment and insertion-deletion are strategies for the evolution of influenza B viruses in nature. J Virol 73: 7343–7348. [DOI] [PMC free article] [PubMed] [Google Scholar]
- Nei M, Gojobori T 1986. Simple methods for estimating the numbers of synonymous and nonsynonymous nucleotide substitutions. Mol Biol Evol 3: 418–426. [DOI] [PubMed] [Google Scholar]
- Nobusawa E, Sato K 2006. Comparison of the mutation rates of human influenza A and B viruses. J Virol 80: 3675–3678. [DOI] [PMC free article] [PubMed] [Google Scholar]
- Novella IS, Domingo E, Holland JJ 1995. Rapid viral quasispecies evolution: implications for vaccine and drug strategies. Mol Med Today 1: 248–253. [DOI] [PMC free article] [PubMed] [Google Scholar]
- O'Hara PJ, Nichol ST, Horodyski FM, Holland JJ 1984. Vesicular stomatitis virus defective interfering particles can contain extensive genomic sequence rearrangements and base substitutions. Cell 36: 915–924. [DOI] [PubMed] [Google Scholar]
- Parvin JD, Moscona A, Pan WT, Leider JM, Palese P 1986. Measurement of the mutation rates of animal viruses: influenza A virus and poliovirus type 1. J Virol 59: 377–383. [DOI] [PMC free article] [PubMed] [Google Scholar]
- Rajamani S, Ichida JK, Antal T, Treco DA, Leu K, Nowak MA, Szostak JW, Chen IA 2010. Effect of stalling after mismatches on the error catastrophe in nonenzymatic nucleic acid replication. J Am Chem Soc 132: 5880–5885. [DOI] [PMC free article] [PubMed] [Google Scholar]
- Rogozin IB, Kolchanov NA 1992. Somatic hypermutagenesis in immunoglobulin genes. II. Influence of neighbouring base sequences on mutagenesis. Biochim Biophys Acta 1171: 11–18. [DOI] [PubMed] [Google Scholar]
- Rogozin IB, Pavlov YI 2003. Theoretical analysis of mutation hotspots and their DNA sequence context specificity. Mutat Res 544: 65–85. [DOI] [PubMed] [Google Scholar]
- Rogozin IB, Kondrashov FA, Glazko GV 2001a. Use of mutation spectra analysis software. Hum Mutat 17: 83–102. [DOI] [PubMed] [Google Scholar]
- Rogozin IB, Pavlov YI, Bebenek K, Matsuda T, Kunkel TA 2001b. Somatic mutation hotspots correlate with DNA polymerase η error spectrum. Nat Immunol 2: 530–536. [DOI] [PubMed] [Google Scholar]
- Rogozin IB, Managadze D, Shabalina SA, Koonin EV 2014. Gene family level comparative analysis of gene expression in mammals validates the ortholog conjecture. Genome Biol Evol 6: 754–762. [DOI] [PMC free article] [PubMed] [Google Scholar]
- Rueda P, Garcia-Barreno B, Melero JA 1994. Loss of conserved cysteine residues in the attachment (G) glycoprotein of two human respiratory syncytial virus escape mutants that contain multiple A-G substitutions (hypermutations). Virology 198: 653–662. [DOI] [PubMed] [Google Scholar]
- Salomon R, Franks J, Govorkova EA, Ilyushina NA, Yen HL, Hulse-Post DJ, Humberd J, Trichet M, Rehg JE, Webby RJ, et al. 2006. The polymerase complex genes contribute to the high virulence of the human H5N1 influenza virus isolate A/Vietnam/1203/04. J Exp Med 203: 689–697. [DOI] [PMC free article] [PubMed] [Google Scholar]
- Sasadeusz JJ, Tufaro F, Safrin S, Schubert K, Hubinette MM, Cheung PK, Sacks SL 1997. Homopolymer mutational hot spots mediate herpes simplex virus resistance to acyclovir. J Virol 71: 3872–3878. [DOI] [PMC free article] [PubMed] [Google Scholar]
- Scholtissek C, Rohde W, Von Hoyningen V, Rott R 1978. On the origin of the human influenza virus subtypes H2N2 and H3N2. Virology 87: 13–20. [DOI] [PubMed] [Google Scholar]
- Smith GJ, Vijaykrishna D, Bahl J, Lycett SJ, Worobey M, Pybus OG, Ma SK, Cheung CL, Raghwani J, Bhatt S, et al. 2009. Origins and evolutionary genomics of the 2009 swine-origin H1N1 influenza A epidemic. Nature 459: 1122–1125. [DOI] [PubMed] [Google Scholar]
- Streisinger G, Okada Y, Emrich J, Newton J, Tsugita A, Terzaghi E, Inouye M 1966. Frameshift mutations and the genetic code. This paper is dedicated to Professor Theodosius Dobzhansky on the occasion of his 66th birthday. Cold Spring Harb Symp Quant Biol 31: 77–84. [DOI] [PubMed] [Google Scholar]
- Suspène R, Petit V, Puyraimond-Zemmour D, Aynaud MM, Henry M, Guetard D, Rusniok C, Wain-Hobson S, Vartanian JP 2011. Double-stranded RNA adenosine deaminase ADAR-1-induced hypermutated genomes among inactivated seasonal influenza and live attenuated measles virus vaccines. J Virol 85: 2458–2462. [DOI] [PMC free article] [PubMed] [Google Scholar]
- Taboga O, Tami C, Carrillo E, Núñez JI, Rodriguez A, Saiz JC, Blanco E, Valero ML, Roig X, Camarero JA, et al. 1997. A large-scale evaluation of peptide vaccines against foot-and-mouth disease: lack of solid protection in cattle and isolation of escape mutants. J Virol 71: 2606–2614. [DOI] [PMC free article] [PubMed] [Google Scholar]
- Tamura K, Peterson D, Peterson N, Stecher G, Nei M, Kumar S 2011. MEGA5: molecular evolutionary genetics analysis using maximum likelihood, evolutionary distance, and maximum parsimony methods. Mol Biol Evol 28: 2731–2739. [DOI] [PMC free article] [PubMed] [Google Scholar]
- Tenoever BR, Ng SL, Chua MA, McWhirter SM, Garcia-Sastre A, Maniatis T 2007. Multiple functions of the IKK-related kinase IKKε in interferon-mediated antiviral immunity. Science 315: 1274–1278. [DOI] [PubMed] [Google Scholar]
- Toth AM, Li Z, Cattaneo R, Samuel CE 2009. RNA-specific adenosine deaminase ADAR1 suppresses measles virus-induced apoptosis and activation of protein kinase PKR. J Biol Chem 284: 29350–29356. [DOI] [PMC free article] [PubMed] [Google Scholar]
- Tromas N, Elena SF 2010. The rate and spectrum of spontaneous mutations in a plant RNA virus. Genetics 185: 983–989. [DOI] [PMC free article] [PubMed] [Google Scholar]
- Tscherne DM, Garcia-Sastre A 2011. Virulence determinants of pandemic influenza viruses. J Clin Invest 121: 6–13. [DOI] [PMC free article] [PubMed] [Google Scholar]
- Ward SV, George CX, Welch MJ, Liou LY, Hahm B, Lewicki H, de la Torre JC, Samuel CE, Oldstone MB 2011. RNA editing enzyme adenosine deaminase is a restriction factor for controlling measles virus replication that also is required for embryogenesis. Proc Natl Acad Sci 108: 331–336. [DOI] [PMC free article] [PubMed] [Google Scholar]
- Webster RG, Bean WJ, Gorman OT, Chambers TM, Kawaoka Y 1992. Evolution and ecology of influenza A viruses. Microbiol Rev 56: 152–179. [DOI] [PMC free article] [PubMed] [Google Scholar]
- Wilson JB, Hayday A, Courtneidge S, Fried M 1986. A frameshift at a mutational hotspot in the polyoma virus early region generates two new proteins that define T-antigen functional domains. Cell 44: 477–487. [DOI] [PubMed] [Google Scholar]
- Wong KK, Bull RA, Rockman S, Scott G, Stelzer-Braid S, Rawlinson W 2011. Correlation of polymerase replication fidelity with genetic evolution of influenza A/Fujian/411/02(H3N2) viruses. J Med Virol 83: 510–516. [DOI] [PubMed] [Google Scholar]
- Yamada S, Matsumoto Y, Takashima Y, Otsuka H 2005. Mutation hot spots in the canine herpesvirus thymidine kinase gene. Virus Genes 31: 107–111. [DOI] [PubMed] [Google Scholar]
- Yen HL, Lipatov AS, Ilyushina NA, Govorkova EA, Franks J, Yilmaz N, Douglas A, Hay A, Krauss S, Rehg JE, et al. 2007. Inefficient transmission of H5N1 influenza viruses in a ferret contact model. J Virol 81: 6890–6898. [DOI] [PMC free article] [PubMed] [Google Scholar]
- Zahn RC, Schelp I, Utermöhlen O, von Laer D 2007. A-to-G hypermutation in the genome of lymphocytic choriomeningitis virus. J Virol 81: 457–464. [DOI] [PMC free article] [PubMed] [Google Scholar]
- Zavolan M, Kepler TB 2001. Statistical inference of sequence-dependent mutation rates. Curr Opin Genet Dev 11: 612–615. [DOI] [PubMed] [Google Scholar]