

Background: Elevated plasma levels of PlGF are associated with increased endothelin-1 and pulmonary hypertension (PH) in SCD.
Results: miR-199a2, which targets HIF-1α mRNA, located in host gene DNM3os is co-transcriptionally regulated by PPARα.
Conclusion: PPARα agonist induction of miR-199a2 reduced ET-1 levels.
Significance: PPARα agonist reduction of ET-1 levels via induced miR-199a2 provides an alternative strategy to ameliorate PH.
Keywords: Hypoxia-inducible Factor (HIF), MicroRNA (miRNA), Peroxisome Proliferator-activated Receptor (PPAR), Pulmonary Hypertension, Transcription, Endothelin-1, Sickle Cell Disease
Abstract
Endothelin-1, a potent vasoconstrictor, plays an important role in pulmonary hypertension (PH) in sickle cell disease (SCD). Our previous studies show that higher levels of placenta growth factor (PlGF), secreted by erythroid precursor cells, correlate with increased plasma levels of endothelin-1 (ET-1) and other functional markers of PH in SCD. PlGF-mediated ET-1 expression occurs via activation of hypoxia-inducible factor-1α (HIF-1α). However, relatively less is understood regarding how PlGF-mediated expression of HIF-1α and its downstream effector ET-1 are post-transcriptionally regulated. Herein, we show that PlGF treatment of endothelial cells resulted in reduced levels of miR-199a2, which targeted the 3′-UTR of HIF-1α mRNA and concomitantly led to augmented ET-1 expression. Plasma levels of miR-199a2 in SCD subjects were significantly lower with reciprocally high levels of plasma ET-1, unlike unaffected controls. This observation provided a molecular link between miR-199a2 and high levels of ET-1 in SCD. Furthermore, we show that miR-199a2 located in the DNM3os transcription unit was co-transcriptionally regulated by peroxisome proliferator-activated receptor α (PPARα). Binding of the latter to PPARα cis-elements in the promoter of DNM3os was demonstrated by promoter mutational analysis and ChIP. Additionally, we show that fenofibrate, a PPARα agonist, increased the expression of miR-199a2 and DNM3os; the former was responsible for reduced expression of HIF-1α and ET-1. In vivo studies of fenofibrate-fed Berkeley sickle mice resulted in increased levels of miR-199a2 and reduced levels of ET-1 in lung tissues. Our studies provide a potential therapeutic approach whereby fenofibrate-induced miR-199a2 expression can ameliorate PH by reduction of ET-1 levels.
Introduction
Endothelin and nitric oxide are two opposing vasoactive factors that regulate vascular tone. In blood vessels, the endothelin system plays an important role in basal vasoconstriction and participates in the pathology of diseases such as hypertension, cardiovascular disease, and atherosclerosis (1, 2). In the lungs, the endothelin system controls the tonicity of both blood vessels and airways and is involved in the development of pulmonary hypertension (PH).4 PH occurs in 10–30% of patients with sickle cell disease (SCD) and is associated with higher incidence of mortality in adults (3–5). A number of factors, such as chronic hemolysis, hypoxia, hemostatic activation, and inflammation have been implicated in endothelial dysfunction, pulmonary vasoconstriction, and remodeling in PH in SCD (3, 5–10). Reduced bioavailability of nitric oxide caused by quenching of NO by extracellular hemoglobin (11–14) and increased levels of endothelin-1 (ET-1) have been implicated in PH in SCD (15, 16).
The endothelins are a family of small peptides that include ET-1, ET-2, and ET-3 and are produced primarily by vascular endothelial cells and to a lesser extent by vascular smooth muscle cells, airway epithelial cells, macrophages, and fibroblast cells (17). ET-1 expression is induced by hypoxia subsequent to HIF-1α activation (18). We showed that placenta growth factor (PlGF) induces the expression of ET-1 in cultured human pulmonary microvascular endothelial cells via activation of hypoxia inducible factor (HIF-1α), independently of hypoxia (19). Placenta growth factor is elaborated from bone marrow erythroid cells, and its levels are significantly increased in patients with chronic hemolytic anemia, including SCD, because of a compensatory erythroid hyperplastic response (20). Moreover, our studies show elevated PlGF levels in Berkeley sickle (BK-SS) mice and SCD patients are associated with increased levels of ET-1 and clinical markers of pulmonary hypertension (16). These studies clearly indicate the importance of PlGF in regulation of ET-1 and its role in PH in SCD.
We previously showed reduced expression of miR-30c and miR-301a in human pulmonary microvascular endothelial cells, in response to PlGF (21). These miRNAs target the 3′-UTR of PAI-1 mRNA and are implicated in regulating the steady state level of this mRNA under basal conditions (21). Others have shown participation of miR-199a as a post-transcriptional regulator of HIF-1α under hypoxia for cell proliferation of non-small cell lung cancer cells (22). However, the regulation of miR-199a availability in the context of SCD has not been previously studied, especially in the absence of hypoxia (19, 22). This type of post-transcriptional regulation would be expected to directly affect downstream HIF-1α-dependent gene expression events.
In the present study, we show that PlGF reduced miR-199a2 levels in cultured human endothelial cells and that miR-199a2 targets the HIF-1α 3′-UTR for turnover. The miR-199a2 precursor is transcribed as a Dynamin-3 opposite strand (DNM3os) RNA polymerase II transcript as previously shown for the mouse DNM3 locus (23). The human DNM3os transcript is also predicted to include miR-214 in the same transcription unit (24). Our studies for the first time show that DNM3os and premiR-199a2 transcription was co-regulated by PPARα. Moreover, PPARα agonist augmented the expression of premiR-199a2 and concomitantly attenuated the activation of HIF-1α, thus reducing the expression of ET-1 in cultured endothelial cells. It is pertinent to note that Staels and co-workers (25) showed that the PPARα agonist fenofibrate attenuated ET-1 expression in endothelial cells by increasing expression of transcriptional repressor Kruppel-like factor 11 (KLF11) and its binding to the ET-1 gene promoter. In our studies, fenofibrate acted to increase transcription from the DNM3os locus leading to higher miR-199a2 expression with a resultant decline of HIF-1α activity and subsequent reduction of ET-1 transcription.
These studies were corroborated in SCD patients, wherein we observed significantly reduced plasma levels of miR-199a-5p, indicating that decreased levels of miR-199a-5p contributed to increased levels of HIF-1α and its regulated gene, i.e. ET-1. We also showed that feeding fenofibrate diet to wild type C57BL/6NJ mice and Berkeley sickle mice augmented expression of miR-199a2, which resulted in reduced levels of ET-1 in lungs of both wild type and sickle mice. These studies elucidated a novel molecular pathway linking up-regulation of miR-199a2 to reduction of ET-1, thus providing a rationale for a therapeutic approach to attenuate ET-1 levels and ameliorate pulmonary hypertension in SCD.
EXPERIMENTAL PROCEDURES
Reagents
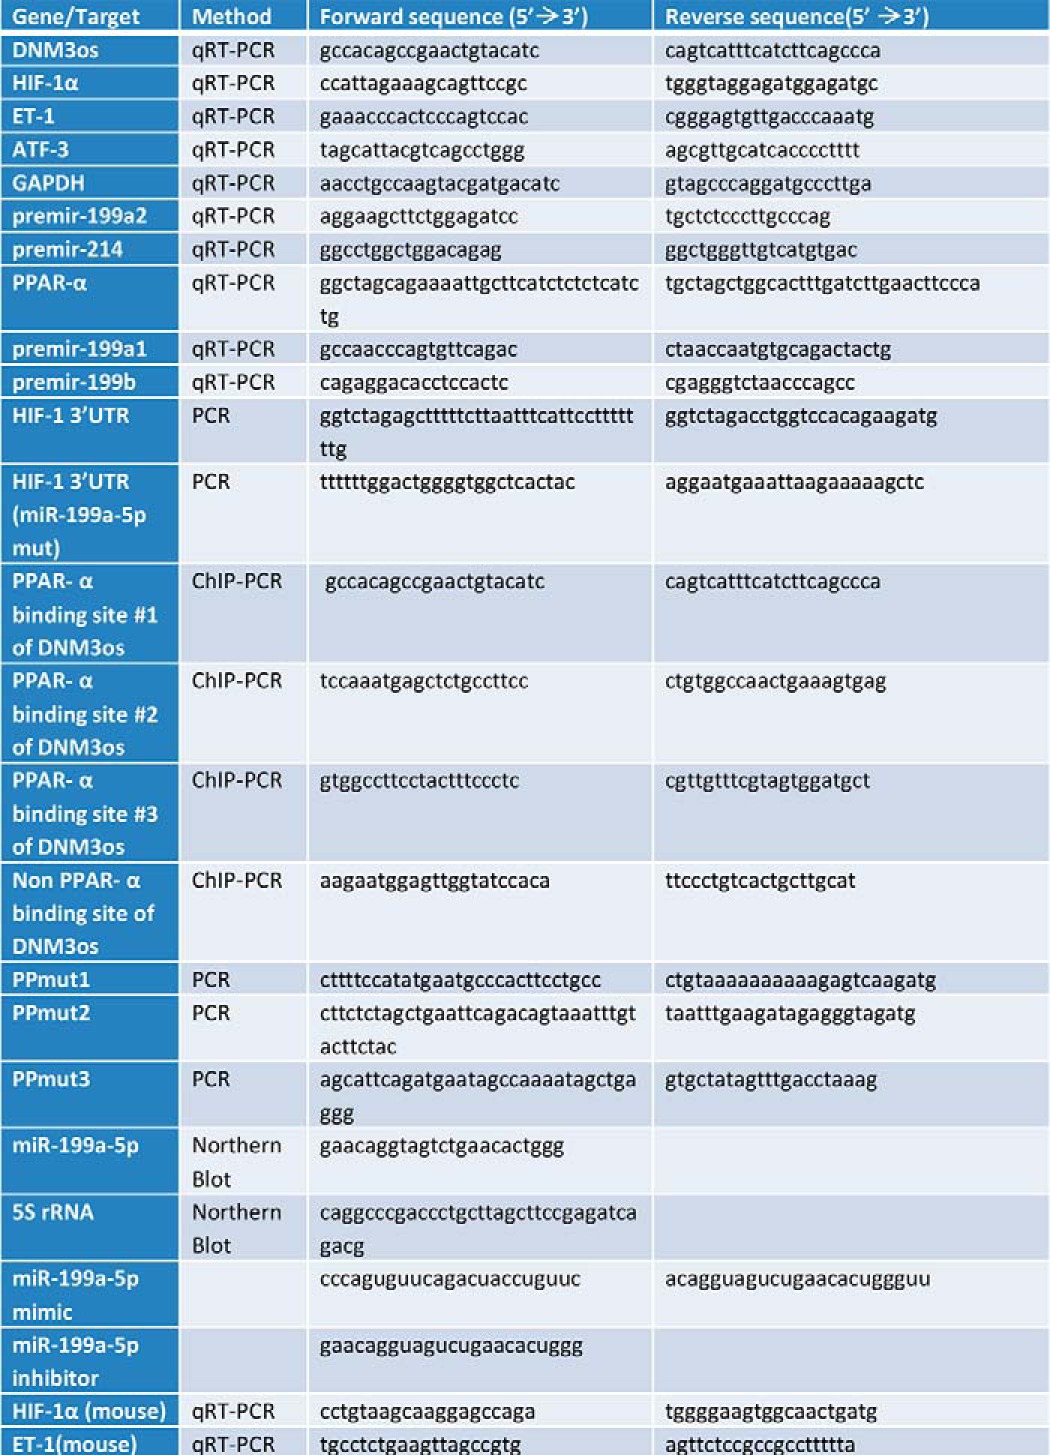
Recombinant human PlGF was purchased from Peprotech (Rocky Hill, NJ). Clofibrate, fenofibrate, and GW 6471 were obtained from Sigma-Aldrich. Primary antibodies against PPARα, HIF-1α, and secondary antibodies conjugated to HRP were purchased from Santa Cruz Biotechnology (Santa Cruz, CA). Antisense oligonucleotides (antagomirs) and miR-199a2 mimics were obtained from Shanghai Genepharma (Shanghai, China), and their sequences are indicated in Table 1. The miR-199a2 overexpression vector was obtained from Genescript (Piscataway, NJ).
TABLE 1.
Oligonucleotide primers used in this study
Human Subjects and Mice
All blood samples were obtained from children with homozygous SCA at steady state (absence of sickle cell related acute event for 3 weeks prior to blood draw) at their elective clinical visit for routine check-up and clinical blood draws. Blood samples were obtained with the informed consent of the patient or parent/legal guardian using Institutional Review Board-approved protocols through the Repository for Non-Malignant Hematology Specimens at Cincinnati Children's Hospital Medical Center. Plasma samples from the same SCD patients and their unaffected sibling controls subjects were collected and stored at −80 °C until assayed. Animal protocols were approved by the Institutional Animal Care and Use Committee at Cincinnati Children's Hospital Medical Center. BK-SS mice originally obtained from Jackson Laboratories were bred up to the sixth generation against a C57BL/6NJ background. BK-SS mice carry deletions for the mouse α- and β-globin genes and carry a transgene expressing the human α-globin and a mini β-globin cluster including β-sickle globin (26, 27). In-house bred C57BL/6NJ animals served as controls. Six to ten animals per group were used for feeding. Five-week-old C57BL/6NJ and BK-SS mice were fed with either Mod Test Diet 59M3 (referred to as sickle cell mouse diet) from Purina (Richmond, IN) or the same diet supplemented with 0.05% (w/w) fenofibrate for 10 weeks. At the end of the study, the mice were exsanguiated, and the lungs were removed; tissues were stored at −80 °C for later assay of miRs and ET-1.
Endothelial Cell Culture
The immortalized human dermal microvascular endothelial cells, HMEC-1, originally developed by Drs. Edwin Ades and Francisco J. Candall (Centers for Disease Control and Prevention), and Dr. Thomas Lawley (Emory University), were obtained from the Centers for Disease Control and Prevention (Atlanta, GA). HMEC-1 cells were cultured in RPMI 1640 medium containing 10% FBS, heparin, endothelial cell mitogen, and MEM vitamins as previously described (28). Human lung microvascular endothelial cells (HLMVEC) were obtained as primary cell cultures at passage two from Cell Applications (San Diego, CA). HLMVEC were grown in microvascular endothelial cell medium (Cell Applications, San Diego, CA) according to the vendor's instructions. These cells display an endothelial cell phenotype and are positive for PECAM-1 (CD31) and von Willebrand factor. HLMVEC are used up to passages 8 and 9 without undue effect on morphology or experimental outcome. Unless otherwise specified, HLMVEC and HMEC cells were kept overnight in complete medium (without growth factors) containing 2% FBS, followed by serum-free medium for 3 h, before treatment with either PlGF (250 ng/ml) or other experimental conditions (29).
Sorting of Endothelial Cells from Lung Tissue
Freshly isolated lungs minced in DMEM/DNase medium containing 1 mg/ml dispase/collagenase (Roche Diagnostics) were incubated at 37 °C on a rotary shaker for 45 min. Red cells were lysed using a blood cell lysis buffer (BD PharmLyse, BD Biosciences) as described (30). Lung single cell suspensions were co-stained with CD31 and CD45 antibodies (BD Biosciences), and CD31+ cells were sorted out of the CD45 cell population. CD31+ cells were collected for isolation of mRNA by TRIzol reagent (Invitrogen).
RNA Interference
The shRNA clones were a generous gift from Dr. Jae Jung (USC). The human shRNA library was purchased from Open Biosystems (now Thermo Scientific, Grand Island, NY). All synthetic shRNAs were supplied in a pGIPZ lentivector for transfection. The PPARα shRNA (clone 0197-0066-G8) sequence is as follows: TGCTGTTGACAGTGAGCGCCGATCAAGTGACATTGCTAAATAGTGAAGCCACAGATGTATTTAGCAATGTCACTTGATCGTTGCCTACTGCCTCGGA.
Transient Transfections
1 × 10⁶ HMEC-1 cells were transfected with shRNA plasmid (1 μg), luciferase reporter plasmid (1 μg), and either miR-199a2 mimics or inhibitors (90 pmol) by nucleofection, utilizing RPMI 1640 as the transfection solution and program Y-001 on the Amaxa Nucleofector (Lonza, Allendale, NJ). The transfection was highly effective in the absence of nucleofection agent (31). Transfected cells were transferred to complete medium and incubated overnight. The cells were kept in serum-free medium for 3 h prior to treatment with PlGF (250 ng/ml).
Luciferase Reporter Vectors
A 2-kb segment containing the DNM3os promoter was amplified by PCR, utilizing a BAC clone as the template (BACPAC Resource Center, Oakland, CA; clone RP11-455 O13), and the resulting PCR product was ligated into pGL3-Basic luciferase reporter vector as per manufacturer's instructions (Promega, Madison, WI). The subcloned wild type 2-kb DNM3os promoter was used as a template for generating mutations at specific sites. The mutations in three PPARα sites were generated with the Q5 site-directed mutagenesis kit (New England Biolabs, Ipswich, MA) utilizing primers listed in Table 1. The three PPARα mutations are designated as PPmt1 (bases −216/-206), PPmt2 (−317/−307) and PPmt3 (−789/−779). Double mutations in the PPmt1 and PPmt2 sites were created starting from the PPmt1 construct as template. The 684-bp HIF-1α 3′-UTR luciferase reporter construct (3′-UTR positions +1 to +684) was cloned using primers listed in Table 1, and the PCR product was ligated into XbaI cut pGL3-Control vector. Mutations within the miR-199a2 binding sites in the HIF-1α 3′-UTR were generated using the Q5 site-directed mutagenesis kit and primers listed in Table 1. All constructs and sequence mutations were verified by DNA sequencing (Retrogen, San Diego, CA).
Isolation of RNA and Quantitative PCR
Total RNA was isolated from cells using TRIzol reagent (Invitrogen). mRNA expression was quantified using specific primers (Table 1) by quantitative real time PCR (qRT-PCR). qRT-PCRs of mRNA templates (100 ng) were performed using the One-Step SYBR PrimeScript Kit (Clontech) and the ABI Prism 7900HT sequence detection system (Applied Biosystems, Foster City, CA). Amplification was carried out as follows: step 1: reverse transcription, 42 °C for 5 min, 95 °C for 10 s; and step 2: PCR reaction (40 cycles), 95 °C for 5 s, 60 °C for 34 s, followed by detection. The values are expressed as relative levels of RNA normalized to the mRNA levels of the housekeeping gene GAPDH. Relative quantification of the mRNA levels was calculated using 2−ΔΔCt by the comparative threshold cycle method (Ct), where ΔΔCt = (Ct of target gene of treated sample − Ct of GAPDH mRNA of treated sample) − (Ct of target gene of untreated sample − Ct of GAPDH mRNA of untreated sample) (29).
Isolation and Quantification of miRNAs
microRNAs were purified utilizing the mirVana isolation kit (Invitrogen) according to the manufacturer's protocol. miRNA expression levels were determined by using the TaqMan MicroRNA assay kits for indicated miRNA (Invitrogen), according to the manufacturer's instructions (21). miRNA expression was quantified by qRT-PCR, and expression levels were normalized to a reference gene, RNU6B (U6 snRNA) (21) using the comparative threshold cycle method (Ct). miRNAs were also quantified by Northern blot analysis. Briefly, 35 μg of total RNA was run on a 15% nondenaturing polyacrylamide gel. The RNA was transferred to a Biodyne B nylon membrane. The membrane was cross-linked under UV light and prehybridized for 30 min using the UltraHyb hybridization buffer (Ambion, Grand Island, NY) at 42 °C. The membrane was then hybridized with biotin-labeled probes for miR-199a2 and 5 S rRNA, synthesized at Valugene (San Diego, CA) at 65 °C overnight. The membrane was washed twice in washing buffer (Thermo Scientific, Rockford, IL), followed by blocking with 5% nonfat milk in PBS at room temperature. Streptavidin-HRP (1:250 dilution) was added to the membrane and incubated at room temperature for 3 h, followed by two washes with washing buffer according to the vendor's instructions. The membranes were developed utilizing Clarity Western ECL substrate (Bio-Rad), and the resulting images were quantified using the ImageJ analysis software.
Western Blot Analysis
Cells were lysed in radioimmune precipitation assay buffer, and 25 μg of protein extracts were subjected to SDS-PAGE, followed by electrophoretic transfer, Western blotting, and chemiluminescence detection of bound antibody, as previously described (32). Membranes were probed with indicated dilutions of anti-HIF-1α (1:250, sc-12542; Santa Cruz Biotechnology), anti-PPARα (1:250, sc-9000; Santa Cruz Biotechnology), anti-ET-1 (1:250; Santa Cruz Biotechnology), and HRP-conjugated anti-goat or anti-rabbit secondary antibodies (1:10,000; Sigma-Aldrich). Membranes were stripped and reprobed with anti-β-actin (1:10,000; Sigma Aldrich). Quantitative analysis was performed using the ImageJ analysis software.
Quantification of Secreted ET-1
HMEC-1 cells (1 × 10⁵ cells) were transfected with indicated miRNA or sc-miRNA (90 pmol) in complete medium and incubated at 37 °C for 24 h. The cells were washed with serum-free medium (SFM) and incubated for 3 h in SFM (2 ml). Treatments were begun by replacement of SFM with fresh SFM (1 ml). Cells were treated with either PlGF (250 ng/ml) or fenofibrate (0.1 mm) overnight. The culture supernatant was collected, and an aliquot (0.1 ml) was assayed for ET-1 release using an ELISA kit (Assay Design/Enzo Life Sciences, Farmingdale, NY) (19). The cells were isolated by scraping, and the pellet was assayed for protein content utilizing the Bradford method. Plasma specimen ET-1 levels were determined using DuoSet ELISA kit from R&D Systems (Minneapolis, MN).
ChIP Assay
HMEC-1 cells (5 × 10⁶ cells) cultured in 150-mm Petri dishes were kept in SFM for 3 h and treated with fenofibrate (0.1 mm) or fenofibrate + GW6471 (5 μm) for 2 h. ChIP analysis was performed using antibody to PPARα (Santa Cruz Biotechnology) (29). Briefly, immunoprecipitated DNA was air-dried and resuspended in nuclease-free water. DNA samples were subjected to PCR amplification utilizing primers for the DNM3os promoter regions of interest corresponding to PPARα binding sites (Table 1). PCR was performed for 35 cycles under the following conditions: denaturation at 95 °C for 30 s, annealing at 55 °C for 60 s, and extension at 72 °C for 2 min. The PCR products were subjected to electrophoresis on a 2% agarose gel, visualized by ethidium bromide staining, and quantified using the ImageJ analysis software.
Statistical Analysis
The significance between two groups was ascertained using an unpaired Student's t test, and results are presented as means ± S.E. (*, p < 0.05; **, p < 0.01; ***, p < 0.001; and ns (not significant), with p > 0.05).
RESULTS
Interaction of miR-199a-5p with the 3′-UTR of HIF-1α mRNA Modulates HIF-1α mRNA Levels
Previous studies show treatment of endothelial cells with PlGF induces HIF-1α (19). Furthermore, PlGF was found to attenuate the expression of miR-199a-5p by 10-fold (48). A predicted miRNA recognition element (MRE) for miR-199a-5p is located within nucleotides +16 to +38 of the 3′-UTR of HIF-1α mRNA as shown in the schematic (Fig. 1A). For these reasons, we examined the binding of miR-199a-5p to its target sequence in a luciferase reporter (pGL3-HIF-1α-3′-UTR; shown in Fig. 1B) in response to PlGF. Upon co-transfection of pGL3-HIF-1α-3′-UTR with exogenous miR-199a-5p mimic, we observed ∼50% decrease in luciferase activity, compared to control (Fig. 1C, lane 2 versus lane 1). Co-transfection of the reporter with anti-miR-199a-5p antagonized endogenous miR-199a-5p, as indicated by ∼90% increase in luciferase activity (Fig. 1C, lane 3 versus lane 1). Transfection of HMEC-1 cells with scrambled (sc) mimic or sc inhibitor did not change luciferase activity (Fig. 1C, lanes 4 and 5 versus lane 1).
FIGURE 1.

PlGF attenuates miR-199a2–5p expression, which targets the 3′-UTR of HIF-1α mRNA. A, schematic representation of miR-199a2–5p location in 3′-UTR of HIF-1α mRNA. B, schematic representation of the HIF-1α-3′-UTR reporter plasmid. The region between bases +1 and +684 of the HIF-1α 3′-UTR containing the predicted target site for miR-199a2 was inserted at the 3′-end of luciferase reporter gene in pGL3-Control plasmid. C and D, HMEC cells were transfected with HIF-1α-3′-UTR reporter plasmid with indicated miR-mimic, anti-miR, sc miR (negative control), or sc-anti-miR (negative control). After 24 h, the cells were either treated with PlGF, as indicated, and cell lysates were assayed for luciferase activity. E, schematic of mutation in miR-199a2 MRE in 3′-UTR of HIF-1α mRNA. Asterisks indicate mutated bases. F, HMEC cells were transfected with wild type HIF-1α-3′-UTR plasmid or the indicated mutant HIF-1α 3′-UTR plasmid, with the indicated miR or anti-miR. All luciferase reporters were co-transfected with Renilla reporter plasmid for normalization of transfection efficiency. The data are means ± S.E. for n = 3. ns, not significant.
Because PlGF treatment of endothelial cells down-regulated endogenous miR-199a-5p levels, exogenous miR-199a-5p under these conditions would be expected to attenuate the expected increase of HIF-1α expression. Indeed, co-transfection of pGL3-HIF-1α-3′-UTR with miR-199a-5p followed by PlGF treatment resulted in ∼100% decrease in luciferase reporter activity (Fig. 1D, lane 3 versus lane 2). The primary effect was attributed to the exogenous miR-199a-5p because transfection with anti-miR-199a-5p alone had no effect on luciferase activity consistent with down-regulation of endogenous miR-199a in PlGF-treated cells (Fig. 1D, lane 4 versus lane 2). Cells transfected with sc mimic or inhibitor did not affect reporter activity compared to PlGF-treated cells (Fig. 1D, lanes 5 and 6 versus lane 2). Next, we examined whether the miR-199a-5p site in the HIF-1α 3′-UTR was responsible for the reduction in reporter luciferase activity. We mutated the miR-199a-5p MRE in pGL3-HIF-1α-3′-UTR as indicated in the schematic (Fig. 1E). As shown in Fig. 1F, mutation of the miR-199a-5p MRE reversed the reduction of reporter luciferase activity under noninduced conditions (Fig. 1F, lane 2 versus lane 1). The HIF-1α 3′-UTR mt, which ablated the miR-199a-5p MRE, did not show any change in luciferase activity upon co-transfection with either miR-199a-5p or anti-miR-199a-5p (Fig. 1F, lane 3 versus lane 2 and lane 4 versus lane 2). Taken together, these data are consistent with miR-199a-5p binding to its predicted target site in the 3′-UTR of HIF-1α mRNA for the purpose of modulating HIF-1α synthesis via mRNA turnover.
miR-199a-5p Modulates ET-1 mRNA Expression via Its Effect on the Levels of HIF-1α
Because the MRE for miR-199a-5p was confirmed in the 3′-UTR of HIF-1α mRNA, we examined the effects of exogenous miR-199a-5p and anti-miR-199a-5p on endogenous HIF-1α mRNA levels. Transfection with miR-199a-5p mimic reduced basal HIF-1α mRNA by ∼75%, and conversely, anti-miR-199a-5p effectively antagonized endogenous miR-199a-5p resulting in ∼2-fold increase in HIF-1α mRNA (Fig. 2A). Transfection with sc miR mimic and sc miR inhibitor did not affect basal HIF-1α mRNA expression (Fig. 2A). As a control, transfection with miR-199a-3p mimic did not affect HIF-1α mRNA levels in the presence or absence of PlGF (data not shown).
FIGURE 2.

miR-199a targets the 3′-UTR of HIF-1α mRNA affecting expression of downstream target gene ET-1. HMEC cells were transfected with indicated miR, anti-miR, sc-miR (negative control), and sc-anti-miR (negative control). 24 h post-transfection, the cells were treated with PlGF for 6 h where indicated. RNA and protein were isolated from separately treated cells. mRNA was quantified by qRT-PCR (A–D), and Western blots were performed for HIF-1α (E) and ET-1 (F). β-Actin immunodetection was used for normalization of protein loading. The mRNA data are means ± S.E. for n = 3, whereas the Western blots are representative of three independent experiments. G and H, Northern blotting for quantitation of miR-199a-5p. HMEC cells were transfected with miR-199a mimic, anti-miR-199a, or sc mimic at 90 pmol for 24 h, followed by extraction and quantification of miR-199a-5p by Northern blotting. The data are representative of three independent experiments. ns, not significant.
Previously we showed that PlGF induces ET-1 mRNA and protein expression via activation of HIF-1α, independently of hypoxia (19). Because miR-199a-5p affected HIF-1α mRNA levels, we examined whether HIF-1α dependent ET-1 expression was negatively affected as well. As expected, exogenous miR-199a-5p indirectly attenuated basal levels of ET-1 mRNA (Fig. 2B, lane 2 versus lane 1), whereas anti-miR-199a-5p augmented ET-1 mRNA expression by ∼1.6-fold (Fig. 2B, lane 3 versus lane 1) under noninduced conditions. The 3′-UTR of ET-1 mRNA has no miR-199a-5p MRE(s); thus, these data are consistent with miR-199a-5p indirectly affecting ET-1 mRNA expression by reducing HIF-1α synthesis at the level of mRNA translation.
Effect of miR-199a-5p Mimics and Anti-miR-199a-5p on PlGF-mediated Expression of HIF-1α and ET-1 mRNAs
Since PlGF-mediated HIF-1α expression augments ET-1 expression (19), we examined the role of miR-199a-5p in the expression of HIF-1α and ET-1 mRNAs. As shown in Fig. 2C, transfection of miR-199a-5p mimic in HMEC cells followed by PlGF treatment resulted in ∼65% reduction in HIF-1α mRNA level compared with PlGF-treated cells (Fig. 2C, lane 3 versus lane 2). Conversely, transfection with anti-miR-199a-5p restored HIF-1α mRNA expression over and above that seen in PlGF-treated cells (Fig. 2C, lane 4 versus lane 2). The effects of sc mimic and sc inhibitor were not significantly different from PlGF-treated cells (Fig. 2C, lanes 5 and 6 versus lane 2). Transfection of miR-199a-5p mimic in the presence of PlGF attenuated ET-1 mRNA expression by∼75% as expected for miR-199a-5p directed reduction of HIF-1α expression (Fig. 2D, lane 3 versus lane 2). Conversely, anti-miR-199a-5p did not significantly alter ET-1 mRNA levels compared with PlGF treatment alone (Fig. 2D, lane 4 versus lane 2). Both negative controls, sc miR and sc anti-miR, had no effect on PlGF-mediated ET-1 mRNA expression (Fig. 2D, lanes 5 and 6 versus lane 2). Moreover, PlGF-mediated HIF-1α protein expression was completely attenuated by miR-199a-5p mimic (Fig. 2E, lane 3 versus lane 2), whereas negative control, sc miR mimic had modest or no effect on HIF-1α protein levels (Fig. 2E, lane 4 versus lane 2). Additionally, PlGF-mediated ET-1 protein expression was reduced by miR-199a-5p mimic (Fig. 2F, lane 3 versus lane 2), whereas the effect of sc miR mimic on ET-1 protein was modest (Fig. 2F, lane 4 versus lane 2). Furthermore, the effect of transfection of miR-199a-5p mimic and anti-miR199a-5p in HMEC cells on intracellular levels of miR-199a was quantitated by Northern blot. Transfection of exogenous miR-199–5p augmented the endogenous level of miR-199a (Fig. 2G), whereas exogenous anti-miR199a reduced intracellular levels of miR-199a (Fig. 2H). These results confirmed that the observed effects of exogenous miR-199a-5p occurred by augmenting or reducing corresponding levels of the endogenous miR-199a. Furthermore, these data showed miR-199a-5p mimic attenuated PlGF-induced expression of both HIF-1α mRNA and protein and subsequently reduced ET-1 mRNA and protein expression.
PlGF Attenuates Expression of DNM3os, premiR-199a2, and premiR-214 mRNA
Previous studies (33) show that murine miR-199a2/miR-214 cluster is located in the reverse strand of Dynamin 3 (DNM3), referred to as Dynamin 3 opposite strand (DNM3os). The mouse transcription unit for DNM3os includes both miRNA precursors in a ∼6-kb primary transcript (23). Similarly, the human DNM3os gene as depicted in Fig. 3A also produces a transcript that includes premiR-199a2 and premiR-214 (not shown). Furthermore, in silico analysis revealed that mature miR-199a-5p and miR-199a-3p also originate from premiR-199a1 as an opposite strand transcript arising from an intron of DNM2 (Fig. 3A). The miRNA encoded by miR-199b is similar in nucleotide sequence to those encoded by miR-199a1 and miR-199a2 but has a different seed sequence (Fig. 3A). By contrast, the latter two miRNA genes produce identical, mature miRNAs, hence the name miR-199a. To establish the origin of miR-199a-5p in these studies, it became necessary to examine the pattern of expression for premiR-199a1, premiR-199a2, and premiR-199b, in response to PlGF.
FIGURE 3.
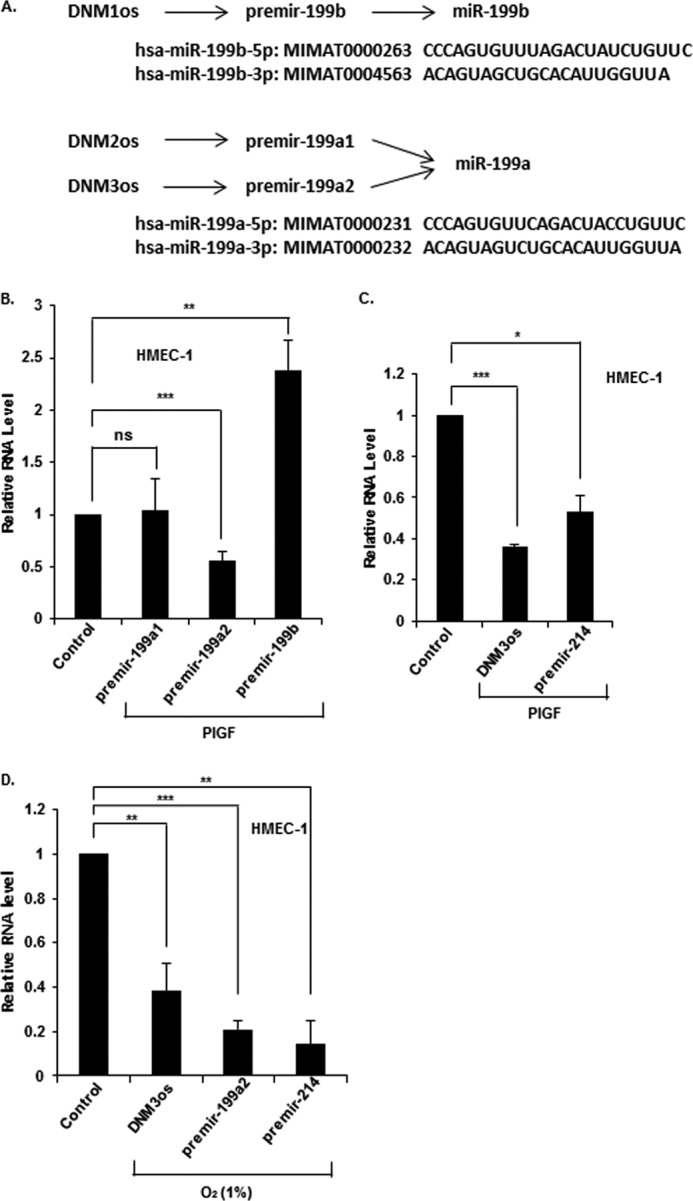
PlGF attenuates expression of miR-199a2 and its host gene DNM3os in endothelial cells. A, summary of premirs and miRNA sequences originating from DNM1os, DNM2os, and DNM3os loci, respectively. B and C, HMEC cells were treated with PlGF for 2 h, and expression levels of the indicated premirs were determined in extracted RNA by qRT-PCR. D, HMEC cells were exposed to hypoxia (1% O2) for 24 h, followed by extraction of RNA for qRT-PCR analysis of indicated premirs and DNM3os. The data represent means ± S.E. for n = 3. ns, not significant.
Following PlGF treatment of HMEC cells, we observed ∼50% reduction of premiR-199a2 with no change in premiR-199a1 expression (Fig. 3B). In contrast, premiR-199b expression increased by ∼2-fold (Fig. 3B). These data showed that PlGF selectively reduced expression of premiR-199a2, which we concluded was the major precursor of mature miR-199a-5p under these conditions. Next, we examined whether premiR-199a2–5p and premiR-214, also located in DNM3os, were co-expressed during DNM3os transcription. Treatment of HMEC cells with PlGF for 6 h showed ∼60% decrease in the expression of DNM3os RNA (Fig. 3C) and a concomitant decrease in the expression of premiR-199a2 (Fig. 3B) and premiR-214 (Fig. 3C).
HIF-1α is activated by different types of stress (34, 35). In an effort to determine whether other activators of HIF-1α were operative in transcriptional regulation of DNM3os, we asked whether hypoxia had such an effect. Hypoxic stress stabilizes HIF-1α protein; thus, we examined whether this stimulus also modulated expression of DNM3os RNA, premiR-199a2, and premiR-214. Exposure of HMEC cells to hypoxia (1% O2) for 16 h reduced the expression of DNM3os RNA, premiR-199a2, and premiR-214 (Fig. 3D). These results showed that both PlGF-mediated signaling and hypoxia attenuated transcription of DNM3os, premiR-199a2, and premiR-214 in a coordinated manner. Hereafter, miR-199a-5p is designated as miR-199a2 in the text.
DNM3os Transcription Is Regulated through PPARα
Bioinformatic analysis of the ∼2 kb 5′-flanking region of human DNM3os (NCBI Gene ID 100628315) revealed the presence of three PPARα binding sites, relative to the transcription start site, as shown in the promoter schematic (Fig. 4A). The involvement of PPARα in DNM3os transcription was established by transfection of HMEC-1 cells with PPARα shRNA. The latter reduced PPARα mRNA by more than 60% (Fig. 4B) with a corresponding reduction of protein by 90% (Fig. 4C). The effect of PPARα shRNA on DNM3os transcription resulted in ∼80% reduction of overall DNM3os transcription and concomitant ∼90% reduction in premiR-199a2 and ∼70% reduction in premiR-214 (Fig. 4D). Taken together, these data were consistent with PPARα participation in basal transcription of DNM3os, premiR-199a2, and premiR-214.
FIGURE 4.

PPARα regulates the transcription of miR-199a2 and its host gene DNM3os. A, schematic representation of PPARα cis-binding elements in promoter of DNM3os. B–F, HMEC cells were either transfected with PPARα shRNA (24 h) or treated with indicated agents for 4 h. RNA and protein were separately isolated from parallel cultures. RNA was subjected to qRT-PCR for indicated premirs, DNM3os, PPARα, and mature miR199a2. The data represent means ± S.E. for n = 3. B and C, effect of transfected PPARα shRNA on expression of PPARα mRNA (B) and PPARα protein (C). D, effect of transfection of HMEC cells with PPARα shRNA on expression of DNM3os, premir-199a2, and premir-214. E and F, effect of PPARα agonist and antagonist on PPARα mRNA levels (E) and PPARα protein (F). Western blot was performed on total cellular extracts with antibody to PPARα, and β-actin was used as a loading control. Western blot is representative of three independent experiments. G, effect of PPARα agonist and antagonist on RNA levels of DNM3os, premir-199a2, and premir-214. H, effect of PPARα agonist and antagonist on mature miR-199a-5p levels in HMEC cells. I, Northern blot for miR-199a2 expression in HMEC cells treated with either PlGF or fenofibrate. J, effect of PPARα and PPARγ agonist on DNM3os RNA levels. The data are representative of three independent experiments. ns, not significant.
A secondary approach was employed to establish the participation of PPARα in DNM3os transcription. PPARα activity can be modulated by pharmacological agonists such as fenofibrate and clofibrate (36). Treatment of HMEC-1 cells with fenofibrate showed a time-dependent increase in PPARα mRNA levels, which peaked between 4 and 8 h (data not shown). Fenofibrate treatment of HMEC-1 cells for 4 h, in the absence of PlGF, resulted in ∼4-fold increase in PPARα mRNA level (Fig. 4E, lane 2 versus lane 1). Treatment of HMEC-1 cells with the antagonist GW6471 inhibited fenofibrate-induced PPARα mRNA expression (Fig. 4E, lane 3 versus lane 2). Treatment of HMEC-1 cells with clofibrate, another PPARα agonist, showed a 2.5-fold increase in PPARα mRNA (Fig. 4E, lane 4 versus lane 1), which was attenuated to the basal level by GW6471 (Fig. 4E, lane 5 versus lane 4). The actions of PPARα agonists and antagonists were also reflected in the corresponding PPARα protein levels (Fig. 4F). Fenofibrate treatment of HMEC-1 cells increased DNM3os RNA expression by ∼4.5-fold (Fig. 4G, lane 2 versus lane 1), which was attenuated by ∼90% in the presence of GW6471 (Fig. 4G, lane 3 versus lane 2). Furthermore, clofibrate increased DNM3os transcription by ∼4-fold, which was reduced by ∼70% in the presence of GW6471 (Fig. 4G, lane 5 versus lane 4). Taken together, these results showed that PPARα was involved in DNM3os transcription in HMEC-1 cells.
Because miR-199a2 and miR-214 are processed from the DNM3os transcript, we examined whether PPARα agonists similarly affected transcription of premiR-199a2 and premiR-214. As shown in Fig. 4G, fenofibrate treatment resulted in augmented expression of premiR-199a2 by ∼3-fold, whereas PPARα antagonist GW6471 attenuated premir-199a2 levels to the basal level (Fig. 4G, lane 3 versus lane 2). Furthermore, clofibrate increased premiR-199a2 mRNA expression by ∼3.5-fold compared with untreated sample (Fig. 4G, lane 4 versus lane 1), whereas GW6471 attenuated premiR-199a2 expression (Fig. 4G, lane 5 versus lane 4). Because premiR-214 is part of the miR-199a2 cluster, we examined its expression in response to PPARα agonist. Both fenofibrate and clofibrate augmented premiR-214 expression, whereas GW6471 antagonist inhibited premiR-214 expression (Fig. 4G). Furthermore, mature miR-199a2 expression increased ∼3.5-fold in response to fenofibrate, which was attenuated by GW6471 (Fig. 4H). Northern blotting showed PlGF reduced the expression of mature miR-199a, whereas fenofibrate augmented miR-199a expression (Fig. 4I), thus confirming the results obtained by qRT-PCR. The effect of PPARα agonist on DNM3os transcription was specific because troglitazone, a PPARγ agonist, was ineffective in augmenting DNM3os transcription (Fig. 4J). Taken together, these data showed that miR-199a2 and miR-214 co-located in DNM3os were indeed co-transcriptionally regulated by PPARα.
Involvement of PPARα cis-Binding Elements in DNM3os Transcription
Because PPARα agonists augmented DNM3os transcription, we needed to determine whether one or more of the putative PPARα sites were required for DNM3os transcription. For this analysis, a transcription reporter was constructed from 2 kb of the 5′-flanking region immediately upstream of DNM3os fused to the luciferase coding region in pGL3-Basic, shown in schematic form in Fig. 4A. Transfection of HMEC-1 cells with the reporter driven by the WT DNM3os promoter (pDNM3os-luc) followed by treatment with fenofibrate showed an ∼1.8-fold increase in luciferase activity compared with untreated cells (Fig. 5B, lane 2 versus lane 1). By contrast, co-treatment with fenofibrate and GW6471 (antagonist) reduced luciferase activity to the background level (Fig. 5B, lane 3 versus lane 2), confirming the role of PPARα. Moreover, clofibrate augmented reporter expression by ∼1.6-fold (Fig. 5B, lane 4 versus lane 1), and GW6471 prevented induction beyond the background level of luciferase expression (Fig. 5B, lane 5 versus lane 4). Taken together, these data showed that PPARα agonists indeed activated the DNM3os promoter, and PPARα antagonists inhibited DNM3os induction.
FIGURE 5.

PPARα cis-binding elements in promoter of DNM3os regulate expression of DNM3os as determined by reporter assay and ChIP. A, schematic of mutations in core sequences corresponding to PPARα sites (1, 2, and 3; see Fig. 4A) in DNM3os promoter reporter constructs. B and C, HMEC cells were transfected with either DNM3os-luc (WT) plasmid or the mutant plasmid with singly mutated PPARα binding sites (1, 2, or 3) or double mutation of PPARα sites 1 and 2 in DNM3os-luc constructs (PPmt). Transfected cells were treated as indicated with PPARα agonists (fenofibrate or clofibrate) or antagonist (GW6471) for 24 h. The cell lysates were assayed for luciferase activity and normalized to Renilla activity. The data are means ± S.E. for n = 3. D–F, HMEC cells were treated with either fenofibrate or fenofibrate +GW6471 for 2 h. The soluble chromatin was isolated and immunoprecipitated with either antibody to PPARα or control rabbit IgG. The PCR primers flank PPARα binding sites (1, 2, and 3), as indicated in schematic shown in Fig. 4A, and are listed in Table 1. Immunoprecipitated chromatin was processed for PCR analysis, and the expected product sizes are indicated. The middle panel shows amplification of the input DNA before immunoprecipitation. The data are representative of two independent experiments ran in duplicate, and the indicated values are densitometry values normalized to input DNA. G, immunoprecipitated chromatin was processed for PCR analysis utilizing primers corresponding to non-PPARα binding site in the DNM3os promoter. ns, not significant.
The WT DNM3os promoter was mutated at each of the predicted PPARα binding sites (Figs. 4A and 5A) by replacing the WT core sequences with mutated sequences as indicated in Fig. 5A. Transfection and assay of single PPARα site mutants (sites 1 and 2) of the DNM3os promoter resulted in unchanged luciferase activity in response to fenofibrate as compared with wild type DNM3os promoter (Fig. 5C). Similarly, the double mutation of sites 1 and 2 was unresponsive to fenofibrate (Fig. 5C). By contrast, PPARα site 3 mutant remained responsive to fenofibrate (Fig. 5C), indicating that this site was nonessential for PPARα-mediated transactivation. These results showed that the proximal PPARα cis-binding elements (sites 1 and 2), but not site 3, present in the DNM3os promoter were essential for fenofibrate-mediated transcription of DNM3os.
Finally, we determined whether PPARα binds to the DNM3os promoter in native chromatin of HMEC cells by performing ChIP analysis. For this analysis, chromatin was prepared from untreated cells or cells treated with fenofibrate alone or fenofibrate plus GW6471. Chromatin preparations were immunoprecipitated with either antibody to PPARα or control nonspecific rabbit IgG. The PCR products corresponding to each PPARα site in the DNM3os promoter, amplified with appropriate primers (listed in Table 1), were detected and quantitated following gel electrophoresis. HMEC-1 cells treated with fenofibrate showed a ∼1.5-fold increase in the expected 111-bp PCR product (corresponding to amplicon 1), a ∼2.1-fold increase in expected 137-bp PCR product (corresponding to amplicon 2) and no change in expected 113-bp PCR product (corresponding to amplicon 3), as shown respectively in Fig. 5 (D–F). The augmented binding of PPARα to the promoter region was completely reversed when cells were treated with PPARα antagonist (GW6471) as shown in Fig. 5 (D and E). The ChIP analysis was specific because PCR products were not detected in the control IgG immunoprecipitates (Fig. 5, D–F, bottom panels), and furthermore the input DNA used for PCR amplification was equivalent in all samples (Fig. 5, D–F, middle panels). Moreover, the expected PCR product was not detected in chromatin immunoprecipitated with PPARα antibody (Fig. 5G), utilizing primers corresponding to a region of the DNM3os promoter, absent of PPARα cis-binding elements (bases −1819 to −1715). Together with the results presented above, these data showed that fenofibrate augmented binding of PPARα to proximal sites 1 and 2 of the DNM3os promoter leading to increased transcription of DNM3os in vitro and in vivo.
PPARα Agonists Mediate Expression of miR-199a2, in Turn Regulating Expression of HIF-1α and Its Target Gene ET-1
Because we showed that PPARα agonist increased levels of miR-199a2, which targets HIF-1α mRNA, we anticipated that fenofibrate treatment would reduce overall HIF-1α activity and subsequently down-regulate expression of a key downstream target gene ET-1. It is pertinent to mention that recent studies by Zhou et al. (37) show that PPARα activation suppresses HIF-1α activation in cancer cells in response to hypoxia. In our studies, we observed fenofibrate treatment of endothelial cells reduced HIF-1α mRNA levels by ∼80% (Fig. 6A, lane 2 versus lane 1), whereas co-treatment with GW6471 restored HIF-1α mRNA expression (Fig. 6A, lane 3 versus lane 2). Similar results were obtained with clofibrate, which showed ∼80% reduction in HIF-1α mRNA expression (Fig. 6A, lane 4 versus lane 1). The effect of PPARα agonist was reversed in the presence of GW6471 (Fig. 6A, lane 5 versus lane 4). These results showed that PPARα agonists attenuated HIF-1α levels by mRNA turnover or translation inhibition following increased miR-199a2 expression.
FIGURE 6.

PPARα agonists attenuate expression of HIF-1α and ET-1 in both HMEC cells and primary HLMVEC. A–D, HMEC cells were treated with indicated pharmacological agents for either 4 h for RNA extraction or 24 h for protein extraction. A and B, qRT-PCR was performed for HIF-1α and ET-1 mRNAs. C and D, Western blot was performed on protein extracts utilizing antibody to HIF-1α, ET-1, and β-actin (loading control). The data are representative of three independent experiments. E, HIF-1α and ET-1 expression in HLMVEC treated with fenofibrate or fenofibrate +GW 6471. Cells were treated with drugs for 4 h, and extracted RNA was analyzed by qRT-PCR for mRNA expression of HIF-1α and ET-1. The data are means ± S.E. for n = 3. F, secretion of ET-1 from HMEC cells in response to treatment with PlGF, miR-199a2 mimic, and fenofibrate. The data are means ± S.E. for n = 3. G, schematic of ET-1 promoter (669 bp) showing cis-binding elements for KLF-11 and HIF-1α and truncated promoter (176 bp) lacking KLF-11 sites. H, effect of PlGF, fenofibrate, and miR-199a2 mimic on full-length ET-1 (669 bp) and truncated ET-1 (176 bp) promoter reporter luciferase activity. All luciferase reporters were co-transfected with Renilla reporter plasmid for normalization of transfection efficiency. The data are means ± S.E. for n = 3. ns, not significant.
Next, we examined the effect of PPARα agonists on ET-1, a downstream gene regulated by HIF-1α and a key mediator of PHT in SCA (16). As expected, ET-1 mRNA levels were reduced by ∼80 and ∼60%, by fenofibrate and clofibrate, respectively, in HMEC-1 cells (Fig. 6B, lanes 2 and 4 versus lane 1); moreover, GW6471 reversed the effects of PPARα agonists on ET-1 mRNA expression (Fig. 6B, lane 3 versus lane 2 and lane 5 versus lane 4). In support of a mechanistic model involving premiR-199a2/miR-199a2 synthesis, fenofibrate treatment of HMEC cells resulted in a decrease in HIF-1α protein levels by ∼70% (Fig. 6C) and a corresponding reduction of ET-1 protein by ∼90% (Fig. 6D). As a control for PPARα activation, the GW6471 antagonist reversed the observed effects of fenofibrate on HIF-1α (Fig. 6C) and ET-1 proteins (Fig. 6D).
To confirm the physiological relationship of PPARα to HIF-1α and ET-1, we examined whether the PPARα agonists affected primary human endothelial cells similarly to the effects observed in HMEC-1 cells. Treatment of primary HLMVEC with fenofibrate resulted in ∼75% reduction of HIF-1α mRNA levels (Fig. 6E, lane 2) and ∼60% reduction of ET-1 mRNA levels (Fig. 6E, lane 2). In addition, GW6471 reversed the effect of fenofibrate on the expression of HIF-1α mRNA and ET-1 mRNA (Fig. 6E).
Our previous studies show that PlGF increased the secretion of ET-1 from HPMVEC. Herein, we examined whether PlGF-mediated ET-1 release was modulated by miR-199a mimic in HMEC-1 cells. As shown in Fig. 6F, PlGF caused ∼75% increase in ET-1 release, which was attenuated by ∼65% below basal expression with miR-199a mimic but not with sc miR mimic. Similarly, PlGF-induced ET-1 release was 100% inhibited by fenofibrate (Fig. 6F, lane 6 versus lane 2). These results showed that PlGF-induced secretion of ET-1 from HMEC cells was attenuated by miR-199a2. Furthermore, these results showed that PPARα agonist reduced expression of HIF-1α and its downstream target gene ET-1 by up-regulating the expression of miR-199a2, which as shown above was responsible for post-transcriptional regulation of HIF-1α.
Does PlGF-mediated Induction of ET-1 Expression Involve Kruppel-like Factor 11 and HIF-1α?
Recent studies of Staels and co-workers (25) show that fenofibrate attenuates ET-1 expression by a PPARα-dependent mechanism via induction of Kruppel-like factor 11 repressor and by a PPARα-independent mechanism requiring inhibition of glycogen synthase kinase-3 activity. In the present study, we examined the role of KLF-11 and HIF-1α in the transcriptional regulation of ET-1 expression, in response to PlGF and fenofibrate.
We examined the activity of the full-length ET-1 promoter (669 bp) (19, 38), which has three KLF-11 cis-binding sites and a single HRE site, with a luciferase reporter gene as depicted in Fig. 6G. Treatment of HMEC-1 cells with PlGF increased the WT ET-1 promoter (669 bp) activity by ∼2-fold (Fig. 6H, lane 2 versus lane 1), whereas fenofibrate reduced PlGF induction of luciferase expression to the basal level (Fig. 6H, lane 3 versus lane 2). Next, we examined the activity of a truncated ET-1 promoter (176 bp) in the context of the luciferase reporter. Note that the truncated promoter completely lacks the three KLF-11 sites (38) (Fig. 6G). HMEC cells transfected with truncated ET-1 promoter showed ∼1.4-fold increase in basal luciferase activity compared with WT ET-1 promoter (669 bp), in the absence of PlGF (Fig. 6H, lane 4 versus lane 1). This indicated to us that deletion of the KLF-11 sites removed any repressive activity of KLF-11 on reporter activity.
In response to PlGF treatment, the activity from the truncated promoter was substantially the same as observed with WT ET-1 promoter (Fig. 6H, lanes 5 versus lane 2), indicating that deletion of the KLF-11 sites in the truncated ET-1 promoter did not change maximum reporter activity. In an effort to determine the relative contribution of KLF-11 and HIF-1α on ET-1 induction, we noted that fenofibrate treatment with the truncated ET-1 promoter reduced transcription activity to the level observed in the absence of PlGF (Fig. 6H, lane 6 versus lane 4). We interpreted this as a ∼60% reduction of induction, accounting for the difference in basal activities exhibited by the WT and truncated promoters (Fig. 6H, lane 4 versus lane 1). The requirement for HIF-1α in ET-1 transcription was demonstrated with the truncated ET-1 promoter reporter, where both fenofibrate and exogenous miR-199a mimic reduced ET-1 promoter activity caused by reduction of HIF-1α activity (Fig. 6H, lanes 6 and 7, respectively).
By a similar argument, the contribution of KLF-11 to PlGF induction of ET-1 transcription was ∼40% based on the observed increase in basal activity of the truncated promoter compared with WT (Fig. 6H, lane 4 versus lane 1). The requirement for HIF-1α in ET-1 transcription was maintained with the truncated ET-1 promoter reporter, as shown by PlGF-mediated increase in activity (Fig. 6H, lane 5 versus lane 4) and by reduction of promoter activity by both fenofibrate and exogenous miR-199a mimic (Fig. 6H, lanes 6 and 7). By contrast, anti-miR-199a augmented (∼25%) the luciferase activity in fenofibrate-treated cells, in the absence of PlGF (Fig. 6H, lane 8). These data showed that KLF-11 did indeed participate in ET-1 gene expression by repressing transcription under basal conditions and that ET-1 transcription is subject to HIF-1α transactivation.
miR-199a2 Levels Were Reduced in Plasma of SCD versus Control Human Subjects
The status of miR-199a2 levels in human plasma samples was ascertained in an effort to corroborate the in vitro results. As shown in Fig. 7A, levels of miR-199a-5p were significantly lower by ∼5-fold in plasma obtained from SCD subjects (SS, n = 11) compared with that obtained from unaffected sibling controls. As shown in Fig. 7B, the plasma ET-1 levels in SCD samples were also higher compared with unaffected sibling control samples. We have previously shown that plasma ET-1 levels are significantly higher in SCD patients in comparison to healthy controls (16, 18). Thus, the above results and previously reported observations strongly indicate the existence of a reciprocal relationship between miR-199a2 and ET-1, as was observed in vitro.
FIGURE 7.

miR-199a, HIF-1α, and ET-1 biomarkers in human SCD subjects and fenofibrate-treated sickle mice. A, plasma levels of miR-199a2–5p in SCD subjects (n = 11) and healthy controls (n = 13) measured by specific TaqMan microRNA assay and normalized to RNU6B. B, comparison of ET-1 levels in plasma of SCD subjects and healthy controls. C, expression of premiR-199a2, HIF-1α, and ET-1 mRNA in lung tissues obtained from C57B/6NJ and Berkeley sickle mice fed either control chow or fenofibrate chow for 10 weeks. RNA was extracted from lungs, and qRT-PCR was performed on samples (n = 3–4) as indicated. The data are means ± S.E. D and E, expression of HIF-1α mRNA and ET-1 mRNA in sorted endothelial cells (CD31+) from lung tissue of fenofibrate-fed BK-SS mice and chow-fed BK-SS mice. F, Kaplan-Meier survival plot of Berkeley sickle mice (HbS; n = 12) after fenofibrate feeding or control diet feeding. G, working model of miR-199a2 targeting 3′-UTR of HIF-1α leading to reduction of HIF-1α and concomitant reduction of ET-1 levels. miR-199a2 located within DNM3os is co-regulated by PPARα, which binds to cis-elements in DNM3os promoter. PPARα agonist fenofibrate augments miR-199a2 expression leading to reduction in HIF-1α and ET-1.
Effect of Oral Fenofibrate in Wild Type and Berkeley Sickle Mice on miR-199a2 and ET-1 Levels
Because the PPARα agonist fenofibrate attenuated ET-1 expression in endothelial cells, we examined the effect of the drug in vivo. BK-SS mice and C57BL6/6NJ WT control mice were fed fenofibrate ad lib in the diet for 10 weeks. Lung tissues from these experimental animals were analyzed for expression levels of premir-199a2, HIF-1α, and ET-1 mRNAs, as described above. A comparison of lung tissues from control chow-fed versus fenofibrate-chow-fed BK-SS mice showed a ∼8-fold increase in miR-199a2 RNA (relative values 0.16 ± 0.08 versus 1.25 ± 0.30), with a corresponding decrease in HIF-1α mRNA levels and a significant reduction in ET-1 mRNA levels (6.05 ± 0.22 to 0.07 ± 0.04) (Fig. 7C). In lung tissue obtained from wild type C57BL/6NJ mice fed control chow diet versus fenofibrate-chow diet, there was ∼2.5-fold increase in miR-199a2 RNA expression (1.06 ± 0.27 to 2.58 ± 0.53), a decrease in HIF-1α mRNA, and a ∼2-fold reduction in ET-1 mRNA expression (1.03 ± 0.18 to 0.49 ± 0.19) (Fig. 7C). These data showed fenofibrate fed to both BK-SS mice and wild type C57BL/6NJ mice augmented the expression of miR-199a2 and was correlated with reduced ET-1 expression in lung, in support of our regulatory model (Fig. 7G).
To further refine the lung gene expression data, we examined the levels of HIF-1α mRNA and ET-1 mRNA in CD31+ sorted endothelial cells from isolated lungs of control chow and fenofibrate diet-fed BK-SS mice. As shown in Fig. 7D, HIF-1α mRNA was significantly reduced in isolated endothelial cells from fenofibrate-fed versus control chow-fed BK-SS mice. Furthermore, ET-1 mRNA levels were also reduced in endothelial cells derived from fenofibrate-fed BK-SS mice versus chow-fed BK-SS mice (p = 0.053) (Fig. 7E).
DISCUSSION
We have previously shown that plasma levels of PlGF, an angiogenic growth factor, produced by erythroid cells, are high in SCD patients. This correlates with an increase in plasma levels of ET-1 and tricuspid regurgitant jet velocity; the latter is a marker of PH in SCD (16). Similar to patients with SCD, Berkeley sickle mice exhibit elevated plasma levels of PlGF and ET-1 and right ventricular hypertrophy (16). Moreover, stimulated erythroid expression of PlGF in normal mice, up to the levels seen in sickle mice, results in increased ET-1 production and associated right ventricular hypertrophy with pulmonary changes within a time period of 8 weeks (16). These studies showed that PlGF-induced ET-1 expression in vivo plays a significant role in development of PH in SCD.
Our previous studies in cultured endothelial cells show that PlGF induces expression of ET-1 via activation of HIF-1α, independently of hypoxia. This involves binding of HIF-1α to hypoxia response elements in the promoter of ET-1 (19).
In the present study, we examined the post-transcriptional mechanism of PlGF-mediated ET-1 expression. We showed that PlGF treatment of endothelial cells (HMEC) attenuated both premiR-199a2/premiR-214 and mature miR-199a2/miR-214 levels. Based on several public data sets, both miR-199a2 and miR-214 are predicted to target multiple genes. Previous studies showed that miR-199a2 targets the 3′-UTR of HIF-1α mRNA in mouse cardiac myocytes (39). Consequently we focused our studies on the human HIF-1α 3′-UTR as it harbors a complementary sequence to the miR-199a2 seed sequence (positions +16 to +38 of the 3′-UTR); HIF-1α mRNA has no complementary sites for miR-214 binding. The specificity of miR-199a2 binding to the HIF-1α mRNA miR-199a MRE was established using a luciferase reporter gene containing the HIF-1α 3′-UTR. This translation reporter responded to synthetic miR-199a2 mimic, which attenuated basal and PlGF-induced luciferase reporter activity. Moreover, the functionality of the MRE sequence was established by mutation of the seed region complement for miR-199a2 in the 3′-UTR of the luciferase reporter, thus confirming the presence of the miR-199a response element in the 3′-UTR of HIF-1α mRNA. These results also strongly implicated miR-199a2 involvement in post-transcriptional regulation of HIF-1α expression in response to PlGF. Indeed, transfection of HMEC cells with miR-199a mimic attenuated endogenous HIF-1α mRNA and protein and concomitantly attenuated basal and PlGF-induced ET-1 expression.
Previous studies have shown miR-199a is down-regulated in cardiac myocytes in response to low oxygen tension, which is required for the up-regulation of target HIF-1α (39). Hypoxia was also shown to regulate expression of several other miRNAs that post-transcriptionally modulate levels of a variety of mRNAs, including HIF-1α (40). Indeed, our studies demonstrated that hypoxia reduces miR-199a2 levels in endothelial cells, which is manifested by increased HIF-1α expression as previously shown (41).
miR-199a2 is located within the DNM3os transcription unit. This long noncoding RNA transcript is responsible for synthesis of the miRNA cluster containing miR-199a2 and miR-214 and is involved in skeletal development (42, 43). Accordingly it was necessary to determine whether PlGF regulated synthesis of the long DNM3os transcript, as previously observed, or instead led to independent transcription of premir-199a2. Our studies showed that PlGF coordinately attenuated RNA levels of DNM3os, premiR-199a2, and premiR-214 in cultured human endothelial cells. As a consequence of reduced miR-199a2 in PlGF-treated conditions, we expected increased levels of HIF-1α and ET-1 expression as was observed.
We observed significant reduction of miR-199a in plasma from patients with SCD compared with unaffected sibling controls. Reduced levels of miR-199a in SCD would be expected to decrease the turnover of HIF-1α mRNA leading to increased HIF-1α protein and subsequent increased levels of ET-1, as was observed (16). Thus, both in vitro and in vivo results support this model (Fig. 7G) whereby reduced expression of miR-199a2 leads to increased expression of HIF-1α in SCD and is reflected by increased HIF-1α-dependent gene expression.
Recent studies by others show that myocardial hypoxia in mice, induced by transverse aortic constriction, led to increased expression of DNM3os and concomitant miR-199a/miR214 expression (24). Herein, it was shown that miR-199a/miR-214 target PPARδ mRNA for turnover, thus resulting in decreased PPARδ activity leading to defective mitochondrial respiration, as a consequence of flawed fatty acid substrate metabolism. It was suggested in their model, that miR-199a could also target HIF-1α mRNA for turnover. Reduction of HIF-1α levels would lead to decreased DNM3os transcription and miRNA synthesis because the promoter for the latter has HRE and Twist binding sites (24). By contrast, our present studies showed that hypoxia and PlGF in cultured endothelial cells reduced expression of DNM3os, premiR-199a2, and premiR-214, resulting in higher expressed levels of HIF-1α and increased expression of ET-1, with the latter a key indicator of HIF-1α-dependent transcription. These results are consistent with previous studies that showed hypoxia up-regulated ET-1 expression via activation of HIF-1α (18, 44). Further work is warranted to delineate the mechanism used during hypoxia to regulate DNM3os transcription.
We examined the transcriptional regulation of miR-199a2 and its host gene DNM3os in cultured endothelial cells. Utilizing PPARα shRNA and PPARα agonist, fenofibrate, we showed PPARα up-regulated the expression of DNM3os, pre-miR199a2, and miR-199a2 RNAs. The effect was specific for PPARα because an antagonist to PPARα, GW6471, antagonized the stimulatory effect of fenofibrate. In the promoter of DNM3os, there are three predicted PPARα cis-binding elements proximal to the transcription start site. These PPARα binding elements were involved in DNM3os transcription as demonstrated by DNM3os-promoter-luciferase reporter assays and response to PPARα agonist, fenofibrate. We refined our analysis of the PPARα cis-binding sites to establish whether one or more of these PPARα elements were required for DNM3os transcription in response to fenofibrate. Single PPARα site mutations were constructed for this purpose whereupon it was found that two of the three PPARα sites were required and functional for PPARα-dependent transcription of DNM3os, as determined by response to fenofibrate. These results were further extended by analysis of physiological interactions of PPARα with the DNM3os promoter in intact HMEC-1 cells as detected by ChIP assay. Thus, the transcription activity of the DNM3os locus under native conditions paralleled the transcription activity observed in reporter assays.
The present study demonstrated for the first time to the best of our knowledge that transcription factor PPARα co-regulated the transcription of DNM3os and miR-199a2. This relationship between PPARα, HIF-1α, and a downstream target gene, ET-1, is summarized in our working model (Fig. 7G).
Previous studies show that the PPARα agonist fenofibrate attenuates ET-1 expression in a PPARα-dependent mechanism via activation of a Kruppel-like factor (KLF-11) (25) and by inhibition of AP-1 signaling pathways (45). As previously reported, fibrates suppress HIF-1α activation in cancer cells in response to hypoxia (37); we also observed that fibrates attenuated PlGF-induced HIF-1α mRNA levels in endothelial cells. In the present study, we showed PlGF-induced ET-1 transcription was completely attenuated by fenofibrate. A more detailed examination of the ET-1 promoter was undertaken, whereupon we observed that the 669-bp, 5′-flanking DNA contained KLF-11 and HRE cis-binding elements. The relative contributions of the KLF-11 sites and the single HRE were examined in luciferase reporter constructs by comparing a truncated promoter (176 bp) to the full-length promoter. The former completely lacked the three KLF-11 sites but still maintained responsiveness to PlGF and HIF-1α. Based on the results of this analysis combined with fenofibrate response, we estimated that HIF-1α contributed ∼60% to the overall expression of ET-1; the remaining contribution to expression was effected by derepression of the ET-1 gene by PlGF-mediated release of KLF-11 from the promoter by another regulatory pathway.
Fibrates are approved by the Food and Drug Administration for the treatment of dyslipidemia (46). These PPAR-α agonists exhibit improvement of flow-mediated dilation of bronchial arteries in type 2 diabetes mellitus patients (25) and diabetic retinopathy in type I diabetic animal models (47). Thus, we asked whether this drug could be potentially beneficial in SCD treatment, given our experimental observation that miR-199a2 synthesis was positively regulated by PPARα. As a first step, we examined the effect of feeding fenofibrate to Berkeley sickle mice. Results from these studies demonstrated that 10-week administration of fenofibrate to these mice increased miR-199a2 in the lung tissues of these mice, as well as WT control mice. There was a significant reduction of HIF-1α and ET-1 mRNAs in isolated endothelial cells from these lungs, thus demonstrating that fenofibrate was effective in vivo as a means of attenuating HIF-1α levels and decreasing ET-1 expression, consistent with the in vitro model (Fig. 7G). However, long term (6–12 months) fenofibrate feeding studies in a larger cohort of BK-SS mice coupled with physiological measurements of pulmonary functions are warranted to conclusively demonstrate a beneficial effect of fenofibrate in alleviating PH in the SCA animal model.
In conclusion, our data showed that miR-199a2 has a significant role in overall regulation of HIF-1α activity. It is clear that in addition to post-transcriptional regulatory events regulating the basal level of this factor through regulated proteolysis, there is also a mechanism for modulating synthesis of this important transcription factor at the level of mRNA translation. In the course of our studies, we discovered that PPARα is capable of regulating the expression of miR-199a2 via transcription of its host gene DNM3os. In sickle subjects, miR-199a2 levels are significantly reduced, which in turn leads to increased levels of HIF-1α and abnormal levels of ET-1, the latter of which is correlated as causal in PH (16). These studies provide a mechanistic link for the transcriptional regulation of miR-199a2 by fibrates, thus providing a therapeutic rationale for attenuating elevated ET-1 levels observed during pulmonary hypertension in SCA.
This work was supported, in whole or in part, by National Institutes of Health Grants RO1-HL111372 (to V. K. K. and P. M.) and P30-DK048522 (to the University of Southern California Research Center for Liver Disease).
- PH
- pulmonary hypertension
- DNM3os
- Dynamin 3 opposite strand
- ET-1
- endothelin-1
- HIF-1α
- hypoxia inducible factor-1 α
- HMEC-1
- human microvascular cell line
- HLMVEC
- human lung microvascular endothelial cells
- PlGF
- placenta growth factor
- SCD
- sickle cell disease
- miR
- microRNA
- MRE
- microRNA response element
- PPARα
- peroxisome proliferator-activated receptor-α
- BK-SS
- Berkeley sickle
- qRT-PCR
- quantitative real time PCR
- SFM
- serum-free medium
- sc
- scrambled.
REFERENCES
- 1. Kedzierski R. M., Yanagisawa M. (2001) Endothelin system: the double-edged sword in health and disease. Annu. Rev. Pharmacol. Toxicol. 41, 851–876 [DOI] [PubMed] [Google Scholar]
- 2. Kisanuki Y. Y., Emoto N., Ohuchi T., Widyantoro B., Yagi K., Nakayama K., Kedzierski R. M., Hammer R. E., Yanagisawa H., Williams S. C., Richardson J. A., Suzuki T., Yanagisawa M. (2010) Low blood pressure in endothelial cell-specific endothelin 1 knockout mice. Hypertension 56, 121–128 [DOI] [PubMed] [Google Scholar]
- 3. Gladwin M. T., Sachdev V., Jison M. L., Shizukuda Y., Plehn J. F., Minter K., Brown B., Coles W. A., Nichols J. S., Ernst I., Hunter L. A., Blackwelder W. C., Schechter A. N., Rodgers G. P., Castro O., Ognibene F. P. (2004) Pulmonary hypertension as a risk factor for death in patients with sickle cell disease. New Engl. J. Med. 350, 886–895 [DOI] [PubMed] [Google Scholar]
- 4. Minniti C. P., Machado R. F., Coles W. A., Sachdev V., Gladwin M. T., Kato G. J. (2009) Endothelin receptor antagonists for pulmonary hypertension in adult patients with sickle cell disease. Br. J. Haematol. 147, 737–743 [DOI] [PMC free article] [PubMed] [Google Scholar]
- 5. Klings E. S. (2008) Pulmonary hypertension of sickle cell disease: more than just another lung disease. Am. J. Hematol. 83, 4–5 [DOI] [PubMed] [Google Scholar]
- 6. Ataga K. I., Moore C. G., Hillery C. A., Jones S., Whinna H. C., Strayhorn D., Sohier C., Hinderliter A., Parise L. V., Orringer E. P. (2008) Coagulation activation and inflammation in sickle cell disease-associated pulmonary hypertension. Haematologica 93, 20–26 [DOI] [PubMed] [Google Scholar]
- 7. Morris C. R., Suh J. H., Hagar W., Larkin S., Bland D. A., Steinberg M. H., Vichinsky E. P., Shigenaga M., Ames B., Kuypers F. A., Klings E. S. (2008) Erythrocyte glutamine depletion, altered redox environment, and pulmonary hypertension in sickle cell disease. Blood 111, 402–410 [DOI] [PMC free article] [PubMed] [Google Scholar]
- 8. Miller A. C., Gladwin M. T. (2012) Pulmonary complications of sickle cell disease. Am. J. Respir. Crit. Care Med. 185, 1154–1165 [DOI] [PMC free article] [PubMed] [Google Scholar]
- 9. Zhang X., Zhang W., Ma S.-F., Desai A. A., Saraf S., Miasniakova G., Sergueeva A., Ammosova T., Xu M., Nekhai S., Abbasi T., Casanova N. G., Steinberg M. H., Baldwin C. T., Sebastiani P., Prchal J. T., Kittles R., Garcia J. G., Machado R. F., Gordeuk V. R. (2014) Hypoxic response contributes to altered gene expression and precapillary pulmonary hypertension in patients with sickle cell disease. Circulation 129, 1650–1658 [DOI] [PMC free article] [PubMed] [Google Scholar]
- 10. Klings E. S., Machado R. F., Barst R. J., Morris C. R., Mubarak K. K., Gordeuk V. R., Kato G. J., Ataga K. I., Gibbs J. S., Castro O., Rosenzweig E. B., Sood N., Hsu L., Wilson K. C., Telen M. J., Decastro L. M., Krishnamurti L., Steinberg M. H., Badesch D. B., Gladwin M. T. (2014) An official american thoracic society clinical practice guideline: diagnosis, risk stratification, and management of pulmonary hypertension of sickle cell disease. Am. J. Respir. Crit. Care Med. 189, 727–740 [DOI] [PMC free article] [PubMed] [Google Scholar]
- 11. Hsu L. L., Champion H. C., Campbell-Lee S. A., Bivalacqua T. J., Manci E. A., Diwan B. A., Schimel D. M., Cochard A. E., Wang X., Schechter A. N., Noguchi C. T., Gladwin M. T. (2007) Hemolysis in sickle cell mice causes pulmonary hypertension due to global impairment in nitric oxide bioavailability. Blood 109, 3088–3098 [DOI] [PMC free article] [PubMed] [Google Scholar]
- 12. Bunn H. F., Nathan D. G., Dover G. J., Hebbel R. P., Platt O. S., Rosse W. F., Ware R. E. (2010) Pulmonary hypertension and nitric oxide depletion in sickle cell disease. Blood 116, 687–692 [DOI] [PubMed] [Google Scholar]
- 13. Wood K. C., Cortese-Krott M. M., Kovacic J. C., Noguchi A., Liu V. B., Wang X., Raghavachari N., Boehm M., Kato G. J., Kelm M., Gladwin M. T. (2013) Circulating blood endothelial nitric oxide synthase contributes to the regulation of systemic blood pressure and nitrite homeostasis. Arterioscler. Thromb. Vasc. Biol. 33, 1861–1871 [DOI] [PMC free article] [PubMed] [Google Scholar]
- 14. Nouraie M., Lee J. S., Zhang Y., Kanias T., Zhao X., Xiong Z., Oriss T. B., Zeng Q., Kato G. J., Gibbs J. S., Hildesheim M. E., Sachdev V., Barst R. J., Machado R. F., Hassell K. L., Little J. A., Schraufnagel D. E., Krishnamurti L., Novelli E., Girgis R. E., Morris C. R., Rosenzweig E. B., Badesch D. B., Lanzkron S., Castro O. L., Goldsmith J. C., Gordeuk V. R., Gladwin M. T. (2013) The relationship between the severity of hemolysis, clinical manifestations and risk of death in 415 patients with sickle cell anemia in the US and Europe. Haematologica 98, 464–472 [DOI] [PMC free article] [PubMed] [Google Scholar]
- 15. Rybicki A. C., Benjamin L. J. (1998) Increased levels of endothelin-1 in plasma of sickle cell anemia patients. Blood 92, 2594–2596 [PubMed] [Google Scholar]
- 16. Sundaram N., Tailor A., Mendelsohn L., Wansapura J., Wang X., Higashimoto T., Pauciulo M. W., Gottliebson W., Kalra V. K., Nichols W. C., Kato G. J., Malik P. (2010) High levels of placenta growth factor in sickle cell disease promote pulmonary hypertension. Blood 116, 109–112 [DOI] [PMC free article] [PubMed] [Google Scholar]
- 17. Shao D., Park J. E., Wort S. J. (2011) The role of endothelin-1 in the pathogenesis of pulmonary arterial hypertension. Pharmacol. Res. 63, 504–511 [DOI] [PubMed] [Google Scholar]
- 18. Yamashita K., Discher D. J., Hu J., Bishopric N. H., Webster K. A. (2001) Molecular regulation of the endothelin-1 gene by hypoxia: contributions of hypoxia-inducible factor-1, activator protein-1, GATA-2, AND p300/CBP. J. Biol. Chem. 276, 12645–12653 [DOI] [PubMed] [Google Scholar]
- 19. Patel N., Gonsalves C. S., Malik P., Kalra V. K. (2008) Placenta growth factor augments endothelin-1 and endothelin-B receptor expression via hypoxia-inducible factor-1α. Blood 112, 856–865 [DOI] [PMC free article] [PubMed] [Google Scholar]
- 20. Perelman N., Selvaraj S. K., Batra S., Luck L. R., Erdreich-Epstein A., Coates T. D., Kalra V. K., Malik P. (2003) Placenta growth factor activates monocytes and correlates with sickle cell disease severity. Blood 102, 1506–1514 [DOI] [PubMed] [Google Scholar]
- 21. Patel N., Tahara S. M., Malik P., Kalra V. K. (2011) Involvement of miR-30c and miR-301a in immediate induction of plasminogen activator inhibitor-1by placenta growth factor in human pulmopnary endothelial cells. Biochem. J. 434, 473–482 [DOI] [PMC free article] [PubMed] [Google Scholar]
- 22. Ding G., Huang G., Liu H.-D., Liang H.-X., Ni Y.-F., Ding Z.-H., Ni G.-Y., Hua H. W. (2013) MiR-199a suppresses the hypoxia-induced proliferation of non-small cell lung cancer cells through targeting HIF1α. Mol. Cell Biochem. 384, 173–180 [DOI] [PubMed] [Google Scholar]
- 23. Loebel D. A., Tsoi B., Wong N., Tam P. P. (2005) A conserved noncoding intronic transcript at the mouse Dnm3 locus. Genomics 85, 782–789 [DOI] [PubMed] [Google Scholar]
- 24. el Azzouzi H., Leptidis S., Dirkx E., Hoeks J., van Bree B., Brand K., McClellan E. A., Poels E., Sluimer J. C., van den Hoogenhof M. M., Armand A.-S., Yin X., Langley S., Bourajjaj M., Olieslagers S., Krishnan J., Vooijs M., Kurihara H., Stubbs A., Pinto Y. M., Krek W., Mayr M., da Costa Martins P. A., Schrauwen P., De Windt L. J. (2013) The hypoxia-inducible microRNA cluster miR-199a∼214 targets myocardial PPARδ and impairs mitochondrial fatty acid oxidation. Cell Metab. 18, 341–354 [DOI] [PubMed] [Google Scholar]
- 25. Glineur C., Gross B., Neve B., Rommens C., Chew G. T., Martin-Nizard F., Rodríguez-Pascual F., Lamas S., Watts G. F., Staels B. (2013) Fenofibrate inhibits endothelin-1 expression by peroxisome proliferator-activated receptor α-dependent and independent mechanisms in human endothelial cells. Arterioscler. Thromb. Vasc. Biol. 33, 621–628 [DOI] [PubMed] [Google Scholar]
- 26. Pászty C., Brion C. M., Manci E., Witkowska H. E., Stevens M. E., Mohandas N., Rubin E. M. (1997) Transgenic knockout mice with exclusively human sickle hemoglobin and sickle cell disease. Science 278, 876–878 [DOI] [PubMed] [Google Scholar]
- 27. Patel N., Sundaram N., Yang M., Madigan C., Kalra V. K., Malik P. (2010) Placenta Growth Factor (PlGF), a novel inducer of plasminogen activator inhibitor-1 (PAI-1) in sickle cell disease (SCD). J. Biol. Chem. 285, 16713–16722 [DOI] [PMC free article] [PubMed] [Google Scholar]
- 28. Kim K. S., Rajagopal V., Gonsalves C., Johnson C., Kalra V. K. (2006) A novel role of hypoxia-inducible factor in cobalt chloride- and hypoxia-mediated expression of IL-8 chemokine in human endothelial cells. J. Immunol. 177, 7211–7224 [DOI] [PubMed] [Google Scholar]
- 29. Patel N., Gonsalves C. S., Yang M., Malik P., Kalra V. K. (2009) Placenta growth factor induces 5-lipoxygenase-activating protein to increase leukotriene formation in sickle cell disease. Blood 113, 1129–1138 [DOI] [PMC free article] [PubMed] [Google Scholar]
- 30. Lin M., Chamoto K., Gibney B. C., Lee G. S., Collings-Simpson D., Houdek J., Konerding M. A., Tsuda A., Mentzer S. J. (2011) Angiogenesis gene expression in murine endothelial cells during post-pneumonectomy lung growth. Respir. Res. 12, 98. [DOI] [PMC free article] [PubMed] [Google Scholar]
- 31. Kang J., Ramu S., Lee S., Aguilar B., Ganesan S. K., Yoo J., Kalra V. K., Koh C. J., Hong Y. K. (2009) Phosphate-buffered saline-based nucleofection of primary endothelial cells. Anal. Biochem. 386, 251–255 [DOI] [PMC free article] [PubMed] [Google Scholar]
- 32. Giri R. K., Selvaraj S. K., Kalra V. K. (2003) Amyloid peptide-induced cytokine and chemokine expression in THP-1 monocytes is blocked by small inhibitory RNA duplexes for early growth response-1 messenger RNA. J. Immunol. 170, 5281–5294 [DOI] [PubMed] [Google Scholar]
- 33. Lee Y.-B., Bantounas I., Lee D.-Y., Phylactou L., Caldwell M. A., Uney J. B. (2009) Twist-1 regulates the miR-199a/214 cluster during development. Nucleic Acids Res. 37, 123–128 [DOI] [PMC free article] [PubMed] [Google Scholar]
- 34. Semenza G. L. (2012) Hypoxia-inducible factors in physiology and medicine. Cell 148, 399–408 [DOI] [PMC free article] [PubMed] [Google Scholar]
- 35. Pereira E. R., Frudd K., Awad W., Hendershot L. M. (2014) Endoplasmic reticulum (ER) stress and hypoxia response pathways interact to potentiate hypoxia-inducible factor 1 (HIF-1) transcriptional activity on targets like vascular endothelial growth factor (VEGF). J. Biol. Chem. 289, 3352–3364 [DOI] [PMC free article] [PubMed] [Google Scholar]
- 36. Gervois P., Fruchart J. C., Staels B. (2007) Drug Insight: mechanisms of action and therapeutic applications for agonists of peroxisome proliferator-activated receptors. Nat. Clin. Pract. Endocrinol. Metab. 3, 145–156 [DOI] [PubMed] [Google Scholar]
- 37. Zhou J., Zhang S., Xue J., Avery J., Wu J., Lind S. E., Ding W. Q. (2012) Activation of peroxisome proliferator-activated receptor α (PPARα) suppresses hypoxia-inducible factor-1α (HIF-1α) signaling in cancer cells. J. Biol. Chem. 287, 35161–35169 [DOI] [PMC free article] [PubMed] [Google Scholar]
- 38. Hu J., Discher D. J., Bishopric N. H., Webster K. A. (1998) Hypoxia regulates expression of the endothelin-1 gene through a proximal hypoxia-inducible factor-1 binding site on the antisense strand. Biochem. Biophys. Res. Commun. 245, 894–899 [DOI] [PubMed] [Google Scholar]
- 39. Rane S., He M., Sayed D., Vashistha H., Malhotra A., Sadoshima J., Vatner D. E., Vatner S. F., Abdellatif M. (2009) Downregulation of miR-199a derepresses hypoxia-inducible factor-1α and sirtuin 1 and recapitulates hypoxia preconditioning in cardiac myocytes. Circ. Res. 104, 879–886 [DOI] [PMC free article] [PubMed] [Google Scholar]
- 40. Nallamshetty S., Chan S. Y., Loscalzo J. (2013) Hypoxia: a master regulator of microRNA biogenesis and activity. Free Radical Biol. Med. 64, 20–30 [DOI] [PMC free article] [PubMed] [Google Scholar]
- 41. Gonsalves C. S., Kalra V. K. (2010) Hypoxia-mediated expression of 5-lipoxygenase-activating protein involves HIF-1α and NF-κB and microRNAs 135a and 199a-5p. J. Immunol. 184, 3878–3888 [DOI] [PubMed] [Google Scholar]
- 42. Watanabe T., Sato T., Amano T., Kawamura Y., Kawamura N., Kawaguchi H., Yamashita N., Kurihara H., Nakaoka T. (2008) Dnm3os, a non-coding RNA, is required for normal growth and skeletal development in mice. Dev. Dyn. 237, 3738–3748 [DOI] [PubMed] [Google Scholar]
- 43. Desvignes T., Contreras A., Postlethwait J. H. (2014) Evolution of the miR199–214 cluster and vertebrate skeletal development. RNA Biol. 11, 281–294 [DOI] [PMC free article] [PubMed] [Google Scholar]
- 44. Kourembanas S., Marsden P. A., McQuillan L. P., Faller D. V. (1991) Hypoxia induces endothelin gene expression and secretion in cultured human endothelium. J. Clin. Invest. 88, 1054–1057 [DOI] [PMC free article] [PubMed] [Google Scholar]
- 45. Delerive P., Martin-Nizard F., Chinetti G., Trottein F., Fruchart J.-C., Najib J., Duriez P., Staels B. (1999) Peroxisome proliferator-activated receptor activators inhibit thrombin-induced endothelin-1 production in human vascular endothelial cells by inhibiting the activator protein-1 signaling pathway. Circ. Res. 85, 394–402 [DOI] [PubMed] [Google Scholar]
- 46. Lalloyer F., Staels B. (2010) Fibrates, glitazones, and peroxisome proliferator-activated receptors. Arterioscler. Thromb. Vasc. Biol. 30, 894–899 [DOI] [PMC free article] [PubMed] [Google Scholar]
- 47. Chen Y., Hu Y., Lin M., Jenkins A. J., Keech A. C., Mott R., Lyons T. J., Ma J. X. (2013) Therapeutic effects of PPARα agonists on diabetic retinopathy in type 1 diabetes models. Diabetes 62, 261–272 [DOI] [PMC free article] [PubMed] [Google Scholar]
- 48. Gonsalves C. S., Eiymo Mwa Mpollo M.-S., Malik P., Tahara S. M., Kalra V. K. (2014) miR-648 targets ET-1 mRNA and is co-transcriptionally regulated with MICAL3 by PAX5. Mol. Cell. Biol. 10.1128/MCB.01199-14 [DOI] [PMC free article] [PubMed] [Google Scholar]