

Abstract
Identification of infectious bacteria responsible for biofilm-associated infections is challenging due to the complex and heterogeneous biofilm matrix. To address this issue and minimize the impact of heterogeneity on biofilm identification, we developed a gold nanoparticle (AuNP)-based multichannel sensor to detect and identify biofilms based on their physicochemical properties. Our results showed that the sensor can discriminate six bacterial biofilms including two composed of uropathogenic bacteria. The capability of the sensor was further demonstrated through discrimination of biofilms in a mixed bacteria/mammalian cell in vitro wound model.
Keywords: biofilms, biosensor design, gold nanoparticles, fluorescent proteins, uropathogen, multichannel sensor
Biofilms on wounds, implants, and indwelling devices generate chronic and often life-threatening infections and inflammation.1 These persistent infections can result in tissue damage, device dysfunction, implant failure, and even death.2,3 Biofilm infections are notoriously difficult to treat, as the biofilm matrix provides physical protection from antibiotic treatment, which is often enhanced by the presence of antibiotic-resistant bacteria. Rapid detection and identification of biofilms can provide crucial information for early diagnosis and effective treatment;4 however, the identification of bacterial species in biofilms is challenging due to their physiological heterogeneity.5 Conventional biofilm detection methods rely on culturing, which requires several days for diagnosis and has low sensitivity.6,7 While molecular detection methods, such as PCR8 and fluorescence in situ hybridization (FISH),9 have been developed based on genotyping and genomic profiling, it remains challenging to rapidly identify biofilms.10
The biofilm matrix accounts for over 90% of biofilm dry mass, providing a three-dimensional microenvironment that protects the bacteria.11 This architecture is a unique feature that defines biofilms, intimately regulating the physical and functional properties of the biofilm.12 Both the physical structure of the biofilm and the composition of the extracellular polymeric substances (EPS) in the matrix, such as polysaccharides, proteins, nucleic acids, and lipids, vary among bacteria species.13 For example, polysaccharides are neutral in Streptococcus,14 polyanionic in Pseudomonas,15 and polycationic in Staphylococcus.16 Within a species, the EPS are even diverse; polysaccharides from various strains of Streptococcus thermophilus feature different monomer compositions and ratios and possess different molecular masses.17
On the basis of the structural and chemical differences between biofilms, we hypothesized that an array-based “chemical nose” approach could be used to detect and differentiate between species and even strains in a biofilm,18−20 potentially minimizing the interference caused by biofilm heterogeneity11 and phenotypic diversity of bacteria.21,22 Array-based sensing has been used to identify species and strains of planktonic bacteria.23,24 Optical sensing of biofilms is however a much more challenging prospect due to the physical heterogeneity of the films, which introduces significant variability to the sensing process.
Here we report a gold nanoparticle (AuNP)-based multichannel fluorescence sensor to detect and identify the species composition of biofilms based on the overall biofilm physicochemical properties. This sensor features AuNP-fluorescent protein conjugates that can be disrupted to give fluorescent readouts in the presence of bioflms (Figure 1), generating an essentially instantaneous readout. The key feature of this sensor platform is that it uses a three-color RGB output that generates a ratiometric response that is less sensitive to sample variability,25,26 enabling us to completely differentiate bacterial species and strains of six biofilms, including two pathogenic clinical isolates, within minutes. The versatility of this sensor is further demonstrated by discrimination between two bacterial species in a cocultured biofilm–fibroblast cell wound model.27
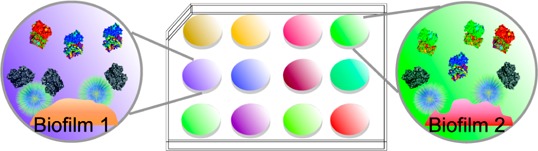
Figure 1.
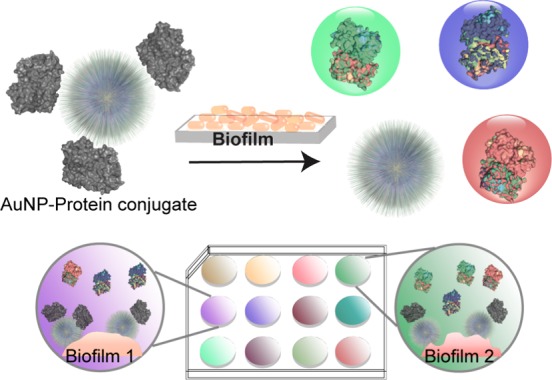
Schematic illustration of the multichannel sensor. The sensor is composed of AuNP-fluorescent protein conjugates that are disrupted in the presence of biofilms. This disruption turns on the fluorescence and results in different colored fluorescence patterns for biofilm identification.
Results and Discussion
We first fabricated two AuNPs (∼2 nm core), one featuring a cationic hydrophobic (NP1) and the other a hydrophilic (NP2) functional group (Figure 2A) These particles were screened from a library of different particles including aromatic and aliphatic headgroups, first to determine the individual particles and then to optimize their ratio in the sensor. Multichannel output is provided through reversible adsorption followed by partial displacement of three fluorescent proteins with well-separated excitation and emission spectra (Figure S1): red (tdTomato),28 blue (EBFP2),29 and green (EGFP).30 These proteins feature negative surface charge, allowing electrostatic interactions with cationic NP1 and NP2. In the presence of biofilms, the fluorescently quenched31 AuNP–fluorescent protein conjugates are disrupted by the competitive interactions between the negatively charged EPS produced by the bacterial species and the cationic AuNPs, restoring the fluorescence, and hence generate discerning patterns for species recognition in the biofilm (Figure 1).
Figure 2.
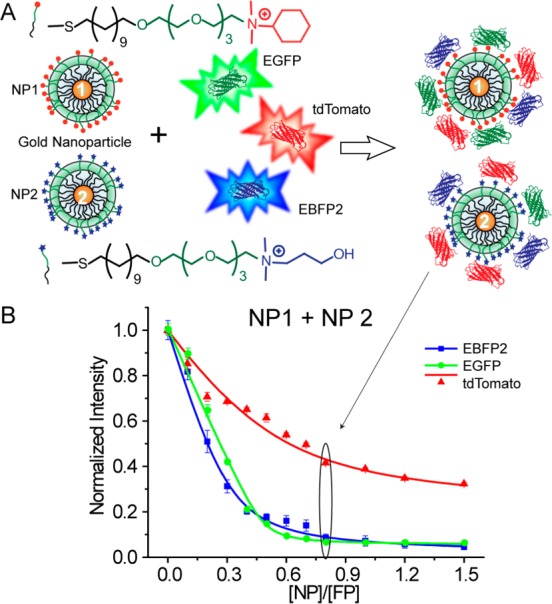
Schematic illustration of the sensor composition. (A) Sensor elements and molecular structures of the functional ligands of NP1 and NP2. (B) Fluorescence titration with an equal molar mixture of NP1 and NP2. Each value is an average of three data points, and the error bars are standard deviations.
In the sensor design, NP1 and NP2 were chosen to afford selective hydrophobic and hydrophilic interactions with target biofilms. The presence of both NPs could offer competitive hydrophobic/hydrophilic interactions with biofilm EPS, maximizing biofilm species composition differences. We first studied the binding affinities of the fluorescent proteins toward the two AuNPs by fluorescence titration. In these studies, an equimolar mixture of the three fluorescent proteins was titrated with NP1, NP2, and an equimolar mixture of NP1 and NP2 (Figure 2B and Figure S2). In all cases, with increasing NP concentrations, fluorescence from the three proteins was efficiently quenched. Nonlinear curve fitting was used to calculate the NP–protein complex stability constant (Ks) and association stoichiometry (n) (Table S1). To provide an effective dynamic range, we chose the point where the NP:fluorescent protein ratio was 0.8 (160 nM of total AuNPs and 200 nM of each fluorescent protein), generating efficient quenching of all three proteins.
After optimization of particle/protein concentrations, we tested the discriminatory power of our sensor against six bacterial strains representing five species (Amycolatopsis azurea, Bacillus licheniformic, Bacillus megaterium, Escherichia coli, Pseudomonas aeruginosa), including one clinical isolate each of uropathogenic E. coli. and P. aeruginosa. The bacteria were cultured for 3 days in a 96-well microplate in modified LB media (see Materials and Methods) at room temperature.32 Biofilms were observed in each of the culture wells. The particle/protein sensor solution was then added to each well and incubated for 45 min before reading. As shown in Figure 3A, the six bacterial biofilms displayed distinct response patterns. The two pathogenic bacteria, E. coli CD-3 and P. aeruginosa CD-1006, showed the lowest and the highest responses, respectively, in all three channels, and thus are clearly distinguished from biofilms formed by the remaining laboratory strains. Interestingly, the biofilms of B. licheniformis and P. aeruginosa, species known to form strong biofilms,33−35 exhibited higher sensor responses than biofilms of the other three species, indicating stronger interactions between the AuNPs and biofilms.
Figure 3.
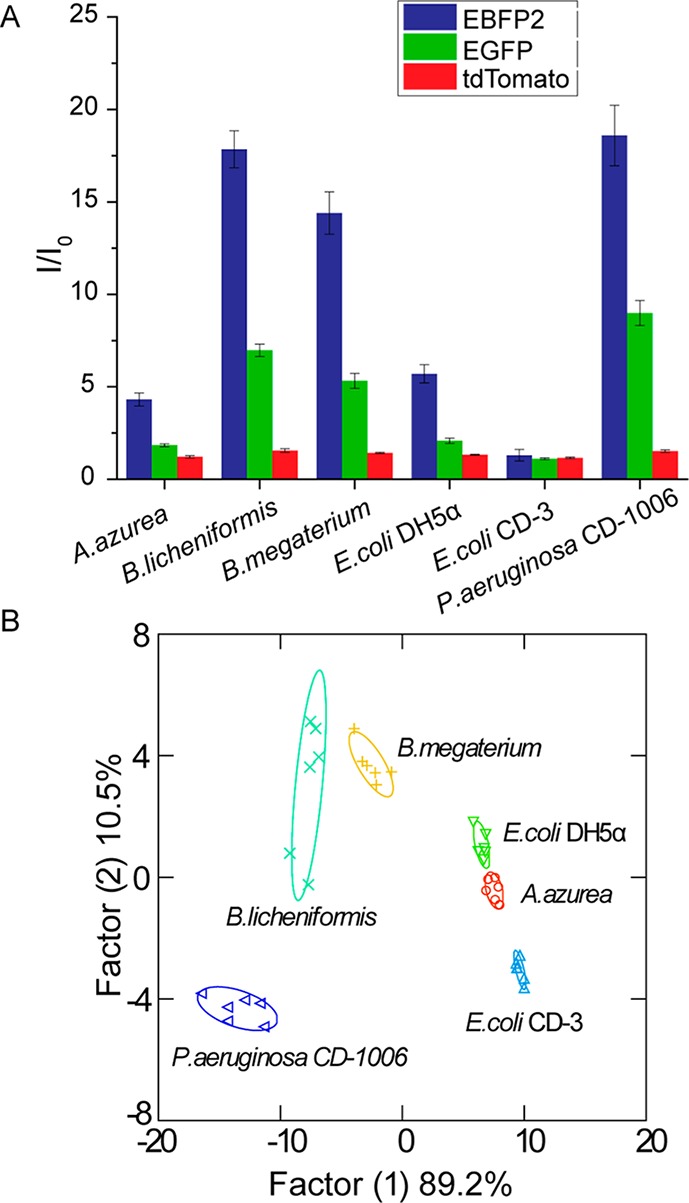
Detection and identification of biofilms formed by four laboratory and two uropathogenic strains of bacteria. (A) Triple-channel fluorescence response patterns in the presence of biofilms. I0 is the fluorescence intensity in the absence of biofilms. Each value is an average of six data points, and the error bars are standard deviations. (B) Canonical score plot of the fluorescence response patterns as obtained by LDA against the six bacterial biofilms.
Quantitative discrimination between the bacterial strains was obtained using linear discriminant analysis (LDA).36 According to the jackknifed classification matrix in the LDA,37 the six data groups each containing six points from each biofilm were classified and showed 100% separation. The canonical scores of the first two factors were plotted with 95% confidence ellipses in Figure 3B, showing 100% discrimination between the biofilms of the six bacterial strains. Comparison between individual channels and the three-channel system (Table S2) indicates that individual channels were incapable of complete classification, demonstrating the importance of multichannel sensing in detecting complex analytes such as biofilms. The biofilm-based clusters did not display Gram-stain-related separation. This is presumably because the structural differences between Gram-positive and Gram-negative bacteria are located primarily in their cell walls, which may be masked by the EPS in which the bacteria are embedded.
In addition to clustering, LDA is capable of identifying unknown samples once the system has been “trained” using a training set of analytes.38 In practice, four cultures of each of the six bacterial strains were prepared and labeled randomly to generate a pool of 24 unknown biofilm samples. The sensor identified 23 out of 24 samples (96%) correctly (see Table S3 for the detailed identification result), simultaneously demonstrating the diagnostic possibilities of the sensor and the robustness of the clustering.
Identifying bacterial biofilms on surfaces such as indwelling devices and implants is a critical capability. Determination of pathogens in biofilms occurring on human tissues and organs provides an equally important and even more challenging goal. In most cases, the bacterial pathogens of interest will be embedded in human tissues within biofilms composed of EPS, mammalian cells, and an extracellular matrix. To test the diagnostic capability of our multichannel sensor for wound biofilms, we employed a biofilm–fibroblast cell coculture39,40 as a model. Two bacteria, B. licheniformis and E. coli DH5α, were chosen as representative Gram-positive and Gram-negative species. The bacteria were seeded with a confluent NIH 3T3 (mouse fibroblast) cell monolayer41 overnight for biofilm formation. The cocultures were washed before sensing to remove planktonic bacteria and nonadherent 3T3 cells. The sensor response patterns for B. licheniformis biofilm-3T3 cells, E. coli DH5α-biofilm-3T3 cells, and noninfected 3T3 cells were different (Figure 4A), with LDA demonstrating 100% discrimination of the two cocultures and 3T3 cells (Figure 4B). As above, we tested the ability of this training set to diagnose unknown samples, recognizing 10 out of 12 samples correctly (see Table S4 for the detailed identification result). These studies indicate the potential of our system for detection and identification of biofilms in infected wounds.
Figure 4.
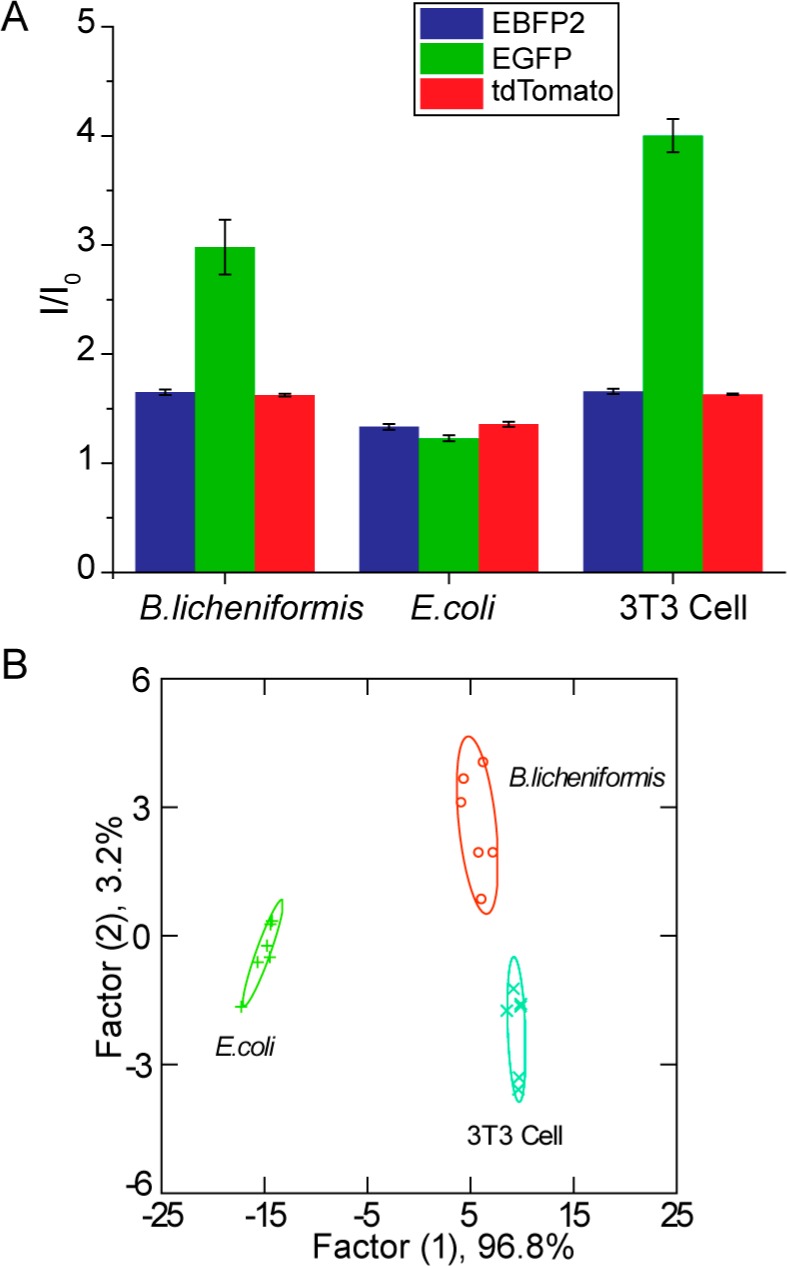
Detection and identification of biofilms grown on 3T3 fibroblast cells. (A) Triple-channel fluorescence response patterns in the presence of biofilms grown on fibroblast cells and 3T3 fibroblast cells alone. I0 is the fluorescence intensity in the absence of biofilms or 3T3 cells. Each value is an average of six data points, and the error bars are standard deviations. (B) LDA canonical score plot of the fluorescence response patterns.
Conclusion
In conclusion, we have developed a rapid (minutes) and effective multichannel sensor for identifying bacterial species, and even strains, in biofilms. Using this AuNP multichannel sensor, we successfully detected and differentiated biofilms formed by pathogenic and nonpathogenic bacteria. These determinations were effective with biofilms on surfaces and in a bacteria–mammalian cell coculture wound model. The optical basis of this system is an added benefit, facilitating translation to both visual42 and camera-based diagnostics.43 Taken together, these capabilities demonstrate the diagnostic potential of our sensor system, providing a tool that could enable targeted treatment of biofilm infections in lieu of broad-spectrum antibiotics.44
Materials and Methods
Fluorescent Proteins and Gold Nanoparticles
EBFP2,29 EGFP,45 and tdTomato28 were expressed in E. coli BL21 (DE3) and purified by means of Co2+-affinity chromatography. Cationic NP1 and NP2 (see Supporting Information for synthesis and characterization) were synthesized as previously reported.46,47
Fluorescence Titration
An equimolar solution of 200 nM EBFP2, 200 nM EGFP, and 200 nM tdTomato was mixed in 5 mM phosphate buffer (PB, pH = 7.4). The solution with fixed fluorescent protein concentration was then titrated with NPs at various concentrations from 0 to 150 nM. For the combination of NP1 and NP2, NPs were first mixed to make an equimolar solution, and the NP concentration was defined as the total NP concentration. After 15 min incubation at room temperature, the change of fluorescence intensity from three channels was measured using a Molecular Devices SpectraMax M2 plate reader. The excitation and emission wavelengths are 380 nm (ex) and 450 nm (em) for EBFP2; 475 nm (ex) and 510 nm (em) for EGFP; and 550 nm (ex) and 585 nm (em) for tdTomato. Nonlinear least-squares curve-fitting analysis by Origin (version 8.0) was employed to estimate the binding constant (Ks) and association stoichiometry (n), using a model in which the NP is assumed to possess the n equivalent of independent binding sites.48
Biofilm Formation in a 96-Well Microplate
Bacteria were inoculated in LB broth at 37 °C until stationary phase. The cultures were then harvested by centrifugation and washed with 0.85% sodium chloride solution three times. Concentrations of resuspended bacterial solution were determined by optical density measured at 600 nm. LB was supplemented with 0.1% glucose, 1 mM MgSO4, 0.15 M ammonium sulfate, and 34 mM citrate and buffered to pH 7 to ensure bacterial adherence to the microplate.32 Seeding solutions were then made in this modified LB to reach an OD600 of 0.1. A 195 μL amount of the seeding solutions was added to each well of the microplate. Modified LB medium without bacteria was used as a negative control. The plates were covered and incubated at room temperature under static conditions for 3 days. Fresh media was added on day 2. Planktonic bacteria were removed before sensing by washing with PB saline three times.
Sensing of Biofilms in a Microplate
The sensor was composed of 200 nM EBFP2, 200 nM EGFP, 200 nM tdTomato, 80 nM NP1, and 80 nm NP2 in 5 mM PB. The sensor was made fresh and incubated in the dark for 15 min before use. It was then added (200 μL) into each well containing a biofilm and incubated for 45 min. The fluorescence recovery was monitored using an Optima BMG Labtech plate reader (see Table S5 for the detailed results).
Biofilm–3T3 Fibroblast Cell Coculture
A total of 20 000 NIH 3T3 (ATCC CRL-1658) cells were cultured in Dulbecco’s modified Eagle medium (DMEM; ATCC 30-2002) with 10% bovine calf serum and 1% antibiotics at 37 °C in a humidified atmosphere of 5% CO2. Cells were kept for 48 h to reach a confluent monolayer. Bacteria were inoculated and harvested as described above, and seeding solutions were made in DMEM to reach an OD600 of 0.1. Old medium was removed from 3T3 cells followed by addition of 100 μL of seeding solution. The cocultures were then stored in a box with damp paper towels at 37 °C overnight. The cocultures were washed with PB saline three times before sensing to remove planktonic bacteria and nonadherent 3T3 cells.
Sensing of Biofilm–Fibroblast Cell Cocultures
The sensor was composed as described earlier and was made fresh and incubated in the dark for 15 min before sensing. A 150 μL portion of the sensing solution was added into each well containing a biofilm and then incubated for 5 min. The fluorescence recovery was monitored using a Molecular Devices Spectramax M2 plate reader (see Table S6 for the detailed results).
LDA Performance
Discrimination analysis was performed using SYSTAT (version 12.0). For biofilm sensing in the microplate, the raw data contained a matrix of 6 (replicates) × 6 (biofilms) × 3 (channels). The coculture studies generated a matrix of 6 (replicates) × 3 (biofilms plus 3T3 cells alone) × 3 (channels). All raw data were subjected to LDA to differentiate the fluorescence response of the multichannel system against different biofilm targets. The analysis maximized the ratio of between-class variance to within-class variance in both data sets, thereby enabling maximal separation. The matrixes were transformed to canonical factors that were linear combinations of the response patterns. The canonical factors contain a different percentage of the variation, and the first two were plotted in Figure 3B and Figure 4B.
The Blind Test
For identification of the unknown samples, we chose seeding solutions of interest and assigned them a random number. These seeding solutions were used to form biofilms and tested with the multichannel sensor. The average response of three data points was used to represent a single unknown sample. During LDA, the Mahalanobis distance of the unknown case, which is the distance of the new case to the centroid of respective groups generated through the training set, was calculated. Then the unknown case was classified to the group with the shortest Mahalanobis distance.
Acknowledgments
This research was supported by the NIH (GM GM077173). H.K. and X.Z. gratefully thank the China Scholarship Council (CSC)–Tsinghua University Postgraduate Scholarship Program and Tsinghua University Initiative Scientific Research Program for the financial support. Clinical samples were kindly provided to M.A.R. by the Cooley Dickinson Hospital Microbiology Laboratory (Northampton, MA, USA).
Author Contributions
⊥ X. Li and H. Kong contributed equally to this work.
Author Present Address
∥ Department of Materials, Imperial College London, South Kensington Campus, London SW7 2AZ, United Kingdom.
Supporting Information Available
This material is available free of charge via the Internet at http://pubs.acs.org.
The authors declare no competing financial interest.
Funding Statement
National Institutes of Health, United States
Supplementary Material
References
- Romling U.; Balsalobre C. Biofilm Infections, Their Resilience to Therapy and Innovative Treatment Strategies. J. Int. Med. 2012, 272, 541–561. [DOI] [PubMed] [Google Scholar]
- Costerton J. W.; Stewart P. S.; Greenberg E. P. Bacterial Biofilms: A Common Cause of Persistent Infections. Science 1999, 284, 1318–1322. [DOI] [PubMed] [Google Scholar]
- Parsek M. R.; Singh P. K. Bacterial Biofilms: An Emerging Link to Disease Pathogenesis. Annu. Rev. Microbiol. 2003, 57, 677–701. [DOI] [PubMed] [Google Scholar]
- Stewart P. S.; Costerton J. W. Antibiotic Resistance of Bacteria in Biofilms. Lancet 2001, 358, 135–138. [DOI] [PubMed] [Google Scholar]
- Fux C. A.; Stoodley P.; Hall-Stoodley L.; Costerton J. W. Bacterial Biofilms: A Diagnostic and Therapeutic Challenge. Expert Rev. Anti-Infect. Ther. 2003, 1, 667–683. [DOI] [PubMed] [Google Scholar]
- Hall-Stoodley L.; Hu F. Z.; Gieseke A.; Nistico L.; Nguyen D.; Hayes J.; Forbes M.; Greenberg D. P.; Dice B.; Burrows A.; etal. Direct Detection of Bacterial Biofilms on the Middle-Ear Mucosa of Children with Chronic Otitis Media. JAMA, J. Am. Med. Assoc. 2006, 296, 202–211. [DOI] [PMC free article] [PubMed] [Google Scholar]
- Shen Y.; Stojicic S.; Haapasalo M. Bacterial Viability in Starved and Revitalized Biofilms: Comparison of Viability Staining and Direct Culture. J. Endodont. 2010, 36, 1820–1823. [DOI] [PubMed] [Google Scholar]
- Stoodley P.; Conti S. F.; DeMeo P. J.; Nistico L.; Melton-Kreft R.; Johnson S.; Darabi A.; Ehrlich G. D.; Costerton J. W.; Kathju S. Characterization of a Mixed MRSA/MRSE Biofilm in an Explanted Total Ankle Arthroplasty. FEMS Immunol. Med. Microbiol. 2011, 62, 66–74. [DOI] [PubMed] [Google Scholar]
- Hall-Stoodley L.; Costerton J. W.; Stoodley P. Bacterial Biofilms: From the Natural Environment to Infectious Diseases. Nat. Rev. Microbiol. 2004, 2, 95–108. [DOI] [PubMed] [Google Scholar]
- Hall-Stoodley L.; Stoodley P.; Kathju S.; Hoiby N.; Moser C.; Costerton J. W.; Moter A.; Bjarnsholt T. Towards Diagnostic Guidelines for Biofilm-Associated Infections. FEMS Immunol. Med. Microbiol. 2012, 65, 127–145. [DOI] [PubMed] [Google Scholar]
- Flemming H. C.; Wingender J. The Biofilm Matrix. Nat. Rev. Microbiol. 2010, 8, 623–633. [DOI] [PubMed] [Google Scholar]
- Bridier A.; Dubois-Brissonnet F.; Boubetra A.; Thomas V.; Briandet R. The Biofilm Architecture of Sixty Opportunistic Pathogens Deciphered Using a High Throughput CLSM Method. J. Microbiol. Methods 2010, 82, 64–70. [DOI] [PubMed] [Google Scholar]
- Flemming H. C.; Neu T. R.; Wozniak D. J. The EPS Matrix: The “House of Biofilm Cells”. J. Bacteriol. 2007, 189, 7945–7947. [DOI] [PMC free article] [PubMed] [Google Scholar]
- Sutherland I. W. Biofilm Exopolysaccharides: A Strong and Sticky Framework. Microbiology (Reading, U.K.) 2001, 147, 3–9. [DOI] [PubMed] [Google Scholar]
- Ryder C.; Byrd M.; Wozniak D. J. Role of Polysaccharides in Pseudomonas Aeruginosa Biofilm Development. Curr. Opin Microbiol. 2007, 10, 644–648. [DOI] [PMC free article] [PubMed] [Google Scholar]
- Gotz F. Staphylococcus and Biofilms. Mol. Microbiol. 2002, 43, 1367–1378. [DOI] [PubMed] [Google Scholar]
- Vaningelgem F.; Zamfir M.; Mozzi F.; Adriany T.; Vancanneyt M.; Swings J.; De Vuyst L. Biodiversity of Exopolysaccharides Produced by Streptococcus Thermophilus Strains is Reflected in Their Production and Their Molecular and Functional Characteristics. Appl. Environ. Microbiol. 2004, 70, 900–912. [DOI] [PMC free article] [PubMed] [Google Scholar]
- Albert K. J.; Lewis N. S.; Schauer C. L.; Sotzing G. A.; Stitzel S. E.; Vaid T. P.; Walt D. R. Cross-Reactive Chemical Sensor Arrays. Chem. Rev. 2000, 100, 2595–2626. [DOI] [PubMed] [Google Scholar]
- Turner A. P. F.; Magan N. Electronic Noses and Disease Diagnostics. Nat. Rev. Microbiol. 2004, 2, 161–166. [DOI] [PubMed] [Google Scholar]
- Wright A. T.; Anslyn E. V. Differential Receptor Arrays and Assays for Solution-Based Molecular Recognition. Chem. Soc. Rev. 2006, 35, 14–28. [DOI] [PubMed] [Google Scholar]
- Costerton J. W.; Lewandowski Z.; Caldwell D. E.; Korber D. R.; Lappinscott H. M. Microbial Biofilms. Annu. Rev. Microbiol. 1995, 49, 711–745. [DOI] [PubMed] [Google Scholar]
- Donlan R. M.; Costerton J. W. Biofilms: Survival Mechanisms of Clinically Relevant Microorganisms. Clin. Microbiol. Rev. 2002, 15, 167–193. [DOI] [PMC free article] [PubMed] [Google Scholar]
- Phillips R. L.; Miranda O. R.; You C. C.; Rotello V. M.; Bunz U. H. F. Rapid and Efficient Identification of Bacteria Using Gold-Nanoparticle - Poly(para-phenyleneethynylene) Constructs. Angew. Chem., Int. Ed. 2008, 47, 2590–2594. [DOI] [PubMed] [Google Scholar]
- Duarte A.; Chworos A.; Flagan S. F.; Hanrahan G.; Bazan G. C. Identification of Bacteria by Conjugated Oligoelectrolyte/Single-Stranded DNA Electrostatic Complexes. J. Am. Chem. Soc. 2010, 132, 12562–12564. [DOI] [PubMed] [Google Scholar]
- Xue L.; Liu Q.; Jiang H. Ratiometric Zn2+ Fluorescent Sensor and New Approach for Sensing Cd2+ by Ratiometric Displacement. Org. Lett. 2009, 11, 3454–3457. [DOI] [PubMed] [Google Scholar]
- Wang Z.; Palacios M. A.; Zyryanov G.; Anzenhacher P. Harnessing a Ratiometric Fluorescence Output from a Sensor Array. Chem.—Eur. J. 2008, 14, 8540–8546. [DOI] [PubMed] [Google Scholar]
- Di Giulio M.; D’Ercole S.; Zara S.; Cataldi A.; Cellini L. Streptococcus Mitis/Human Gingival Fibroblasts Co-Culture: The Best Natural Association in Answer to the 2-Hydroxyethyl Methacrylate Release. Apmis 2012, 120, 139–146. [DOI] [PMC free article] [PubMed] [Google Scholar]
- Nandwana V.; Mout R.; Yeh Y. C.; Dickert S.; Tuominen M. T.; Rotello V. M. Patterning of Protein/Quantum Dot Hybrid Bionanostructures. J. Inorg. Organomet. Polym. 2013, 23, 227–232. [DOI] [PMC free article] [PubMed] [Google Scholar]
- Ai H. W.; Shaner N. C.; Cheng Z. H.; Tsien R. Y.; Campbell R. E. Exploration of New Chromophore Structures Leads to the Identification of Improved Blue Fluorescent Proteins. Biochemistry 2007, 46, 5904–5910. [DOI] [PubMed] [Google Scholar]
- Tsien R. Y. The Green Fluorescent Protein. Annu. Rev. Biochem. 1998, 67, 509–544. [DOI] [PubMed] [Google Scholar]
- Bajaj A.; Rana S.; Miranda O. R.; Yawe J. C.; Jerry D. J.; Bunz U. H. F.; Rotello V. M. Cell Surface-Based Differentiation of Cell Types and Cancer States Using a Gold Nanoparticle-GFP Based Sensing Array. Chem. Sci. 2010, 1, 134–138. [Google Scholar]
- Hamon M. A.; Lazazzera B. A. The Sporulation Transcription Factor Spo0A is Required for Biofilm Development in Bacillus Subtilis. Mol. Microbiol. 2001, 42, 1199–1209. [DOI] [PubMed] [Google Scholar]
- Blue S. R.; Singh V. R.; Saubolle M. A. Bacillus Licheniformis Bacteremia: Five Cases Associated with Indwelling Central Venous Catheters. Clin. Infect. Dis. 1995, 20, 629–633. [DOI] [PubMed] [Google Scholar]
- Klausen M.; Heydorn A.; Ragas P.; Lambertsen L.; Aaes-Jorgensen A.; Molin S.; Tolker-Nielsen T. Biofilm Formation by Pseudomonas Aeruginosa Wild Type, Flagella and Type IV Pili Mutants. Mol. Microbiol. 2003, 48, 1511–1524. [DOI] [PubMed] [Google Scholar]
- Rickard A. H.; McBain A. J.; Ledder R. G.; Handley P. S.; Gilbert P. Coaggregation between Freshwater Bacteria within Biofilm and Planktonic Communities. FEMS Microbiol. Lett. 2003, 220, 133–140. [DOI] [PubMed] [Google Scholar]
- Jurs P. C.; Bakken G. A.; McClelland H. E. Computational Methods for the Analysis of Chemical Sensor Array Data from Volatile Analytes. Chem. Rev. 2000, 100, 2649–2678. [DOI] [PubMed] [Google Scholar]
- Egan W. J.; Morgan S. L.; Bartick E. G.; Merrill R. A.; Taylor H. J. Forensic Discrimination of Photocopy and Printer Toners. II. Discriminant Analysis Applied to Infrared Reflection-Absorption Spectroscopy. Anal. Bioanal. Chem. 2003, 376, 1279–1285. [DOI] [PubMed] [Google Scholar]
- You C. C.; Miranda O. R.; Gider B.; Ghosh P. S.; Kim I. B.; Erdogan B.; Krovi S. A.; Bunz U. H. F.; Rotello V. M. Detection and Identification of Proteins Using Nanoparticle-Fluorescent Polymer ‘Chemical Nose’ Sensors. Nat. Nanotechnol. 2007, 2, 318–323. [DOI] [PubMed] [Google Scholar]
- Anderson G. G.; Moreau-Marquis S.; Stanton B. A.; O’Toole G. A. In Vitro Analysis of Tobramycin-treated Pseudomonas Aeruginosa Biofilms on Cystic Fibrosis-Derived Airway Epithelial Cells. Infect. Immun. 2008, 76, 1423–1433. [DOI] [PMC free article] [PubMed] [Google Scholar]
- Kim J.; Hegde M.; Jayaraman A. Co-Culture of Epithelial Cells and Bacteria for Investigating Host-Pathogen Interactions. Lab Chip 2010, 10, 43–50. [DOI] [PubMed] [Google Scholar]
- Anderson G. G.; Kenney T. F.; MacLeod D. L.; Henig N. R.; O’Toole G. A. Eradication of Pseudomonas Aeruginosa Biofilms on Cultured Airway Cells by a Fosfomycin/Tobramycin Antibiotic Combination. Pathog. Dis. 2013, 67, 39–45. [DOI] [PMC free article] [PubMed] [Google Scholar]
- Geladi P.; Esbensen K. Regression on Multivariate Images: Principal Component Regression for Modeling, Prediction and Visual Diagnostic Tools. J. Chemom. 1991, 5, 97–111. [Google Scholar]
- Martinez A. W.; Phillips S. T.; Carrilho E.; Thomas S. W.; Sindi H.; Whitesides G. M. Simple Yelemedicine for Developing Regions: Camera Phones and Paper-Based Microfluidic Devices for Real-Time, Off-Site Diagnosis. Anal. Chem. 2008, 80, 3699–3707. [DOI] [PMC free article] [PubMed] [Google Scholar]
- Krishnasami Z.; Carlton D.; Bimbo L.; Taylor M. E.; Balkovetz D. F.; Barker J.; Allon M. Management of Hemodialysis Catheter-Related Bacteremia with an Adjunctive Antibiotic Lock Solution. Kidney Int. 2002, 61, 1136–1142. [DOI] [PubMed] [Google Scholar]
- De M.; Rana S.; Rotello V. M. Nickel-Ion-Mediated Control of the Stoichiometry of His-Tagged Protein/Nanoparticle Interactions. Macromol. Biosci. 2009, 9, 174–178. [DOI] [PubMed] [Google Scholar]
- Brust M.; Walker M.; Bethell D.; Schiffrin D. J.; Whyman R. Synthesis of Thiol-Derivatised Gold Nanoparticles in a Two-Phase Liquid–Liquid System. J. Chem. Soc., Chem. Commun. 1994, 801–802. [Google Scholar]
- Hostetler M. J.; Templeton A. C.; Murray R. W. Dynamics of Place-Exchange Reactions on Monolayer-Protected Gold Cluster Molecules. Langmuir 1999, 15, 3782–3789. [Google Scholar]
- You C. C.; De M.; Han G.; Rotello V. M. Tunable Inhibition and Denaturation of Alpha-Chymotrypsin with Amino Acid-Functionalized Gold Nanoparticles. J. Am. Chem. Soc. 2005, 127, 12873–12881. [DOI] [PubMed] [Google Scholar]
Associated Data
This section collects any data citations, data availability statements, or supplementary materials included in this article.