Abstract
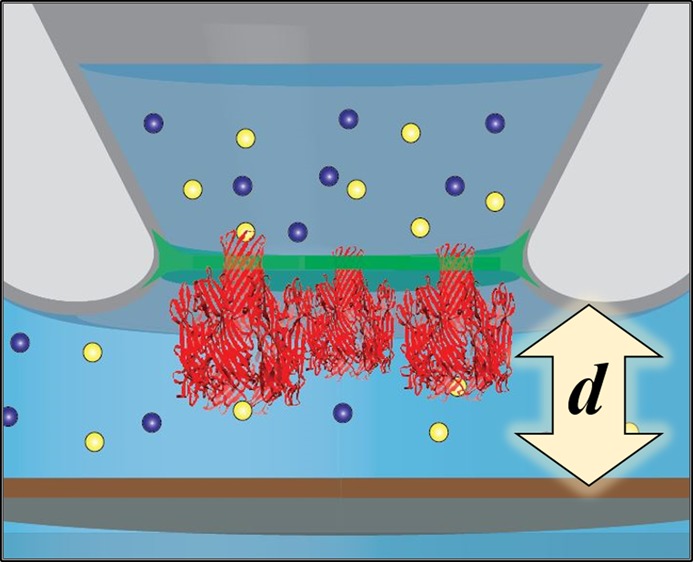
The sensitivity and selectivity of ion channels provide an appealing opportunity for sensor development. Here, we describe ion channel probes (ICPs), which consist of multiple ion channels reconstituted into lipid bilayers suspended across the opening of perflourinated glass micropipets. When incorporated with a scanning ion conductance microscope (SICM), ICPs displayed a distance-dependent current response that depended on the number of ion channels in the membrane. With distance-dependent current as feedback, probes were translated laterally, to demonstrate the possibility of imaging with ICPs. The ICP platform yields several potential advantages for SICM that will enable exciting opportunities for incorporation of chemical information into imaging and for high-resolution imaging.
Introduction
Ion channels reconstituted in suspended lipid bilayers (or black lipid membranes, BLMs) provide a powerful route to selective and sensitive manipulation of ion transport for chemical/biochemical separations and analysis.1 Next-generation sequencing devices, most notably those that incorporate α-hemolysin (α-HL), provide a prominent example of efforts to repurpose ion channels as tools for analysis.2−7 For such applications, BLMs with ion channels have been supported on a variety of platforms, which range from classic Teflon supports2,6 and patch-clamp pipettes8−11 to more recently developed materials such as polymer apertures12 and glass nanopores.13,14 Here, we utilize micropipets with supported BLMs that incorporate ion channels, referred to as ion channel probes (ICPs), as the probe for scanning ion conductance microscopy (SICM) (Figure 1). In traditional SICM, a micro- or nanopipet is rastered over a surface of interest bathed in an electrolyte solution.15−18 Ion current between an electrode inside the pipet and an electrode in the external solution is utilized to provide precise distance control between the pipet and substrate, to realize a method for high-resolution, noncontact imaging.19−21 In addition to topography, SICM and hybrid SICM techniques have been utilized to collect chemical information. Often in these experiments, the SICM feedback mechanism is used to control the position of an additional electrode or sensing device.22−25 ICPs provide opportunities to extend the utility of SICM by providing selective ion transport, high spatial resolution, and the possibility of ligand or mechanically gated ion transport. In this work, BLMs were formed on perfluorosilane modified glass pipets, which exhibit excellent electrical, mechanical and temporal stability.26 To form an ICP, α-HL was reconstituted into the resulting BLMs, and current-distance measurements were performed as the ICP approached a surface in an SICM experiment. Translation of the ICP over microfeatures with SICM feedback demonstrated the potential to use ion channel modified pipets for future studies in imaging.
Figure 1.
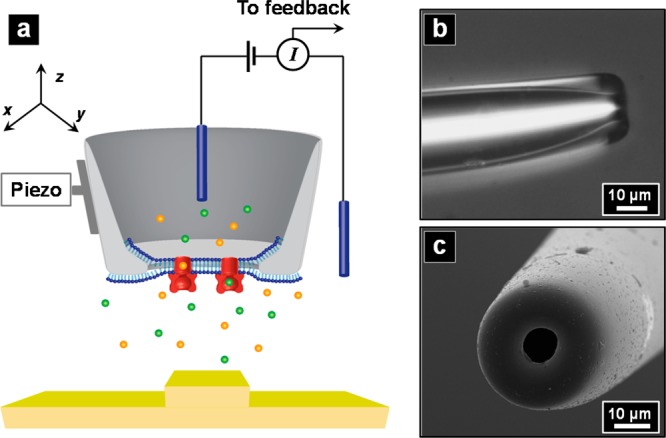
(a) Schematic of scanning ion conductance microscopy (SICM) with an ion channel probe (ICP) as the scanning probe. (b,c) Optical and SEM images of a typical glass pipet used.
Experimental Section
Chemicals and Materials
Deionized water (resistivity = 18 MΩ·cm) was obtained from a Milli-Q water purification system (Millipore Corp., Danvers, MA) for all solution preparation. Buffer solution (1 M KCl (Mallinckrodt, Philipsburg, NJ), 5 mM 4-(2-hydroxyethyl)-1-piperazineethanesulfonic acid (HEPES) (Sigma-Aldrich, St. Louis, MO)) was adjusted to pH 7.4 and was filtered with 0.22 μm PVDF filter membranes (Millipore Corp., Danvers, MA) before use. (Tridecafluoro-1,1,2,2-tetrahydrooctyl) dimethylchlorosilane (PFDCS) was purchased from Gelest (Morrisville, PA). 1,2-Diphytanoyl-sn-glycero-3-phosphocholine (DPhPC) was purchased from Avanti Polar Lipids (Alabaster, AL). α-Hemolysin (α-HL) was purchased from Sigma-Aldrich (St. Louis, MO). Polydimethylsiloxane (PDMS) (Dow Corning, Midland, MI) was utilized as recommended by the manufacturer.
Sample and Pipet Preparation
PDMS surfaces and PDMS replicas of features milled in a silicon wafer by focused ion beam (FIB, Zeiss Auriga, Oberkochen, Germany) were utilized as substrates for distance-dependent measurements. Line profiles of PDMS features were obtained with a surface profiler (Dektak 6 M, Veeco, Plainview, NY) to compare with the ICP-SICM line scans. Borosilicate capillaries (O.D. 1.0 mm, I.D. 0.58 mm, Sutter Instruments, Novato, CA) were pulled into pipets with a P-2000 micropipet puller (Sutter Instruments), followed by cutting and polishing with a microforge (F-500, Technical Products International, St. Louis, MO), to obtain desired pipet tip dimensions (O.D. ∼ 30 μm, I.D. ∼10 μm, as observed in optical and scanning electron microscopy (SEM) images, Figure 1b,c). Polished pipets were then modified with PFDCS26 by vapor phase silanization.
Black Lipid Membrane Formation and Ion Channel Reconstitution
BLMs were formed on pipets by a tip-dip method.9,11 DPhPC was dried with N2, lyophilized overnight, and subsequently resuspended in n-decane at a final concentration of 10 mg/mL. Pipets were backfilled with buffer solution (1 M KCl, 5 mM HEPES, pH 7.4) and mounted in a patch clamp amplifier (Axopatch 200B, Molecular Devices, Sunnyvale, CA). An aliquot of DPhPC (0.5 μL) was added to the bath solution near the pipet tip, and the pipet was first lifted up and then lowered back into solution. A 20 Hz square wave test pulse of 5 mV was applied to confirm formation of BLM (∼40 GΩ resistances were obtained for formation of BLMs compared to ∼200 kΩ for open pipets). Breakdown voltages in the range of 450–700 mV (pulse duration 50 ms) were typically observed for PFDCS-modified pipets. α-HL (2 μL, 0.5 mg/mL in water) was added to the bath solution (500 μL) with an applied potential of −40 mV across the BLM. Probe current resulting from α-HL insertion (0.9 nS per α-HL channel; −36 pA at −40 mV) was further utilized as the source of feedback control for SICM.
Instrumentation
A ScanIC scanning ion conductance microscope (ionscope, Ltd., London, UK) was operated in distance-modulated mode to obtain approach curves and line scans.15,18 All data was recorded with a Digidata 1440 digitizer and pClamp 10 (Molecular Devices, Sunnyvale, CA).
Results and Discussion
BLM Characterization and Ion Channel Formation
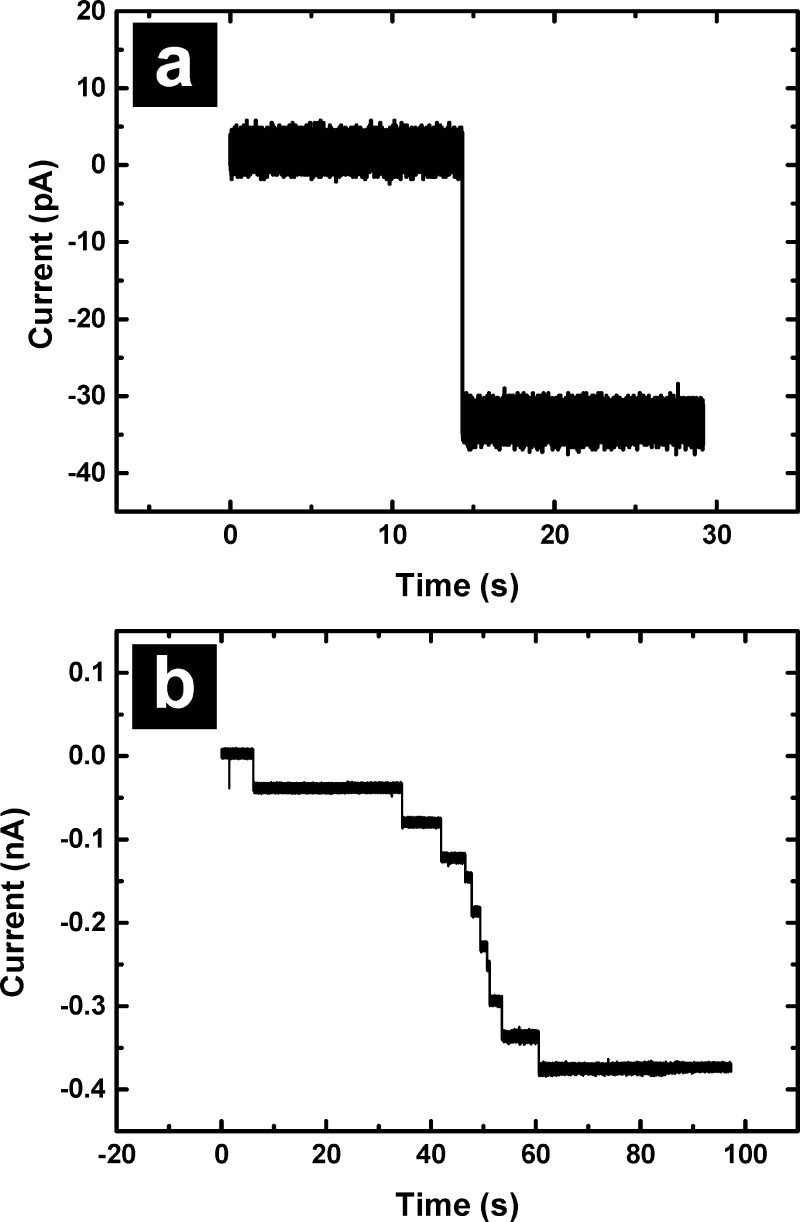
ICPs were formed via reconstitution of α-HL into BLMs suspended on PFDCS-modified glass pipets, which were previously shown to support rapid formation of highly stable BLMs.26 The presence of a BLM was verified electrically by monitoring the breakdown voltage and observing current transients, which together differentiate the BLM from multilayer lipid structures and clogs (Supporting Information, Figure S1). Insertion of individual α-HL channels was observed as a step increase in current under an applied potential of −40 mV. Figure 2a shows a conductance increase of 0.9 nS, which is typical for a single α-HL channel in 1 M KCl.27,28 Figure 2b shows insertion of multiple α-HL channels into a BLM suspended on a PFDCS-modified pipet to form an ICP. The number of α-HL channels inserted, which ultimately determines the maximum probe current, can be controlled via dilution of the bath once the requisite number is inserted. For the key proof of concept experiments reported here, ICPs were prepared with multiple α-HL channels to ensure sufficient current for feedback.
Figure 2.
(a) Reconstitution of a single α-HL in a BLM. (b) Reconstitution of multiple α-HL channels, which allows control of ICP conductance.
Pipet Current and Distance Characteristic
In SICM, probe–sample distance is regulated by monitoring ion current through the probe. With a constant potential applied, ion current is at a maximum value when the probe is far away from the sample surface. As the probe approaches the surface, ion current decreases due to a distance-dependent access resistance (Racc) that develops between the pipet and the sample surface. Racc can be estimated from eq 1,19 where ro and ri are the outer and inner radius of the tip opening, κ is the conductivity of electrolyte, and d is the probe-sample distance. Ion current is determined by the applied potential U and total resistance (RT, eq 2), which includes a constant pipet resistance (Rp, due to pipet geometry in traditional SICM) and Racc. From eq 2, current reaches a maximum when the probe–sample distance d is large, and changes in current are observed when the probe is moved close to a surface (small d). To obtain realistic current reductions for feedback control, the relationship between the access resistance and probe resistance must also be considered (eq 4).
| 1 |
| 2 |
| 3 |
| 4 |
For ICPs, the probe resistance is predominantly determined by the ion channel resistance. For a single α-HL, the channel resistance is 1.11 GΩ in 1 M KCl, which is higher than pipets used in conventional SICM (e.g., Rp ∼ 10 MΩ in 1 M KCl, I.D. ∼ 100 nm, O.D.∼ 150 nm). In conventional SICM, a current change, provided by the access resistance, of 0.5–3% is utilized to control probe position. For instance, access resistances on the order of 0.1 MΩ are sufficient to control probe position at a probe–sample distance of 160 nm (a 1% decrease in current) for the pipet described above. In contrast, for the case of a single α-HL channel, an access resistance of 0.01 GΩ would be necessary to generate a 1% decrease in the measured probe current. From eq 1, the relationship between the inner/outer probe radius and probe-sample distance can be examined. For a single α-HL channel (conducting pore diameter ca. 2.5 nm) and a probe-sample distance of 100 nm, a physically unrealistic outer pipet diameter of 38 m is required to achieve 1% current reduction. If the probe-sample distance is set at 20 nm, the outer diameter required becomes 281 nm; however, there are difficulties in operating at such small probe-sample distances. Difficulties include sample and pipet tip roughness or the tilt between the sample and pipet tip. Additionally, larger distances provide some protection for the integrity of the BLM at the probe tip. Thus, to operate at larger scales (e.g., probe-sample distance larger than 20 nm), the probe conductance was increased by addition of multiple α-HL channels, which resulted in manageable access resistances for probes with 30 μm outer diameter.
ICPs with different numbers of α-HL were approached to a PDMS surface, and the current response as a function of probe-sample distance was recorded (Figure 3). Comparison between a bare pipet and an ICP is shown in Figure 3a. For the ICP, significant current changes are observed at distances on the order of 100 nm, which results in a much steeper approach curve. In Figure 3b, three different pipets (pipet 1: I.D. 7.8 μm and O.D. 27.0 μm; pipet 2: I.D. 8.7 μm and O.D. 28.3 μm; pipet 3: I.D. 11.0 μm and O.D. 42.6 μm) were modified with different numbers of ion channels (12, 20, 22, 45, and 60 ion channels, determined from the total current) to form ICPs. After approach of an ICP to a surface, the probe was retracted, and a high potential was applied to intentionally break the BLM and collect bare pipet recordings for comparison (bare pipet approach curves for pipet 2 and pipet 3 can be found in Supporting Information Figure S2). Approach curves were referenced to a single point by calculating the derivative of these curves, where a maximum current change is assumed to be obtained when the probe-sample distance is zero. In an ideal situation, the current should be zero when the pipet touches the surface, but due to the size of the probe tip and any tip–sample tilt or surface roughness, a zero current value was not obtained until the pipet was moved further into the PDMS substrate to completely seal the tip at the surface. Owing to this effect, approach curves shown extend to distances beyond zero. From eq 1, the access resistance is proportional to the natural log of the ratio between the outer and inner diameter (the inner diameter is assumed to be linear with the number of ion channels), and the probe resistance is linear with the number of ion channels (by eqs 1 and 4). The net result is that the change in normalized current at a set probe-sample distance obeys a nonlinear relationship with the number of ion channels incorporated. Experimental results match well with this model, which predicts that ICPs with more ion channels would sense the sample surface earlier (at greater probe-substrate distances) than probes with fewer ion channels. For ICP 1 with 12 α-HL ion channels, a 2% current decrease is observed for a probe-sample distance on the order of 100 nm. For ICP 2 with 20 and 22 α-HL, a 2% current decrease is observed at a probe–substrate distance of approximately 240 nm. For ICP 3 with 45 and 60 α-HL, the probe begins to sense the surface microns from the surface, with a 2% current decrease observed at 1.4 and 1.7 μm above the surface. These distances are much larger than ICPs 1 and 2 with fewer ion channels, and is a consequence not only of the smaller pipet resistance (more ion channels), but also of the larger O.D. of ICP 3. Thus, for the same set point (current reduction value), ICPs with fewer ion channels can be controlled more easily at distances closer to the surface, which may provide key advantages for high resolution imaging.
Figure 3.
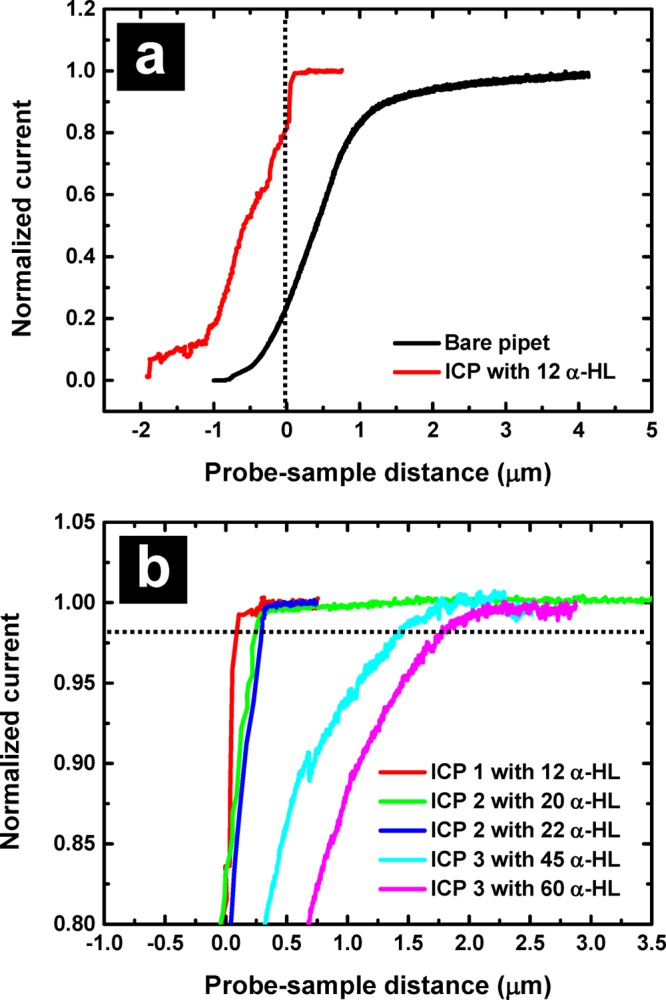
(a) Approach curves of an ICP and the support pipet (bare pipet after electrical breakdown). The black dashed line indicates the position when the probe-sample distance is zero. (b) Approach curves of ICPs with different numbers of ion channels. For reference, the black dashed line indicates a probe–sample distance with a 2% current decrease.
When ICPs touched the sample surface (e.g., probes 2 and 3), the integrity of the BLM was retained, which was observed by first approaching the surface past the “zero point” discussed above, then retracting the pipet, and reapproaching. Second approach curves where additional α-HL was incorporated without rupturing the bilayer are shown in Figure 3b. This likely occurs due to curvature of the probe tip, which results in the BLM being recessed from the tip of the probe, such that when the ICP tip touched the surface, the PDMS deformed and did not rupture the BLM. Importantly, for situations such as this, as long as a proper set point (0.5% to 2% decrease in current) is chosen, ICPs can maintain a constant distance from the sample surface (illustrated in Figure 3b, black dashed line represents 98% current level or 2% current decrease). Taken in total, control of the number of α-HL channels incorporated in the ICP results in a versatile method to control probe position.
Line Scan and Imaging with ICP-SICM
To validate the use of ICPs for imaging applications, preliminary line scans and images were obtained with SICM using ICPs. Figure 4a shows a SEM image and a SICM topographic image obtained with an ICP with 34 α-HL (−1.21 nA at −40 mV bias). Figure 4b shows a single line profile taken from Figure 4a plotted with the line profile obtained with a surface profiler on the same feature. ICPs with this number of α-HL were chosen to provide stable feedback control, due to a larger feedback signal and larger probe–sample distance. The edge of the feature in the image and the line profile are not very sharp, a consequence of the outer diameter of the ICP (∼30 μm), however the profile compares well with the surface profiler (5 μm tip diameter). Line scans from ICP-SICM and the surface profiler both agree well with the measured width and height of this PDMS feature (7.2 and 1.9 μm, respectively). ICPs provided good resolution and control of probe position in the vertical direction, although the lateral resolution was limited by the probe size. These results clearly demonstrate the ability to control probe position and the feasibility of imaging with ICP-SICM.
Figure 4.
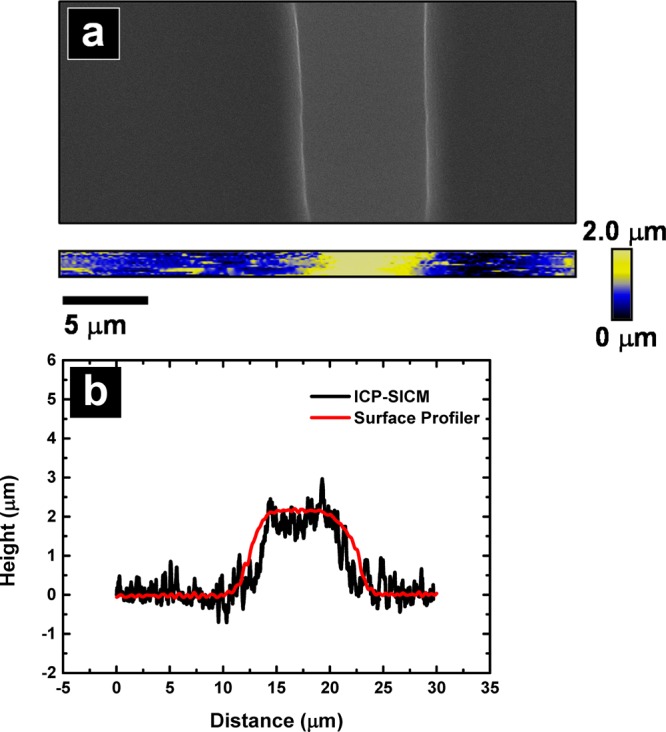
(a) Electron micrograph of a bar-shaped feature (7.2 μm in width and 1.9 μm in height) on PDMS and a topographic image obtained with an ICP. (b) Line profile from the ICP with SICM topographic image and line profile obtained from a surface profiler.
Outlook
In this work, we demonstrated the use of ICPs as the scanning probe in SICM for the first time. From measurements of the current as a function of probe-sample distance, feedback for SICM experiments can be obtained with ICPs. For micropipets used here, the number of α-HL channels incorporated into ICPs was critical to generate appropriate current levels for feedback. Preliminary results also demonstrate the possibility of using ICPs for topographic imaging. The combination of ion channels with the precision positioning afforded by SICM holds many future applications, including increased SICM spatial resolution. For enhanced resolution with smaller tips, diffusion of ion channels in the BLM is a factor that must be considered. Polymerized BLMs may provide a route to combat diffusion, and we are presently investigating this route.
Similar to patch-cramming or sniffer-patch experiments, the ICPs formed here could also capitalize on ligand or mechanically gated ion channels for incorporation of chemical and physical sensitivity/selectivity into SICM measurements and for creation of platforms that mimic cell–cell contacts.29−31 Future work may also incorporate smaller glass pipets, where both the inner and outer dimensions of the probe could allow incorporation of fewer ion channels. Additionally, multibarrel ICP platforms may provide an opportunity to overcome some limitations encountered in this study. In summary, the integration of ICPs to SICM is poised to enable several key advances in SICM imaging and improved spatial resolution.
Acknowledgments
This work was supported in part by the Indiana University FRSP program (L.A.B) and the National Institutes of Health under Grant Nos. GM095763 and EB007047 (C.A.A).
Supporting Information Available
Additional details regarding BLMs, current distance, and the line scans obtained. This material is available free of charge via the Internet at http://pubs.acs.org.
The authors declare no competing financial interest.
Funding Statement
National Institutes of Health, United States
Supplementary Material
References
- Bayley H.; Martin C. R. Resistive-Pulse SensingFrom Microbes to Molecules. Chem. Rev. (Washington, DC, U. S.) 2000, 100, 2575–2594. [DOI] [PubMed] [Google Scholar]
- Kasianowicz J. J.; Henrickson S. E.; Weetall H. H.; Robertson B. Simultaneous Multianalyte Detection with a Nanometer-Scale Pore. Anal. Chem. 2001, 73, 2268–2272. [DOI] [PubMed] [Google Scholar]
- Branton D.; Deamer D. W.; Marziali A.; Bayley H.; Benner S. A.; Butler T.; Di Ventra M.; Garaj S.; Hibbs A.; Huang X.; Jovanovich S. B.; Krstic P. S.; Lindsay S.; Ling X. S.; Mastrangelo C. H.; Meller A.; Oliver J. S.; Pershin Y. V.; Ramsey J. M.; Riehn R.; Soni G. V.; Tabard-Cossa V.; Wanunu M.; Wiggin M.; Schloss J. A. The Potential and Challenges of Nanopore Sequencing. Nat. Biotechnol. 2008, 26, 1146–1153. [DOI] [PMC free article] [PubMed] [Google Scholar]
- Vercoutere W.; Winters-Hilt S.; Olsen H.; Deamer D.; Haussler D.; Akeson M. Rapid Discrimination among Individual DNA Hairpin Molecules at Single-Nucleotide Resolution Using an Ion Channel. Nat. Biotechnol. 2001, 19, 248–252. [DOI] [PubMed] [Google Scholar]
- Henrickson S. E.; Misakian M.; Robertson B.; Kasianowicz J. J. Driven DNA Transport into an Asymmetric Nanometer-Scale Pore. Phys. Rev. Lett. 2000, 85, 3057–3060. [DOI] [PubMed] [Google Scholar]
- Kasianowicz J. J.; Brandin E.; Branton D.; Deamer D. W. Characterization of individual polynucleotide molecules using a membrane channel. Proc. Natl. Acad. Sci. U. S. A. 1996, 93, 13770–13773. [DOI] [PMC free article] [PubMed] [Google Scholar]
- Lathrop D. K.; Ervin E. N.; Barrall G. A.; Keehan M. G.; Kawano R.; Krupka M. A.; White H. S.; Hibbs A. H. Monitoring the Escape of DNA from a Nanopore Using an Alternating Current Signal. J. Am. Chem. Soc. 2010, 132, 1878–1885. [DOI] [PMC free article] [PubMed] [Google Scholar]
- Göpfrich K.; Kulkarni C. V.; Pambos O. J.; Keyser U. F. Lipid Nanobilayers to Host Biological Nanopores for DNA Translocations. Langmuir 2012, 29, 355–364. [DOI] [PubMed] [Google Scholar]
- Hanke W.; Methfessel C.; Wilmsen U.; Boheim G. Ion Channel Reconstitution into Lipid Bilayer Membranes on Glass Patch Pipettes. Bioelectrochem. Bioenerg. 1984, 12, 329–339. [Google Scholar]
- Suarez-Isla B. A.; Wan K.; Lindstrom J.; Montal M. Single-Channel Recordings from Purified Acetylcholine Receptors Reconstituted in Bilayers Formed at the Tip of Patch Pipets. Biochemistry 1983, 22, 2319–2323. [DOI] [PubMed] [Google Scholar]
- Coronado R.; Latorre R. Phospholipid Bilayers Made from Monolayers on Patch-Clamp Pipettes. Biophys. J. 1983, 43, 231–236. [DOI] [PMC free article] [PubMed] [Google Scholar]
- Baker C. A.; Bright L. K.; Aspinwall C. A. Photolithographic Fabrication of Microapertures with Well-Defined, Three-Dimensional Geometries for Suspended Lipid Membrane Studies. Anal. Chem. 2013, 85, 9078–9086. [DOI] [PMC free article] [PubMed] [Google Scholar]
- Ervin E. N.; Kawano R.; White R. J.; White H. S. Simultaneous Alternating and Direct Current Readout of Protein Ion Channel Blocking Events Using Glass Nanopore Membranes. Anal. Chem. 2008, 80, 2069–2076. [DOI] [PubMed] [Google Scholar]
- White R. J.; Ervin E. N.; Yang T.; Chen X.; Daniel S.; Cremer P. S.; White H. S. Single Ion-Channel Recordings Using Glass Nanopore Membranes. J. Am. Chem. Soc. 2007, 129, 11766–11775. [DOI] [PubMed] [Google Scholar]
- Chen C.-C.; Zhou Y.; Baker L. A. Scanning Ion Conductance Microscopy. Annu. Rev. Anal. Chem. 2012, 5, 207–228. [DOI] [PubMed] [Google Scholar]
- Novak P.; Li C.; Shevchuk A. I.; Stepanyan R.; Caldwell M.; Hughes S.; Smart T. G.; Gorelik J.; Ostanin V. P.; Lab M. J.; Moss G. W. J.; Frolenkov G. I.; Klenerman D.; Korchev Y. E. Nanoscale Live-Cell Imaging Using Hopping Probe Ion Conductance Microscopy. Nat. Methods 2009, 6, 279–281. [DOI] [PMC free article] [PubMed] [Google Scholar]
- Hansma P. K.; Drake B.; Marti O.; Gould S. A. C.; Prater C. B. The Scanning Ion-Conductance Microsope. Science 1989, 243, 641–643. [DOI] [PubMed] [Google Scholar]
- Korchev Y. E.; Milovanovic M.; Bashford C. L.; Bennett D. C.; Sviderskaya E. V.; Vodyanoy I.; Lab M. J. Specialized Scanning Ion-Conductance Microscope for Imaging of Living Cells. J. Microsc. (Oxford) 1997, 188, 17–23. [DOI] [PubMed] [Google Scholar]
- Nitz H.; Kamp J.; Fuchs H. A Combined Scanning Ion-Conductance and Shear-Force Microscope. Probe Microsc. 1998, 1, 187–200. [Google Scholar]
- Rheinlaender J.; Schaffer T. E. Image Formation, Resolution, and Height Measurement in Scanning Ion Conductance Microscopy. J. Appl. Phys. 2009, 105, 094905. [Google Scholar]
- Edwards M. A.; Williams C. G.; Whitworth A. L.; Unwin P. R. Scanning Ion Conductance Microscopy: A Model for Experimentally Realistic Conditions and Image Interpretation. Anal. Chem. 2009, 81, 4482–4492. [DOI] [PubMed] [Google Scholar]
- Chen C.-C.; Zhou Y.; Baker L. A. Single-Nanopore Investigations with Ion Conductance Microscopy. ACS Nano 2011, 5, 8404–8411. [DOI] [PMC free article] [PubMed] [Google Scholar]
- Zhou Y.; Chen C.-C.; Baker L. A. Heterogeneity of Multiple-Pore Membranes Investigated with Ion Conductance Microscopy. Anal. Chem. 2012, 84, 3003–3009. [DOI] [PMC free article] [PubMed] [Google Scholar]
- Chen C.-C.; Zhou Y.; Morris C. A.; Hou J.; Baker L. A. Scanning Ion Conductance Microscopy Measurement of Paracellular Channel Conductance in Tight Junctions. Anal. Chem. 2013, 85, 3621–3628. [DOI] [PMC free article] [PubMed] [Google Scholar]
- Takahashi Y.; Shevchuk A. I.; Novak P.; Murakami Y.; Shiku H.; Korchev Y. E.; Matsue T. Simultaneous Noncontact Topography and Electrochemical Imaging by SECM/SICM Featuring Ion Current Feedback Regulation. J. Am. Chem. Soc. 2010, 132, 10118–10126. [DOI] [PubMed] [Google Scholar]
- Bright L. K.; Baker C. A.; Agasid M. T.; Ma L.; Aspinwall C. A. Decreased Aperture Surface Energy Enhances Electrical, Mechanical, and Temporal Stability of Suspended Lipid Membranes. ACS Appl. Mater. Interfaces 2013, 5, 11918–11926. [DOI] [PMC free article] [PubMed] [Google Scholar]
- Bayley H.; Cremer P. S. Stochastic Sensors Inspired by Biology. Nature 2001, 413, 226–230. [DOI] [PubMed] [Google Scholar]
- Deamer D. W.; Branton D. Characterization of Nucleic Acids by Nanopore Analysis. Acc. Chem. Res. 2002, 35, 817–825. [DOI] [PubMed] [Google Scholar]
- Allen T. G. J. The ‘Sniffer-Patch’ Technique for Detection of Neurotransmitter Release. Trends Neurosci. 1997, 20, 192–197. [DOI] [PubMed] [Google Scholar]
- Kramer R. H. Patch Cramming: Monitoring Intracellular Messengers in Intact Cells with Membrane Patches Containing Detector Inn Channels. Neuron 1990, 4, 335–341. [DOI] [PubMed] [Google Scholar]
- Trivedi B.; Kramer R. H. Real-Time Patch-Cram Detection of Intracellular cGMP Reveals Long-Term Suppression of Responses to NO and Muscarinic Agonists. Neuron 1998, 21, 895–906. [DOI] [PubMed] [Google Scholar]
Associated Data
This section collects any data citations, data availability statements, or supplementary materials included in this article.


