Abstract
T cell receptor (TCR) αβ+CD4−CD8− double negative T cells represent a rare T cell subset implicated in the pathogenesis of several autoimmune diseases. We investigated the DNA methylation signature of double negative T cells to gain insight into the epigenetic architecture of peripheral blood primary human double negative T cells compared to autologous CD4+ and CD8+ T cells. We identified 2984 CG sites across the genome with unique loss of DNA methylation in double negative T cells, and showed significant reduction in mRNA expression of DNA methyltransferases DNMT1, DNMT3A, and DNMT3B. DNA methylation was increased in CD8A/CD8B and CD4 consistent with epigenetic repression of both the CD8 and CD4 genetic loci in double negative T cells. We show a consistent increase in non-CG methylation in double negative T cells, a finding suggestive of pluripotency. Network analyses indicate a strong relationship between double negative T cells and functions related to cell –cell interaction, cell adhesion, and cell activation pathways. Our data also suggest a robust pro-inflammatory epigenetic signature in double negative T cells, consistent with a transcriptional permissiveness in key inflammatory cytokines including IFNγ, IL-17F, IL-12B, IL-5, IL-18, TNFSF11 (RANKL), and TNFSF13B (BLYS or BAFF). These findings highlight an epigenetic basis for a role of double negative T cells in autoimmunity.
Keywords: Double negative, T cell, Epigenome, Methylome, DNA methylation
1. Introduction
TCRαβ+CD4−CD8− double-negative (DN) T cells represent a rare subset of T cells with a controversial role in the immune system. DN T cell proliferation is significantly increased in the peripheral blood and in involved tissues in several autoimmune diseases [1-5]. In addition, DN T cells exhibit a pro-inflammatory phenotype marked by IL-17 secretion and immune cell recruitment, and have been shown to promote immunoglobulin production in inflamed tissues of patients with autoimmune lymphoproliferative syndrome (ALPS), primary Sjögren's syndrome, and systemic lupus erythe-matosus (SLE) [1-5]. In contrast, DN T cells of healthy individuals have been described as an immunoregulatory T cell subset able to effectively suppress immune functions of CD4+ and CD8+ T cells [6,7].
DNA methylation, an epigenetic modification that determines chromatin structure and transcriptional accessibility, has a crucial role in determining immune cell function. Importantly, DNA methylation regulates cytokine and transcription factor expression which can determine immune responses and, in CD4+ T cells, differentiation into effector T cell subsets [8]. Further, CREMα-mediated epigenetic remodeling and silencing of CD8 has been recently demonstrated to result in DN T cell expansion [9].
In this study, we characterize the DNA methylome of DN T cells and determine their unique epigenetic architecture by comparing genome-wide DNA methylation patterns in human CD4+, CD8+ and DN T cells from the peripheral blood. Genes hypomethylated in DN compared to both CD4+ and CD8+ T cells were then analyzed for patterns in immune function and regulation using bioinformatic approaches. Our findings show that cell-specific demethylation in DN T cells is highly enriched for immune response genes functioning in celladhesion and immune cell activation.
2. Materials and methods
2.1. T cell isolation and DNA extraction
Peripheral blood mononuclear cells (PBMCs) were isolated from fresh blood samples of 7 unrelated healthy women (age range: 25–60) (Supplementary Table 1) by Ficoll-gradient centrifugation (GE Healthcare Bio-Sciences AB, Uppsala, Sweden). Subsequently, T cells were negatively-selected using the Human Pan T Cell Isolation II kit (Miltenyi Biotec, Cambridge, MA). T cells were then analyzed and sorted into TCRαβ+CD4+ T cells, TCRαβ+CD8+ T cells, and TCRαβ+ DN T cell subsets by flow cytometry. DNA was isolated from CD4+, CD8+, and DN T cell subsets using the DNeasy Blood and Tissue Kit (Qiagen, Valencia, CA), then bisulfite-converted using the EZ DNA Methylation kit (Zymo Research, Irvine, CA) for DNA methylation studies.
2.2. Flow cytometry
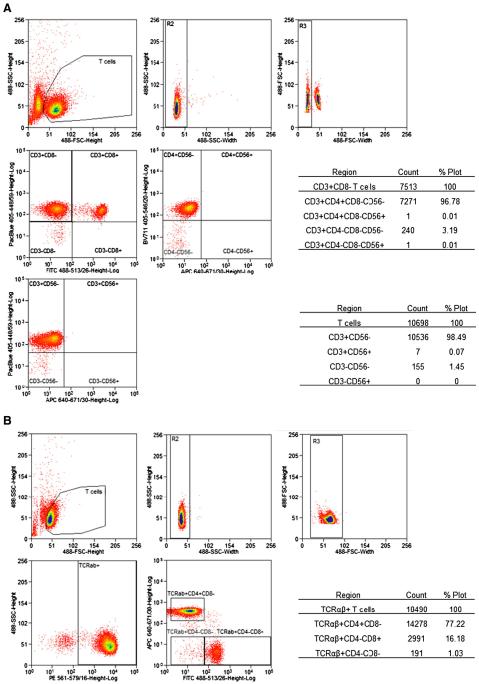
Flow cytometry was performed using the following anti-bodies: APC anti-human CD4 (OKT4), Brilliant Violet 711 anti-human CD4 (OKT4), APC anti-human CD56 (HCD56), FITC anti-human CD8a (RPA-T8), Pacific Blue anti-human CD3 (HIT3a), and PE anti-human alpha/beta-TCR (IP26) (BioLegend, San Diego, CA). Analysis and sorting were performed using MoFlow Astrios and Summit software v6.2.3 (Beckman Coulter, Miami, FL). First, live samples were plotted by forward scatter (FSC) and side scatter channels (SSC) then gated on T cells (Fig. 1). Cell aggregates were excluded by gating on T cells plotted by SSC-width versus SSC-height and FSC-width versus FSC-height. For cell purity analyses, T cells were plotted in the Pacific Blue and APC channels to show N 97% CD3+ T cell purity using the Pacific Blue anti-human CD3 antibody and N 98% CD3+CD56− purity from invariant NK T cells using APC anti-human CD56 (Fig. 1A). For cell sorting, T cells were plotted by side scatter and PE channels to gate TCRαβ+ cells (Fig. 1B). These cells were subsequently plotted by APC and FITC channels to sort CD4+, CD8+, and DN T cells.
Figure 1.
A representative flow cytometry analysis of T cell purity (A), and flow sorting of T cells into TCRαβ+CD4+ T cells, TCRαβ+CD8+ T cells, and TCRαβ+CD4−CD8− T cell subsets (B).
2.3. Methylation studies
DNA methylation in isolated CD4+, CD8+, and DN T cells was assessed at N 485,000 methylation loci across the genome using the Infinium HumanMethylation450K Beadchip array (Illumina, San Diego, CA). This array interrogates CGs at 96% of UCSC CpG Islands and 99% of RefSeq genes with an average of 17 CG per gene across enhancers, promoterregions, 5′ UTRs, 1st exons, gene bodies, and 3′ UTRs. In addition, the array includes non-CG methylation sites recently shown to undergo DNA methylation in human stem cells.
2.4. Statistical analysis
Analysis of genome-wide DNA methylation in CD4+, CD8+, and DN T cells was performed using GenomeStudio methylation module v1.9.0 (Illumina, San Diego, CA) as previously described[10]. Probe signal-intensities were extracted from image intensity data files. Signal-intensities were normalized to non-CG control probes, and background signals were subtracted based on unhybridized negative control probes. Signal-intensities were then converted to beta values representing methylation levels in a range from 0 to 1. Differential DNA methylation was then evaluated in DN compared to CD4+ and CD8+ T cells from the same individuals. In either T cell comparison, differential methylation was analyzed using the GenomeStudio Illumina custom model described previously [10] and the same normalization parameters listed above. Probes were then filtered for detection P value (P > 0.05), which represents detection above background, and probes with SNPs within 10 bp of their 3′ ends were excluded. In either T cell comparison, differentially methylated dinucleotides were defined as sites with an average methylation difference (| delta − beta|) > 0.20 and a differential methylation score (| DiffScore|) > 33 (P ≤ 0.001) after adjusting for multiple testing using a Benjamini and Hochberg false discovery rate of 5%. Differential methylation score is 10 * sgn(delta − beta) * − log10(P value). CG location enrichment analysis was performed using Pearson's chi-squared tests with Yates' continuity correction.
2.5. Bioinformatics
Gene annotation enrichment analyses were performed using the Database for Annotations, Visualization, and Integrated Discovery (DAVID). Each analysis was performed with an EASE enrichment threshold (modified Fisher exact test) of P b 0.10, an FDR threshold b 5%, and annotations for biological processes, cellular location, disease, molecular functions and path-ways. In addition, cytokine genes were enriched using the gene ontology term: cytokine activity (GO:0005125).
2.6. RNA extraction and DNMT expression analysis
Double negative T cells and autologous CD4+ and CD8+ T cells were isolated from a second independent set of 8 healthy unrelated women (age range: 25–53) using the T cell isolation protocol above. RNA was extracted using TRIzol (Invitrogen, Carlsbad, CA) and RNeasy kits (Qiagen, Valencia, CA) as described previously [11]. RNA was then purified from DNA contaminants using a Turbo DNA-free kit (Ambion, Austin, TX) as per the manufacturer's instructions, and RNA concentration was measured with a Nanodrop 2000 Spectro-photometer (Thermo Scientific, Wilmington, DE). Purified RNA was then used for the RT-PCR quantification of DNA methyltransferases DNMT1, DNMT3A, and DNMT3B, relative to ACTB (β actin), using a ViiA 7 Real-Time PCR System (Applied Biosystems, Carlsbad, CA) and a Power SYBR Green RNA-to-CT 1-Step kit (Applied Biosystems, Carlsbad, CA) with 10 μL reaction mixtures and PCR conditions suggested by the manufacturer. The following primers were used: ACTB forward: 5′-GCACCACACCTTCTACAATGAGC-3′ and reverse: 5′-GGATAGCACAGCCTGGATAGCAAC-3′; DNMT1 forward: 5′-CGACTACATCAAAGGCAGCAACCTG-3′ and reverse: 5′-TGGAGTGGACTTGTGGGTGTTCTC-3′; DNMT3A forward: 5′-CGAGTCCAACCCTGTGATGATTG-3′ and reverse: 5′-CGTGGTCTTTGCCCTGCTTTATG-3′; and DNMT3B forward: 5′-TTGGAATAGGGGACCTCGTGTG-3′ and reverse: 5′-AGAGACCTCGGAGAACTTGCCATC-3′. Cell-specific expression in CD4+, CD8+, and DN T cells was then evaluated using the Kruskal–Wallis non-parametric test for 3-group analysis, and the Mann–Whitney non-parametric test for 2-group analysis.
3. Results
3.1. Significant differential methylation in double negative T cells compared to autologous CD4+ and CD8+ T cells
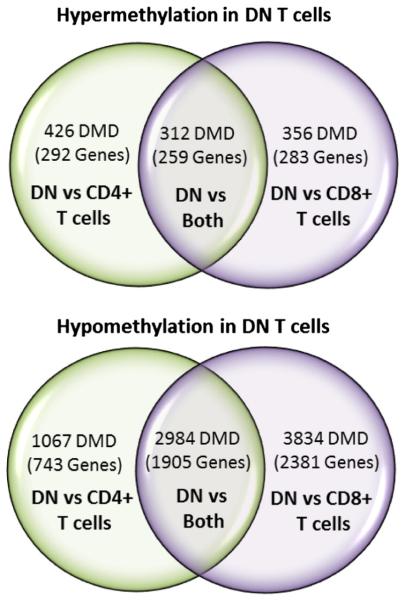
We identified DNA methylation differences in DN compared to autologous CD4+ and CD8+ T cells isolated from 7 healthy female donors (Supplementary Table 1). Our data show 4789 differentially methylated (DM) sites in DN compared to CD4+ T cells including 4051 (84.59%) hypomethylated and 738 (15.41%) hypermethylated sites. These DM loci are located within or surrounding 2912 RefGene database genes (Fig. 2). In addition, we identified 7486 DM loci in DN compared to CD8+ T cells, of which 6818 (91.1%) are hypomethylated in 3741 genes, and 668 (8.9%) are hypermethylated in 524 genes (Supplementary Table 2). The locations of the differentially methylated sites in DN T cells relative to known genes and CpG islands are shown in Supplementary Table 3. Raw and normalized DNA methylation data were deposited in Gene Expression Omnibus (GEO accession number GSE61195).
Figure 2.
Venn diagram depicting the number of differentially methylated (|delta − beta| N 0.20) dinucleotides (DMD) in double negative T cells compared to CD4+ and CD8+ T cells. The number of genes associated with the DMDs in each section of the Venn diagram are between parentheses.
Combined, there are 3297 DM loci in DN compared to both CD4+ and CD8+ T cells including 2984 (90.5%) hypomethylated sites in 1905 genes and 312 (9.5%) hypermethylated CG sites in 259 genes. In addition, one CG site in the CD8B gene was hypomethylated in DN compared to CD4+ T cells (delta − beta = − 0.27), but hyper-methylated compared to CD8+ T cells (delta − beta = 0.21).
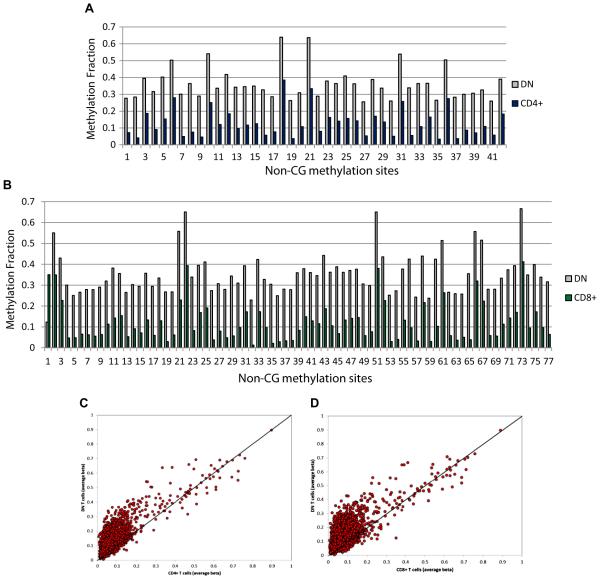
Most of the differentially methylated sites detected were in CG dinucleotides as expected. However, there were 42 and 77 non-CG differentially methylated sites in DN compared to CD4+ and CD8+ T cells, respectively. These were all CA sites, with the exception of one CT DM site between DN and CD8+ T cells. All DM non-CG sites were significantly hypermethylated in DN compared to CD4+ T cells, and all but one non-CG DM site were significantly hypermethylated in DN compared to CD8+ T cells (Figs. 3A and B). Indeed, there is a clear overall increased non-CG site methylation in DN T cells compared to CD4+ and CD8+ T cells (Figs. 3C and D, and Supplementary Table 4). In contrast, there is a global reduction in CG site DNA methylation in DN T cells (Supplementary Table 4).
Figure 3.
Non-CG dinucleotides with significant differential methylation between DN and CD4+ T cells (A) and DN and CD8+ T cells (B). Robust and consistent increase in non-CG site methylation is noted in DN T cells, as demonstrated by depicting the methylation fraction (beta) in all non-CG methylation sites analyzed in DN versus CD4+ T cells (C), and DN versus CD8+ T cells (D).
3.2. Reduced expression of DNMT1, DNMT3A, and DNMT3B in double negative T cells
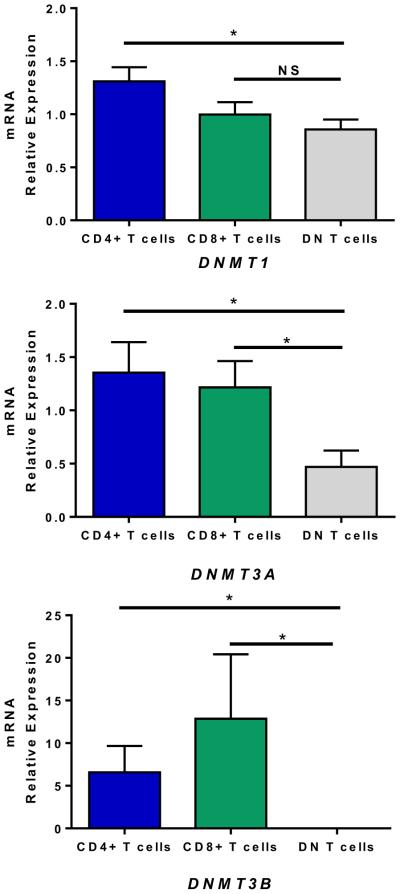
To determine if reduced CG methylation in DN T cells reflects or is associated with a change in expression of DNA methyltransferases, we determined the mRNA expression of DNMT1, DNMT3A, and DNMT3B in DN T cells and autologous CD4+ and CD8+ T cells. We found significant reduction in the expression of DNMT1 and DNMT3A in DN T cells (Kruskal–Wallis P = 0.039 and 0.019, respectively). DNMT3B transcripts were undetectable in DN T cells (Kruskal–Wallis P = 0.0051) (Fig. 4).
Figure 4.
DNA methyltransferase DNMT1, DNMT3A, and DNMT3B mRNA expression levels in DN and autologous CD4+ and CD8+ T cells. Expression was normalized to β-actin. DNMT1mRNA and DNMT3A mRNA were significantly reduced in DN T cells (Kruskal–Wallis P = 0.039 and 0.019, respectively). DNMT3B transcripts were undetectable in DN T cells (Kruskal– Wallis P = 0.0051). The asterisk “*” represents Mann–Whitney P values of < 0.05.
3.3. Epigenetic remodeling of the CD4, CD8A, and CD8B loci in DN T cells
We evaluated the methylation status of the CD4 genetic locus and the CD8 gene cluster (CD8A and CD8B encoding for the alpha and beta subunitsof CD8) in DN T cells compared to autologous CD4+ and CD8+ T cells. In total we analyzed 8, 34, and 12 CG sites included in the CD4, CD8A, and CD8B genetic loci, respectively. DN T cells demonstrated increased DNA methylation in the CD8 gene cluster compared to CD8+ T cells, and increased methylation in CD4 compared to CD4+ T cells (Fig. 5). Indeed, CD4 methylation status was similar between CD8+ and DN T cells, indicating a similar level of transcriptional repression of CD4 in both cell types which do not express CD4.
Figure 5.
(A) DNA methylation status of CD4, CD8A, and CD8B in CD4+, CD8+, and DN T cell subsets. The average methylation fraction across all evaluated CG sites in each locus is depicted. CD4 is hypermethylated in DN and CD8+ T cells compared to CD4+ T cells (P =0.0027 and 0.0005, respectively), and similarly methylated in DN compared to CD8+ T cells (P = 0.62). CD8A was hypermethylated in DN and CD4+ T cells compared to CD8+ T cells (P = 0.0002 and 0.0001, respectively), and CD8B was hypermethylated in DN and CD4+ T cells compared to CD8+ T cells (P = 0.057 and 0.0001, respectively). All P values were calculated using Student's t test, and asterisk “*” represents P values of < 0.05. (B) The location of each CG site evaluated in the CD4 genetic locus and the average methylation fraction in each CG site individually across samples in DN and autologous CD4+ T cells are displayed.
3.4. Cell-specific methylation in double negative T cells is significantly associated with cell communication, and cell-adhesion mediated signaling genes
We explored functional trends in genes differentially methylated in DN compared to both CD4+ and CD8+ T cells using gene annotation enrichment. In these analyses, DM genes were enriched for gene ontologies related to biological processes, cellular location, disease, molecular functions and pathways. In genes that were hypomethylated, the most significantly enriched ontologies are for cell communication (172 genes, P = 1.65 × 10− 8), cell adhesion-mediated signaling (66 genes, P = 1.72 × 10− 5), signal transduction (378 genes, P = 2.03 × 10− 5), cell junction (88 genes, P = 5.77 × 10⁻⁵), and cadherin (28 genes, P = 7.20 × 10− 5) (Table 1 and Supplementary Table 5).
Table 1.
Top 10 functional annotation terms represented by hypomethylated genes in DN T cells compared to autologous CD4+ and CD8+ T cells.
| Annotation term | Genes | Fold enrichment | Benjamini-adjusted P value |
|---|---|---|---|
| BP00274:Cell communication | 172 | 1.61 | 1.65E–08 |
| BP00120:Cell adhesion-mediated signaling | 66 | 1.95 | 1.72E–05 |
| BP00102:Signal transduction | 378 | 1.24 | 2.03E–05 |
| GO:0030054 — cell junction | 88 | 1.78 | 5.77E–05 |
| MF00259:Cadherin | 28 | 2.97 | 7.20E–05 |
| GO:0007156 — homophilic cell adhesion | 35 | 2.81 | 1.34E–04 |
| MF00040:Cell adhesion molecule | 63 | 1.84 | 3.05E–04 |
| GO:0016337 — cell–cell adhesion | 55 | 2.09 | 3.54E–04 |
| GO:0022610 — biological adhesion | 108 | 1.62 | 3.68E–04 |
| GO:0007155 — cell adhesion | 108 | 1.62 | 4.51E–04 |
BP, biological process; GO, gene ontology; MF, molecular function.
3.5. Cell specific methylation in DN T cell cytokine-activity genes
We next investigated cell-specific DNA methylation in cytokine activity-enriched genes and identified 17 genes differentially methylated in DN T cells compared to both CD4+ and CD8+ T cells (Fig. 6, Supplementary Table 6). The majority of the DM genes were hypomethylated in DN T cells (15 genes, 88.2%), whereas only IL19 and TGFB2 genes were hypermethylated (11.8%). IFNG, IL17F, IL12B, and IL18 were among the most hypomethylated cytokine activity genes in DN T cells compared to both CD4+ and CD8+ T cells. Significant hypomethylation was also observed in TNFSF11 encoding RANKL and TNFSF13B encoding the potent B cell stimulator BLYS (BAFF).
Figure 6.
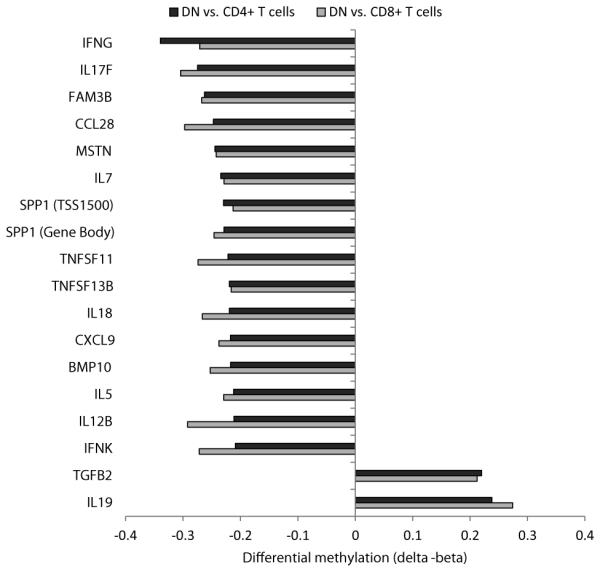
Enrichment of cytokine activity-related genes differentially methylated (|delta − beta| > 0.20) in DN compared to CD4+ and CD8+ T cells.
4. Discussion
DNA methylation is a stable, lineage-specific epigenetic regulatory mechanism shown to influence cell differentiation and immune function in T cells [8]. The differentiation of naïve CD4+ T cells to Th1, Th2, and Th17 cell subsets is associated with demethylation in the genetic loci encoding IFNγ, IL-4/IL-5/IL-13, and IL-17A/IL17F, respectively [8]. In addition, upon T cell stimulation, a rapid demethylation of the IL2 gene ensures increased and sustained IL-2 production [12]. As such, DNA methylation studies can provide valuable insight into the complex roles of immune cells and their functional capacity. In this study, we characterized the DNA methylome of DN T cells for the first time. We then explored cell-specific DNA methylation differences by comparing DN to CD4+ and CD8+ T cells isolated from the same peripheral blood samples of 7 independent biological replicates.
We identified 4789 DM loci in DN compared to CD4+ T cells and 7486 DM loci compared to CD8+ T cells, the majority being hypomethylated, consistent with a global reduction in DNA methylation in DN T cells. Indeed, we show a significant reduction in the expression of all three DNA methyltransferases (DNMT1, DNMT3A and DNMT3B) in DN T cells. Our data revealed significant hypomethylation in cell– cell interaction and cell adhesion genes in DN T cells. Moreover, DN T cells demonstrate consistent hypomethylation in key Th1, Th2, and Th17 loci. Specifically, some of these genes encode B cell and eosinophil activator IL-5 as well as Th1 inducers IL-12B and IL-18, in addition to IL-17. These genes also include IFNG, which is involved in the activation of multiple cells in both innate immunity and adaptive immunity. Importantly, TNFSF11 (RANKL), and TNFSF13B (BLYS or BAFF) are significantly hypomethylated in DN T cells supporting a potential direct role for DN T cells in osteoclast activation and differentiation, and B cell activation.
Recent studies elegantly demonstrated that DN T cells could be derived from CD8+ T cells through the cAMP responsive element modulator α (CREMα)-mediated downregulation of CD8 co-receptor [13,14]. CREMα is a transcription factor that directly silences CD8 expression by transrepression of a region syntenic to CD8B in mice [14]. In addition, CREMα induces epigenetic remodeling of CD8A and CD8B to silence expression [9]. We showed increased DNA methylation of CD8A and CD8B in DN compared to CD8+ T cells in human, consistent with previous reports. Further, we demonstrated increased methylation in CD4 in DN compared to CD4+ T cells (which is similarly methylated in CD8+ cells). This suggests that epigenetic silencing of the CD4 locus might be necessary in the development of DN T cells, but whether DN T cells could be derived from CD4+ T cells by epigenetic de novo silencing of CD4, and whether CREMα plays a role in epigenetic remodeling and repression of CD4 in DN T cells remain to be investigated.
Very interestingly, we found robust DNA methylation in non-CG methylation sites in DN T cells. Non-CG DNA methylation has been described in mammalian tissue [15], and thought to be restricted to stem cells and developing brain cells [16,17]. The implication of this unexpected finding in DN T cells is not clear at this time, but whether this might support a pluripotent developmental capacity and plasticity in these cells is an intriguing possibility. Importantly, non-CG methylation is thought to be mediated by the traditionally de novo DNA methyltransferase DNMT3A [15], which was reduced in DN T cells compared to CD4+ or CD8+ T cells. The critical role for DNMT3A in epigenetically silencing the CD8 locus in DN T cells has been recently elucidated [9].
Taken together, our data provide evidence for a demethylated and immune-activating permissive epigenetic architecture in normal human DN T cells, consistent with a pro-inflammatory phenotype. Indeed, DN T cells have been shown to be expanded and produce both IL-17 and IFN-γ in patients with lupus [1]. They are capable of stimulating the production of autoantibodies and infiltrate kidney tissues in lupus patients [1,18], constitutively overexpress IL-4 in lupus compared to healthy controls [4], and have been shown to invade the salivary glands in patients with primary Sjögren's syndrome [2]. Our findings provide additional support to a pro-inflammatory phenotype in this T cell subset, and reveal a novel unifying epigenetic permissiveness for a role of DN T cells in autoimmunity.
Supplementary Material
Acknowledgments
Research reported in this publication was supported by the National Institute of Allergy and Infectious Diseases of the National Institutes of Health under award number R01AI097134.
Footnotes
Conflicts of interest statement
None.
References
- [1].Crispin JC, Oukka M, Bayliss G, Cohen RA, Van Beek CA, Stillman IE, Kyttaris VC, Juang YT, Tsokos GC. Expanded double negative T cells in patients with systemic lupus erythematosus produce IL-17 and infiltrate the kidneys. J. Immunol. 2008;181:8761–8766. doi: 10.4049/jimmunol.181.12.8761. [DOI] [PMC free article] [PubMed] [Google Scholar]
- [2].Alunno A, Bistoni O, Bartoloni Bocci E, Caterbi S, Bigerna B, Pucciarini A, Tabarrini A, Mannucci R, Beghelli D, Falini B, Gerli R. IL-17-producing double-negative T cells are expanded in the peripheral blood, infiltrate the salivary gland and are partially resistant to corticosteroid therapy in patients with Sjogren's syndrome. Reumatismo. 2013;65:192–198. doi: 10.4081/reumatismo.2013.192. [DOI] [PubMed] [Google Scholar]
- [3].Bettinardi A, Brugnoni D, Quiros-Roldan E, Malagoli A, La Grutta S, Correra A, Notarangelo LD. Missense mutations in the Fas gene resulting in autoimmune lymphoproliferative syndrome: a molecular and immunological analysis. Blood. 1997;89:902–909. [PubMed] [Google Scholar]
- [4].Dean GS, Anand A, Blofeld A, Isenberg DA, Lydyard PM. Characterization of CD3+ CD4− CD8− (double negative) T cells in patients with systemic lupus erythematosus: production of IL-4. Lupus. 2002;11:501–507. doi: 10.1191/0961203302lu234oa. [DOI] [PubMed] [Google Scholar]
- [5].D'Acquisto F, Crompton T. CD3+CD4−CD8− (double negative) T cells: saviours or villains of the immune response? Biochem. Pharmacol. 2011;82:333–340. doi: 10.1016/j.bcp.2011.05.019. [DOI] [PubMed] [Google Scholar]
- [6].Voelkl S, Gary R, Mackensen A. Characterization of the immunoregulatory function of human TCR-alphabeta+CD4−CD8− double-negative T cells. Eur. J. Immunol. 2011;41:739–748. doi: 10.1002/eji.201040982. [DOI] [PubMed] [Google Scholar]
- [7].Zhang ZX, Yang L, Young KJ, DuTemple B, Zhang L. Identification of a previously unknown antigen-specific regulatory T cell and its mechanism of suppression. Nat. Med. 2000;6:782–789. doi: 10.1038/77513. [DOI] [PubMed] [Google Scholar]
- [8].Sawalha AH. Epigenetics and T-cell immunity. Autoimmunity. 2008;41:245–252. doi: 10.1080/08916930802024145. [DOI] [PubMed] [Google Scholar]
- [9].Hedrich CM, Crispin JC, Rauen T, Ioannidis C, Koga T, Rodriguez Rodriguez N, Apostolidis SA, Kyttaris VC, Tsokos GC. cAMP responsive element modulator (CREM) alpha mediates chromatin remodeling of CD8 during the generation of CD3+ CD4−CD8− T cells. J. Biol. Chem. 2014;289:2361–2370. doi: 10.1074/jbc.M113.523605. [DOI] [PMC free article] [PubMed] [Google Scholar]
- [10].Coit P, Jeffries M, Altorok N, Dozmorov MG, Koelsch KA, Wren JD, Merrill JT, McCune WJ, Sawalha AH. Genomewide DNA methylation study suggests epigenetic accessibility and transcriptional poising of interferon-regulated genes in naive CD4+ T cells from lupus patients. J. Autoimmun. 2013;43:78–84. doi: 10.1016/j.jaut.2013.04.003. [DOI] [PMC free article] [PubMed] [Google Scholar]
- [11].Webb R, Wren JD, Jeffries M, Kelly JA, Kaufman KM, Tang Y, Frank MB, Merrill J, Kimberly RP, Edberg JC, Ramsey-Goldman R, Petri M, Reveille JD, Alarcon GS, Vila LM, Alarcon-Riquelme ME, James JA, Vyse TJ, Moser KL, Gaffney PM, Gilkeson GS, Harley JB, Sawalha AH. Variants within MECP2, a key transcription regulator, are associated with increased susceptibility to lupus and differential gene expression in patients with systemic lupus erythematosus. Arthritis Rheum. 2009;60:1076–1084. doi: 10.1002/art.24360. [DOI] [PMC free article] [PubMed] [Google Scholar]
- [12].Bruniquel D, Schwartz RH. Selective, stable demethylation of the interleukin-2 gene enhances transcription by an active process. Nat. Immunol. 2003;4:235–240. doi: 10.1038/ni887. [DOI] [PubMed] [Google Scholar]
- [13].Crispin JC, Tsokos GC. Human TCR-alpha beta+CD4−CD8− T cells can derive from CD8+ T cells and display an inflammatory effector phenotype. J. Immunol. 2009;183:4675–4681. doi: 10.4049/jimmunol.0901533. [DOI] [PMC free article] [PubMed] [Google Scholar]
- [14].Hedrich CM, Rauen T, Crispin JC, Koga T, Ioannidis C, Zajdel M, Kyttaris VC, Tsokos GC. cAMP-responsive element modulator alpha (CREMalpha) trans-represses the transmembrane glycoprotein CD8 and contributes to the generation of CD3+CD4−CD8− T cells in health and disease. J. Biol. Chem. 2013;288:31880–31887. doi: 10.1074/jbc.M113.508655. [DOI] [PMC free article] [PubMed] [Google Scholar]
- [15].Ramsahoye BH, Biniszkiewicz D, Lyko F, Clark V, Bird AP, Jaenisch R. Non-CpG methylation is prevalent in embryonic stem cells and may be mediated by DNA methyltransferase 3a. Proc. Natl. Acad. Sci. U. S. A. 2000;97:5237–5242. doi: 10.1073/pnas.97.10.5237. [DOI] [PMC free article] [PubMed] [Google Scholar]
- [16].Lister R, Pelizzola M, Dowen RH, Hawkins RD, Hon G, Tonti-Filippini J, Nery JR, Lee L, Ye Z, Ngo QM, Edsall L, Antosiewicz-Bourget J, Stewart R, Ruotti V, Millar AH, Thomson JA, Ren B, Ecker JR. Human DNA methylomes at base resolution show widespread epigenomic differences. Nature. 2009;462:315–322. doi: 10.1038/nature08514. [DOI] [PMC free article] [PubMed] [Google Scholar]
- [17].Lister R, Mukamel EA, Nery JR, Urich M, Puddifoot CA, D. Johnson N, Lucero J, Huang Y, Dwork AJ, Schultz MD, Yu M, Tonti-Filippini J, Heyn H, Hu S, Wu JC, Rao A, Esteller M, He C, Haghighi FG, Sejnowski TJ, Behrens MM, Ecker JR. Global epigenomic reconfiguration during mammalian brain development. Science. 2013;341 doi: 10.1126/science.1237905. 1237905. [DOI] [PMC free article] [PubMed] [Google Scholar]
- [18].Shivakumar S, Tsokos GC, Datta SK. T cell receptor alpha/beta expressing double-negative (CD4−/CD8−) and CD4+ T helper cells in humans augment the production of pathogenic anti-DNA autoantibodies associated with lupus nephritis. J. Immunol. 1989;143:103–112. [PubMed] [Google Scholar]
Associated Data
This section collects any data citations, data availability statements, or supplementary materials included in this article.


