

SUMMARY
One drug may suppress the effects of another. Although knowledge of drug suppression is vital to avoid efficacy-reducing drug interactions or discover countermeasures for chemical toxins, drug-drug suppression relationships have not been systematically mapped. Here, we analyze the growth response of Saccharomyces cerevisiae to anti-fungal compound (“drug”) pairs. Among 440 ordered drug pairs, we identified 94 suppressive drug interactions. Using only pairs not selected on the basis of their suppression behavior, we provide an estimate of the prevalence of suppressive interactions between anti-fungal compounds as 17%. Analysis of the drug suppression network suggested that Bromopyruvate is a frequently suppressive drug and Staurosporine is a frequently suppressed drug. We investigated potential explanations for suppressive drug interactions, including chemogenomic analysis, coaggregation, and pH effects, allowing us to explain the interaction tendencies of Bromopyruvate.
INTRODUCTION
Drugs are considered to be interacting if their combined effect for a particular phenotype differs from the independently combined single-drug effects. Interactions are considered synergistic if they correspond to a more severe combined effect or antagonistic for a diminished combinatorial effect. Suppression or hyperantagonism is an extreme case of drug antagonism, defined by an effect of the drug combination that is less than the effect of the more-potent drug alone (Figure 1) (Yeh et al., 2009). Cases of suppression in vivo are well known and may arise from a variety of mechanisms, including changes in metabolism, absorption, and excretion (Fugh-Berman, 2000; Patsalos and Perucca, 2003).
Figure 1. Types of Interactions between two Drugs.
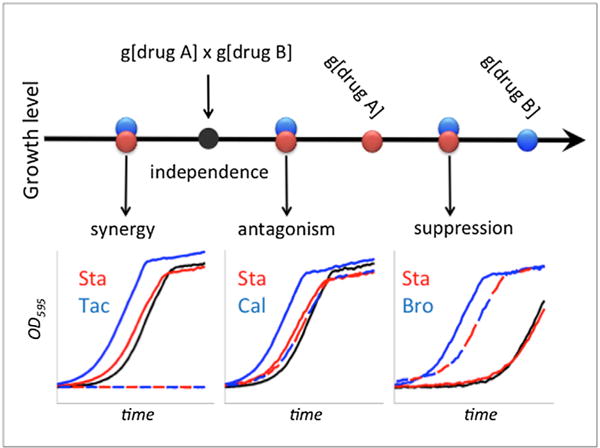
Certain concentrations of drug A and drug B allow growth levels g[drug A] and g[drug B], respectively. These drugs are considered independent under the Bliss independence model if their combined effect is the multiplication of the effects of individual drugs, shown as a black filled circle (g[drug A] × g[drug B]). Overlapping blue and red circles represent three possible regions under which the observed growth may fall, which correspond to three types of drug interactions. Synergy or antagonism occurs when the growth rate under drug combination is smaller or larger than independence, respectively. Suppression is an extreme form of antagonism, where the growth rate under drug combination is higher than the growth rate under [drug A]. In this case, drug B is defined to suppress drug A. Examples for each interaction type are shown as growth curves under single drugs and combinations: synergistic interaction of 0.72 μg/ml Staurosporine with 16 μg/ml Tacrolimus, antagonistic interaction of 0.72 μg/ml Staurosporine with 0.6 μg/ml Calyculin A, and suppressive interaction with 70 μg/ml Bromopyruvate suppressing 1.26 μg/ml Staurosporine. For growth curve insets: drug A, drug B, drug A+B observed, and drug A+B expected growth are depicted in red, blue, dashed blue/red, and black, respectively.
Numerous studies have been conducted to seek synergistic drug combinations for their enhanced therapeutic value (Farha and Brown, 2010; Lehár et al., 2009). However, it is also important to identify those combinations in which one drug suppresses the effect of the other. For example, the standard dose of Rapamycin (Rap) must be increased by a factor of 300 to restore its effects on T-lymphocytes due to the suppressive effects of Tacrolimus (Tac) (FK506) (Bierer et al., 1990). Numerous examples of Rap being suppressed are known. For example, case studies on organ transplant patients report the effects of Rap to be suppressed by coadministration of Phenytoin (Fridell et al., 2003) or Rifampacin (Ngo et al., 2011).
Few drug suppression relationships have been mechanistically explained. In one example, a recent study showed that protein synthesis inhibitors suppress DNA synthesis inhibitors in Escherichia coli, because of non-optimal regulation of ribosomal genes in the presence of DNA stress (Bollenbach et al., 2009). It is clear that this mechanism can explain only a small subset of all suppressive drug interactions. A more general picture of the mechanisms of drug suppression is needed to understand and perhaps predict suppressive drug interactions.
Combining suppressive compounds will, in general, be undesirable—typically they require an increased treatment time or dose with correspondingly increased off-target effects. However, such combinations offer potential advantages in the context of antibiotic resistance, a growing medical concern (Palmer and Kishony, 2013). It has been suggested that suppressive combinations decrease the prevalence of resistance to both drugs in a pair (Yeh et al., 2009). Reciprocal suppression relationships, such that each of two drugs suppresses the effect of the other, may have an even greater potential to prevent antibiotic resistance.
Although an improved understanding of suppressive drug interactions has therapeutic implications, no large-scale search for suppressive anti-fungal drug interactions has been previously carried out. As a tractable experimental model, we examined chemical compounds with anti-fungal activity (“drugs”) in S. cerevisiae. We analyzed data for 220 drug-drug pairs: this included combinatorial drug sensitivity assays previously reported for 175 pairs (Cokol et al., 2011) but that had not been previously examined for suppression relationships and 45 pairs for which combinatorial drug sensitivity was newly performed, one of which was a verification of a previously reported suppressive drug interaction (Butcher and Schreiber, 2003). Taken together, our results offer an estimate of the frequency of suppression among drugs, suggest that specific drugs have intrinsic tendencies to suppress or be suppressed by other drugs, and begin to describe a mechanistic explanation for selected drug suppression pairs.
RESULTS
Suppressive Drug Interactions in Literature
We conducted an extensive literature search for suppressive interactions between anti-fungal chemical compounds. Specifically, we identified MEDLINE abstracts that contained the names (or synonyms) of two chemicals known to inhibit yeast growth (Hillenmeyer et al., 2008) and variations of the word “suppress” (Bandy et al., 2009). We curated more than 1,000 literature abstracts to find reports of suppressive drug interactions between anti-fungal drugs. Our literature search yielded reports of 30 suppressive drug interactions, of which only four were interactions with respect to the yeast growth rate phenotype (Table S1 available online). All four of these cases involved one different chemical from the so-called Suppressor of FK506 (SFK) class of compounds. Accordingly, all four SFK compounds were reported to suppress growth inhibition by Tac under highsalt conditions (Butcher and Schreiber, 2003, 2004). Only one of these SFK drugs (SFK1) was commercially available, and we experimentally verified that SFK1 suppresses Tac (Figure S1). Our literature search yielded no previously known reciprocal suppression relationships within any species.
Finding Suppressive Drug Interactions in Previously Published Experimental Data
We first re-examined data from a previous study (Cokol et al., 2011) that measured the growth response of S. cerevisiae at 8 × 8 concentration combinations of 175 drug pairs among 33 drugs. Here, tested drug pairs were selected as positive and negative predictions for drug synergy. Of the tested drug pairs, 45% came from a “matrix” for which all pairwise combinations among 13 drugs were tested. We defined growth as the area under the growth curve (AUC). “Growth level” was defined as growth relative to the growth in the no-drug condition in each experiment. The names and abbreviations of drugs used in this study are given in Table 1. Tables S2 and S3 provide raw cell density measurements and tables of growth levels, respectively, for all drug pairs analyzed in this study.
Table 1.
Drugs Analyzed for Drug-Drug Suppression
| Drug | Abbreviation | Max Dose (μg/ml) | Experimental Tests and Suppressive Interactions |
|---|---|---|---|
| 1,10-phenanthroline | 110 | 5 | AmB, Ben, Bro, Sta |
| 2-deoxy-D-glucose | 2DG | 250 | Sta |
| 5-fluorouracil | 5FU | 28 | Ben, Lat, Pen, Sta, Tac, Ter |
| 6-azauracil | 6Az | 1,000 | AmB, Ben, Bro, Sta |
| Amphotericin B | AmB | 0.49 | 110, 6Az, Ben, Cer, Cet, Dox, Flu, Mic, Naz, Nys, Pen, Phl, Sta, Tac, Ter |
| Anisomycin | Ani | 3.5 | Ben, Lat, Pen, Sta, Tac, Ter |
| Aureobasidin A | AbA | 280 | Lit, Wor |
| Benomyl | Ben | 28 | 110, 5FU, 6Az, AmB, Ani, Bro, C3P, Cal, Cer, Cet, Chl, Cis, Cyc, Dyc, Dox, Fen, Flu, Hal, Lat, Met, Mic, MMS, Myr, Naz, Nys, Pen, Phl, Qmy, Rad, Rap, Sta, Tac, Ter, Tun |
| Bromopyruvate | Bro | 490–1,000a | 110, 6Az, Ben, Cal, Cer, Cet, Dox, Dyc, Fen, Flu, Hal, Lat, Mic, Naz, Nys, Pen, Phl, Rap, Sta, Tac, Ter, Tun |
| Calyculin A | Cal | 2.1 | Ben, Bro, Dyc, Fen, Hal, Lat, Pen, Rap, Sta, Tac, Ter, Tun |
| Cantharidin | Can | 140 | Lat, Pen, Sta, Tac, Ter |
| Carbonyl cyanide 3-chlorophenylhydrazone | C3P | 21 | Ben, Lat, Pen, Sta, Tac, Ter |
| Cerulenin | Cer | 0.335 | AmB, Ben, Bro, Sta |
| Cetylpryidinium | Cet | 0.8 | AmB, Ben, Bro, Sta |
| Chlorzoxazone | Chl | 350 | Ben, Lat, Pen, Sta, Tac, Ter |
| Cisplatin | Cis | 80 | Ben, Lat, Sta, Tac, Ter |
| Clozapine | Clo | 105 | Rad |
| Cycloheximide | Cyc | 0.91 | Ben, Lat, Pen, Rad, Sta, Tac, Ter |
| Doxorubicin | Dox | 11.6 | AmB, Ben, Bro, Sta |
| Dyclonine | Dyc | 49 | Ben, Bro, Cal, Fen, Hal, Lat, Pen, Rap, Sta, Tac, Ter, Tun |
| Fenpropimorph | Fen | 1.54 | Ben, Bro, Cal, Dyc, Hal, Lat, Pen, Rap, Sta, Tac, Ter, Tun |
| Fluconazole | Flu | 10 | AmB, Ben, Bro, Sta |
| Haloperidol | Hal | 56 | Ben, Bro, Cal, Dyc, Fen, Lat, Pen, Rap, Sta, Tac, Ter, Tun |
| Hygromycin | Hyg | 7 | Lat, Myr, Rad, Rap, Sta |
| Iodoacetamide | Ide | 3 | Sta |
| Iodoacetate | Ite | 500 | Sta |
| Latrunculin B | Lat | 14 | 5FU, Ani, Ben, Bro, C3P, Cal, Can, Chl, Cis, Cyc, Dyc, Fen, Hal, Hyg, Met, MMS, Myr, Pen, Qmy, Rad, Rap, Sta, Tac, Tam, Ter, Tun |
| Lithium | Lit | 4,500 | AbA, Rad, Rap, Sta, Tac |
| Methotrexate | Met | 1,000 | Ben, Lat, Pen, Sta, Tac, Ter |
| Methyl methanesulfonate | MMS | 175 | Ben, Lat, Pen, Sta, Tac, Ter |
| Miconazole | Mic | 0.12 | AmB, Ben, Bro, Sta |
| Myriocin | Myr | 0.350 | Ben, Hyg, Lat, Pen, Qnn, Rad, Sta, Tac, Ter |
| Nystatin | Nys | 2 | AmB, Ben, Bro, Sta |
| Pentachlorophenol | PcP | 28 | Sta |
| Pentamidine | Pen | 70 | 5FU, AmB, Ani, Ben, Bro, C3P, Cal, Can, Chl, Cyc, Dyc, Fen, Hal, Lat, Met, MMS, Myr, Qmy, Rad, Rap, Sta, Tac, Ter, Tun |
| Phleomycin | Phl | 0.00083 | AmB, Ben, Bro, Sta |
| Quinine | Qnn | 1,000 | Myr, Rad |
| Quinomycin | Qmy | 30 | Ben, Lat, Pen, Sta, Tac, Ter |
| Radicicol | Rad | 56 | Ben, Clo, Cyc, Hyg, Lat, Lit, Myr, Pen, Qnn, Rap, Sta, Tac, Ter |
| Rapamycin | Rap | 0.0049 | Ben, Bro, Cal, Dyc, Fen, Hal, Hyg, Lat, Lit, Pen, Rad, Sta, Tac, Ter, Tun |
| Sodium azide | Naz | 25 | AmB, Ben, Bro, Sta |
| Staurosporine | Sta | 1.26 | 110, 2DG, 5FU, 6Az, AmB, Ani, Ben, Bro, C3P, Cal, Can, Cer, Cet, Chl, Cis, Cyc, Dox, Dyc, Fen, Flu, Hal, Hyg, Ide, Ite, Lat, Lit, Met, Mic, MMS, Myr, Naz, Nys, Pcp, Pen, Phl, Qmy, Rad, Rap, Tac, Tam, Ter, Tun, Wor |
| Suppressor of FK506 | Sfk | 3 | Tac |
| Tacrolimus | Tac | 110 | 5FU, AmB, Ani, Ben, Bro, C3P, Cal, Can, Chl, Cis, Cyc, Dyc, Fen, Hal, Lat, Lit, Met, MMS, Myr, Pen, Qmy, Rad, Rap, Sfk, Sta, Tam, Ter, Tun |
| Tamoxifen | Tam | 2.8 | Lat, Sta, Tac, Ter |
| Terbinafine | Ter | 10.5 | 5FU, AmB, Ani, Ben, Bro, C3P, Cal, Can, Chl, Cis, Cyc, Dyc, Fen, Hal, Lat, Met, MMS, Myr, Pen, Qmy, Rad, Rap, Sta, Tac, Tam, Tun |
| Tunicamycin | Tun | 0.35 | Ben, Bro, Cal, Dyc, Fen, Hal, Lat, Pen, Rap, Sta, Tac, Ter |
| Wortmannin | Wor | 280 | AbA, Sta |
Also given are the three-letter abbreviations used in the figures, the maximum dose used, and a list of all the drug interaction experiments made for each drug. The last column indicates the suppressed drug (underlined) and the suppressing drug (shown in bold). Each drug was tested in eight different concentrations, where the lowest concentration is zero, the highest concentration is close to MIC, and increments are evenly spaced between these extremes. Thus, the lowest concentration for each drug tested is 1/7 of the MIC value, and the next is at 2/7 of MIC, etc.
Bro MIC was reported as 490 μg/ml in a previous study. In this study, we found Bro MIC as 1,000 μg/ml and used this MIC value in experiments. For all other drugs, the MIC variation was less than 2-fold.
Using these measurements of combinatorial drug concentration-dependent growth, we searched for drug pairs meeting each of the three criteria (Figure 1): (1) significant antagonism, such that growth in response to the drug combination was significantly higher than the expected growth under the Bliss Independence model, that is, higher than the multiplicative expectation based on growth levels obtained for the two drugs individually, (2) significant suppression, such that growth in response to the drug combination was significantly higher than growth in response to the less-potent drug, and (3) meaningful strength of suppression, such that the growth level in response to the drug combination was greater than 10% of the growth level without any drug present. These criteria defined a less-potent drug to suppress the more-potent drug. Similarly, reciprocal suppression exists by definition if two drugs can suppress the other’s action at some combination of drug concentrations. This phenomenon has been hypothesized, but not previously observed (Yeh et al., 2009).
Of the 175 drug pairs we examined, 53 (30%) passed these stringent criteria for drug suppression relationships. Of these 53 pairs with suppression relationships, 45 were directional and eight exhibited reciprocal suppression. Examples of broadly supported directional suppression (e.g., Bromopyruvate [Bro] suppresses Staurosporine [Sta]) and reciprocal suppression (Sta and Myriocin [Myr] suppress each other) are shown in Figure 2. Importantly, the same criteria applied to a control data set of 25 self-self drug combinations in which no suppressive relationships are expected (Cokol et al., 2011) found no suppression relationships, supporting the high specificity of our drug suppression assessment.
Figure 2. Assessing Suppression and Reciprocal Suppression.
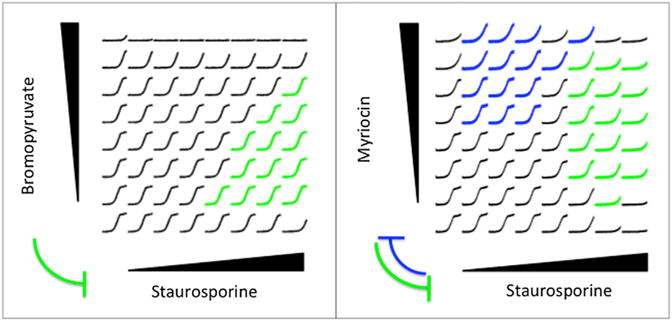
S. cerevisiae cells were grown in an 8 × 8 grid of drug combinations, where the concentration of one drug was linearly increased in each axis. The maximum dose of each drug was chosen close to its MIC. For each drug concentration combination, growth measurements (y axis) for 24 hr (x axis) are depicted. The growth curves corresponding to drug combinations in which the horizontal drug suppresses the vertical drug are given in blue, and the opposite direction of suppression are given in green. Here, we show two broadly supported suppression examples we have found among 175 drug pairs tested, where breadth is defined as the number of combinations in which the suppression phenotype was observed. Suppressive edges learned from data are shown between drug names, where the edge width represents the breadth of suppression.
Yeast Suppressive Drug Interaction Network
We visualized the suppressive relationships we identified as a network (Figure 3), in which each drug is represented by a node and each suppressive relationship by a directed edge. This network has 61 edges between drug nodes among 350 ordered pairs (2 × 175 drug pairs). Hence, the fraction of tests in which one drug suppresses the other is 17%. We note that this is a conservative estimate, because the drug pairs we have analyzed thus far were previously selected for drug synergy, whereas suppression should correspond to antagonism more frequently than synergy.
Figure 3. A Network of 61 Suppressive Drug-Drug Interactions.
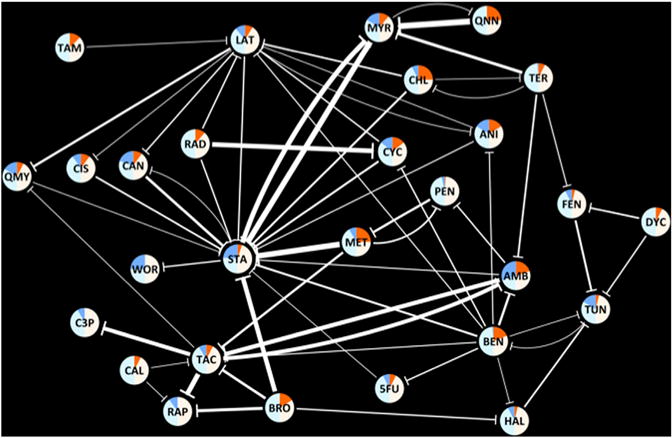
Nodes represent drugs, and edges represent suppressive interactions. The width of an edge represents the breadth of suppression. The nodes are colored according to the suppression behavior of each drug. Bright blue and orange areas correspond to the frequency of “suppressed” and “suppressing” edges for a drug among all interactions against which it was tested. Similarly, light blue and white areas correspond to the frequency of “not suppressed” and “not suppressing” edges for a drug among all interactions against which it was tested. The three-letter abbreviations for each drug are given in Table 1.
For each drug we assessed the “out-degree” (number of drugs suppressed by the drug of interest) and the “in-degree” (number of drugs that suppress the drug of interest). Interestingly, we observed that the in-degree and out-degree of drugs is correlated (r = 0.34, p = 0.05). Thus, drugs that were frequently suppressing were also frequently suppressed. However, we noticed several exceptions to this weak correlation. For example, Bro suppressed 4 (33%) of 12 tested drugs but was not suppressed by any drug. On the other extreme, Sta was suppressed by 14 (48%) of the 29 drugs with which it was tested; but it suppressed only one (3%). These observations suggest that drugs can differ in intrinsic tendencies for suppression behavior.
We further analyzed the network for “suppressing hubs” or “suppressed hubs”— drugs that are intrinsically more likely to suppress or be suppressed (Supplemental Experimental Procedures). Amphotericin B (AmB), Benomyl (Ben), Bro, Chlorzoxazone (Chl), and Methotrexate (Met) had true discovery rates greater than 50% (q < 0.5) for being frequent suppressors (Fisher’s exact test, p = 0.04, 0.01, 0.14, 0.07, 0.07; OR = 7.4, 3.1, 2.5, 4.9, 4.9; q = 0.22, 0.21, 0.46, 0.49, 0.49, respectively). We found a significant tendency for Sta to be suppressed (Fisher’s exact test p = 5.7 × 10⁻⁵, OR = 5.4, q = 9.5 × 10⁻⁴) and a suggestive tendency (q < 0.5) for AmB and Tun to be suppressed (Fisher’s exact test p = 0.04, 0.14; OR = 7.4, 2.5; q = 0.22, 0.46, respectively).
Drug Interaction Experiments to Test Suppression Hubs
Because our power to detect significant “hubs” was necessarily limited by the number of pairs tested for any given drug, we performed additional experimental testing. Specifically, we further tested four of these drugs —AmB, Ben, Bro, and Sta— for additional suppression relationships. Each of these four were assessed against a panel of the following ten drugs selected on the basis of being inexpensive, readily available, and having diverse mechanisms of action: 1,10-phenanthroline (a metallopeptidase inhibitor and potent transcription inhibitor) (Chang et al., 1990), 6-azauracil (a nucleic acid synthesis inhibitor) (Exinger and Lacroute, 1992), cerulenin (a fatty acid biosynthesis inhibitor) (Inokoshi et al., 1994), cetylpyridinium (a cationic surfactant) (Hiom et al., 1993), Doxorubicin (a DNA intercalator) (Patel et al., 1997), Fluconazole and Miconazole (ergosterol biosynthesis inhibitors) (Abe et al., 2009; Sud and Feingold, 1981), sodium azide (a cytochrome oxidase inhibitor) (Whitney and Bellion, 1991), Nystatin (a polyene antibiotic) (de Resende and Alterthum, 1990), and phleomycin (a DNA intercalator) (Moore, 1989).
For each of these 40 pairwise combinations, we conducted a drug interaction experiment as described previously (Cokol et al., 2011). We identified 30 suppressive drug interactions, including nine reciprocally suppressing drug pairs. The fraction of suppressing drug interactions in this second data set is 38%, which is greater than the 17% fraction observed in the initially analyzed published data set. Each of the drug pairs tested for suppression included one drug exhibiting frequent suppression behavior in the original data, so that the high rate of suppression further supports the idea that drugs have intrinsic tendencies to suppress or be suppressed. The results of these 40 drug interaction experiments are given in Figure 4 and Table 1.
Figure 4. Further Suppression Tests of Four Drugs against a Panel of Ten Drugs.
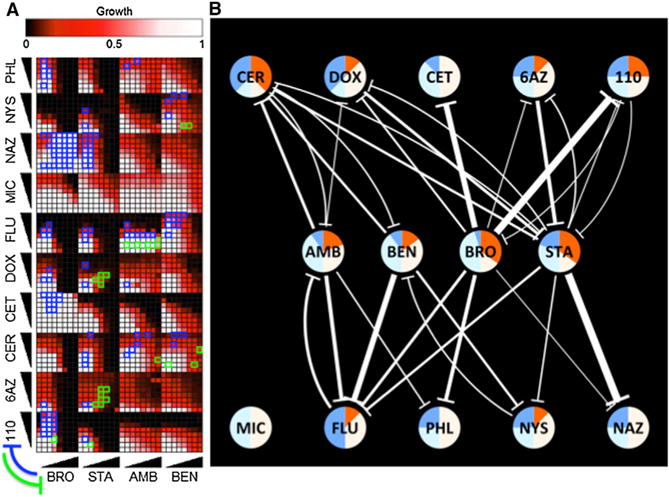
(A) Experimental results. Drug pairs were combined in 8 × 8 matrices as described in Figure 2. Significant suppressive interactions between drugs are shown with green or blue rectangles, where suppression direction is indicated on the lower left.
(B) Network representation of results of additional drug suppression tests. Nodes represent drugs, and edges represent suppressive interactions. Edge width and node coloring according to the suppression behavior of each drug are as described for Figure 3. The three-letter abbreviations for each drug are given in Table 1.
All experiments together yielded strong support for the idea that Bro commonly acts as a suppressor (p = 2.0 × 10⁻³, OR = 4.1, q = 0.03). Sta, on the other hand, showed a significant tendency to be suppressed within the combined data set (p = 2.1 × 10⁻⁴, OR = 3.7, q = 4.4 × 10⁻³). Together, our observations allow us to suggest Bro as a “frequently suppressing drug” and Sta as a “frequently suppressed drug”. Consistent with each of these trends, we had observed that Bro strongly suppresses Sta (Figure 2).
We wished to further investigate a specific suppressive drug interaction and focused on the Bro+Sta interaction. Bro has received clinical attention because of its selectivity against tumor cells (Bhardwaj et al., 2010; Ganapathy-Kanniappan et al., 2010). This selectivity is a result of its inhibition of the glycolysis pathway, which is highly utilized by tumor cells (Pelicano et al., 2006; Xu et al., 2005). Several cellular targets for Bro have been previously characterized, such as hexokinase, pyruvate kinase, and GAPDH (Shoshan, 2012). Sta is an ATP-competitive kinase inhibitor with Pkc1 as its primary target (Yoshida et al., 1992).
Chemogenomic Experiments with Bro, Sta, and Bro+Sta Combination
In order to have a global understanding of the effect of Bro, Sta, and their combination on S. cerevisiae, we assessed the sensitivity of a genome-wide collection of yeast deletion strains to these conditions, using the HaploInsufficiency Profiling (HIP) and homozygous deletion profiling (HOP) technologies (Giaever et al., 2002; Hillenmeyer et al., 2008; Parsons et al., 2004; Pierce et al., 2007). Although HIP and HOP data have been previously obtained for Sta (Hillenmeyer et al., 2008; Lum et al., 2004), no such experiments have been reported for Bro or Bro+Sta combination.
We constructed two pools of isogenic yeast diploid deletion strains with specific molecular barcode tags: (1) 1,106 strains, where one copy of an essential gene is deleted (for HIP assays) and (2) 4,590 strains, where both copies of a non-essential gene are deleted (for HOP assays). Competitive growth of the mutant pools was carried out in media with four different conditions: (1) 1% DMSO (“Solvent”), (2) “BroIC20,” Bro at a concentration that inhibits growth of the parental wild-type strain (BY4743) by 20% (IC20) (650 μg/ml), (3) “StaIC20,” Sta at its IC20 concentration (0.7 μg/ml), and (4) “ComIC20,” an IC20 Bro+Sta combination with a low dose of Bro (200 μg/ml) and high dose of Sta (1.2 μg/ml). After competitive growth, the abundance of each strain was measured by microarray hybridization. The sensitivity score of a strain to a condition was defined as the negative logarithm of the ratio of strain abundance under the drug condition relative to strain abundance in the solvent condition (Pierce et al., 2007). To assess the reproducibility of these HIP and HOP experiments, biological replicate experiments for the BroIC20 condition were performed. The sensitivity scores for two independent replicates of the BroIC20 condition had a very high correlation (r = 0.83, p < 2.2 × 10⁻¹⁶: the default minimum value in Matlab), indicating the reproducibility of our experimental results. For BroIC20 experiments, replicate sensitivity scores were averaged. The sensitivity scores for 5,696 strains obtained during these experiments are represented in Figure 5 and provided in Table S4.
Figure 5. Genome-wide Sensitivity Assessment for Yeast Deletion Strains against Bromopyruvate (BroIC20), Staurosporine (StaIC20), and Their Combination (COMIC20).
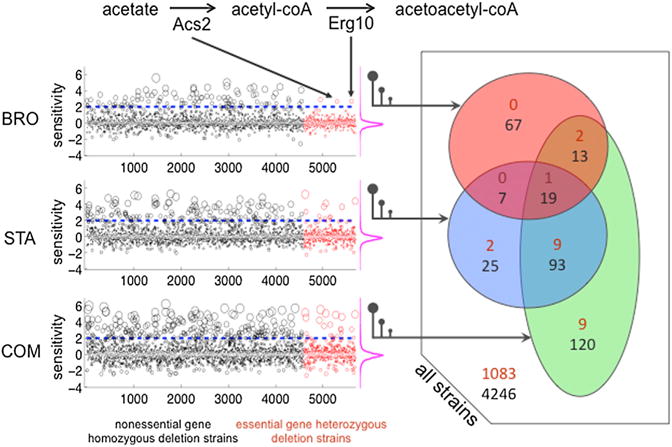
In the left panel, sensitivity scores for 4,960 strains, in which both copies of a non-essential gene have been deleted, are shown as black circles (HOP). Sensitivity scores for 1,106 strains, in which one copy of an essential gene has been deleted, are shown as red circles (HIP). For visibility, the sizes of the circles are proportional to the absolute value of the sensitivity scores. In each experiment, strains are ordered by the alphabetical order of the systematic name of the deleted gene(s). On the right of each experiment, the distribution of the sensitivity scores are shown by magenta frequency distributions, indicating that a large majority of deletion strains do not show a growth change. The right panel is a Venn diagram representation of the sensitive strains. Black and red numbers correspond to homozygous or heterozygous deletion strains, respectively.
We defined a deletion strain to be sensitive to a condition if its sensitivity score was greater than two (corresponding to a 2-fold depletion), in accordance with previous genome-wide chemogenomic studies (Hillenmeyer et al., 2008; Hoon et al., 2011; Pierce et al., 2007). Among 1,106 heterozygous deletion strains, we found two strains that were specifically sensitive to BroIC20 treatment (termed “Bro-protective genes” hereafter, as mutants in these genes are more sensitive): acs2Δ/ACS2 and erg10Δ/ERG10 (Figure 5). Acs2 (acetyl-coA synthetase) catalyzes the transformation of acetate to acetyl-coA (Van den Berg and Steensma, 1995). Erg10 converts acetyl-coA to acetoacetyl-coA, a requisite for the biosynthesis of mevalonate; the precursor to sterols and nonsterol isopreniods (Berg et al., 2010) (Figure 5). It is notable that the only two Bro-protective genes we identified encode adjacent enzymes in the yeast metabolic network (Caspi et al., 2013). The two reactions corresponding to the two Bro-protective genes are each critical for ketogenesis, which is likely to play a role when glycolysis is inhibited (Marsh et al., 2008).
We identified 11 heterozygous deletion strains as being sensitive to StaIC20, but not to BroIC20. Notably, 4 of these 11 StaIC20-sensitive heterozygous deletion strains were previously found to be sensitive to Sta (pkc1Δ/PKC1, rho1 Δ/RHO1, cdc12Δ/CDC12, and rot1 Δ/ROT1) in another large-scale chemogenomic study (Lum et al., 2004). We found nine heterozygous deletion strains exhibiting sensitivity specifically to ComIC20, but not to BroIC20 or to StaIC20. Of the nine ComIC20 specific gene products, five have chromatin remodeling or transcription regulatory functions (Arp7, Arp9, Rsc58, Rsc9, and Cdc39) (Szerlong et al., 2003; Titus et al., 2010).
Among 4,960 homozygous deletion strains tested, we found 106, 144, and 245 strains that were sensitive to BroIC20, StaIC20, and ComIC20, respectively. In order to understand cellular functions that are protective in these conditions, we carried out a functional enrichment analysis (Berriz et al., 2009). Seven of the top ten functions protective against BroIC20 involved protein kinase cascades and MAPK signaling pathways (Bhardwaj et al., 2010). For StaIC20, nine of the top ten protective functions involved biosynthetic processes. For 120 genes whose deletion confers sensitivity to ComIC20, but not to either BroIC20 or StaIC20 (Figure 5), we found only nine enriched protective functions, six of which involved regulation of transcription by one of various carbon sources.
Taken together, the chemogenomic experiments provided insight into the mechanisms of Bro and Sta individually. However, they did not immediately yield clear explanations for the suppression relationship between Bro and Sta.
Drug Co-Aggregation Experiments
One potential source of an observed suppression relationship is the effect of one compound on the other’s solubility (Feng and Shoichet, 2006). To investigate if Bro+Sta combination had a higher level of aggregation than either Bro or Sta alone, we conducted dynamic light scattering (DLS) experiments and estimated the mean radius of aggregates in each condition (Supplemental Experimental Procedures) (Coan and Shoichet, 2008). Each drug was prepared at its reported minimum inhibitory concentration (MIC) in media/solvent to mimic experimental conditions for drug interaction testing. We found no aggregate formation under any of these conditions.
In order to test our aggregate hypothesis further, we measured aggregate formation for nine additional drug pairs with observed suppression (Bro+Hal, Bro+Sta, Bro+Rap, Bro+Tac, Dyclonine [Dyc]+Fenpropimorph [Fen], Dyc+Tunicamycin [Tun], Fen+ Terbinafine [Ter], Fen+Tun, Haloperidol [Hal]+Tun, and Rap+Tac). Among these pairs, we observed no case in which drugs aggregated in combination without aggregating individually. Similar to Bro+Sta, drugs formed no aggregates either individually or in combination with Bro+Rap, Fen+Ter, and Fen+Tun (Table S6). For the remaining six suppressive drug pairs, the aggregation observed for the combination was not substantially different from the maximum observed aggregation for either drug measured alone. For drugs with high individual aggregation (Dyc, Hal, and Tac), we conducted further DLS measurements using lower concentration combinations of drugs to ensure there was no masking of combined aggregation effects (Table S7). In all cases, we saw no impact from the presence of one drug on the solubility of the other and therefore no support for coaggregation as the basis of these ten suppressive interactions.
Drug Interaction Experiments of Sta and a Panel of Glycolysis Inhibitors
We wished to investigate whether Bro’s tendency to suppress stemmed from its known activity as a glycolysis inhibitor. To test whether Bro suppresses Sta via glycolysis inhibition, we tested Sta’s pairwise interaction with glycolysis inhibitors 2-deoxy-D-glucose (2DG), Iodoacetate (Ite), Iodoacetamide (Ide) (Figure 6A), and Pentachlorophenol (Pcp) (Figure S7), an inhibitor of the oxidative phosphorylation process that is also expected to deplete cellular ATP levels (Schmidt and Dringen, 2009). We observed that Ite and Pcp were the only two drugs that suppressed Sta, so that there was no apparent correlation between glycolysis inhibition and Sta suppression.
Figure 6. Drug Sensitivity and Interaction Assays.
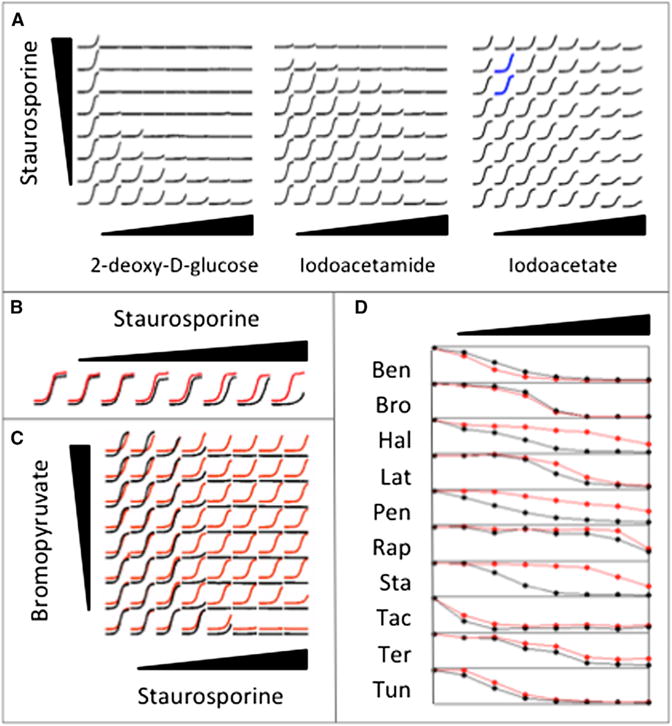
(A) Drug interaction assays between Staurosporine and three glycolysis inhibitors. 2-deoxy-D-glucose and Iodoacetamide do not suppress Staurosporine. The regions in which Iodoacetate suppresses Staurosporine are shown with blue growth curves.
(B) Growth curves in increasing doses of Staurosporine under normal (black) and acidic (red) media are shown slightly offset for visibility in this and the next panel. For each drug concentration, growth measurements (y axis) for 24 hr (x axis) are depicted. Staurosporine has higher MIC in acidic media.
(C) Drug interaction assay between Bromopyruvate and Staurosporine under buffered (black) or unbuffered (red) media. Bromopyruvate does not suppress Staurosporine under buffered media.
(D) Relationship between growth level (y axis) and drug dose (x axis) for ten drugs in normal and acidic media are shown in black and red, respectively. The three-letter abbreviations for drugs are given in Table 1. Hal, Pen, and Sta have decreased toxicity, and Ben has increased toxicity under acidic conditions.
Interestingly, although both Bro and 2DG are reported to inhibit glycolysis by targeting hexokinase (Bhardwaj et al., 2010), only Bro suppressed Sta. This could potentially be rationalized by the existence of other cellular targets for Bro, such as pyruvate kinase and GADPH (Ganapathy-Kanniappan et al., 2009). However, the observation that Ite suppressed, whereas Ide did not, was less expected, given that these two glycolysis inhibitors are structurally similar and both are known to be cysteine peptidase inhibitors (Aitken and Learmonth, 1996). In this context, we recognized that among the five ATP-depleting drugs described above, those that suppressed Sta are weak acids (Bro, Ite, and PcP), whereas the others are not (2DG and Ide). This corresponded to a suggestive enrichment of acidic compounds to suppress Sta (Fisher’s exact Test, p = 0.10). Hence, we hypothesized that acidification of the growth medium by Bro underlies its suppression of Sta.
Suppression of Sta by Bro Is Explained by Bro Acidity
To test this hypothesis, we carried out several experiments: first, we found that, at the MIC dose of Bro (1 mg/ml), the growth environment pH decreased by approximately 0.5 (from 6.5 to 6.0). Second, we confirmed that lowering pH by 0.5 had no effect on yeast growth rate as established in the literature (Orij et al., 2012). Third, we found that a 0.5 decrease of pH induced an increase of Sta’s MIC (i.e., suppressing Sta) (Figure 6B) and uncovered previous reports of this phenomenon (Yoshida and Anraku, 2000). This effect is discernible even at a pH change of 0.05, which corresponds to the acidity change that is induced by 10% MIC of Bro. Fourth, we found that the suppressive interaction between Bro and Sta is lost when the media is buffered to 6.5 using NaPO4 buffer (Figure 6C). Fifth, we observed that for the Sta dose that has some inhibitory effect at high pH, the growth curve obtained in acidic media is indistinguishable from the no-drug growth curve. Finally, we observed that Sta’s anti-fungal activity does not change with prior exposure to acidity.
Taken together, these observations suggest that Bro has two discernible effects. The primary effect is glycolysis inhibition, which reduces yeast growth directly. Bro has a secondary effect: media acidification. The magnitude of the pH change caused by Bro at its MIC has no discernable effect on yeast growth but can relieve the detrimental effects of Sta.
In order to further understand this phenomenon, we searched for genetic interactions between Sta-protective genes and genes for which mutation causes a change in cytosolic pH (pHc) (Orij et al., 2012). Interestingly, the Sta-protective gene ARP4 (encoding nuclear actin-related protein) has 14 reported negative genetic interactions with pHc genes (for which deletions confer an increase in cytosolic pH) in the BioGRID Interaction database (Chatr-Aryamontri et al., 2013). In contrast, we failed to find genetic interactions between Bro- and Sta-protective genes. Although this represents an interesting avenue for future investigation of the pH-dependence of Sta, we wished to focus on the extent to which pH could explain the suppression network beyond Bro.
For this, we checked the pH impact on the MIC of eight additional drugs for which all pairwise suppression relationships had been tested: Ben, Hal, Latrunculin B (Lat), Pentamidine (Pen), Rap, Sta, Ter, and Tun. No drug other than Bro caused a pH change in the growth medium. Hence, none of the suppressive interactions between these eight drugs are likely to be caused by acidification of the growth media.
To assess whether the pH impact of Bro explained its suppressing effects beyond Sta, we determined the MIC of nine drugs (Bro and the eight assessed in the preceding paragraph), both in normal and acidic media. The raw data for these experiments are given as Table S5. For Hal, Rap, and Tac, the three Bro-suppressed drugs within this set of nine drugs (Figure 3), acidic media increased the MIC (Figure 6D). Interestingly, the known targets of these three drugs (Erg2, Tor1, and Cnb1, respectively) have 19 negative genetic interactions with genes whose deletion increases cytoplasmic pH. Moreover, all these targets have a negative genetic interaction with VMA11, an ATPase involved in proton transport in yeast (Hirata et al., 1997). These observations suggest the possibility that acidity modifies the cellular concentration of these drugs by affecting drug transporters. Decrease of pH also suppressed (i.e., increased the MIC) of four other drugs within the set of nine tested—Lat, Pen, Ter, and Tun (Figure 7D), although the effects were subtle for Ter and Tun. Interestingly, acidity increased the efficacy of Ben (Figure 6D). We had previously observed no evidence that Bro interacts with these drugs (Cokol et al., 2011). These apparent conflicts suggest that, for most drug pairs, Bro’s more direct biological effect is overriding any pH-mediated effects.
DISCUSSION
Here, we systematically analyzed suppression relationship between drug pairs. We tested 220 drug pairs for suppression: 175 pairs via an analysis of data that had been previously described (Cokol et al., 2011), but not analyzed for suppression, 44 additional pairs with unknown suppression relationships examined experimentally for this study, and one pair previously reported to be suppressive (confirmed here). Collectively, we found 93 directed drug pairs to exhibit suppressive drug interactions and an overall drug suppression frequency of 17% (considering only pairs not tested on the basis of suppression behavior). Based on the extensive literature survey we carried out for this study, we collectively expanded our knowledge of growth suppression relationships between anti-fungal compounds by a factor of 23.
We provided evidence that some drugs have intrinsic tendencies to suppress or be suppressed. Thus, drug suppression frequency likely depends on the drugs and drug pairs tested. In total, we report 17 reciprocally suppressive drug interactions. Although drug interactions of this type have been hypothesized (Yeh et al., 2009), to the best of our knowledge, reciprocal suppression has not been previously reported within any species.
We tested whether drug suppression can arise due to coaggregation of two drugs by comparing the aggregate sizes in individual drugs and combinations. We observed no relationship between coaggregation and drug suppression for all ten pairs among the nine drugs examined. In addition, we observed that some drugs formed aggregates at the doses at which they inhibited yeast growth. Because drugs in aggregates behave differently than in solution (Coan and Shoichet, 2008), a more complete understanding of the aggregation levels of drugs could further our understanding of drug interactions.
From an analysis of the drug suppression network, we identified Bro as frequently suppressing and Sta as frequently suppressed. Consistent with each of these trends, we had observed that Bro strongly suppresses Sta. We conducted chemogenomic experiments with Bro and Sta individually and with a combination in which suppression is observed. Our results for Sta were in agreement with previous studies, indicating Pkc1 as a major target and several biosynthetic processes as protective functions, including steroid and ergosterol synthesis. The tendency of Sta to be suppressed by many drugs (a significant phenomenon even where suppression by Bro is excluded from the network) may be explained by the fact that many drugs induce a stress response (Fulda et al., 2010), which may cause a decrease of biosynthetic processes shown to be protective of Sta activity.
As no previous chemogenomic study was conducted for Bro, our chemogenomic study of Bro is a genome-wide effect analysis for this compound, which is currently under investigation as a chemotherapeutic (Shoshan, 2012). Among 1,106 heterozygous deletions, we identified only two genes (acetyl-CoA-synthetase and acetoacetyl-CoA-thiolase) for which deletion confers sensitivity to Bro. Interestingly, both of these genes encode enzymes impinging on acetyl-CoA metabolism, both carrying out reactions essential during ketogenesis. A reliance on ketogenesis in the presence of Bro supports reports in humans of a synergy in the treatment of astrocytoma between glycolysis inhibitors and a ketogenic diet (Galluzzi et al., 2013) (Marsh et al., 2008).
We found strong evidence that the tendency of Bro to suppress is due to media acidification. Indeed, Bro does not suppress Sta in pH-buffered media. With further experimentation, we found that Bro’s suppression of Hal, Rap, and Tac could also be explained by change in acidity. We also found that the targets of these drugs have a negative genetic interaction with VMA11, an ATPase involved in proton transport in yeast (Hirata et al., 1997). A previous study has found that Sta is exported from the cytosol by H+/drug antiporters (Yoshida and Anraku, 2000). These observations suggest that acidity modifies the cellular concentration of these drugs via effecting drug transporters. We found no evidence that pH effects contributed to the observed suppression network beyond Bro. Furthermore, the Bro-protective genes identified by chemogenomic profiling are presumably unrelated to its acidity, given that the 0.5 pH change caused by Bro has no discernable growth effect on yeast.
Our finding that Bro suppresses Sta by acidifying the extracellular media suggests that Bro has two discernible effects: a primary effect (glycolysis inhibition, which inhibits cell growth) and a secondary effect (pH decrease). The secondary nature of the pH change is supported by the observation that a pH change as great as that caused by the MIC concentration of Bro shows no inhibition of cell growth. In small doses, Bro’s secondary effect protects the cell from the inhibitory effects of Sta. Thus, off-target effects of one drug may protect from the primary effect of a second drug. These expand the framework of considerations required for further computational or experimental analysis of drug interactions.
SIGNIFICANCE
Although not every suppression relationship will be clinically relevant, the observation that 17% of drug pairs not tested on the basis of suppression behavior exhibited significant and substantial suppression demonstrates the high probability that such drug interactions are common and that many clinically relevant interactions remain to be found. Here, with a single systematic study of drug suppression effects, we report 93 suppressive relationships between antifungals and further suggest a framework for systematically exploring the mechanisms of drug suppression. This highlights the value of more extensive study of drug interactions, an important topic at the intersection of pharmacology and systems biology.
EXPERIMENTAL PROCEDURES
Experimental Tests for Drug Interactions
Latrunculin B, Rapamycin, Staurosporine, and Tacrolimus were purchased from AG Scientific. All other drugs were purchased from Sigma. All drugs were dissolved in DMSO (except bromopyruvate and sodium azide, which were dissolved in water) and kept at −20°C. All experiments were conducted with S. cerevisiae strains BY4741 or BY4743 or heterozygous/heterozygous deletion strain collections derived from BY4743. Yeast cells were grown in yeast extract peptone dextrose (YPD) (1% yeast extract, 2% bacto-peptone, and 2% glucose) overnight (OD600~5) and diluted to an OD600 of 0.01 in YPD with the desired drug concentrations controlled for solvent concentrations (plus 0.2 M NaCl in Tac+SFK experiment). Cells were grown at 30°C for 20–24 hr in 96-well plates in Tecan F200 or Genios microplate readers, with OD595 readings of cell density recorded every 15 min. We used the area under growth curve (AUC) of each condition as a metric of cell growth, after discarding the first ten measurement points. The growth measurement data obtained during this study are given as Table S2.
Finding Suppressive Drug-Drug Interactions
For each 8 × 8 grid of drug combinations analyzed, the first column and row contains linearly increasing concentrations of only one drug. Therefore, they correspond to the growth rates observed under certain concentration of drugs A and B, defined as g[A] or g[B]. The remaining rows and columns correspond to the growth rates observed for 49 different concentration combination of drugs g[AB]. The growth level in each condition was defined as the area under growth curve in condition normalized by the area under curve in “no drug” condition. To find suppressive drug interactions, we searched for drug pairs in which the following conditions are satisfied (1) g[AB] is larger than g[A] × g[B], (2) g[AB] is larger than g[A] or g[B], and (3) g[AB] is larger than 10% of growth in the no drug condition. For each suppressive drug-drug interaction, the less-potent drug was defined to suppress the more-potent drug. The matrices of growth levels and suppressive drug interactions are given as Table S3. For error model and enrichment analysis, see the Supplemental Experimental Procedures.
Chemogenomic Experiments
S. cerevisiae deletion strains were grown in pools competitively in the presence of chemicals. One pool contains 1,106 heterozygous deletions strains deleted for one copy of the essential genes, which identifies chemical targets through HaploInsufficiency Profiling (HIP). The other pool contains 4,590 homozygous deletions strains deleted for both copies of the non-essential genes, which identifies genes involved in buffering the chemical target pathway through homozygous deletion profiling (HOP). Both pools share the same BY4743 genetic background, and each strain is specifically barcoded. Five HIPHOP experiments were performed at ~20% inhibition levels of Bromopyruvate (two replicates), Staurosporine, a combination of the two drugs in which suppression has been shown to occur. All yeast cultures started at an initial OD595 of 0.0625 in the presence of each drug and were grown with a Tecan F200 microplate reader (Tecan Systems) at 30°C with orbital shaking. OD595 readings were taken every 15 min for the duration of the experiments. The homozygous deletions strains pool was grown for five generations, whereas the heterozygous deletions strains pool was grown for 20 generations. The homozygous and heterozygous pools for each drug treatment were combined together at an equal amount, and genomic DNA was extracted. PCR was performed on the genomic DNA to amplify the specific barcodes associated with deletion strains. The barcodes were then hybridized to a TAG4 microarray with the complementary sequences of the barcodes. All drug HIPHOP experiments results were normalized against the DMSO experiment.
Dynamic Light Scattering
Drug solutions were made to 100 times the final concentrations in DMSO (bromopyruvate in water). Stocks were diluted 10-fold into filtered YPD and vortexed 10 s. Final samples were made by combining 10 μl of each drug-YPD stock, adding 80 μl filtered YPD, and vortexing 10 s. Measurements were made at room temperature using a DynaPro MS/X (Wyatt Technology) with a 55 mW laser at 826.6 nm. The laser power was 100%, and the detector angle was 90°. Samples were run in duplicate.
Supplementary Material
Acknowledgments
We thank the lab of C. Boone for providing access to their Tecan Genios Microplate readers for experiments. Mu. Cokol was supported by an FP7 Marie Curie IRG grant (268440), the Scientific and Technological Research Council of Turkey (110S209 and 111S126), and the Turkish Academy of Sciences GEBIP Programme. M.T. was supported by the National Institutes of Health (NIH HG004098). C.N. was supported by the Canadian Institutes of Health (MOP-81340) and a National Institutes of Health grant from the National Human Genome Research Institute (HG003317). F.P.R. was supported by the Canada Excellence Research Chairs Program and a Canadian Institute for Advanced Research Fellowship.
Footnotes
SUPPLEMENTAL INFORMATION
Supplemental Information includes Supplemental Experimental Procedures, seven figures, and seven tables and can be found with this article online at http://dx.doi.org/10.1016/j.chembiol.2014.02.012.
AUTHOR CONTRIBUTIONS
Mu. Cokol and F.P.R. designed the study. Mu. Cokol, Z.B.W., K.Y., S.L, D.C., B.M., A.D., A.G., and Me. Cokol conducted the experiments. Mu. Cokol, Z.B.W., K.Y., M.T., A.D., M.A., S.C., G.G., I.I., C.N., B.S., and F.P.R. analyzed the data. Mu. Cokol, Z.B.W., B.M., and R.R.-E. conducted the literature analysis. Mu. Cokol, Z.B.W., K.Y., M.T., and F.P.R. wrote the paper.
References
- Abe F, Usui K, Hiraki T. Fluconazole modulates membrane rigidity, heterogeneity, and water penetration into the plasma membrane in Saccharomyces cerevisiae. Biochemistry. 2009;48:8494–8504. doi: 10.1021/bi900578y. [DOI] [PubMed] [Google Scholar]
- Aitken A, Learmonth M. Carboxymethylation of cysteine using iodoacetamide/iodoacetic acid. In: Walker JM, editor. The Protein Protocols Handbook. Totowa, NJ: Humana Press; 1996. pp. 339–340. [Google Scholar]
- Bandy J, Milward D, McQuay S. Mining protein-protein interactions from published literature using Linguamatics I2E. Methods Mol Biol. 2009;563:3–13. doi: 10.1007/978-1-60761-175-2_1. [DOI] [PubMed] [Google Scholar]
- Berg JM, Tymoczko JL, Stryer L. Biochemistry. New York: W.H. Freeman & Company; 2010. [Google Scholar]
- Berriz GF, Beaver JE, Cenik C, Tasan M, Roth FP. Next generation software for functional trend analysis. Bioinformatics. 2009;25:3043–3044. doi: 10.1093/bioinformatics/btp498. [DOI] [PMC free article] [PubMed] [Google Scholar]
- Bhardwaj V, Rizvi N, Lai MB, Lai JCK, Bhushan A. Glycolytic enzyme inhibitors affect pancreatic cancer survival by modulating its signaling and energetics. Anticancer Res. 2010;30:743–749. [PubMed] [Google Scholar]
- Bierer BE, Mattila PS, Standaert RF, Herzenberg LA, Burakoff SJ, Crabtree G, Schreiber SL. Two distinct signal transmission pathways in T lymphocytes are inhibited by complexes formed between an immunophilin and either FK506 or rapamycin. Proc Natl Acad Sci USA. 1990;87:9231–9235. doi: 10.1073/pnas.87.23.9231. [DOI] [PMC free article] [PubMed] [Google Scholar]
- Bollenbach T, Quan S, Chait R, Kishony R. Nonoptimal microbial response to antibiotics underlies suppressive drug interactions. Cell. 2009;139:707–718. doi: 10.1016/j.cell.2009.10.025. [DOI] [PMC free article] [PubMed] [Google Scholar]
- Butcher RA, Schreiber SL. A small molecule suppressor of FK506 that targets the mitochondria and modulates ionic balance in Saccharomyces cerevisiae. Chem Biol. 2003;10:521–531. doi: 10.1016/s1074-5521(03)00108-x. [DOI] [PubMed] [Google Scholar]
- Butcher RA, Schreiber SL. Identification of Ald6p as the target of a class of small-molecule suppressors of FK506 and their use in network dissection. Proc Natl Acad Sci USA. 2004;101:7868–7873. doi: 10.1073/pnas.0402317101. [DOI] [PMC free article] [PubMed] [Google Scholar]
- Caspi R, Altman T, Billington R, Dreher K, Foerster H, Fulcher CA, Holland TA, Keseler IM, Kothari A, Kubo A, et al. The MetaCyc database of metabolic pathways and enzymes and the BioCyc collection of Pathway/Genome Databases. Nucleic Acids Res. 2013;36(Database issue):D623–D631. doi: 10.1093/nar/gkt1103. [DOI] [PMC free article] [PubMed] [Google Scholar]
- Chang YH, Teichert U, Smith JA. Purification and characterization of a methionine aminopeptidase from Saccharomyces cerevisiae. J Biol Chem. 1990;265:19892–19897. [PubMed] [Google Scholar]
- Chatr-Aryamontri A, Breitkreutz BJ, Heinicke S, Boucher L, Winter A, Stark C, Nixon J, Ramage L, Kolas N, O’Donnell L, et al. The BioGRID interaction database: 2013 update. Nucleic Acids Res. 2013;41(Database issue):D816–D823. doi: 10.1093/nar/gks1158. [DOI] [PMC free article] [PubMed] [Google Scholar]
- Coan KED, Shoichet BK. Stoichiometry and physical chemistry of promiscuous aggregate-based inhibitors. J Am Chem Soc. 2008;130:9606–9612. doi: 10.1021/ja802977h. [DOI] [PMC free article] [PubMed] [Google Scholar]
- Cokol M, Chua HN, Tasan M, Mutlu B, Weinstein ZB, Suzuki Y, Nergiz ME, Costanzo M, Baryshnikova A, Giaever G, et al. Systematic exploration of synergistic drug pairs. Mol Syst Biol. 2011;7:544. doi: 10.1038/msb.2011.71. [DOI] [PMC free article] [PubMed] [Google Scholar]
- de Resende MA, Alterthum F. Effect of nystatin, amphotericin B and amphotericin B methyl ester on Saccharomyces cerevisiae with different lipid composition. Mycopathologia. 1990;112:165–172. doi: 10.1007/BF00436649. [DOI] [PubMed] [Google Scholar]
- Exinger F, Lacroute F. 6-Azauracil inhibition of GTP biosynthesis in Saccharomyces cerevisiae. Curr Genet. 1992;22:9–11. doi: 10.1007/BF00351735. [DOI] [PubMed] [Google Scholar]
- Farha MA, Brown ED. Chemical probes of Escherichia coli uncovered through chemical-chemical interaction profiling with compounds of known biological activity. Chem Biol. 2010;17:852–862. doi: 10.1016/j.chembiol.2010.06.008. [DOI] [PubMed] [Google Scholar]
- Feng BY, Shoichet BK. Synergy and antagonism of promiscuous inhibition in multiple-compound mixtures. J Med Chem. 2006;49:2151–2154. doi: 10.1021/jm060029z. [DOI] [PMC free article] [PubMed] [Google Scholar]
- Fridell JA, Jain AKB, Patel K, Virji M, Rao KN, Fung JJ, Venkataramanan R. Phenytoin decreases the blood concentrations of sirolimus in a liver transplant recipient: a case report. Ther Drug Monit. 2003;25:117–119. doi: 10.1097/00007691-200302000-00019. [DOI] [PubMed] [Google Scholar]
- Fugh-Berman A. Herb-drug interactions. Lancet. 2000;355:134–138. doi: 10.1016/S0140-6736(99)06457-0. [DOI] [PubMed] [Google Scholar]
- Fulda S, Gorman AM, Hori O, Samali A. Cellular stress responses: cell survival and cell death. Int J Cell Biol. 2010;2010:214074. doi: 10.1155/2010/214074. [DOI] [PMC free article] [PubMed] [Google Scholar]
- Galluzzi L, Kepp O, Vander Heiden MG, Kroemer G. Metabolic targets for cancer therapy. Nat Rev Drug Discov. 2013;12:829–846. doi: 10.1038/nrd4145. [DOI] [PubMed] [Google Scholar]
- Ganapathy-Kanniappan S, Geschwind JFH, Kunjithapatham R, Buijs M, Vossen JA, Tchernyshyov I, Cole RN, Syed LH, Rao PP, Ota S, Vali M. Glyceraldehyde-3-phosphate dehydrogenase (GAPDH) is pyruvylated during 3-bromopyruvate mediated cancer cell death. Anticancer Res. 2009;29:4909–4918. [PMC free article] [PubMed] [Google Scholar]
- Ganapathy-Kanniappan S, Vali M, Kunjithapatham R, Buijs M, Syed LH, Rao PP, Ota S, Kwak BK, Loffroy R, Geschwind JF. 3-bromopyruvate: a new targeted antiglycolytic agent and a promise for cancer therapy. Curr Pharm Biotechnol. 2010;11:510–517. doi: 10.2174/138920110791591427. [DOI] [PubMed] [Google Scholar]
- Giaever G, Chu AM, Ni L, Connelly C, Riles L, Véronneau S, Dow S, Lucau-Danila A, Anderson K, André B, et al. Functional profiling of the Saccharomyces cerevisiae genome. Nature. 2002;418:387–391. doi: 10.1038/nature00935. [DOI] [PubMed] [Google Scholar]
- Hillenmeyer ME, Fung E, Wildenhain J, Pierce SE, Hoon S, Lee W, Proctor M, St Onge RP, Tyers M, Koller D, et al. The chemical genomic portrait of yeast: uncovering a phenotype for all genes. Science. 2008;320:362–365. doi: 10.1126/science.1150021. [DOI] [PMC free article] [PubMed] [Google Scholar]
- Hiom SJ, Furr JR, Russell AD, Dickinson JR. Effects of chlorhexidine diacetate and cetylpyridinium chloride on whole cells and protoplasts of Saccharomyces cerevisiae. Microbios. 1993;74:111–120. [PubMed] [Google Scholar]
- Hirata R, Graham LA, Takatsuki A, Stevens TH, Anraku Y. VMA11 and VMA16 encode second and third proteolipid subunits of the Saccharomyces cerevisiae vacuolar membrane H+-ATPase. J Biol Chem. 1997;272:4795–4803. doi: 10.1074/jbc.272.8.4795. [DOI] [PubMed] [Google Scholar]
- Hoon S, Gebbia M, Costanzo M, Davis RW, Giaever G, Nislow C. A global perspective of the genetic basis for carbonyl stress resistance. G3 (Bethesda) 2011;1:219–231. doi: 10.1534/g3.111.000505. [DOI] [PMC free article] [PubMed] [Google Scholar]
- Inokoshi J, Tomoda H, Hashimoto H, Watanabe A, Takeshima H, Omura S. Cerulenin-resistant mutants of Saccharomyces cerevisiae with an altered fatty acid synthase gene. Mol Gen Genet. 1994;244:90–96. doi: 10.1007/BF00280191. [DOI] [PubMed] [Google Scholar]
- Lehár J, Krueger AS, Avery W, Heilbut AM, Johansen LM, Price ER, Rickles RJ, Short GF, 3rd, Staunton JE, Jin X, et al. Synergistic drug combinations tend to improve therapeutically relevant selectivity. Nat Biotechnol. 2009;27:659–666. doi: 10.1038/nbt.1549. [DOI] [PMC free article] [PubMed] [Google Scholar]
- Lum PY, Armour CD, Stepaniants SB, Cavet G, Wolf MK, Butler JS, Hinshaw JC, Garnier P, Prestwich GD, Leonardson A, et al. Discovering modes of action for therapeutic compounds using a genome-wide screen of yeast heterozygotes. Cell. 2004;116:121–137. doi: 10.1016/s0092-8674(03)01035-3. [DOI] [PubMed] [Google Scholar]
- Marsh J, Mukherjee P, Seyfried TN. Drug/diet synergy for managing malignant astrocytoma in mice: 2-deoxy-D-glucose and the restricted ketogenic diet. Nutr Metab (Lond) 2008;5:33. doi: 10.1186/1743-7075-5-33. [DOI] [PMC free article] [PubMed] [Google Scholar]
- Moore CW. Cleavage of cellular and extracellular Saccharomyces cerevisiae DNA by bleomycin and phleomycin. Cancer Res. 1989;49:6935–6940. [PubMed] [Google Scholar]
- Ngo BT, Pascoe M, Khan D. Drug interaction between rifampicin and sirolimus in transplant patients. Saudi J Kidney Dis Transpl. 2011;22:112–115. [PubMed] [Google Scholar]
- Orij R, Urbanus ML, Vizeacoumar FJ, Giaever G, Boone C, Nislow C, Brul S, Smits GJ. Genome-wide analysis of intracellular pH reveals quantitative control of cell division rate by pH(c) in Saccharomyces cerevisiae. Genome Biol. 2012;13:R80. doi: 10.1186/gb-2012-13-9-r80. [DOI] [PMC free article] [PubMed] [Google Scholar]
- Palmer AC, Kishony R. Understanding, predicting and manipulating the genotypic evolution of antibiotic resistance. Nat Rev Genet. 2013;14:243–248. doi: 10.1038/nrg3351. [DOI] [PMC free article] [PubMed] [Google Scholar]
- Parsons AB, Brost RL, Ding H, Li Z, Zhang C, Sheikh B, Brown GW, Kane PM, Hughes TR, Boone C. Integration of chemical-genetic and genetic interaction data links bioactive compounds to cellular target pathways. Nat Biotechnol. 2004;22:62–69. doi: 10.1038/nbt919. [DOI] [PubMed] [Google Scholar]
- Patel S, Sprung AU, Keller BA, Heaton VJ, Fisher LM. Identification of yeast DNA topoisomerase II mutants resistant to the antitumor drug doxorubicin: implications for the mechanisms of doxorubicin action and cytotoxicity. Mol Pharmacol. 1997;52:658–666. doi: 10.1124/mol.52.4.658. [DOI] [PubMed] [Google Scholar]
- Patsalos PN, Perucca E. Clinically important drug interactions in epilepsy: interactions between antiepileptic drugs and other drugs. Lancet Neurol. 2003;2:473–481. doi: 10.1016/s1474-4422(03)00483-6. [DOI] [PubMed] [Google Scholar]
- Pelicano H, Martin DS, Xu RH, Huang P. Glycolysis inhibition for anticancer treatment. Oncogene. 2006;25:4633–4646. doi: 10.1038/sj.onc.1209597. [DOI] [PubMed] [Google Scholar]
- Pierce SE, Davis RW, Nislow C, Giaever G. Genome-wide analysis of barcoded Saccharomyces cerevisiae gene-deletion mutants in pooled cultures. Nat Protoc. 2007;2:2958–2974. doi: 10.1038/nprot.2007.427. [DOI] [PubMed] [Google Scholar]
- Schmidt MM, Dringen R. Differential effects of iodoacetamide and iodoacetate on glycolysis and glutathione metabolism of cultured astrocytes. Front Neuroenergetics. 2009;1:1. doi: 10.3389/neuro.14.001.2009. [DOI] [PMC free article] [PubMed] [Google Scholar]
- Shoshan MC. 3-Bromopyruvate: targets and outcomes. J Bioenerg Biomembr. 2012;44:7–15. doi: 10.1007/s10863-012-9419-2. [DOI] [PubMed] [Google Scholar]
- Sud IJ, Feingold DS. Mechanisms of action of the antimycotic imidazoles. J Invest Dermatol. 1981;76:438–441. doi: 10.1111/1523-1747.ep12521036. [DOI] [PubMed] [Google Scholar]
- Szerlong H, Saha A, Cairns BR. The nuclear actin-related proteins Arp7 and Arp9: a dimeric module that cooperates with architectural proteins for chromatin remodeling. EMBO J. 2003;22:3175–3187. doi: 10.1093/emboj/cdg296. [DOI] [PMC free article] [PubMed] [Google Scholar]
- Titus LC, Dawson TR, Rexer DJ, Ryan KJ, Wente SR. Members of the RSC chromatin-remodeling complex are required for maintaining proper nuclear envelope structure and pore complex localization. Mol Biol Cell. 2010;21:1072–1087. doi: 10.1091/mbc.E09-07-0615. [DOI] [PMC free article] [PubMed] [Google Scholar]
- Van den Berg MA, Steensma HY. ACS2, a Saccharomyces cerevisiae gene encoding acetyl-coenzyme A synthetase, essential for growth on glucose. Eur J Biochem. 1995;231:704–713. doi: 10.1111/j.1432-1033.1995.tb20751.x. [DOI] [PubMed] [Google Scholar]
- Whitney AB, Bellion E. ATPase activities in peroxisome-proliferating yeast. Biochim Biophys Acta. 1991;1058:345–355. doi: 10.1016/s0005-2728(05)80130-6. [DOI] [PubMed] [Google Scholar]
- Xu RH, Pelicano H, Zhou Y, Carew JS, Feng L, Bhalla KN, Keating MJ, Huang P. Inhibition of glycolysis in cancer cells: a novel strategy to overcome drug resistance associated with mitochondrial respiratory defect and hypoxia. Cancer Res. 2005;65:613–621. [PubMed] [Google Scholar]
- Yeh PJ, Hegreness MJ, Aiden AP, Kishony R. Drug interactions and the evolution of antibiotic resistance. Nat Rev Microbiol. 2009;7:460–466. doi: 10.1038/nrmicro2133. [DOI] [PMC free article] [PubMed] [Google Scholar]
- Yoshida S, Anraku Y. Characterization of staurosporine-sensitive mutants of Saccharomyces cerevisiae: vacuolar functions affect staurosporine sensitivity. Mol Gen Genet. 2000;263:877–888. doi: 10.1007/s004380000255. [DOI] [PubMed] [Google Scholar]
- Yoshida S, Ikeda E, Uno I, Mitsuzawa H. Characterization of a staurosporine- and temperature-sensitive mutant, stt1, of Saccharomyces cerevisiae: STT1 is allelic to PKC1. Mol Gen Genet. 1992;231:337–344. doi: 10.1007/BF00292700. [DOI] [PubMed] [Google Scholar]
Associated Data
This section collects any data citations, data availability statements, or supplementary materials included in this article.