

Abstract
Airway dehydration causes mucus stasis and bacterial overgrowth in cystic fibrosis and chronic bronchitis (CB). Rehydration by hypertonic saline is efficacious but suffers from a short duration of action. We tested whether epithelial sodium channel (ENaC) inhibition would rehydrate normal and dehydrated airways to increase mucociliary clearance (MCC) over a significant time frame. For this, we used a tool compound (Compound A), which displays nanomolar ENaC affinity and retention in the airway surface liquid (ASL). Using normal human bronchial epithelial cultures (HBECs) grown at an air-liquid interface, we evaluated in vitro potency and efficacy using short-circuit current (Isc) and ASL height measurements where it inhibited Isc and increased ASL height by ∼50% (0.052 μM at 6 h), respectively. The in vivo efficacy was investigated in a modified guinea pig tracheal potential difference model, where we observed an effective dose (ED50) of 5 μg/kg (i.t.), and by MCC measures in rats and sheep, where we demonstrated max clearance rates at 100 μg/kg (i.t.) and 75 μg/kg (i.t.), respectively. Acute cigarette smoke-induced ASL height depletion in HBECs was used to mimic the situation in patients with CB, and pretreatment prevented both cigarette smoke-induced ASL dehydration and lessened the decrease in ciliary beat frequency. Furthermore, when added after cigarette smoke exposure, Compound A increased the rate of ASL rehydration. In conclusion, Compound A demonstrated significant effects and a link between increased airway hydration, ciliary function, and MCC. These data support the hypothesis that ENaC inhibition may be efficacious in the restoration of mucus hydration and transport in patients with CB.
Keywords: airway surface liquid, ciliary beat frequency, tracheal potential difference, mucociliary clearance, cystic fibrosis, chronic obstructive pulmonary disease, chronic bronchitis, cystic fibrosis transmembrane conductance regulator
mucus clearance in the conducting airways plays a major role in innate host defense (4, 11–13, 22). During normal mucus clearance, inhaled pathogens and particles become trapped in the mucus layer and are then expelled before they can colonize the airways (7). The mucus layer is of variable height, and mucus is separated from the predominantly ciliated airway epithelia by the presence of an ∼7-μm periciliary liquid layer, which surrounds the beating cilia and acts as a lubricant to keep mucus away from the epithelial cell surface. Together, these layers make up the airway surface liquid (ASL) (5). The rate of mucociliary clearance (MCC) is strongly influenced by the hydration state of the ASL/mucus (35). Mucus hydration is set by the volume of liquid present on airway surfaces, which in turn is modified by active ion transport processes involving the epithelial sodium channel in both the superficial epithelium and glands (3, 5, 43, 44).
The epithelial sodium channel (ENaC) is a key molecular target in the etiology of several diseases that are characterized by aberrant epithelial Na+ transport. For example, mutations involving gain or loss of ENaC function in the kidney underlie Liddle's syndrome and type-1 pseudohypoaldosteronism, respectively, and cause suffering from severe abnormalities in blood pressure and whole body electrolyte homeostasis (23, 31). Similarly, in the airways of patients with cystic fibrosis (CF), ENaC is abnormally hyperactive, attributable in part to excessive proteolytic cleavage of ENaC in the absence of the CF gene product, the CF transmembrane conductance regulator (CFTR) (18). The disproportionate Na+ absorption contributes to a depletion of ASL and is believed to be responsible for mucus stasis and increased incidence of airway infections that lead to progressive decline in lung function and early mortality in patients with CF patients. ASL is also dehydrated in the airways of patients with chronic obstructive pulmonary disease (COPD) attributable to a tobacco smoke-induced decrease in CFTR-mediated anion secretion and a concomitant increase in mucus secretion, which together lead to mucus plugging, bacterial infection, and chronic neutrophilia (9, 32). The extracellular loops of ENaC are proteolytically cleaved by trypsin-like proteases and/or neutrophil elastase, leading to channel activation and increased Na+ absorption (6). COPD airways display an abundance of free neutrophil elastase that is predicted to hyperactivate ENaC, which will exacerbate mucus dehydration (6, 15).
Given the prominent role that ENaC plays in a number of diseases, it is not surprising that ENaC inhibitors (amiloride, benzamil, and related compounds) have been used therapeutically. For example, systemic administration of amiloride rapidly normalizes blood pressure and plasma electrolytes in patients with Liddle's syndrome (21). Biological control of ENaC is complex and offers several opportunities for therapeutic intervention. However, to date, no effective ENaC inhibitor exists for the treatment of chronic airway disease. Amiloride-like compounds are readily absorbed across epithelial barriers and thus distribute rapidly throughout the body, even if selectively applied to a specific tissue or fluid compartment such as the lung (16, 37). As a consequence, the therapeutic benefits of treating an ENaC defect in the airways are outweighed by unwanted actions of amiloride at other sites. As a case in point, chronic pulmonary application of amiloride significantly prolongs survival and greatly attenuates the pulmonary disease symptoms in a mouse model of chronic lung disease (airway-specific overexpression of the β-subunit of ENaC), but the rapid trafficking of amiloride from the airways into the systemic circulation causes excessive and undesirable renal excretion of fluid and Na+ (46) and hyperkalemia (2). The aim of the present study was to test the concept that ENaC inhibition would help rehydrate cigarette smoke (CS) exposed-airway cultures and thereby restore MCC. To achieve this goal, we developed a novel compound (Compound A), which has high affinity for ENaC and is poorly absorbed across airway epithelia. To further corroborate our studies, we also tested its actions in vivo in three separate, nondiseased species.
MATERIALS AND METHODS
Ussing Chamber Measurements
The in vitro potency of Compound A was tested in normal human bronchial epithelial (HBEC) cultures from healthy donors (MatTek, Ashland, MA) that were grown at an air-liquid interface (ALI) on Transwell permeable supports (0.4-μm polycarbonate membrane, 12-mm insert; Costar Corning, Corning, NY). Experiments were performed using modified Ussing chambers containing carboxygenated (95% O2-5% CO2) Krebs solution at 37°C. Cell layers were allowed to equilibrate before being voltage clamped at 0 mV and then briefly clamped at 10 mV to assess transepithelial electrical resistance. While measuring short-circuit current (Isc), we applied inhibitors cumulatively before benzamil (10 μM) was added on the final response plateau, to which calculated responses were standardized (100%). Compound A was tested compared with amiloride, benzamil, and P-552, a well characterized ENaC inhibitor developed by Parion Sciences (17), in a concentration range from 10 pM-30 μM.
Gravimetric Measurements of ASL Height
The efficacy and duration of Compound A, benzamil, and amiloride were observed by means of gravity in HBECs grown under ALI conditions (Donor 231849, cat. no. CC-2540; Lonza, Walkersville, MD) in a 24-well plate format using Transwell clear filters (0.4-μm polycarbonate membrane, 6.5-mm insert, Costar Corning). After 3–4 wk, HBEC ALI cultures were washed with PBS twice before the experiment was initiated. A sample (30 μl) of either vehicle or test compound (10 μM) was added apically, and inserts were weighed after removal of basolateral fluid (17). The weighing procedure was repeated at 4, 8, and 24 h.
XZ Confocal ASL Height Measurements and Ciliary Beating Frequency
Primary normal HBEC cultures were obtained by the UNC CF Center Tissue Core under protocols approved by the UNC Institutional Committee for the Protection of the Rights of Human Subjects as described, plated on 12-mm T-clear culture inserts, and studied 3–5 wk after seeding as described (45).
To measure ASL height, cultures were prewashed twice in PBS, and PBS (20 μl) containing 2 mg/ml rhodamine-dextran (10 kDa; Invitrogen, Carlsbad, CA) was added to cultures at the start of the experiment. To study absorption, the 20 μl PBS was left on HBEC surfaces (e.g., Fig. 3), whereas, under steady-state conditions, PBS was aspirated with a Pasteur pipette to bring ASL volume down to ≤10 μm (e.g., Figs. 8 and 9). Five predetermined points (one central and four 2 mm from the edge of the culture) were XZ scanned using a confocal microscope (Leica SP5; ×63/1.3 NA glycerol immersion lens) as described (45). Cultures were returned to the incubator between time points. For all studies, perfluorocarbon was added mucosally during imaging to prevent evaporation of the ASL.
Fig. 3.

Compound A reduces ASL absorption under thin film conditions in HBEC cultures. A: typical XZ confocal micrographs of ASL height (red) before (0 h) and 6 h after exposure to Compound A or vehicle (control; PBS). Scale bar = 7 μm. B: mean ASL height over time in normal HBECs without (■), or with 10−8 M (▲) and 10−6 M (●) Compound A. All n = 6–11. C and D: dose responses for Compound A vs. ASL height taken 2 and 6 h after Compound A exposure, respectively. All n = 6–11. Data shown as means ± SE. *P < 0.05 different ± Compound A.
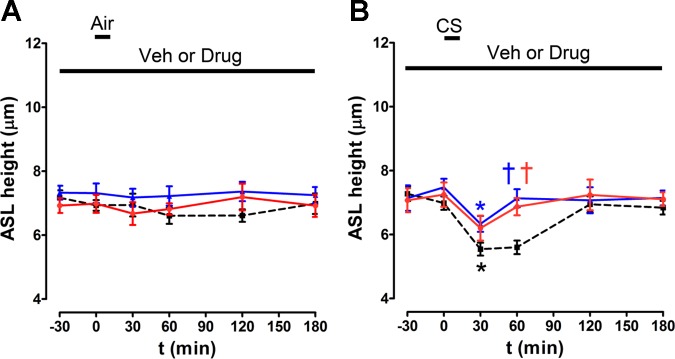
Fig. 8.

Compound A prevents cigarette smoke (CS)-induced ASL volume depletion. A: typical XZ confocal micrographs of ASL height (red) in the presence of either Compound A or vehicle (PBS) and following exposure to air (control) or 10 puffs of CS as indicated. Scale bar = 7 μm. B and C: mean ASL height over time when cultures were dosed with 1 μM Compound A or vehicle for 2 h followed by air or CS, respectively. All n = 9–12. Importantly, baseline ASL was set to ∼7 μm to induce a comparative situation between the 2 groups. D: heat maps of ciliary beat frequency (CBF) following air (control) or CS exposure in HBECs measured using the Sisson-Ammons Video Analysis system. E: mean CBF measured immediately before (0) or up to 3 h after exposure to air in the presence of vehicle or Compound A (1 μM). All n = 6. F: mean CBF measured immediately before (0) or up to 3 h after CS exposure with vehicle or Compound A (1 μM). ■, air/vehicle; ●, air/Compound A; ▲, CS/vehicle; ▼, CS/Compound A. Data shown as means ± SE. *P < 0.05 different ± air or CS; †P < 0.05 different ± Compound A.
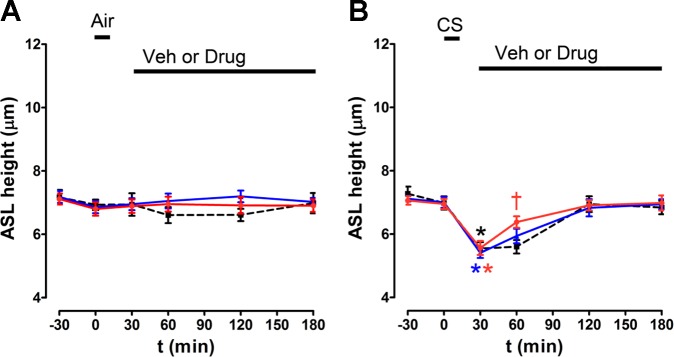
Fig. 9.

Compound A increases ASL recovery after CS exposure. ASL height was measured by XZ confocal microscopy. A: effect of Compound A, added as a dry powder in perfluorocarbon, on ASL height after air exposure. All n = 6–8. B: effect of Compound A, added as a dry powder in perfluorocarbon on ASL height after CS exposure as indicated. All n = 5–8. Perfluorocarbon alone served as the vehicle. Data shown as mean ± SE. *P < 0.05 different ± air or CS; †P < 0.05 different ± Compound A.
To measure ciliary beat frequency (CBF), a digitized video was collected in 2.1-s segments using a Nikon TE2000 and a MegaPlus ES310 (Kodak) turbo video camera. CBF analysis was performed on digitized video using Sisson-Ammons Video Analysis software (42).
Cigarette Smoking of ALI Cultures
CS exposure to HBECs was conducted by using a smoke engine as previously described (8, 9). In brief, smoke from one Kentucky research cigarette (2R4F) was generated according to ISO standards (2 s/35-ml puff) and applied immediately to HBECs using a Borgwaldt smoke engine (LC1). One important difference to previous experiments was that, after mucosal addition of Compound A or vehicle (PBS) in 20 μl, excess PBS was aspirated from HBEC mucosal surfaces to set the ASL height at ∼7 μm before smoke exposure to induce a comparative situation for the two groups, and as such the increased baseline ASL height induced by Compound A was thus normalized.
In Vivo Efficacy Measurements
All studies in guinea pigs and rats were approved by the local ethical committee in Gothenburg. Animals were given free access to food and water during the conscious periods of the experimental protocols, and they were acclimatized for at least 1 wk in the animal facility with 12-h:12-h light/dark cycle at 21 ± 2°C and with 55 ± 15% relative humidity.
Tracheal potential difference.
Male Dunkin Hartley guinea pigs (Charles River, Sulzfeld, Germany) were anaesthetized, and a breathing tube with an integrated electrode was inserted into the trachea to administer drugs and to measure tracheal potential difference (TPD) (AstraZeneca R&D, Mölndal, Sweden). The reference electrode was placed on the outside of the trachea. A catheter was introduced into the right carotid artery for blood pressure recordings, maintenance of anesthesia, and blood sampling. Online recordings of TPD were performed during a three-step dosing interval of each 30 min on 4–11 animals per treatment group and 8 control animals. The response by test compound on the TPD was measured per individual by taking the area under the curve (baseline predose) per dose compared with the full inhibition window for ENaC inhibition (50% in the present model) to produce a dose-response curve. The percentage evaluation of the results was considered superior to presenting absolute data when comparing in vivo potency between compounds. Ninety minutes after the first dose, the animals were terminated, and the trachea and left lung lobes were removed and analyzed for content of test compound. To find out whether there were unwanted effects of the test compounds on sodium and potassium levels in the blood, blood electrolyte content at the end of the experiment was compared with baseline concentrations (data not shown).
Rat MCC.
Female Wistar rats were randomized upon arrival. Compound A was run in four separate studies to build up both the dose-response relationship and the duration of effect where vehicles were included in each study. Data were pooled because there were no statistically significant differences between the vehicles in each study, giving vehicle (n = 39), 3 μg/kg (n = 4), 30 μg/kg (n = 6), 100 μg/kg (n = 13), 100 μg/kg 2-h pre-MCC measurement (n = 5), and 100 μg/kg 4-h pre-MCC measurement (n = 3). A human serum albumin-based-radiolabeled colloid particle (99mTc-albumin, Nanocoll; GE Healthcare, Piscataway, NJ) was used to estimate the distribution of delivered activity and the subsequent course of clearance from the airway by the mucociliary transportation by means of single-photon emission-computed tomography. In brief, the rats were anaesthetized with isoflurane, and the test compound or vehicle was administered via passive inhalation in a nose-only exposure system. A novel closed exposure chamber was developed and used in combination with a vibrating mesh nebulizer (Aerogen, Galway, Ireland) to efficiently dose individual animals during ∼2 min. Shortly after the drug/vehicle administration for the dose-response experiments, 99mTc-colloids (∼50 MBq/rat) were dosed in a similar fashion. For duration of effect evaluation, the vehicle/compound was administered 2 or 4 h before the administration of 99mTc-colloids. The clearance of 99mTc from the lung (i.e., a measure of MCC) was determined by comparing lung levels of 99mTc immediately after the dosing of 99mTc and at a time point 2 h later. The rats were allowed to wake up in between imaging time points and again anaesthetized with Isoflurane shortly before the second measurement.
Sheep MCC.
The Mount Sinai Medical Center (MSMC) Animal Research Committee approved all procedures used in this protocol. MSMC is fully accredited by the Association for Assessment of Laboratory Animal Care International.
Seven adult female sheep (37–54 kg) were used in the present study, once or twice with a washout of at least 1 wk between experiments. The animals were conscious and upright in a supportive cart and intubated for nebulized delivery of test compounds and radiolabeled 99mTechnetium-sulfur colloid (1). The test compound was delivered 4 h (Compound A at 0.3 and 3 mg/sheep, equivalent to 7.5 and 75 μg/kg) before measurements of MCC, whereas the corresponding vehicle was administered 1 h before measurements (3 ml 0.9% NaCl). MCC was measured as the retention of radiolabeled 99mTc every 5 min over a 1-h period and expressed as percentage of radioactivity present in the initial baseline image (100%). The vehicle data 1 h after dosing demonstrated normal MCC rate, and controls were not repeated at the 4-h predosing protocol for ethical reasons. Plasma samples were collected at nine time points over 24 h after compound administration for determination of plasma exposure of drug as well as potassium and sodium content in blood.
Renal electrolyte handling in the anaesthetized rat.
Twelve female Wistar rats were anaesthetized by means of spontaneously breathing isoflurane (induction concentration of 5% followed by 2%). A catheter was positioned in the carotid artery for blood sampling and measurement of mean arterial blood pressure and heart rate. Another catheter was placed in the vena jugularis for continuous infusion of test compound according to a three-step dose design, where each step had a duration of 30 min (bolus given over 6 min + infusion over 24 min, giving a total of: 0.02-0.2-2.0 μg/kg per min * 30) or vehicle (68 μl/kg per min during bolus and 17 μl/kg per min during infusion, giving a total of 1.6 ml/kg per h) plus a constant infusion of 0.9% NaCl (12 ml/kg per h) to secure urine production. The urinary bladder was catheterized for urine collection. The animals were left to stabilize for at least 30 min after surgery during constant basal infusions before any test compound or vehicle infusion was initiated. Urine was collected over 20-min periods, two at baseline (i.e., preexposure), followed by three 30-min exposures of increasing doses of test compound or vehicle, where urine was collected over the last 20 min for each dose. Additional urine was collected during the washout period (0–20, 20–40, and 40–60 min after cessation of the infusion protocol). Blood samples were collected 5 min before the end of each urine collection period for electrolyte evaluation (iSTAT analyzer; Abbott Laboratories, Chicago, IL) and plasma concentration of drug (liquid chromatography-tandem mass spectrometry, LC-MSMS). Urine production, electrolytes (ABL700; Radiometer Medical ApS, Brønshøj, Denmark, for urine), as well as concentration of test compound (LC-MSMS) were evaluated.
Statistical Analyses
In vitro assays.
All data are presented as means ± SE. Values of n refer to the number of cultures used in each group as appropriate. For normally distributed data, paired or unpaired Student's t-tests were used. For not normally distributed data, Mann-Whitney U test or Wilcoxon matched-pairs test were used. For comparisons of multiple groups, ANOVA tests were used followed by Tukey-Kramer multiple-comparisons test (parametric) or ANOVA followed by Kruskal-Wallis Test (nonparametric). For experiments using primary HBECs, a minimum of four different donors supplied cultures for each experiment. For the Ussing chamber data, unconstrained concentration-response curves were fitted using an in-house Microsoft Excel add-in package by nonlinear, four-parameter, logistic-regression analysis. From these curves, pEC50 and Emax values were taken, from which mean values were calculated.
In vivo models.
The sheep MCC evaluations were performed in only a few experiments, and adequate statistical analysis of the data was thus not possible (Student's t-test between individual slopes for treatment group vs. control indicates significant differences, but only descriptive statistical analysis has been described). Rat MCC and guinea pig TPD were analyzed by means of one-way ANOVA followed by Dunnett's post hoc test (GraphPad Prism v.5; GraphPad, San Diego, CA) and the rat electrolyte data analyzed by means of repeated-measures ANCOVA (SAS v.9). A difference of statistical significance is marked as *P < 0.05, **P < 0.01, or ***P < 0.001, unless the P values are given.
RESULTS
Compound A Has Significant In Vitro Potency Against ENaC
We generated a library of highly soluble compounds with long lung duration (t½ > 20 h in rats) and good potency against ENaC (pIC50 > 9) from which compound A was chosen. Compound A caused a rapid decrease in Isc, and the effects of Compound A and benzamil were not additive (Fig. 1), suggesting that they both targeted ENaC. All inhibitors tested in the Ussing chambers decreased the Isc to a similar degree as benzamil, and the rank order of potencies were Compound A > P-552 > benzamil > amiloride, with Compound A (IC50 = 0.177 nM, n = 8) demonstrating a potency shift of 3.5 log units vs. amiloride (IC50 = 0.454 μM, n = 2, benzamil IC50 = 21.9 nM, n = 13) and greater than sevenfold more potency than P-552 (IC50 = 1.29 nM, n = 5; Fig. 1C). Compound A demonstrated a great selectivity and secondary pharmacology profile with its main hits at α1A receptor (0.2 μM) and dopamine transporter (0.91 μM), whereas Nav1.5 (>33.3 μM), Nav1.2 (>33.3 μM), human ether-a-go-go (13% inhibition at 10 μM), M2 receptor (>100 μM), and β2 receptor (>100 μM) were essentially untouched (Millipore, Billerica, MA; binding assays of 124 and 154 targets, respectively; actives were followed up in functional assays).
Fig. 1.
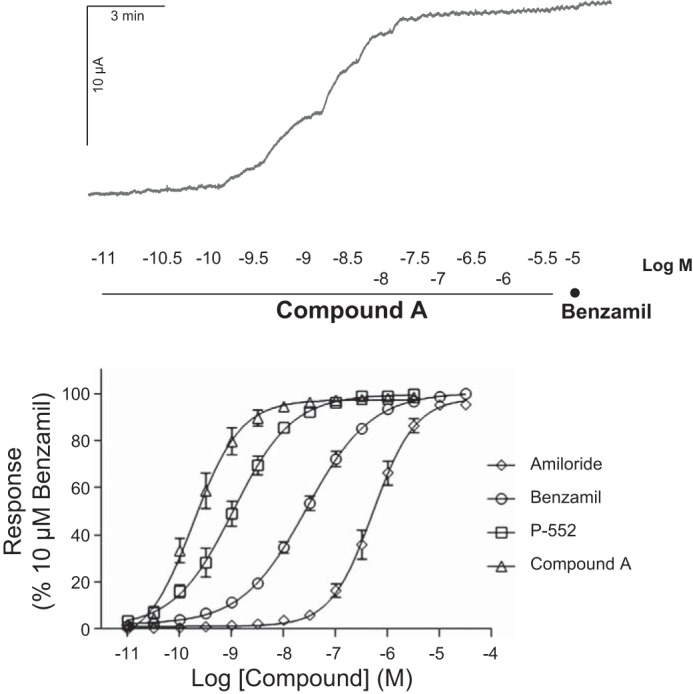
Compound A is a potent inhibitor of epithelial sodium channel (ENaC)-mediated short-circuit current (Isc). Top: representative Ussing chamber trace for Compound A vs. benzamil. Bottom: effective concentration (EC) curves for Compound A (EC50 0.177 nM, n = 8), P-552 (EC50 1.29 nM, n = 5), benzamil (EC50 21.9 nM, n = 13), and amiloride (EC50 0.454 μM, n = 2) in the Ussing chamber assay on normal human bronchial epithelial cells (HBEC) from healthy donors. Means ± SE.
Compound A Slows ASL Absorption
Despite having a submicromolar IC50 against ENaC in Ussing chambers, amiloride is essentially ineffective under thin film conditions because of its rapid removal from the ASL (37). To see whether Compound A was more effective, we tested its ability to slow ASL absorption. Because airway epithelial cultures can either absorb or secrete ASL (38), we used the absorptive mode by removing endogenous ASL and adding a bolus of test solution at 1 μM and t = 0 with the remaining volume assayed over time. Using a gravimetric method, we determined that airway hydration in HBEC cultures was significantly preserved with Compound A (66 ± 2%, n = 12) vs. vehicle (39 ± 8%, n = 30) or amiloride (28 ± 10%, n = 12) (Fig. 2).
Fig. 2.
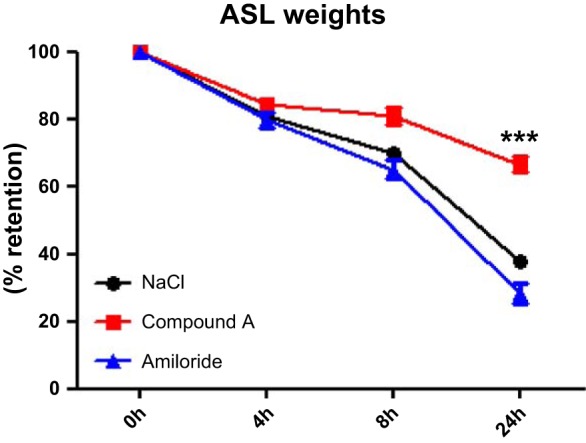
Retention of airway surface liquid (ASL) in HBECs. Airway surface hydration was determined by gravimetric methods. Vehicle (n = 30) and the short-acting ENaC inhibitor amiloride at 1 μM (n = 12) did not manage to restore the apically added volume from penetrating through the membranes, whereas Compound A at 1 μM (n = 12) significantly (***P < 0.001) retained 66% of the added volume at 24 h. Means ± SD.
XZ confocal microscopy revealed a similar pattern with the retention of ASL height being increased after Compound A that lasted over 6 h (Fig. 3, A and B). We then performed concentration responses for Compound A using data obtained 2 and 6 h after the volume challenge (Fig. 3, C and D), and potencies (IC50) were 0.018 μM and 0.052 μM, respectively.
Compound A Inhibits Guinea Pig TPD and Increases Rat and Sheep MCC Rates In Vivo
Because Compound A was efficacious in HBECs, we tested its ability to inhibit ENaC in vivo. The TPD has previously been shown to be a good measure of ENaC activity in anaesthetized guinea pigs (10) and was dose dependently inhibited by all inhibitors tested (Fig. 4) with the rank order Compound A > P-552 > benzamil (ED50 being 4.7, 15, and 30 μg/kg, respectively).
Fig. 4.
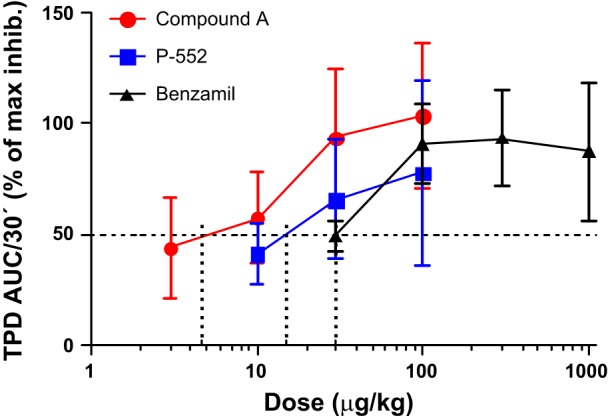
Compound A potently inhibits the trachea potential difference (TPD) in the anaesthetized guinea pig. Percent inhibition of the TPD with an ED50 of 4.7 μg/kg for Compound A (n = 11, red circles). 15 μg/kg for P-552 (n = 4, blue squares), and 30 μg/kg benzamil (n = 9, black triangles). Means ± SE. AUC, area under the curve.
Inhibition of ENaC and increases in ASL hydration are predicted to increase MCC rates (36). Therefore, we investigated whether Compound A could affect rat MCC. As predicted by our in vitro data (Figs. 1–3), Compound A increased MCC, and a maximal effect was seen at 100 μg/kg (Fig. 5). However, when MCC was investigated 2 h after administration of Compound A, the effect was absent, thus demonstrating short duration in the rat (Fig. 5).
Fig. 5.
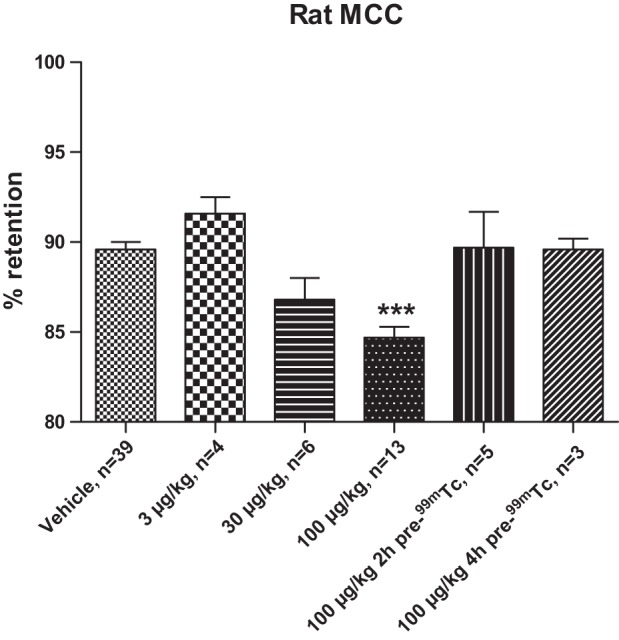
Compound A dose dependently increases mucociliary clearance (MCC) in the conscious rat. Compound A at 100 μg/kg (4th bar) demonstrates a significantly (***P < 0.001) increased MCC vs. vehicle (1st bar) as demonstrated by the lower percentage of retention of 99mTc colloids. For the dose-response evaluation, Compound A was administered just before 99mTc. For the evaluation of duration, 100 μg/kg of Compound A was administered 2 and 4 h before the 99mTc administration (denoted as pre-99mTc). The retention of colloids was in all cases evaluated 2 h after the administration of 99mTc. Means ± SE, n = 3–39.
Compound A was also administered to sheep at two separate doses (0.3 and 3 mg per animal; 7.5 and 75 μg/kg, respectively), and MCC was measured 4–5 h after dosing (Fig. 6). Under these conditions, hardly any effect was seen with 0.3 mg (1.3-fold vehicle controls). However, close to full efficacy was demonstrated at 3 mg (2.7-fold vehicle control). Plasma concentrations of drug peaked 30–60 min after dosing at 24 and 15 nM, respectively, for the two animals receiving 3 mg. The higher dose was accompanied by a tendency for effects on blood potassium levels 1–2 h after dosing (Table 1), whereas the lower dose was devoid of effects on blood electrolytes.
Fig. 6.
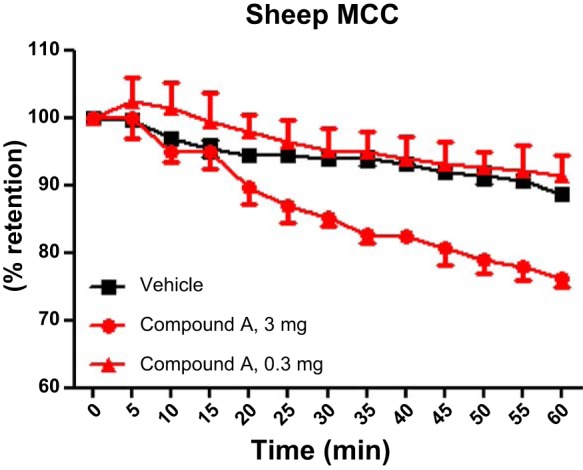
Compound A increases sheep MCC 4–5 h after dosing. Compound A was given at t = 0 h in 2 doses; 0.3 mg (red triangles) with no effect vs. vehicle (black squares) 4–5 h after dosing, whereas 3 mg (red circles) demonstrated clearly increased MCC vs. vehicle, given as percent retention of the 99mTc signal 60 min after colloid administration. Means ± SD, n = 2–3 (descriptive statistical analysis, only).
Table 1.
Average potassium and sodium blood levels from 2–3 sheep
| Vehicle, n = 3 |
Compound A, 0.3 mg, n = 2 |
Compound A, 3 mg, n = 2 |
||||||||||
|---|---|---|---|---|---|---|---|---|---|---|---|---|
| Blood K+, mM |
Blood Na+, mM |
Blood K+, mM |
Blood Na+, mM |
Blood K+, mM |
Blood Na+, mM |
|||||||
| Time Point | Mean | SD | Mean | SD | Mean | SD | Mean | SD | Mean | SD | Mean | SD |
| Predose | 4.4 | 0.7 | 152 | 10 | 4.7 | 0.0 | 149 | 4.0 | 4.3 | 0.1 | 148 | 5.6 |
| Immediate | 4.1 | 0.2 | 150 | 2.3 | 4.3 | 0.1 | 147 | 4.5 | 4.0 | 0.3 | 146 | 0.3 |
| 15 min | 4.2 | 0.3 | 146 | 1.6 | 4.1 | 0.3 | 146 | 0.3 | 4.2 | 0.3 | 145 | 0.3 |
| 30 min | 4.1 | 0.2 | 148 | 4.1 | 4.2 | 0.4 | 149 | 1.5 | 4.3 | 0.4 | 145 | 2.0 |
| 1 h | 3.8 | 0.1 | 151 | 3.5 | 3.9 | 0.3 | 146 | 2.5 | 4.8 | 0.3 | 142 | 0.1 |
| 2 h | 3.7 | 0.4 | 147 | 3.8 | 4.1 | 0.3 | 144 | 0.4 | 5.2 | 0.4 | 141 | 1.9 |
| 4 h | 4.2 | 0.3 | 147 | 3.3 | 3.6 | 0.1 | 144 | 0.1 | 4.3 | 0.5 | 140 | 0.1 |
| 6 h | 4.6 | 0.7 | 147 | 3.4 | 3.9 | 0.3 | 145 | 4.2 | 4.1 | 0.2 | 141 | 0.5 |
| 24 h | 4.9 | 0.5 | 155 | 14.1 | 5.5 | 0.0 | 152 | 4.2 | 5.4 | 0.2 | 146 | 1.7 |
Sheep after having received vehicle (diurnal rhythm of blood electrolytes) or Compound A at 0.3 mg and 3 mg (corresponding to 7.5 and 75 μg/kg) by inhalation. The higher dose indicates increased blood potassium at 1 and 2 h after dosing vs. vehicle controls (explorative statistical analysis only).
Effects on Rat Renal Electrolyte Handling During Continuous IV Infusion of Compound A
Compound A did not elicit any changes in renal electrolyte handling up to plasma concentrations of 0.7 ± 0.3 nM (equals dose 2). At this dose, there were no measurable levels of Compound A in urine. During application of dose 3, plasma concentrations of Compound A reached 8.6 ± 2.1 nM, and the urinary concentrations were 6.5 ± 3.2 nM. Under these conditions, potassium was no longer excreted into the urine (P = 0.028 for the interaction between treatment and time), and, shortly after cessation of drug infusion (washout), blood potassium levels increased relative to both previous levels and time-matched vehicle control. Values were significantly increased (P = 0.010) and interacted significantly with time (P = 0.001) (Fig. 7). Sodium concentrations in blood were not affected by Compound A, whereas there was a significant effect of Compound A on chloride blood concentrations (P = 0.019) (Table 2). Urine production was significantly increased with time for both vehicle and drug treatment (P = 0.020), with no interaction with drug and time on the excretion of sodium or chloride ions (Fig. 7). We also observed a hysteresis between plasma and urine concentration of Compound A and its effect on urinary potassium excretion and blood potassium levels, indicating the time delay of the system.
Fig. 7.

Compound A affects renal electrolyte handling at urine concentrations in the nM range. Anaesthetized rats were given Compound A in a 3-step iv infusion dose design, where each step had a duration of 30 min (bolus for 6 min + infusion for 24 min, giving a total of: 0.02–0.2–2.0 μg/kg per min * 30) or vehicle in corresponding volumes. Urinary excretion of potassium (B) is significantly (*P = 0.028) decreased as plasma and urine concentration of compound A approaches 10 nM (D), which significantly (P = 0.010) increases blood potassium levels (C), whereas urinary excretion of sodium (A) is not significantly altered. Means ± SD, n = 6.
Table 2.
Compound A demonstrated significant effects on renal potassium handling
| Treatment | Baseline 1 | Baseline 2 | Dose 1 | Dose 2 | Dose 3 | WO 0–20′ | WO 20–40′ | WO 40–60′ | |
|---|---|---|---|---|---|---|---|---|---|
| Blood Na+, mM | Vehicle | 137 ± 1 | 138 ± 1 | 138 ± 2 | 138 ± 2 | 138 ± 2 | 138 ± 1 | 137 ± 2 | |
| Blood Na+, mM | Cmpd A | 138 ± 1 | 139 ± 2 | 139 ± 2 | 138 ± 3 | 137 ± 2 | 137 ± 1 | 137 ± 2 | |
| Blood K+, mM | Vehicle | 4.2 ± 0.2 | 4.1 ± 0.3 | 4.1 ± 0.4 | 3.9 ± 0.2 | 3.9 ± 0.2 | 3.8 ± 0.2 | 3.9 ± 0.2 | |
| Blood K+, mM | Cmpd A* | 4.0 ± 0.3 | 3.9 ± 0.2 | 3.9 ± 0.4 | 3.9 ± 0.4 | 4.3 ± 0.3 | 4.3 ± 0.2 | 4.3 ± 0.4 | |
| Blood Cl−, mM | Vehicle | 102 ± 1 | 103 ± 0 | 104 ± 2 | 103 ± 2 | 104 ± 2 | 103 ± 2 | 103 ± 2 | |
| Blood Cl−, mM | Cmpd A | 103 ± 3 | 103 ± 3 | 104 ± 3 | 104 ± 5 | 105 ± 2 | 104 ± 2 | 106 ± 4 | |
| Plasma concentration, nM | Cmpd A | 0.7 ± 0.3 | 8.6 ± 2.1 | 0.6 ± 0.3 | 0.3 | 0.3 | |||
| UNaV, μmol/20′ | Vehicle | 20 ± 14 | 20 ± 13 | 38 ± 50 | 54 ± 51 | 84 ± 36 | 93 ± 16 | 114 ± 21 | 108 ± 74 |
| UNaV, μmol/20′ | Cmpd A | 27 ± 10 | 31 ± 26 | 53 ± 43 | 97 ± 68 | 180 ± 119 | 194 ± 131 | 184 ± 90 | 172 ± 37 |
| UKV, μmol/20′ | Vehicle | 27 ± 14 | 26 ± 17 | 24 ± 12 | 27 ± 22 | 36 ± 21 | 31 ± 12 | 31 ± 11 | 24 ± 11 |
| UKV, μmol/20′ | Cmpd A† | 45 ± 15 | 35 ± 10 | 43 ± 20 | 34 ± 18 | 9.6 ± 9.3 | 3.0 ± 3.6 | 3.9 ± 5.2 | 3.8 ± 4.5 |
| UClV, μmol/20′ | Vehicle | 44 ± 28 | 46 ± 29 | 58 ± 37 | 75 ± 44 | 115 ± 27 | 115 ± 22 | 136 ± 30 | 123 ± 66 |
| UClV, μmol/20′ | Cmpd A | 65 ± 22 | 58 ± 27 | 83 ± 22 | 112 ± 37 | 154 ± 99 | 163 ± 119 | 154 ± 75 | 153 ± 40 |
| UV, μl/20′ | Vehicle | 125 ± 23 | 124 ± 23 | 167 ± 52 | 226 ± 45 | 370 ± 44 | 526 ± 115 | 593 ± 96 | 488 ± 139 |
| UV, μl/20′ | Cmpd A | 176 ± 45 | 157 ± 80 | 228 ± 58 | 516 ± 464 | 607 ± 498 | 782 ± 653 | 906 ± 721 | 662 ± 319 |
| Urine concentration, nM | Cmpd A | 6.5 ± 3.2 | 10.3 ± 7.9 | 11.8 ± 6.4 | 7.6 ± 4.8 |
Values are means ± SD, n = 6. Compound A (Cmpd A) demonstrated significant effects on renal potassium handling at plasma concentrations (Cp) approaching 10 nM in the anaesthetized rat, i.e., below Cp after full efficacy on mucociliary clearance in sheep. The effect of Compound A on blood potassium was significantly increased and interacted with time (*P = 0.010) because of the decreased urinary excretion of potassium (†P = 0.028).
UNaV, urinary sodium excretion; UKV, urinary potassium excretion; UClV, urinary chloride excretion; UV, urine excretion; WO, washout.
Compound A Increases ASL Rehydration and Restores Ciliary Beating in Cigarette-Smoke-Exposed HBECs
COPD is typically caused by chronic tobacco inhalation, and mucus dehydration is one of the symptoms of this disease (19, 27). Thus, as a first step toward testing whether Compound A can rehydrate ASL in airways of smokers/patients with COPD, we pretreated HBECs with vehicle or Compound A, amiloride, or benzamil and then exposed them to CS. It is important to note that, for these experiments, we removed excess solution from the mucosal surface (see materials and methods) so as to start all treatments with an ASL of ∼7 μm, which gives a balance between absorption and secretion, unlike how adding a bolus of test solution causes absorption to predominate (38). Under these conditions, CS causes a rapid decline in ASL height attributable to CS-mediated internalization of CFTR and/or a direct effect of acrolein on CFTR open probability (9, 29, 28). Compound A alone did not alter ASL height, as there was no excess fluid to absorb (Fig. 8, A and B). Following CS exposure, ASL height rapidly and significantly decreased in the vehicle-exposed group. Importantly, a 2.5-h preincubation with 1 μM Compound A completely prevented the CS-induced decrease in ASL height (Fig. 8, A and C). In contrast, amiloride and benzamil were less effective at blocking the CS-induced ASL diminution (Figs. 10 and 11). To examine the functional consequences of dehydration by CS, we measured HBEC CBF with or without Compound A pretreatment. In vehicle-treated cultures, CBF was significantly decreased, whereas Compound A completely prevented this (Fig. 8, D–F).
Fig. 10.
Benzamil, but not amiloride, pretreatment prevents CS-induced ASL volume depletion. ASL height was measured by XZ confocal microscopy over time in air and CS-exposed HBECs with either amiloride, benzamil, or vehicle (PBS) pretreatment as indicated. A and B: mean ASL height over time when cultures were predosed with 10 μM of either amiloride, benzamil, or vehicle for 2 h followed by air or CS, respectively. All n = 6. Red, benzamil; blue, amiloride; black, vehicle. Data shown as means ± SE. *P < 0.05 different ± CS exposure for any given drug treatment; †P < 0.05 different to CS exposure at any given time point.
Fig. 11.
Benzamil, but not amiloride, increases ASL volume recovery after CS exposure. ASL height was measured by XZ confocal microscopy with time before and after air and CS-exposure in HBECs. 30 min after air or CS, either amiloride, benzamil, or vehicle (perfluorocarbon) was added as indicated. A and B: mean ASL height over time following air or CS and then amiloride, benzamil, or vehicle. All n = 6. Red, benzamil; blue, amiloride; black, vehicle. Data shown as means ± SE. *P < 0.05 different ± CS exposure for any given drug treatment; †P < 0.05 different to CS exposure at any given time point.
Because patients with COPD will typically use drugs such as Compound A after lung disease is manifest, rather than prophylactically, we next tested whether Compound A was capable of speeding up ASL rehydration after CS exposure. This was investigated by adding Compound A as a dry powder in perfluorocarbon 30 min after CS-induced ASL diminution vs. air controls (37). Whereas Compound A had no effect on ASL height when added after air exposure, we found that ASL height returned to normal levels significantly more quickly when Compound A was added compared with the control (Fig. 9, A and B). Again, amiloride and benzamil were less effective at inducing ASL rehydration (Figs. 10 and 11).
DISCUSSION
In the present study, we have demonstrated that ENaC inhibition increases airway hydration and prevents CS-induced ASL height depletion, and the concomitant decreased CBF in vitro. Furthermore, we found that the increased ASL height and airway hydration manifest as increased MCC in vivo. These data suggest that ENaC inhibition may be efficacious in the restoration of mucus hydration and mucus transport in chronic bronchitis.
An ENaC inhibitor alters the transmembrane potential, as the natural flux of the positively charged sodium ion is hindered from crossing the apical plasma membrane. Using Ussing chambers, we identified Compound A as a potent (IC50 0.177 nM) and selective inhibitor of ENaC (Fig. 1) and consequently used it as a tool compound through all models described to link in vitro and in vivo efficacy with the physiochemically same properties. Also, the effects of benzamil and Compound A on Isc were not additive, suggesting that they both inhibited the same pathway. We also measured Compound A activity in vivo in the TPD model in anaesthetized guinea pigs. The efficacy of inhibitors is commonly measured using these two experimental procedures, and compounds are then compared with regard to potency and efficacy. However, electrophysiological data do not always translate into changes in airway hydration and MCC; electrophysiological approaches usually isolate a single species of channel and override cellular driving forces (39). In contrast, ASL hydration needs not only the target channel, but also ionic driving forces and water permeability to be acting in concert. Thus the potency of an ENaC inhibitor is only one feature of its physiochemical properties, and the likelihood that it will be efficacious in airway hydration and clearing mucus is subject to additional factors, including the residence time of the drug in the airway lumen. Thus optimization of compounds by looking only at the potency can be misleading. However, using two independent methods of measuring ASL volume and height, we also found that Compound A was efficacious and had a good duration of action under thin film conditions (Figs. 2 and 3) with an IC50 of 0.052 μM. The discrepancy between the in vitro potencies can be explained by the fact that the Ussing chamber assay is a target engagement read out in a closed system, whereas the ASL height measures are functional. Also, the mass of drug applied under thin film conditions is vastly lower than the mass used in the Ussing chambers attributable to the big difference in volume, and, under thin-film conditions, the epithelia are capable of sequestering or removing compounds (40). Although this phenomenon is sometimes overlooked in preclinical development, it represents the situation that is mostly seen in the lung and may explain why amiloride had little effect on MCC in humans (26).
In the present TPD study (modified from Ref. 10), we chose to look at the online responses of the compounds with the ability to follow the effect after an intratracheal bolus dose, giving a sense of the duration of effect of the compounds and ability to get both potency and efficacy in the same experiment. The ED50 for Compound A in the guinea pig TPD model was ∼5 μg/kg. Using MCC as the readout, full efficacy was observed in rats at 100 μg/kg and in sheep at 75 μg/kg. It was also noted that the duration of efficacy of Compound A was shorter in rats compared with sheep. Taken together, these data indicate that ENaC needs to be completely inhibited to get full enhancement of MCC in the healthy animal. Furthermore, complete inhibition alone is not sufficient to positively impact on mucus clearance rates, and any useful compound must stay in the ASL compartment for extended periods [see amiloride both preclinically and clinically (20) and Figs. 10 and 11]. Whether one needs to fully restore MCC to normal levels, or whether any partial increase in MCC [reduced for patients with both CF and severe COPD (30, 41)], needs to be explored in the appropriate patient group(s) once this class of compounds is in clinical development.
The ovine model of MCC is to date the most commonly used preclinical model to estimate efficacy and duration of drugs with different mechanisms of action on MCC (1). However, these sheep are healthy, and data may only be translatable to humans with normal MCC and normal airway homeostasis. How this model translates to the diseased state in COPD or CF remains to be demonstrated. To mimic the diseased status of CF or COPD, neutrophil elastase can be given to induce reduction of MCC in the sheep model via its inhibitory mechanism on ENaC (33). However, this is still an animal model rather than the disease per se and does not necessarily translate into the effect by ENaC inhibitors in COPD or CF. CF piglets have recently been developed that can be used in the preclinical and pharmacological evaluation of MCC (34), but the downside of this model is that the animals get very sick within 24 h postpartum because of its intestinal phenotype of CF, despite attempts to correct the gut phenotype.
It is well known that an apical ENaC inhibitor for the treatment of respiratory diseases needs to exhibit minimal exposure in the distal tubuli in the kidneys to avoid local ENaC inhibition and alterations in renal electrolyte handling (2, 25). Compound A demonstrates a tendency to increase blood potassium levels 1–2 h after a therapeutic dose in sheep and has an effect on the rat renal handling of potassium at nanomolar exposures in both plasma and urine, clearly indicating the unsuited therapeutic properties of this drug. However, it is still useful as a tool compound because of its selectivity and efficacy. The fate of GS-9411 was similar; despite unmeasurable levels of the parent compound in urine, metabolites caused alterations in renal electrolyte handling, and investigation was stopped in phase 1 (25). Recent data from O'Riordon et al. (24) demonstrated no effect on electrolyte homeostasis by the follow-up compound, GS-5737, in a phase 1 safety and pharmacokinetic study at doses 10-fold of what produced a maximal effect on MCC in healthy sheep, suggesting that safe ENaC antagonists can be developed.
The present study demonstrates that a potent and selective ENaC inhibitor with a long duration of action can indeed increase ASL height and airway hydration in a dose-dependent manner in an in vitro culture setting for more than 6 h (Figs. 2 and 3). In contrast, short-acting ENaC antagonists such as amiloride are largely without effect under thin film conditions despite being efficacious in Ussing chambers (Figs. 1, 10, and 11). With regard to the gravimetric methods, the change here largely reflects the meniscus, which because of hydrostatic interactions with the plastic cell culture insert wall, is absorbed much more slowly, as described by Harvey et al. (14). As demonstrated in the present study and previously (9), acute CS induces a rapid decrease in ASL height because of removal of CFTR from the epithelial surface. Pretreatment with the concentration of Compound A that produced a maximal response on ASL height (1 μM) prevented CS-induced ASL dehydration by keeping ENaC antagonized and thus preventing abnormal homeostasis of ASL volume. After CS exposure, ENaC continues to function (9), and our data suggest that ENaC drives the actual decline in ASL volume when CFTR is no longer present to balance absorption with secretion (Fig. 8). Our findings indicate that an ENaC inhibitor would indeed prevent the dehydration caused by smoking and thus has the potential to be efficacious in the treatment of smoke-induced chronic bronchitis. Furthermore, the ENaC inhibitor was able to restore ASL height within 30 min after addition of Compound A compared with the 4 h that ASL recovery would normally take after CS exposure (9). To see whether pretreatment with compound A and protection against the CS-induced ASL dehydration would have additional functional consequences, we measured the HBEC CBF after CS exposure with or without Compound A in the periciliary liquid. The CBF at an ASL height of 7–8 μm was ∼5 Hz and decreased to <4 Hz following CS-induced ASL dehydration, indicating the necessity for appropriate ASL hydration in ciliary beating. However, in this study, we did not see differences of statistical significance.
In conclusion, Compound A demonstrated significant effects on tracheal potential difference as well as MCC in both rats and sheep, demonstrating a link between increased airway hydration, ciliary function, and MCC. These data support the hypothesis that ENaC inhibition may be efficacious in the restoration of mucus hydration and mucus transport in patients with chronic bronchitis. ENaC inhibition prevents CS-induced ASL dehydration and the decrease in CBF as demonstrated by the use of this potent, selective, and long-lasting ENaC inhibitor (Compound A). Furthermore, ASL height restoration after CS was also significantly more rapid when Compound A was given after the CS-induced ASL depletion. Our data suggest that ENaC inhibition may be efficacious in the restoration of mucus hydration and mucus transport in chronic bronchitis and support further study of ENaC inhibitors in this patient population.
GRANTS
This work was supported by a research grant from AstraZeneca, by NIH PPG P01 HL034322, and by R01 HL108927 (R. Tarran and A. Garland).
DISCLOSURES
No conflicts of interest, financial or otherwise, are declared by the authors.
AUTHOR CONTRIBUTIONS
A.B.Å., M.H., J.R., J.P., E.J., A.L.G., and R.T. conception and design of research; A.B.Å., J.R., C.W., J.P., E.J., A.L.G., and A.G. performed experiments; A.B.Å., J.R., C.W., E.J., A.L.G., A.G., and R.T. analyzed data; A.B.Å., C.W., E.J., and R.T. interpreted results of experiments; A.B.Å., J.R., C.W., and R.T. prepared figures; A.B.Å. and R.T. drafted manuscript; A.B.Å., M.H., J.R., C.W., J.P., E.J., and R.T. edited and revised manuscript; A.B.Å., M.H., J.R., C.W., J.P., E.J., A.L.G., and R.T. approved final version of manuscript.
ACKNOWLEDGMENTS
The help of the UNC CF Center Tissue Core in providing cells is gratefully acknowledged. We also thank all the people in the ENaC project team and RIA community that have contributed to the overall captured knowledge over the years but especially highlight the statistical evaluation performed by the biostatistician, Sofia Tapani.
REFERENCES
- 1.Abraham WM. Modeling of asthma, COPD and cystic fibrosis in sheep. Pulm Pharmacol Ther 21: 743–754, 2008. [DOI] [PubMed] [Google Scholar]
- 2.App EM, King M, Helfesrieder R, Kohler D, Matthys H. Acute and long-term amiloride inhalation in cystic fibrosis lung disease. A rational approach to cystic fibrosis therapy. Am Rev Respir Dis 141: 605–612, 1990. [DOI] [PubMed] [Google Scholar]
- 3.Ballard ST, Spadafora D. Fluid secretion by submucosal glands of the tracheobronchial airways. Respir Physiol Neurobiol 159: 271–277, 2007. [DOI] [PMC free article] [PubMed] [Google Scholar]
- 4.Bartlett JA, Fischer AJ, McCray PB Jr.. Innate immune functions of the airway epithelium. Contrib Microbiol 15: 147–163, 2008. [DOI] [PubMed] [Google Scholar]
- 5.Boucher RC. Regulation of airway surface liquid volume by human airway epithelia. Pflügers Arch 445: 495–498, 2003. [DOI] [PubMed] [Google Scholar]
- 6.Caldwell RA, Boucher RC, Stutts MJ. Neutrophil elastase activates near-silent epithelial Na+ channels and increases airway epithelial Na+ transport. Am J Physiol Lung Cell Mol Physiol 288: L813–L819, 2005. [DOI] [PubMed] [Google Scholar]
- 7.Chmiel JF, Davis PB. State of the art: why do the lungs of patients with cystic fibrosis become infected and why can't they clear the infection? Respir Res 4: 8, 2003. [DOI] [PMC free article] [PubMed] [Google Scholar]
- 8.Clunes LA, Bridges A, Alexis N, Tarran R. In vivo versus in vitro airway surface liquid nicotine levels following cigarette smoke exposure. J Anal Toxicol 32: 201–207, 2008. [DOI] [PMC free article] [PubMed] [Google Scholar]
- 9.Clunes LA, Davies CM, Coakley RD, Aleksandrov AA, Henderson AG, Zeman KL, Worthington EN, Gentzsch M, Kreda SM, Cholon D, Bennett WD, Riordan JR, Boucher RC, Tarran R. Cigarette smoke exposure induces CFTR internalization and insolubility, leading to airway surface liquid dehydration. FASEB J 26: 533–545, 2012. [DOI] [PMC free article] [PubMed] [Google Scholar]
- 10.Coote KJ, Atherton H, Young A, Sugar R, Burrows R, Smith NJ, Schlaeppi JM, Groot-Kormelink PJ, Gosling M, Danahay H. The guinea-pig tracheal potential difference as an in vivo model for the study of epithelial sodium channel function in the airways. Br J Pharmacol 155: 1025–1033, 2008. [DOI] [PMC free article] [PubMed] [Google Scholar]
- 11.Crystal RG, Randell SH, Engelhardt JF, Voynow J, Sunday ME. Airway epithelial cells: current concepts and challenges. Proc Am Thorac Soc 5: 772–777, 2008. [DOI] [PMC free article] [PubMed] [Google Scholar]
- 12.Danahay H, Jackson AD. Epithelial mucus-hypersecretion and respiratory disease. Curr Drug Targets Inflamm Allergy 4: 651–664, 2005. [DOI] [PubMed] [Google Scholar]
- 13.Ganz T. Antimicrobial polypeptides. J Leukoc Biol 75: 34–38, 2004. [DOI] [PubMed] [Google Scholar]
- 14.Harvey PR, Tarran R, Garoff S, Myerburg MM. Measurement of the airway surface liquid volume with simple light refraction microscopy. Am J Respir Cell Mol Biol 45: 592–599, 2011. [DOI] [PMC free article] [PubMed] [Google Scholar]
- 15.Hill AT, Campbell EJ, Hill SL, Bayley DL, Stockley RA. Association between airway bacterial load and markers of airway inflammation in patients with stable chronic bronchitis. Am J Med 109: 288–295, 2000. [DOI] [PubMed] [Google Scholar]
- 16.Hirsh AJ. Altering airway surface liquid volume: Inhalation therapy with amiloride and hyperosmotic agents. Adv Drug Deliv Rev 54: 1445–1462, 2002. [DOI] [PubMed] [Google Scholar]
- 17.Hirsh AJ, Zhang J, Zamurs A, Fleegle J, Thelin WR, Caldwell RA, Sabater JR, Abraham WM, Donowitz M, Cha B, Johnson KB, St George JA, Johnson MR, Boucher RC. Pharmacological properties of N-(3,5-diamino-6-chloropyrazine-2-carbonyl)-N′-4-[4-(2,3-dihydroxypropoxy) phenyl]butyl-guanidine methanesulfonate (552–02), a novel epithelial sodium channel blocker with potential clinical efficacy for cystic fibrosis lung disease. J Pharmacol Exp Ther 325: 77–88, 2008. [DOI] [PubMed] [Google Scholar]
- 18.Hobbs CA, Da Tan C, Tarran R. Does epithelial sodium channel hyperactivity contribute to cystic fibrosis lung disease? J Physiol 591: 4377–4387, 2013. [DOI] [PMC free article] [PubMed] [Google Scholar]
- 19.Hogg JC, Timens W. The pathology of chronic obstructive pulmonary disease. Annu Rev Pathol 4: 435–459, 2009. [DOI] [PubMed] [Google Scholar]
- 20.Houtmeyers E, Gosselink R, Gayan-Ramirez G, Decramer M. Effects of drugs on mucus clearance. Eur Respir J 14: 452–467, 1999. [DOI] [PubMed] [Google Scholar]
- 21.Jeunemaitre X, Bassilana F, Persu A, Dumont C, Champigny G, Lazdunski M, Corvol P, Barbry P. Genotype-phenotype analysis of a newly discovered family with Liddle's syndrome. J Hypertens 15: 1091–1100, 1997. [DOI] [PubMed] [Google Scholar]
- 22.Knowles MR, Boucher RC. Mucus clearance as a primary innate defense mechanism for mammalian airways. J Clin Invest 109: 571–577, 2002. [DOI] [PMC free article] [PubMed] [Google Scholar]
- 23.Lifton RP. Genetic determinants of human hypertension. Proc Natl Acad Sci USA 92: 8545–8551, 1995. [DOI] [PMC free article] [PubMed] [Google Scholar]
- 24.O'Riordan TG, Bresnik M, Phillips G, Donn KH, Zhou H, Xin Y, Ramanathan S, Johnson MR, Warnock DG. GS-5737, a novel epithelial sodium channel (ENaC) inhibitor: Results of a phase I safety and pharmacokinetic (PK) study. Pediatr Pulmonol 48: 236, 2013.22550062 [Google Scholar]
- 25.O'Riordan TG, Donn KH, Hodsman P, Ansede JH, Newcomb T, Lewis SA, Flitter WD, White VS, Johnson MR, Montgomery AB, Warnock DG, Boucher RC. Acute hyperkalemia associated with inhalation of a potent ENaC antagonist: Phase 1 trial of GS-9411. J Aerosol Med Pulm Drug Deliv 27: 200–208, 2014. [DOI] [PubMed] [Google Scholar]
- 26.Olivier KN, Bennett WD, Hohneker KW, Zeman KL, Edwards LJ, Boucher RC, Knowles MR. Acute safety and effects on mucociliary clearance of aerosolized uridine 5′-triphosphate +/− amiloride in normal human adults. Am J Respir Crit Care Med 154: 217–223, 1996. [DOI] [PubMed] [Google Scholar]
- 27.Rab A, Rowe SM, Raju SV, Bebok Z, Matalon S, Collawn JF. Cigarette smoke and CFTR: implications in the pathogenesis of COPD. Am J Physiol Lung Cell Mol Physiol 305: L530–L541, 2013. [DOI] [PMC free article] [PubMed] [Google Scholar]
- 28.Raju SV, Jackson PL, Courville CA, McNicholas CM, Sloane PA, Sabbatini G, Tidwell S, Tang LP, Liu B, Fortenberry JA, Jones CW, Boydston JA, Clancy JP, Bowen LE, Accurso FJ, Blalock JE, Dransfield MT, Rowe SM. Cigarette smoke induces systemic defects in cystic fibrosis transmembrane conductance regulator function. Am J Respir Crit Care Med 188: 1321–1330, 2013. [DOI] [PMC free article] [PubMed] [Google Scholar]
- 29.Rasmussen JE, Sheridan JT, Polk W, Davies CM, Tarran R. Cigarette smoke-induced Ca2+ release leads to cystic fibrosis transmembrane conductance regulator (CFTR) dysfunction. J Biol Chem 289: 7671–7681, 2014. [DOI] [PMC free article] [PubMed] [Google Scholar]
- 30.Robinson M, Bye PT. Mucociliary clearance in cystic fibrosis. Pediatr Pulmonol 33: 293–306, 2002. [DOI] [PubMed] [Google Scholar]
- 31.Rossier BC, Pradervand S, Schild L, Hummler E. Epithelial sodium channel and the control of sodium balance: Interaction between genetic and environmental factors. Annu Rev Physiol 64: 877–897, 2002. [DOI] [PubMed] [Google Scholar]
- 32.Rubin BK, Ramirez O, Zayas JG, Finegan B, King M. Respiratory mucus from asymptomatic smokers is better hydrated and more easily cleared by mucociliary action. Am Rev Respir Dis 145: 545–547, 1992. [DOI] [PubMed] [Google Scholar]
- 33.Sabater JR, Lee TA, Abraham WM. Comparative effects of salmeterol, albuterol, and ipratropium on normal and impaired mucociliary function in sheep. Chest 128: 3743–3749, 2005. [DOI] [PubMed] [Google Scholar]
- 34.Stoltz DA, Meyerholz DK, Pezzulo AA, Ramachandran S, Rogan MP, Davis GJ, Hanfland RA, Wohlford-Lenane C, Dohrn CL, Bartlett JA, Nelson GA 4th, Chang EH, Taft PJ, Ludwig PS, Estin M, Hornick EE, Launspach JL, Samuel M, Rokhlina T, Karp PH, Ostedgaard LS, Uc A, Starner TD, Horswill AR, Brogden KA, Prather RS, Richter SS, Shilyansky J, McCray PB Jr, Zabner J, Welsh MJ. Cystic fibrosis pigs develop lung disease and exhibit defective bacterial eradication at birth. Sci Transl Med 2: 29ra31, 2010. [DOI] [PMC free article] [PubMed] [Google Scholar]
- 35.Tarran R, Button B, Boucher RC. Regulation of normal and cystic fibrosis airway surface liquid volume by phasic shear stress. Annu Rev Physiol 68: 543–561, 2006. [DOI] [PubMed] [Google Scholar]
- 36.Tarran R, Grubb BR, Gatzy JT, Davis CW, Boucher RC. The relative roles of passive surface forces and active ion transport in the modulation of airway surface liquid volume and composition. J Gen Physiol 118: 223–236, 2001. [DOI] [PMC free article] [PubMed] [Google Scholar]
- 37.Tarran R, Grubb BR, Parsons D, Picher M, Hirsh AJ, Davis CW, Boucher RC. The CF salt controversy: In vivo observations and therapeutic approaches. Mol Cell 8: 149–158, 2001. [DOI] [PubMed] [Google Scholar]
- 38.Tarran R, Trout L, Donaldson SH, Boucher RC. Soluble mediators, not cilia, determine airway surface liquid volume in normal and cystic fibrosis superficial airway epithelia. J Gen Physiol 127: 591–604, 2006. [DOI] [PMC free article] [PubMed] [Google Scholar]
- 39.Tessier GJ, Traynor TR, Kannan MS, O'Grady SM. Mechanisms of sodium and chloride transport across equine tracheal epithelium. Am J Physiol Lung Cell Mol Physiol 259: L459–L467, 1990. [DOI] [PubMed] [Google Scholar]
- 40.Tyrrell J, Tarran R. Gaining the upper hand on pulmonary drug delivery. J Pharmacovigil 2: 118, 2014. [DOI] [PMC free article] [PubMed] [Google Scholar]
- 41.Voynow JA, Rubin BK. Mucins, mucus, sputum. Chest 135: 505–512, 2009. [DOI] [PubMed] [Google Scholar]
- 42.Watson MJ, Worthington EN, Clunes LA, Rasmussen JE, Jones L, Tarran R. Defective adenosine-stimulated cAMP production in cystic fibrosis airway epithelia: A novel role for CFTR in cell signaling. FASEB J 25: 2996–3003, 2011. [DOI] [PMC free article] [PubMed] [Google Scholar]
- 43.Widdicombe JH. Regulation of the depth and composition of airway surface liquid. J Anat 201: 313–318, 2002. [DOI] [PMC free article] [PubMed] [Google Scholar]
- 44.Wine JJ, Joo NS. Submucosal glands and airway defense. Proc Am Thorac Soc 1: 47–53, 2004. [DOI] [PubMed] [Google Scholar]
- 45.Worthington EN, Tarran R. Methods for ASL measurements and mucus transport rates in cell cultures. Methods Mol Biol 742: 77–92, 2011. [DOI] [PubMed] [Google Scholar]
- 46.Zhou Z, Treis D, Schubert SC, Harm M, Schatterny J, Hirtz S, Duerr J, Boucher RC, Mall MA. Preventive but not late amiloride therapy reduces morbidity and mortality of lung disease in betaENaC-overexpressing mice. Am J Respir Crit Care Med 178: 1245–1256, 2008. [DOI] [PubMed] [Google Scholar]