

We take a data-driven approach to predicting which inpatients are most likely to test positive for pathogenic Clostridium difficile (C. difficile). Using EMR data from 69,568 admissions, we develop and validate a risk-stratification model, based on over 10,000 variables.
Keywords: Clostridium difficile, data-driven methods, electronic medical records, machine learning, risk stratification
Abstract
Background
Although many risk factors are well known, Clostridium difficile infection (CDI) continues to be a significant problem throughout the world. The purpose of this study was to develop and validate a data-driven, hospital-specific risk stratification procedure for estimating the probability that an inpatient will test positive for C difficile.
Methods
We consider electronic medical record (EMR) data from patients admitted for ≥24 hours to a large urban hospital in the U.S. between April 2011 and April 2013. Predictive models were constructed using L2-regularized logistic regression and data from the first year. The number of observational variables considered varied from a small set of well known risk factors readily available to a physician to over 10 000 variables automatically extracted from the EMR. Each model was evaluated on holdout admission data from the following year. A total of 34 846 admissions with 372 cases of CDI was used to train the model.
Results
Applied to the separate validation set of 34 722 admissions with 355 cases of CDI, the model that made use of the additional EMR data yielded an area under the receiver operating characteristic curve (AUROC) of 0.81 (95% confidence interval [CI], .79–.83), and it significantly outperformed the model that considered only the small set of known clinical risk factors, AUROC of 0.71 (95% CI, .69–.75).
Conclusions
Automated risk stratification of patients based on the contents of their EMRs can be used to accurately identify a high-risk population of patients. The proposed method holds promise for enabling the selective allocation of interventions aimed at reducing the rate of CDI.
Although many risk factors are well known (eg, healthcare-associated exposure, age, underlying disease, use of antimicrobial agents, etc), Clostridium difficile infection (CDI) continues to be a significant problem throughout the world. Despite much effort, CDI rates in the United States have increased in recent years [1]. In the United States, from 1996 to 2009, CDI rates for hospitalized patients ages ≥65 years increased by 200% [2]. Beyond causing significant morbidity and mortality, each case of CDI is associated with the addition of several thousand dollars in hospital costs for primary infections and tens of thousands of dollars per case for recurrent infections [3]. A conservative estimate of the financial burden of CDI in the United States is $1.1 billion annually [4]. Costs stem in part from (1) the lack of cost-effective proactive interventions and (2) the lack of means for focusing such interventions based on risk [5].
In this study, we consider the challenge of building a clinical tool for predicting the risk of inpatients testing positive for pathogenic C difficile during a hospital admission. We explore the development of hospital-specific risk stratification based on data that are readily drawn from local electronic health records. This process allows for straightforward integration into the health information system and the automatic calculation of patient risk.
In contrast to previous risk stratification models for CDI, we do not limit ourselves to the set of known risk factors but consider over 10 000 variables automatically extracted from the electronic medical record (EMR). Using machine learning techniques, we develop the model on admissions from a single year and validate the model on a holdout set of admissions from the following year. The holdout set consists of cases that are withheld from the process used to construct the predictive model. We compare our proposed model with one based on a small set of known risk variables.
We show that the addition of information not usually considered can lead to a significant improvement in discrimination performance compared with a model based on a small set of known risk variables. Although building and using such data-driven models may seem more complex than using a simple rule, we argue that the accuracy and hospital specificity makes them more appropriate. Moreover, the growing ubiquity of electronic health systems provides the necessary infrastructure to automate data-driven risk methods, making them easy to construct and use.
METHODS
Data
The data for this retrospective cohort study came from the electronic databases of a large urban hospital in the U.S. All patients admitted on or after April 12, 2011 and discharged on or before April 12, 2013 were initially considered. Patients <18 years of age, patients with a length of stay (LOS) <24 hours, and patients with a positive test for C difficile within 24 h of admission were excluded from the analysis. Clostridium difficile infection cases were identified using the hospital's laboratory database. Admissions in which patients had at least 1 positive result for toxigenic C difficile were identified. During the study period, the testing protocol used by the hospital consisted of a DNA amplification assay (illumigene C difficile) for the direct detection of C difficile toxins A and B in unformed stool.
We define the risk period of a patient as the time from admission to the time of a positive test result or to discharge if the patient never tests positive. In our study population, all patients have a risk period greater than 24 hours. The Institutional Review Board of the Office of Research Integrity of the MedStar Health Research Institute approved the statistical analysis of retrospective medical records.
Feature Extraction
For each admission in our study population, we extracted 2 sets of variables from the hospital database:
Curated Variables: known clinical risk factors for C difficile drawn from the literature, and readily available to physicians within 24 hours of admission [6–20].
EMR Data: all structured patient data that can be automatically extracted from the EMR within 24 hours of admission.
These 2 sets of variables are described in detail in the next section. The first set of variables, selected by a team of collaborating physicians, represents well known risk factors for C difficile. We restricted this set to variables typically available to physicians, eg, we do not consider colonization pressure, which requires information on patient locations to calculate unit-wide and hospital-wide rates of infection with C difficile (see Supplementary Supporting Information). The second set of variables is a much larger set, consisting of structured data that are easily derived in a fully automated manner from the EMR, including colonization pressure. Most of the variables or features we considered were categorical (discrete) and several were continuous. We discretized the continuous data and mapped all data to binary variables.
Learning to Predict Risk
We sought to predict in advance which patients would test positive for C difficile during the current hospitalization. We chose to make a single prediction for each patient as in reference [2]. We made the prediction 24 hours after admission to leverage the entries made to the EMR shortly after admission.
After feature extraction, our dataset consisted of patient admissions represented by feature vectors, labeled either positive or negative depending on whether the patient tested positive for C difficile during the current admission. Given the labeled data, we sought a function that maps a set of observations about a patient to a scalar value in [0, 1] (ie, a probability). This function was learned on training data from the first year using logistic regression, a computationally efficient method for linear classification. Solving for the regression coefficients, ie, feature weights, is an optimization problem (see Supplementary Supporting Information for more detail). To improve generalizability to unseen future patient cases, we used L2-regularized logistic regression [21]. The solution to the optimization problem depends on the data used in training. We considered 3 different models: 1 based on the small set of curated risk factors and 2 others that included the longer list of variables extracted automatically from the EMR. Under Results, we compare the performance of the 3 models.
Model Evaluation
To measure the performance of the models, we applied each model in turn to a set of holdout data from the following year. Validation on a holdout dataset is important when working with a large number of risk variables, because it becomes easier to overfit to the training set with increasing numbers of variables being considered, which can produce deceptively good results. Furthermore, dividing the data temporally (rather than randomly) into a training and validation set mimics how we expect the predictive model learned from historical data to perform in the risk stratification of future patients. Recent hospitalizations are likely to be more similar to the cases that we will see in the future.
Each models' ability to discriminate low-risk from high-risk patients was measured using the area under the receiver operating characteristic curve (AUROC) [21]. The 95% confidence interval was calculated using 100 bootstrap samples (sampling with replacement) of the validation set [22]. To further quantify each model's ability to risk stratify the patients in the validation set, we measured the calibration of both models, capturing how closely predicted risk matched actual risk [23]. We sorted the test patients by their predictions and grouped them by deciles. For each group, we calculated the median predicted probability of risk and the actual probability of risk (for each of the 100 bootstrap samples). We also compared the performance of the models using the Net Reclassification Improvement (NRI) [24]. We considered grouped NRI instead of continuous NRI because calibration can greatly affect the continuous NRI measurement. To measure NRI for different decision thresholds, we split the validation data into 2 groups, high risk and low risk, sweeping the decision threshold from the 50th percentile to the maximum. Finally, we measured the classification performance of the models, in terms of sensitivity and positive predictive value, using a decision threshold based on the 95th percentile. This threshold was chosen based on the class imbalance (ie, identifies a patient population 5 times greater than the expected number of infected patients). In addition to identifying which patients were predicted to test positive and which patients actually tested positive, we noted when patients tested positive. This method allowed us to determine how far in advance the model is capable of accurately identifying high-risk patients, an important measure of performance for any predictive model. All statistical analyses were performed using MATLAB.
RESULTS
After applying exclusion criteria (described in Figure 1), the final population consisted of 69 568 admissions. Table 1 summarizes the demographic and admission-related characteristics of the study population. Given the EMRs of all patients in our dataset, we extracted the features referenced in Table 2 for each patient admission and a binary label indicating whether a patient tested positive for C difficile (and when). This process resulted in 14 curated features and 10 845 additional features derived from the EMR.
Figure 1.
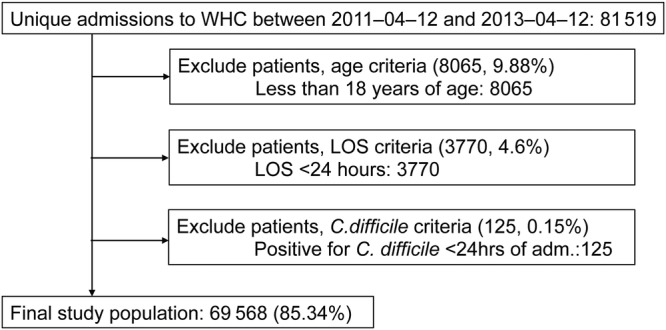
Study population flow diagram.
Table 1.
Descriptive Characteristics of Study Population
| Variable | Statistic (n = 69 568) |
|---|---|
| Female gender (%) | 56.72 |
| Age (%) | |
| 18–25 | 6.36 |
| 25–45 | 20.87 |
| 45–60 | 25.23 |
| 60–70 | 18.74 |
| 70–80 | 15.37 |
| 80–100 | 10.37 |
| ≥100 | 2.97 |
| Hospital admission type (%) | |
| Emergency | 58.53 |
| Routine elective | 19.36 |
| Urgent | 12.43 |
| Term pregnancy | 9.41 |
| Hospital admission source (%) | |
| Admitted from home | 79.34 |
| Transferred from another health institution | 12.02 |
| Outpatient | 6.20 |
| Other* | 2.42 |
| Hospital service (%) | |
| Medicine | 45.54 |
| Cardiology | 12.41 |
| Surgery | 11.41 |
| Obstetrics | 10.72 |
| Psychiatry | 4.21 |
| Other† | 15.71 |
| Hemodialysis performed (%) | 5.02 |
| Diabetic (%) | 31.46 |
| Medications (%) | |
| Immunosuppressants (solid-organ transplant) | 1.84 |
| Corticosteroids | 11.31 |
| Antimicrobials assoc** | 36.67 |
| Antimicrobials rarely assoc | 18.30 |
| Proton pump inhibitors | 34.92 |
| CDI (%) | 1.05 |
| Median LOS in days (IQR) | 4.01 (2.40–7.12) |
| Previous visit in last 90 days (%) | 21.85 |
| History of CDI, 1 year (%) | 1.45 |
Abbreviations: assoc, ; CDI, Clostridium difficile infection; IQR, interquartile range; LOS, length of stay.
* Other includes routine admission (unscheduled), transferred form a nursing home, referred and admitted by family physician.
† Other includes burn, gynecology, neurosurgery, open heart surgery, oncology, orthopedics, trauma, vascular.
** assoc refers to known associations between antimicrobials and CDI.
Table 2.
Variable Descriptions*
| Variable Name | Description |
|---|---|
| Curated Variables Based on Well Known Risk Factors (All Variables Collected During First 24 H of Admission) | |
| age_70 | (Time of Admission - Birthday) ≥70 years [8, 9, 11] |
| admission_source:TE | Transfer from nursing home [1] |
| day90_hospit | Recent hospitalization in the previous 90 days [7, 10] |
| hist_cdi | Previous CDI within the last year [11] |
| hemodialysis | Procedure code for dialysis [10] |
| gastro_tube | Procedure code associated with nasogastric or esophagostomy tube [16, 19] |
| ccsteroids | POE for corticosteroids [10] |
| immunosuppressants | POE for solid-organ transplant immunosuppressants |
| chemo_cdi | POE for chemotherapeutic agents associated with CDI |
| chemo_entero | POE for chemotherapeutic agents associated with enteropathy |
| antimicrobials_assoc | POE for antimicrobials frequently associated with CDI [9, 12–14, 20] |
| antimicrobials_rarely | POE for antimicrobials rarely associated with CDI [6] |
| ppi | POE for proton pump inhibitors [15, 17] |
| abdominal_surgery | Procedure codes for abdominal surgery associated with CDI [9, 18] |
| Variable Category | Description |
| Categories of Additional Variables Extracted From the EMR | |
| previous visits | Statistics on previous LOS (within 90 days) lengths (total, max, avg) |
| dxcodes | Highest level of ICD9 codes coded during most recent visit |
| labresults | Any laboratory test that was observed within 24 h with flag (high, low, critical) |
| vitals | All vitals with flags (high, low) collected during first 24 h |
| procedures | All procedure codes collected during first 24 h |
| medications | All POE for previous visit and during first 24 h of current visit |
| admission_type | Admission type |
| admission_source | Admission source |
| hospital_service | Hospital service |
| age | Discretized [15, 25, 45, 60, 70, 80, 100] |
| city | City where the patient resides |
| colonization_pressure | Unit and hospital-wide colonization pressure on day of admission |
Abbreviations: avg, average; CDI, Clostridium difficile infection; EMR, electronic medical record; LOS, length of stay; max, maximum; POE, physician order entry.
* We describe each patient admission using 2 sets of variables. We refer to the first set of variables as Curated. The second set of variables consists of all additional data procured from the structured fields of patients' electronic health records.
We learned 3 different models based on different sets of variables. The first model, named EMR, was constructed by first considering all of the features extracted from the EMR (ie, all of the features in Table 2). For computational efficiency, this set of features was reduced to only those features that occurred in at least 1% of the population. The resulting model was trained on 1017 variables. The second model, Curated, considered only the first 14 features listed in Table 2, known risk factors for C difficile readily available to clinicians. For completeness, we constructed a third model, EMRall, that used all of the features extracted from the EMR (without any filtering). This final model considered all 10 859 features.
We constructed the risk stratification models (eg, identified the set of weights for combining the observations) on admissions from the first year, and we validated the learned prediction rules on all admissions in the second year.
Training Set: 34 846 admissions (372 cases of CDI).
Validation Set: 34 722 admissions (355 cases of CDI).
We tested the predictive power of each of the models on the validation data and achieved the results displayed in Table 3. This table presents the AUROC. In the third column of Table 3, we consider the performance on all patients in the validation set. Note that this result includes patients who test positive or are discharged between 24 and 48 hours after admission. These cases are arguably the easiest cases to identify (the closer one is to a positive test result or discharge the easier it is to predict). Therefore, to further validate the 3 models, in the last column of Table 3 we note the performance of each model on the subset of admissions with a risk period greater than 48 hours: 28 984 admissions, 286 in which the patient tests positive for C difficile. The EMR model performs significantly better than the Curated model, on this subset of test patients. Figure 2 shows how this trend continues when we consider patients with even longer risk periods.
Table 3.
Performance of 3 Models Varying in Complexity on the Test Data (n = 34 722)*
| Model | Dimensionality | AUC RP > 24 (95% CI) | AUC RP > 48 (95% CI) |
|---|---|---|---|
| EMR | 1017 | 0.8129 (.79–.83) | 0.7886 (.76–.82) |
| Curated | 14 | 0.7163 (.69–.75) | 0.6900 (.66–.72) |
| EMRall | 10 859 | 0.8140 (.80–.83) | 0.7896 (.76–.81) |
Abbreviations: AUC, receiver operating characteristic curve; CI, confidence interval; EMR, electronic medical record; RP, risk period.
* We measure performance in terms of AUC of predictions applied to all of the patients present in the hospital 24 h after admission (who have not yet tested positive for Clostridium difficile) and also a subset of patients with an RP >48 h.
Figure 2.
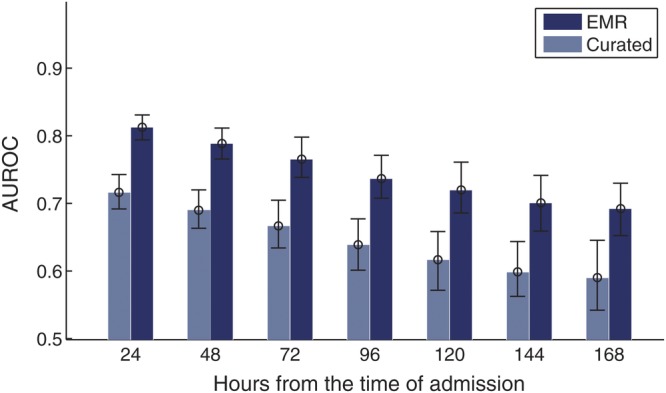
The area under the receiver operating characteristic curve (AUROC) achieved when both the electronic medical record (EMR) and the Curated models were applied to patients in the validation set. Each comparison considers a different subset of patients based on the length of their risk periods. For example, in the third comparison from the left, all patients have a risk period of at least 72 hours.
In Figure 3A, we plot the ROCs generated by applying the EMR and the Curated models to the validation data. In all 3 plots, we see a clear advantage of the model trained on the EMR data versus the model trained only on the smaller subset of well known risk factors, specifically in the region between 0.05 and 0.25 false-positive rate (shown in Figure 3A(iii)). In Figure 3B, we display the calibration of both models. The Curated classifier, depicted in the last plot, underestimates the probability of testing positive for patients who are at high risk and overestimates the probability for patients who are at low risk, suggesting that it is not well calibrated.
Figure 3.

(A) Receiver operating characteristic (ROC) curves for the first 2 models listed in Table 3. The thin dotted lines represent the 95% confidence bounds generated using 100 bootstrap samples from the test data. A(i) shows the ROC curve generated on all admissions in the test data, whereas A(ii) considers only those patients with a risk period of at least 48 hours. A(iii) focuses on only a portion of the ROC curve presented in 3A(ii). (B) B(i) shows the calibration for the EMR model, and B(ii) shows the calibration for the Curated model. The black dashed lines represent perfect calibration, ie, where the predicted probability aligns with the likelihoods seen when the classifier is applied to the test patients (45 degree line).
Figure 4A plots the NRI for different cutoffs (based on percentiles). In general, we see approximately 15% of improvement in the reclassification of positive examples (ie, the EMR classifier does a better job at classifying the patients who eventually test positive for C difficile). In addition, Figure 4B gives the confusion matrix for both classifiers when patients were classified as high risk if the predicted probability was greater or equal to the 95th percentile. From the confusion matrices, in Figure 4B, we calculated a 38% increase in sensitivity and a 50% increase in positive predictive value, using the EMR model compared with the Curated model. The EMR model identified 26 additional true positives compared with the Curated model, while identifying fewer false positives. Figure 4C further illustrates the ability of the EMR model to identify patients several days in advance of a positive test result.
Figure 4.

(A) Net reclassification improvement (NRI) of using the electronic medical record (EMR) model to classify patients as high risk or low risk versus the Curated model. (B) Confusion matrices for both the EMR model and the Curated model, using a decision threshold based on the 95th percentile. (C) Histogram of when patients in the validation set tested positive for pathogenic C difficile and the number patients correctly identified as high risk in each group, using the EMR model with same decision threshold as in 4(B).
DISCUSSION
Electronic medical record-based methods for patient risk stratification for CDI in advance of disease performed significantly better than methods based on known risk factors, as represented in the Curated model. The EMR model resulted in a 10% improvement in the AUROC over that of the Curated model. For a true positive rate of 0.5, the EMR model would misclassify over 3000 fewer patients a year. The EMR model performed better than the Curated model consistently across patient populations, independent of when patients tested positive for toxigenic C difficile. Furthermore, the proposed classifier identified more true positives, while reducing the number of false positives compared with the Curated model. Given the significant class imbalance of the problem (ie, a positive test result occurs in only 1% of the population), simultaneous improvements in sensitivity and specificity is a significant achievement. Despite the large difference in numbers of features considered, the EMR and EMRall models performed nearly identically, confirming that we do not sacrifice classifier performance when filtering variables for computational efficiency.
To the best of our knowledge, this model is the first risk stratification model for CDI based on data automatically extracted from the EMR. Several recent efforts have focused on building more conventional predictive models for CDI based on known risk factors. Results in the literature for the problem of risk stratification for CDI vary greatly, with reported AUROC's ranging from 0.63 to 0.88 [7, 22–24]. The variation in classification performance arises from differences in task definitions, study populations, and methods used to generate and evaluate the predictions. For example Garey et al [7], considered only hospitalized patients receiving broad-spectrum antibiotics, whereas we consider all hospitalized patients. Such differences render simple comparisons among performance measures uninformative. Thus, in a review of prior work, we shall focus on reported methodology rather than on relative performance.
Tanner et al [22] tested the ability of the Waterlow Score to risk stratify patients at the time of admission for contracting C difficile. The Waterlow Score considers 10 variables available at the time of admission, including build and weight for height, skin type and visual risk areas, sex and age, malnutrition, continence, mobility, tissue malnutrition, neurological deficit, and major surgery or trauma. Dubberke et al [6], identified several additional risk factors for CDI, including colonization pressure, which attempts to capture the exposure to the pathogen from surrounding colonized or infected patients. More recently, Dubberke et al [23] developed and validated a risk-prediction model based on variables collected at the time of admission and also during the hospitalization to identify patients at high risk of CDI. The final model includes 10 different variables: age, colonization pressure, times admitted to hospital in the previous 60 days, modified acute physiology score, days of treatment with high-risk antibiotics, whether albumin level was low, admission to an intensive care unit, and receipt of laxatives, gastric acid suppressors, or antimotility drugs. Garey et al [7] used 5 variables (age 50–80, age >80, hemodialysis, nonsurgical admission, and intensive care unit LOS) to build a risk index for hospitalized patients receiving broad-spectrum antibiotics.
In all of the work discussed above, building risk stratification models for C difficile is a 2-step process. In a first step, risk factors for C difficile are identified using either logistic regression or based on previously identified risk factors drawn from the literature. This initial step typically results in the use of fewer than a dozen variables. A second step corresponds to constructing a prediction rule (ie, the function used to combine the factors into a risk score). These functions are typically learned based on a training set of example patient cases (patient admissions labeled as either tested positive for C difficile or not). This method is appropriate if the number of available learning examples is small, if the variables must be extracted by hand, or if the prediction rule will be implemented by hand. Yet, many hospital databases now contain hundreds of thousands of EMRs on patient hospitalizations. Although these data are available in most hospital database systems, they are often overlooked when building prediction rules given the traditional goal of generating simple clinical rules (eg, back of the envelope addition with a small number of factors). As we have shown, these data can be harnessed via machine learning techniques to learn accurate hospital-specific risk stratification models that take into consideration thousands of variables. The proposed methods yield hospital-specific, risk stratification models that are custom tailored to the distributions, readily available variables, and nuances of individual hospitals.
In this study, we considered the task of predicting which patients would test positive for pathogenic C difficile during the current admission, using data collected within the first 24 hours of admission. Framing the problem as such allowed us to measure the utility of the EMR data available shortly after admission. However, this problem formulation resulted in the identification of patients who acquired an infection during the current hospitalization and those who were probably already infected at the time of admission. The Centers for Disease Control and Prevention defines hospital-acquired CDI as a positive test result for C difficile at least 3 calendar days after admission [25]. This policy is aimed at excluding patients admitted with an infection who were tested before day 3. The ability to identify both sets of patients is clinically relevant. In particular, early identification could aid in reducing further transmission of the disease. However, if one is more interested in focusing prevention efforts on hospital-acquired disease, the proposed methods could be used to make a prediction about each patient 72 hours after admission. In addition, the proposed methods could be extended to make multiple predictions throughout a hospitalization. For example, a prediction could be made on a daily basis with the availability of additional EMR data. The ability to identify patients at high risk of acquiring CDI in advance of disease could enable effective, targeted interventions to reduce patient risk.
Currently, avoiding preventable exposure to antibiotics associated with CDI and preventing ingestion of the C difficile organism or spore are the core tenants of prevention efforts [26]. In the absence of effective risk stratification that can focus the allocation of interventions on the patients at highest risk, interventions, such as proactively isolating patients, targeted antimicrobial review, or performing enhanced environment cleaning, are prohibitively expensive [27]. Only a small fraction of patients become infected with C difficile during their hospitalization. Thus, any intervention applied to the entire population is likely to have no positive effect in at least 99% of the admissions. In contrast, our risk stratification model presented in the previous section can identify a population of patients at 6 times the risk of the reference population, enabling the selective targeting of interventions.
Furthermore, this risk stratification method could be incorporated into a clinical study designed to test the efficacy of proactive interventions. For example, a study could focus on protecting high-risk patients from organisms in the environment whether being shed from asymptomatic carriers [10], carried on the hands of a healthcare worker, or remaining in the room after the previous occupant [28]. A focused antimicrobial review targeting high-risk patients may be another opportunity for cost-effective CDI prevention. The efficacy of probiotics in preventing infection with C difficile is still being investigated [9]. Currently, such studies are expensive because in the absence of an effective risk stratification model, a large number of patients must be included to power the analysis. The proposed risk stratification model could help identify a better study population (ie, the population of patients at highest risk of acquiring CDI), thereby reducing the total cost while increasing the statistical power of the analysis. Targeting such high-risk groups with an intervention would limit the total number of patients receiving the intervention while increasing the fraction of patients for which the intervention might have a positive effect.
There are several limitations to this work. First, we lack ground truth regarding the outcome of some patients, because not all patients are tested for C difficile. It is possible that some patients become colonized during their hospital stay, but they only start showing symptoms of infection after discharge. If these patients are not readmitted to the hospital and tested for C difficile, we will not identify them correctly. Future analysis on prospective data should include an extended follow-up period to identify such cases. Second, the potential for statistical correlation among the variables considered in our high-dimensional models limits our ability to accurately identify risk factors. In this work, we consider only linear models. Such an approach yields models that are interpretable as the sum of weights on variables, versus more complex functions of variables associated with nonlinear methods. Even so, more research is needed before we can effectively and succinctly explain why a particular patient is identified as high risk.
Although more complex than traditional tools for calculating patient risk, models that leverage the richness of the EMR can perform significantly better. Moreover, with the advent of the EMR, these more sophisticated models can be integrated directly into the health information system at the hospital.
We have integrated a version of the model based on 1000 variables into the health record system at the hospital. The risk score is computed as a scheduled task that runs once a day on patient data drawn from the hospital's health information system, and it provides an updated risk score that is displayed as part of the patient information available throughout the hospital. We are now exploring ways to incorporate this risk score into existing care delivery processes, with the goal of ultimately improving patient care.
Supplementary Data
Supplementary material is available online at Open Forum Infectious Diseases (http://OpenForumInfectiousDiseases.oxfordjournals.org/).
Acknowledgments
Financial support. This work was supported by the US National Science Foundation, Quanta Computer Inc and the National Science and Engineering Research Council of Canada.
Potential conflicts of interest. All authors: No reported conflicts.
All authors have submitted the ICMJE Form for Disclosure of Potential Conflicts of Interest. Conflicts that the editors consider relavant to the content of the manuscript have been disclosed.
References
- 1.Boone J, Goodykoontz M, Rhodes S, et al. Clostridium difficile prevalence rates in a large healthcare system stratified according to patient population, age, gender, and specimen consistency. Eur J Clin Microbiol Infect Dis. 2012;31:1551–9. doi: 10.1007/s10096-011-1477-6. [DOI] [PubMed] [Google Scholar]
- 2.National Hospital Discharge Survey. Annual Files, 1996–2009
- 3.Ghantoji S, Sail K, Lairson D, et al. Economic healthcare costs of Clostridium difficile infection: a systematic review. J Hosp Infect. 2010;74:309–18. doi: 10.1016/j.jhin.2009.10.016. [DOI] [PubMed] [Google Scholar]
- 4.Kyne L, Hamel MB, Polavaram R, Kelly CP. Health care costs and mortality associated with nosocomial diarrhea due to Clostridium difficile. Clin Infect Dis. 2002;34:346–53. doi: 10.1086/338260. [DOI] [PubMed] [Google Scholar]
- 5.Larson EL, Cohen B, Ross B, Behta M. Isolation precautions for methicillin-resistant Staphylococcus aureus: electronic surveillance to monitor adherence. Am J Crit Care. 2010;19:16–26. doi: 10.4037/ajcc2009467. [DOI] [PubMed] [Google Scholar]
- 6.Dubberke ER, Reske KA, Yan Y, et al. Clostridium difficile—associated disease in a setting of endemicity: identification of novel risk factors. Clin Infect Dis. 2007;45:1543–9. doi: 10.1086/523582. [DOI] [PubMed] [Google Scholar]
- 7.Garey K, Dao-Tran T, Jiang Z, et al. A clinical risk index for Clostridium difficile infection in hospitalised patients receiving broad-spectrum antibiotics. J Hosp Infect. 2008;70:142–7. doi: 10.1016/j.jhin.2008.06.026. [DOI] [PubMed] [Google Scholar]
- 8.Bartlett JG. Narrative review: the new epidemic of Clostridium difficile–associated enteric disease. Ann Intern Med. 2006;145:758–64. doi: 10.7326/0003-4819-145-10-200611210-00008. [DOI] [PubMed] [Google Scholar]
- 9.Johnston BC, Ma SS, Goldenberg JZ, et al. Probiotics for the prevention of Clostridium difficile-associated diarrhea: a systematic review and meta-analysis. Ann Intern Med. 2012;157:878–88. doi: 10.7326/0003-4819-157-12-201212180-00563. [DOI] [PubMed] [Google Scholar]
- 10.Leekha S, Aronhalt KC, Sloan LM, et al. Asymptomatic Clostridium difficile colonization in a tertiary care hospital: admission prevalence and risk factors. Am J Infect Control. 2013;41:390–3. doi: 10.1016/j.ajic.2012.09.023. [DOI] [PubMed] [Google Scholar]
- 11.Garey K, Sethi S, Yadav Y, DuPont H. Meta-analysis to assess risk factors for recurrent Clostridium difficile infection. J Hosp Infect. 2008;70:298–304. doi: 10.1016/j.jhin.2008.08.012. [DOI] [PubMed] [Google Scholar]
- 12.Kurd MF, Pulido L, Joshi A, et al. Clostridium difficile infection after total joint arthroplasty: who is at risk? J Arthroplasty. 2008;23:839–42. doi: 10.1016/j.arth.2007.10.033. [DOI] [PubMed] [Google Scholar]
- 13.Drekonja DM, Amundson WH, DeCarolis DD, et al. Antimicrobial use and risk for recurrent Clostridium difficile infection. Am J Med. 2011;124:1081.e1–e7. doi: 10.1016/j.amjmed.2011.05.032. [DOI] [PubMed] [Google Scholar]
- 14.Lee JH, Lee SY, Kim YS, et al. The incidence and clinical features of Clostridium difficile infection: single center study. Korean J Gastroenterol. 2010;55:175–82. doi: 10.4166/kjg.2010.55.3.175. [DOI] [PubMed] [Google Scholar]
- 15.Janarthanan S, Ditah I, Adler DG, Ehrinpreis MN. Clostridium difficile-associated diarrhea and proton pump inhibitor therapy: a meta-analysis. Am J Gastroenterol. 2012;107:1001–10. doi: 10.1038/ajg.2012.179. [DOI] [PubMed] [Google Scholar]
- 16.Bliss DZ, Johnson S, Savik K, et al. Acquisition of Clostridium difficile and Clostridium difficile-associated diarrhea in hospitalized patients receiving tube feeding. Ann Intern Med. 1998;129:1012–9. doi: 10.7326/0003-4819-129-12-199812150-00004. [DOI] [PubMed] [Google Scholar]
- 17.Linsky A, Gupta K, Lawler EV, et al. Proton pump inhibitors and risk for recurrent Clostridium difficile infection. Arch Intern Med. 2010;170:772. doi: 10.1001/archinternmed.2010.73. [DOI] [PubMed] [Google Scholar]
- 18.Tsiouris A, Neale JA, Reickert CA, Times M. Clostridium difficile of the ileum following total abdominal colectomy, with or without proctectomy: who is at risk? Dis Colon Rectum. 2012;55:424–8. doi: 10.1097/DCR.0b013e31823f86a2. [DOI] [PubMed] [Google Scholar]
- 19.O'Keefe SJ. Tube feeding, the microbiota, and Clostridium difficile infection. World J Gastroenterol. 2010;16:139. doi: 10.3748/wjg.v16.i2.139. [DOI] [PMC free article] [PubMed] [Google Scholar]
- 20.Deshpande A, Pasupuleti V, Thota P, et al. Community-associated Clostridium difficile infection and antibiotics: a meta-analysis. J Antimicrob Chemother. 2013;68:1951–61. doi: 10.1093/jac/dkt129. [DOI] [PubMed] [Google Scholar]
- 21.Le Cessie S, Van Houwelingen J. Ridge estimators in logistic regression. Appl Stat. 1992;41:191–201. [Google Scholar]
- 22.Tanner J, Khan D, Anthony D, Paton J. Waterlow score to predict patients at risk of developing Clostridium difficile-associated disease. J Hosp Infect. 2009;71:239–44. doi: 10.1016/j.jhin.2008.11.017. [DOI] [PubMed] [Google Scholar]
- 23.Dubberke ER, Yan Y, Reske KA, et al. Development and validation of a Clostridium difficile infection risk prediction model. Infect Control Hosp Epidemiol. 2011;32:360. doi: 10.1086/658944. [DOI] [PMC free article] [PubMed] [Google Scholar]
- 24.Krapohl GL. Preventing health care-associated infection: development of a clinical prediction rule for Clostridium difficile Infection. University of Michigan; 2011. [Google Scholar]
- 25.Centers for Disease Control and Prevention. Multidrug-Resistant Organism & Clostridium difficile Infection (MDRO/CDI) Module January. 2014.
- 26.Yokoe DS, Classen D. Improving patient safety through infection control: a new healthcare imperative. Infect Control Hosp Epidemiol. 2008;29(S1):S3–11. doi: 10.1086/591063. [DOI] [PubMed] [Google Scholar]
- 27.Carrico R. Washington: Published by the Association for Professionals in Infection Control and Epidemiology, Inc. (APIC); 2013. APIC Implementation Guide: Guide to Preventing Clostridium difficile Infections. [DOI] [PubMed] [Google Scholar]
- 28.Shaughnessy MK, Micielli RL, DePestel DD, et al. Evaluation of hospital room assignment and acquisition of Clostridium difficile infection. Infect Control Hosp Epidemiol. 2011;32:201–6. doi: 10.1086/658669. [DOI] [PubMed] [Google Scholar]
Associated Data
This section collects any data citations, data availability statements, or supplementary materials included in this article.