

Abstract
Aims
Canagliflozin is a sodium glucose co-transporter 2 inhibitor developed for the treatment of type 2 diabetes mellitus (T2DM). This randomised, double-blind, placebo-controlled, Phase 3 study evaluated the efficacy and safety of canagliflozin as an add-on to metformin plus sulphonylurea in patients with T2DM.
Methods
Patients (N = 469) received canagliflozin 100 or 300 mg or placebo once daily during a 26-week core period and a 26-week extension. Prespecified primary end-point was change in HbA1c at 26 weeks. Secondary end-points included change in HbA1c at week 52 as well as proportion of patients achieving HbA1c < 7.0%, change in fasting plasma glucose (FPG) and systolic blood pressure, and per cent change in body weight, high-density lipoprotein cholesterol, and triglycerides (weeks 26 and 52).
Results
HbA1c was significantly reduced with canagliflozin 100 and 300 mg vs. placebo at week 26 (–0.85%, –1.06%, and –0.13%; p < 0.001); these reductions were maintained at week 52 (–0.74%, –0.96%, and 0.01%). Both canagliflozin doses reduced FPG and body weight vs. placebo at week 26 (p < 0.001) and week 52. Overall adverse event (AE) rates were similar across groups over 52 weeks, with higher rates of genital mycotic infections and osmotic diuresis-related AEs seen with canagliflozin vs. placebo; these led to few discontinuations. Increased incidence of documented, but not severe, hypoglycaemia episodes was seen with canagliflozin vs. placebo.
Conclusions
Canagliflozin improved glycaemic control, reduced body weight, and was generally well tolerated in T2DM patients on metformin plus sulphonylurea over 52 weeks.
What's known
Canagliflozin decreases plasma glucose by lowering the renal threshold for glucose and increasing urinary glucose excretion.
Canagliflozin is approved in the United States as an adjunct to diet and exercise to improve glycaemic control in adults with type 2 diabetes mellitus (T2DM).
Canagliflozin 300 mg has demonstrated superiority to sitagliptin 100 mg in lowering HbA1c in patients with T2DM on background metformin plus sulphonylurea over 52 weeks.
What's new
Results from a 52-week, placebo-controlled, Phase 3 study evaluating canagliflozin 100 and 300 mg as an add-on therapy to metformin plus sulphonylurea are reported.
Both canagliflozin doses provided reductions in HbA1c, fasting plasma glucose, and body weight compared with placebo over 52 weeks.
Canagliflozin was generally well tolerated, without increases in severe hypoglycaemia episodes in this patient population on background therapy associated with an increased risk of hypoglycaemia.
Introduction
Management of hyperglycaemia in patients with type 2 diabetes mellitus (T2DM) is important for reducing the risk of long-term complications. Many patients do not achieve or maintain glycaemic goals with first-line metformin therapy and require combination therapy with a second glucose-lowering agent, such as a sulphonylurea 1,2. Over time, many patients eventually require treatment with a third agent 2–4. Underlying the progressive failure of initial and dual combination therapy is progressive β-cell dysfunction. Agents with glucose-lowering effects independent of β-cell function might offer benefits in patients needing combination therapy.
Canagliflozin is a sodium glucose co-transporter 2 (SGLT2) inhibitor developed for the treatment of patients with T2DM 5–10. After glucose is filtered through the glomerulus, SGLT2 mediates the majority of renal glucose reabsorption 11. The renal threshold for glucose excretion (RTG) is the plasma glucose concentration below which essentially all filtered glucose is reabsorbed by the renal tubules, and above which urinary glucose excretion (UGE) rises in proportion to plasma glucose. Patients with T2DM often exhibit increased RTG, which may contribute to sustained hyperglycaemia 12,13. In preclinical diabetes models, canagliflozin lowered RTG and increased UGE, leading to reduced blood glucose and HbA1c and improved measures of β-cell function 14. In patients with T2DM, canagliflozin lowered mean RTG to 4.4–5.0 mmol/l, above the threshold for hypoglycaemia 5,15; thus, canagliflozin is predicted to have a low intrinsic risk of hypoglycaemia. Other factors that may contribute to the low risk of hypoglycaemia with canagliflozin are a rise in hepatic glucose production as blood glucose decreases 16 and potentially an incomplete inhibition of renal glucose reabsorption 17. Canagliflozin has been shown to improve glycaemic control and reduce body weight and systolic blood pressure (BP) in patients with T2DM 5,6,8,9,15. Improvements in these efficacy parameters have also been observed with another SGLT2 inhibitor, dapagliflozin 18–21. Because of its mechanism of action, distinct from other current classes of oral antidiabetic drugs (OADs), canagliflozin has the potential to provide complementary, additive effects in patients on background metformin plus sulphonylurea. In this context, canagliflozin 300 mg has demonstrated superiority to sitagliptin 100 mg in lowering HbA1c in patients with T2DM on background metformin plus sulphonylurea over 52 weeks of treatment 8.
This Phase 3, CANagliflozin Treatment And Trial Analysis – Metformin plus SUlphonylurea (CANTATA-MSU) study evaluated the efficacy and safety of two doses of canagliflozin (100 and 300 mg) compared with placebo as an add-on therapy in patients with T2DM inadequately controlled with metformin plus sulphonylurea combination therapy.
Materials and methods
Patients and study design
This randomised, double-blind, placebo-controlled, Phase 3 study was conducted at 85 study centres in 11 countries between April 2010 and April 2012 (ClinicalTrials.gov: NCT01106625). It consisted of a 26-week, core, double-blind, treatment period followed by a 26-week, double-blind, extension period.
Eligible patients were men and women aged 18–80 years with T2DM who had inadequate glycaemic control (HbA1c ≥ 7.0% to ≤ 10.5%) on metformin plus sulphonylurea, with both agents at maximally or near-maximally effective doses. During the pretreatment phase, patients who were on protocol-specified doses of metformin plus sulphonylurea [metformin, ≥2000 mg/day (or ≥ 1500 mg/day if intolerant of higher dose); sulphonylurea, at least half-maximal labelled dose; Table 1] and had HbA1c ≥ 7.0% to ≤ 10.5% directly entered a 2-week, single-blind, placebo run-in period. Patients taking below protocol-specified doses of metformin and/or sulphonylurea underwent an OAD adjustment period consisting of an up to 4-week metformin and/or sulphonylurea dose titration period and then an 8-week dose stable period; patients then entered the placebo run-in period if they had HbA1c ≥ 7.0% to ≤ 10.5% and met all other enrolment criteria.
Table 1.
Minimum daily dose required for sulphonylurea for randomisation
| Sulphonylurea | Minimum daily dose required for randomisation |
|---|---|
| Glipizide | 20 mg |
| Glipizide extended release | 10 mg |
| Glyburide/glibenclamide | 10 mg |
| Glimepiride | 4 mg |
| Gliclazide | 160 mg daily |
| Gliclazide modified release | 60 mg daily |
Exclusion criteria included a history of diabetic ketoacidosis or T1DM, repeated fasting plasma glucose (FPG) ≥ 15.0 mmol/l during the pretreatment phase, history of ≥ 1 severe hypoglycaemia episode within 6 months before screening, estimated glomerular filtration rate (eGFR) < 55 ml/min/1.73 m2 (or < 60 ml/min/1.73 m2 based upon restriction of metformin use in the local label) or serum creatinine ≥ 124 μmol/l for men and ≥ 115 μmol/l for women, uncontrolled hypertension (systolic BP ≥ 160 mmHg or diastolic BP ≥ 100 mmHg), or taking any antihyperglycaemic agent other than metformin plus sulphonylurea within 12 weeks prior to screening.
During a 2-week placebo run-in period, all patients received a single-blind placebo capsule matching the double-blind study drug once daily before the first meal of the day. Patients were then randomly assigned into the core treatment period at a 1:1:1 ratio to receive canagliflozin 100 or 300 mg or placebo once daily before the first meal of the day. Canagliflozin 100 and 300 mg were selected based on previously published findings from a dose-ranging, Phase 2 study in patients with T2DM, in which canagliflozin 100 mg was the lowest dose providing clear glycaemic efficacy and canagliflozin 300 mg provided additional HbA1c lowering relative to canagliflozin 100 mg 5. A stable dose of metformin plus sulphonylurea was to be continued throughout the run-in period and double-blind treatment phase, unless adjustment was clinically required. During the core double-blind treatment period, glycaemic rescue therapy with insulin was initiated if FPG > 15.0 mmol/l after day 1 to week 6, > 13.3 mmol/l after week 6 to week 12, and > 11.1mmol/l after week 12 to week 26, and if HbA1c > 8.0% after week 26.
Randomisation was performed using an Interactive Voice Response System/Interactive Web Response System based on a computer-generated schedule prepared by the sponsor before the study. Randomisation was balanced using permuted blocks of six patients per block and stratified based on two criteria: (i) whether a patient entered the OAD adjustment period and (ii) whether a patient participated in the frequently-sampled mixed-meal tolerance test (FS-MMTT). To maintain blinding after randomisation, HbA1c and FPG values were masked to study centres unless these values met prespecified glycaemic rescue criteria or after glycaemic rescue therapy was started. After completion of the core treatment period, the database was locked and the study was unblinded by the sponsor for regulatory filing; patients, investigators and local sponsor personnel remained blinded throughout the extension period.
The study was conducted in accordance with the ethical principles that have their origin in the Declaration of Helsinki and are consistent with Good Clinical Practice and applicable regulatory requirements. Approval was obtained from institutional review boards and independent ethics committees for participating centres. Patients gave informed, written consent prior to participation.
Study outcomes
The prespecified primary efficacy end-point was change from baseline in HbA1c at week 26; change from baseline in HbA1c to week 52 was a key secondary end-point. Other prespecified secondary efficacy end-points evaluated at weeks 26 and 52 included proportion of patients achieving HbA1c < 7.0%, change from baseline in FPG and systolic BP and per cent change from baseline in body weight, high-density lipoprotein cholesterol (HDL-C), and triglycerides. Homeostasis Model Assessment (HOMA2-%B), a fasting measure of β-cell function, was assessed at week 26 based on FPG and C-peptide measurements. In a subset of patients who underwent an FS-MMTT on day 1 and at week 26, 2-h postprandial glucose (PPG), glucose area under the concentration-time curve (AUCG), incremental AUCG (ΔAUCG), and the ratio of C-peptide AUC (AUCC) to AUCG were assessed. During the FS-MMTT, blood samples were collected 15 min before and immediately prior to the meal, and 30, 60, 90, 120 and 180 min after the meal.
Safety and tolerability over 52 weeks were assessed based on adverse event (AE) reports, safety laboratory tests, vital sign measurements, 12-lead electrocardiograms and physical examinations. AEs prespecified for additional data collection and analysis included genital mycotic infections and urinary tract infections (UTIs); additional data collection was also undertaken for hypoglycaemia events. Documented hypoglycaemia events included biochemically confirmed episodes (concurrent fingerstick glucose or plasma glucose ≤ 3.9 mmol/l) with or without symptoms and severe hypoglycaemia episodes (i.e. those for which patients required assistance from another person or those resulting in seizure or loss of consciousness).
Statistical analyses
Sample size determination was based on demonstrating the superiority of canagliflozin to placebo at week 26. An estimated 85 randomised patients per treatment group were required to achieve ≥ 90% power, assuming a between-group difference of 0.5% and a common standard deviation (SD) of 1.0%, and using a two-sample, two-sided t-test with a type I error rate of 0.05. Sample size was expanded to 150 patients per group to enhance the safety and tolerability assessment of canagliflozin in patients on metformin plus sulphonylurea. No hypothesis testing was conducted for the week 52 assessments.
Primary efficacy analyses were conducted using the modified intent-to-treat (mITT) population (all randomised patients who took ≥ 1 dose of double-blind study drug). Efficacy data were analysed according to randomised treatment with the last observation carried forward (LOCF) approach used to impute missing values. For patients who received rescue therapy, the last postbaseline value prior to initiation of rescue therapy was used for analyses. Safety analyses were conducted in all randomised patients who took ≥ 1 dose of study drug and were analysed according to the predominant treatment received. In this study, the efficacy and safety analysis sets were identical.
Primary and continuous secondary efficacy end-points were assessed using an analysis of covariance (ANCOVA) model with treatment and stratification factors as fixed effects and the corresponding baseline value as a covariate. Differences between groups (each canagliflozin dose vs. placebo) in the least squares (LS) means (or per cent means) and the associated two-sided 95% confidence intervals (CIs) were estimated. The categorical secondary efficacy end-point (proportion of patients reaching HbA1c < 7.0%) was analysed using a logistic model with treatment and stratification factors as fixed effects and baseline HbA1c as covariate. For indices of β-cell function assessed in the FS-MMTT subset, descriptive statistics and 95% CIs for changes from baseline were provided; LS mean differences vs. placebo at week 26 were assessed using an ANCOVA model with treatment and the stratification factor of whether a patient entered the OAD adjustment period as fixed effects, and the corresponding baseline value as a covariate.
A prespecified hierarchical testing sequence was implemented to strongly control overall type I error because of multiplicity for the week 26 data. Two-sided statistical tests were conducted at the 0.05 significance level for all end-points except systolic BP, HDL-C and triglycerides, which were grouped into two subfamilies for canagliflozin 100 and 300 mg, respectively. Each subfamily was assessed using the Hochberg procedure at a significance level of 0.025. P-values were calculated by comparing LS means and are reported for prespecified comparisons at week 26 only. For subgroup analysis at week 26, descriptive statistics and 95% CIs for the change from baseline in HbA1c were provided for subgroups of patients with baseline HbA1c of < 8.0%, ≥ 8.0% to < 9.0%, and ≥ 9.0%. Descriptive results, including differences in LS means for each canagliflozin dose vs. placebo with 95% CIs, at week 52 are presented; no formal statistical treatment comparisons were performed and no p-values are reported.
Results
Patients
A total of 469 patients were randomised into the core treatment period and received ≥ 1 dose of study medication, comprising the mITT analysis set; of 381 patients who completed the core period, 374 entered the extension period and 310 completed 52 weeks of treatment (Figure 1). Rates of study discontinuation over 52 weeks were higher with placebo compared with canagliflozin 100 and 300 mg (42.3%, 30.6%, and 28.8%, respectively). The most common reasons for discontinuation were other, AEs, and unable to take protocol-defined rescue therapy. Baseline patient demographic and disease characteristics were similar across groups (Table 2). The mean age was 56.8 years, 51% of patients were men, and 83% of patients were white. Mean body weight was 92.8 kg and mean body mass index (BMI) was 33.1 kg/m2, with 66% of patients classified as obese (BMI ≥ 30 kg/m2). Baseline mean HbA1c was 8.1% and patients had a mean duration of T2DM of 9.6 years. During the 52-week treatment period, similar proportions of patients across treatment groups (≤ 4% per group) initiated or dose-adjusted antihypertensive agents (i.e. angiotensin receptor blockers, angiotensin-converting enzyme inhibitors, thiazide diuretics, calcium channel blockers, β-blockers). Few patients initiated or dose-adjusted lipid-lowering agents (including statins), with a slightly higher proportion in the canagliflozin 100 mg group (8%) than the placebo and canagliflozin 300 mg groups (6% each).
Figure 1.
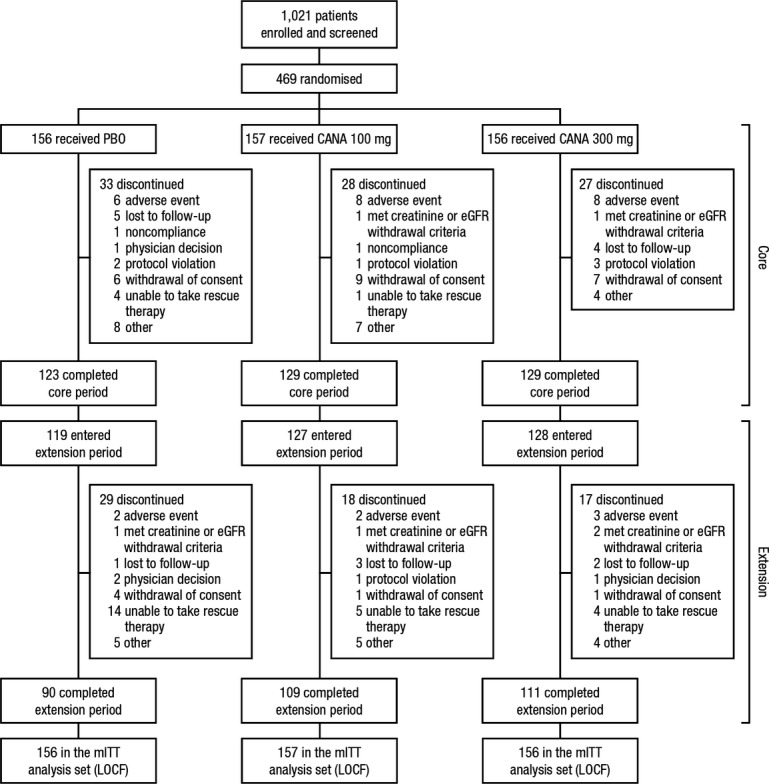
Study diagram. PBO, placebo; CANA, canagliflozin; eGFR, estimated glomerular filtration rate; mITT, modified intent-to-treat; LOCF, last observation carried forward
Table 2.
Baseline demographic and disease characteristics*
| PBO (n = 156) | CANA 100 mg (n = 157) | CANA 300 mg (n = 156) | Total (n = 469) | |
|---|---|---|---|---|
| Gender, n (%) | ||||
| Men | 76 (48.7) | 76 (48.4) | 87 (55.8) | 239 (51.0) |
| Women | 80 (51.3) | 81 (51.6) | 69 (44.2) | 230 (49.0) |
| Age (years) | 56.8 ± 8.3 | 57.4 ± 10.5 | 56.1 ± 8.9 | 56.8 ± 9.3 |
| Race, n (%)† | ||||
| White | 128 (82.1) | 132 (84.1) | 127 (81.4) | 387 (82.5) |
| Black or African American | 10 (6.4) | 5 (3.2) | 11 (7.1) | 26 (5.5) |
| Asian | 2 (1.3) | 2 (1.3) | 0 | 4 (0.9) |
| Other‡ | 16 (10.3) | 18 (11.5) | 18 (11.5) | 52 (11.1) |
| HbA1c (%) | 8.1 ± 0.9 | 8.1 ± 0.9 | 8.1 ± 0.9 | 8.1 ± 0.9 |
| FPG (mmol/l) | 9.4 ± 2.2 | 9.6 ± 2.3 | 9.3 ± 2.1 | 9.5 ± 2.2 |
| Body weight (kg) | 91.2 ± 22.6 | 93.8 ± 22.6 | 93.5 ± 22.0 | 92.8 ± 22.4 |
| BMI (kg/m2) | 32.7 ± 6.8 | 33.3 ± 6.3 | 33.2 ± 6.3 | 33.1 ± 6.5 |
| Duration of T2DM (years) | 10.3 ± 6.7 | 9.0 ± 5.7 | 9.4 ± 6.4 | 9.6 ± 6.3 |
PBO, placebo; CANA, canagliflozin; FPG, fasting plasma glucose; BMI, body mass index; T2DM, type 2 diabetes mellitus; SD, standard deviation.
Data are mean ± SD unless otherwise indicated.
Percentages may not total 100.0% because of rounding.
Includes American Indian or Alaska Native, Native Hawaiian or other Pacific islander, multiple, other, or not reported.
Efficacy
Glycaemic efficacy end-points
At week 26, HbA1c was significantly reduced from baseline with canagliflozin 100 and 300 mg compared with placebo (–0.85%, –1.06%, and –0.13%, respectively; p < 0.001 for both canagliflozin doses; Figure 2A). Differences in LS mean changes for canagliflozin 100 and 300 mg relative to placebo were –0.71% and –0.92%, respectively. Subgroup analysis conducted at week 26 showed substantially greater reductions in HbA1c with both canagliflozin doses compared with placebo in patients with higher, relative to those with lower, baseline HbA1c (Table3). Reductions in HbA1c with canagliflozin 100 and 300 mg compared with placebo were sustained over 52 weeks of treatment (Figure 2A), with differences in LS mean changes (95% CI) vs. placebo of –0.75% (–0.95, –0.55) and –0.97% (–1.17, –0.77) for canagliflozin 100 and 300 mg, respectively, at week 52. HbA1c reductions with both canagliflozin doses were observed starting at week 6, with a nadir at week 12 followed by small increases over the remainder of the 52-week treatment period that were similar to the increases seen with placebo. A greater proportion of patients treated with canagliflozin 100 or 300 mg compared with placebo achieved HbA1c < 7.0% at week 26 (43.2%, 56.6%, and 18.0%, respectively; p < 0.001 for both canagliflozin doses) and week 52 (39.4%, 52.6%, and 18.7%, respectively).
Figure 2.

Effects on glycaemic parameters (LOCF). Changes in HbA1c (A) and FPG (B). LOCF, last observation carried forward; FPG, fasting plasma glucose; PBO, placebo; CANA, canagliflozin; LS, least squares; SE, standard error; CI, confidence interval. *p < 0.001
Table 3.
Summary of changes from baseline in HbA1c at week 26 in baseline HbA1c subgroups (LOCF)
| PBO | CANA 100 mg | CANA 300 mg | |
|---|---|---|---|
| Baseline HbA1c < 8.0%, n | 74 | 73 | 74 |
| Mean ± SD baseline (%) | 7.4 ± 0.3 | 7.3 ± 0.4 | 7.4 ± 0.3 |
| LS mean ± SE change | –0.02 ± 0.10 | –0.47 ± 0.09 | –0.67 ± 0.09 |
| Difference vs. PBO (95% CI) | –0.45 (–0.69, –0.21) | –0.64 (–0.88, –0.40) | |
| Baseline HbA1c ≥ 8.0% to < 9.0%, n | 48 | 51 | 49 |
| Mean ± SD baseline (%) | 8.4 ± 0.3 | 8.4 ± 0.3 | 8.4 ± 0.3 |
| LS mean ± SE change | –0.12 ± 0.12 | –1.02 ± 0.13 | –1.30 ± 0.12 |
| Difference vs. PBO (95% CI) | –0.90 (–1.21, –0.58) | –1.18 (–1.49, –0.87) | |
| Baseline HbA1c ≥ 9.0%, n | 28 | 31 | 29 |
| Mean ± SD baseline (%) | 9.5 ± 0.7 | 9.6 ± 0.4 | 9.6 ± 0.5 |
| LS mean ± SE change | –0.44 ± 0.22 | –1.55 ± 0.22 | –1.59 ± 0.24 |
| Difference vs. PBO (95% CI) | –1.11 (–1.68, –0.53) | –1.15 (–1.74, –0.56) |
LOCF, last observation carried forward; PBO, placebo; CANA, canagliflozin; SD, standard deviation; LS, least squares; SE, standard error; CI, confidence interval.
Significant improvements from baseline in FPG were observed at week 26 with canagliflozin 100 and 300 mg compared with placebo; differences in LS mean changes vs. placebo were –1.2 and –1.9 mmol/l, respectively (p < 0.001 for both canagliflozin doses; Figure 2B). Reductions in FPG with canagliflozin 100 and 300 mg compared with placebo were sustained over 52 weeks (Figure 2B), with differences in LS mean changes (95% CI) vs. placebo of –1.6 mmol/l (–2.1, –1.1) and –2.1 mmol/l (–2.6, –1.6) for canagliflozin 100 and 300 mg, respectively, at week 52. Maximal reductions in FPG with both canagliflozin doses were seen at week 6, with subsequent small increases through week 52 that were similar to the increases seen with placebo. Consistent with the extent of HbA1c and FPG reductions across groups, fewer patients treated with canagliflozin 100 and 300 mg compared with placebo met glycaemic rescue criteria and initiated rescue medication or were discontinued before week 52 (12.7%, 7.7%, and 34.6%, respectively).
Other efficacy end-points
At week 26, canagliflozin 100 and 300 mg significantly reduced body weight from baseline compared with placebo, with LS mean per cent changes relative to placebo of –1.4% (–1.1 kg) and –2.0% (–1.7 kg), respectively (p < 0.001 for both canagliflozin doses; Figure3). Reductions in body weight with canagliflozin 100 and 300 mg compared with placebo were sustained over 52 weeks of treatment (Figure3), with differences in LS mean per cent changes (95% CI) vs. placebo of –1.3% (–2.1, –0.5) and –2.2% (–3.0, –1.4) for canagliflozin 100 and 300 mg, respectively, at week 52. Weight loss occurred most rapidly with both canagliflozin doses through week 12, with a continued gradual decrease through week 52 with canagliflozin 300 mg and minimal further reduction observed with canagliflozin 100 mg. A small, progressive decrease from baseline in body weight was seen with placebo over the 52-week treatment period.
Figure 3.

Per cent change in body weight (LOCF). LOCF, last observation carried forward; PBO, placebo; CANA, canagliflozin; LS, least squares; SE, standard error; CI, confidence interval. *p < 0.001
Reductions from baseline in systolic BP at week 26 were seen across treatment groups, with numerically greater, but non-statistically significant reductions with canagliflozin 100 and 300 mg (difference in LS mean changes vs. placebo of –2.2 and –1.6 mmHg, respectively; Table4). At 52 weeks, canagliflozin 100 and 300 mg were associated with differences in LS mean changes (95% CI) vs. placebo of –3.7 mmHg (–6.2, –1.3) and –3.0 mmHg (–5.5, –0.5), respectively (Table 5). Reductions in diastolic BP were also seen with canagliflozin 100 and 300 mg relative to placebo at week 52; no notable changes in pulse rate were seen across treatment groups (0.9, –1.2, and –0.4 beats per minute for canagliflozin 100 and 300 mg and placebo, respectively).
Table 4.
Summary of changes from baseline in blood pressure and fasting plasma lipids at week 26 (LOCF)
| PBO | CANA 100 mg | CANA 300 mg | |
|---|---|---|---|
| Systolic BP, n | 150 | 156 | 154 |
| Mean ± SD baseline (mmHg) | 130.1 ± 13.7 | 130.4 ± 13.5 | 130.8 ± 12.8 |
| LS mean ± SE change | –2.7 ± 1.0 | –4.9 ± 1.0 | –4.3 ± 1.0 |
| Difference vs. PBO (95% CI) | –2.2 (–4.7, 0.2)* | –1.6 (–4.1, 0.9)* | |
| Diastolic BP, n | 150 | 156 | 154 |
| Mean ± SD baseline (mmHg) | 79.0 ± 8.3 | 78.2 ± 8.3 | 78.9 ± 8.1 |
| LS mean ± SE change | –1.7 ± 0.6 | –2.9 ± 0.6 | –2.3 ± 0.6 |
| Difference vs. PBO (95% CI) | –1.1 (–2.7, 0.4)† | –0.5 (–2.1, 1.0)† | |
| Triglycerides, n | 134 | 145 | 142 |
| Mean ± SD baseline (mmol/l) | 2.2 ± 1.5 | 2.1 ± 1.3 | 2.3 ± 1.5 |
| LS mean ± SE change | 0.12 ± 0.09 | 0.02 ± 0.09 | –0.07 ± 0.09 |
| Median (IQR) per cent change | 0.3 (–18.5, 28.1) | –2.3 (–21.1, 19.7) | –3.4 (–26.4, 32.7) |
| LS mean ± SE per cent change | 11.6 ± 4.2 | 5.4 ± 4.2 | 8.5 ± 4.2 |
| Difference vs. PBO (95% CI) | –6.2 (–16.9, 4.5)* | –3.1 (–13.8, 7.7)* | |
| LDL-C, n | 134 | 145 | 139 |
| Mean ± SD baseline (mmol/l) | 2.8 ± 1.0 | 2.7 ± 1.1 | 2.6 ± 0.9 |
| LS mean ± SE change | 0.00 ± 0.06 | –0.02 ± 0.06 | 0.11 ± 0.06 |
| Median (IQR) per cent change | 0.2 (–12.8, 12.3) | 1.9 (–9.4, 16.9) | 5.3 (–10.0, 21.4) |
| LS mean ± SE per cent change | 3.3 ± 2.5 | 3.8 ± 2.5 | 7.8 ± 2.5 |
| Difference vs. PBO (95% CI) | 0.5 (–5.8, 6.8)† | 4.6 (–1.8, 10.9)† | |
| HDL-C, n | 135 | 145 | 141 |
| Mean ± SD baseline (mmol/l) | 1.2 ± 0.3 | 1.2 ± 0.3 | 1.1 ± 0.3 |
| LS mean ± SE change | 0.02 ± 0.02 | 0.06 ± 0.02 | 0.06 ± 0.02 |
| Median (IQR) per cent change | 1.8 (–6.7, 10.3) | 3.6 (–3.8, 14.5) | 6.9 (–2.3, 15.4) |
| LS mean ± SE per cent change | 3.1 ± 1.3 | 5.7 ± 1.3 | 6.6 ± 1.3 |
| Difference vs. PBO (95% CI) | 2.6 (–0.8, 6.0)* | 3.5 (0.1, 7.0)* | |
| LDL-C/HDL-C, n | 134 | 145 | 139 |
| Mean ± SD baseline (mol/mol) | 2.4 ± 0.9 | 2.4 ± 1.1 | 2.4 ± 0.9 |
| LS mean ± SE change | –0.03 ± 0.05 | –0.14 ± 0.05 | –0.04 ± 0.05 |
| Median (IQR) per cent change | 0.6 (–15.8, 14.3) | –4.4 (–17.4, 10.6) | –2.0 (–16.1, 13.8) |
| LS mean ± SE per cent change | 1.9 ± 2.5 | –0.8 ± 2.5 | 2.2 ± 2.5 |
| Difference vs. PBO (95% CI) | –2.7 (–8.9, 3.6)† | 0.3 (–6.0, 6.6)† | |
| Non–HDL-C, n | 133 | 145 | 141 |
| Mean ± SD baseline (mmol/l) | 3.8 ± 1.2 | 3.6 ± 1.3 | 3.7 ± 1.1 |
| LS mean ± SE change | 0.02 ± 0.07 | –0.05 ± 0.06 | 0.09 ± 0.06 |
| Median (IQR) per cent change | 0.0 (–11.6, 10.1) | –0.9 (–8.1, 10.9) | 2.0 (–9.2, 16.0) |
| LS mean ± SE per cent change | 2.9 ± 1.9 | 1.5 ± 1.8 | 5.6 ± 1.8 |
| Difference vs. PBO (95% CI) | –1.4 (–6.1, 3.3)† | 2.7 (–2.0, 7.4)† |
LOCF, last observation carried forward; PBO, placebo; CANA, canagliflozin; BP, blood pressure; SD, standard deviation; LS, least squares; SE, standard error; CI, confidence interval; IQR, interquartile range; LDL-C, low-density lipoprotein cholesterol; HDL-C, high-density lipoprotein cholesterol; NS, not significant.
p = NS vs. PBO.
Statistical comparison vs. PBO not performed (not prespecified).
Table 5.
Summary of changes from baseline in blood pressure and fasting plasma lipids at week 52 (LOCF)
| PBO | CANA 100 mg | CANA 300 mg | |
|---|---|---|---|
| Systolic BP, n | 150 | 156 | 154 |
| Mean ± SD baseline (mmHg) | 130.1 ± 13.7 | 130.4 ± 13.5 | 130.8 ± 12.8 |
| LS mean ± SE change | 0.1 ± 1.0 | –3.7 ± 1.0 | –2.9 ± 1.0 |
| Difference vs. PBO (95% CI) | –3.7 (–6.2, –1.3) | –3.0 (–5.5, –0.5) | |
| Diastolic BP, n | 150 | 156 | 154 |
| Mean ± SD baseline (mmHg) | 79.0 ± 8.3 | 78.2 ± 8.3 | 78.9 ± 8.1 |
| LS mean ± SE change | –0.7 ± 0.6 | –2.2 ± 0.6 | –1.7 ± 0.6 |
| Difference vs. PBO (95% CI) | –1.6 (–3.2, 0.1) | –1.1 (–2.7, 0.5) | |
| Triglycerides, n | 134 | 145 | 144 |
| Mean ± SD baseline (mmol/l) | 2.2 ± 1.5 | 2.1 ± 1.3 | 2.3 ± 1.5 |
| LS mean ± SE change | 0.03 ± 0.10 | 0.04 ± 0.10 | –0.14 ± 0.10 |
| Median (IQR) per cent change | –1.2 (–18.7, 22.7) | 5.3 (–19.0, 24.8) | 0.2 (–27.6, 23.7) |
| LS mean ± SE per cent change | 4.7 ± 4.6 | 8.5 ± 4.6 | 6.7 ± 4.5 |
| Difference vs. PBO (95% CI) | 3.8 (–7.8, 15.4) | 2.0 (–9.6, 13.6) | |
| LDL-C, n | 134 | 145 | 144 |
| Mean ± SD baseline (mmol/l) | 2.8 ± 1.0 | 2.7 ± 1.1 | 2.6 ± 0.9 |
| LS mean ± SE change | 0.05 ± 0.06 | 0.01 ± 0.06 | 0.22 ± 0.06 |
| Median (IQR) per cent change | 0.2 (–12.9, 12.3) | 3.6 (–11.2, 17.9) | 6.7 (–5.0, 27.6) |
| LS mean ± SE per cent change | 5.4 ± 2.8 | 4.8 ± 2.8 | 13.3 ± 2.8 |
| Difference vs. PBO (95% CI) | –0.6 (–7.7, 6.5) | 7.9 (0.8, 15.0) | |
| HDL-C, n | 135 | 145 | 144 |
| Mean ± SD baseline (mmol/l) | 1.2 ± 0.3 | 1.2 ± 0.3 | 1.1 ± 0.3 |
| LS mean ± SE change | 0.03 ± 0.02 | 0.07 ± 0.01 | 0.09 ± 0.01 |
| Median (IQR) per cent change | 0.0 (–7.0, 10.3) | 5.4 (–2.2, 14.3) | 7.3 (–2.0, 16.0) |
| LS mean ± SE per cent change | 3.3 ± 1.3 | 6.6 ± 1.3 | 8.2 ± 1.3 |
| Difference vs. PBO (95% CI) | 3.2 (–0.1, 6.5) | 4.9 (1.6, 8.2) | |
| LDL-C/HDL-C, n | 134 | 145 | 144 |
| Mean ± SD baseline (mol/mol) | 2.4 ± 0.9 | 2.4 ± 1.1 | 2.4 ± 0.9 |
| LS mean ± SE change | 0.00 ± 0.06 | –0.15 ± 0.06 | 0.03 ± 0.05 |
| Median (IQR) per cent change | 0.3 (–17.0, 14.3) | –3.3 (–17.7, 13.3) | 1.5 (–12.2, 17.8) |
| LS mean ± SE per cent change | 3.7 ± 2.7 | –0.3 ± 2.7 | 5.1 ± 2.6 |
| Difference vs. PBO (95% CI) | –4.0 (–10.8, 2.8) | 1.4 (–5.4, 8.2) | |
| Non–HDL-C, n | 133 | 145 | 144 |
| Mean ± SD baseline (mmol/l) | 3.8 ± 1.2 | 3.6 ± 1.3 | 3.7 ± 1.1 |
| LS mean ± SE change | 0.07 ± 0.07 | –0.02 ± 0.07 | 0.14 ± 0.07 |
| Median (IQR) per cent change | –0.2 (–9.8, 10.6) | 0.8 (–9.2, 14.7) | 4.9 (–10.3, 22.0) |
| LS mean ± SE per cent change | 3.9 ± 2.1 | 2.5 ± 2.1 | 7.5 ± 2.1 |
| Difference vs. PBO (95% CI) | –1.5 (–6.9, 3.9) | 3.6 (–1.8, 9.0) |
LOCF, last observation carried forward; PBO, placebo; CANA, canagliflozin; BP, blood pressure; SD, standard deviation; LS, least squares; SE, standard error; CI, confidence interval; IQR, interquartile range; LDL-C, low-density lipoprotein cholesterol; HDL-C, high-density lipoprotein cholesterol.
Canagliflozin 100 and 300 mg showed numerical increases in HDL-C and decreases in triglycerides relative to placebo at week 26, but these differences did not reach statistical significance (Table4). A numerical increase in low-density lipoprotein cholesterol (LDL-C) was observed for canagliflozin 300 mg compared with canagliflozin 100 mg and placebo at week 26, with a smaller per cent increase in non–HDL-C and no notable per cent change in the LDL-C/HDL-C ratio. At week 52, increases from baseline in HDL-C and triglycerides were seen with both canagliflozin doses compared with placebo (Table5). Changes in HDL-C at week 52 were similar to those seen at week 26, with a slightly larger per cent increase seen with canagliflozin at week 52 relative to week 26. At week 52, an increase in LDL-C compared with placebo was observed with canagliflozin 300 mg, with an increase in non–HDL-C that was smaller than that observed with LDL-C; no notable changes in LDL-C or non–HDL-C were seen with canagliflozin 100 mg relative to placebo. A larger increase in the per cent change in LDL-C from baseline from week 26 to week 52 was seen with canagliflozin 300 mg compared with canagliflozin 100 mg and placebo. The ratio of LDL-C/HDL-C was slightly decreased with canagliflozin 100 mg relative to placebo, with minimal change seen with canagliflozin 300 mg.
Glucose-related FS-MMTT end-points
In the subset of patients who underwent the FS-MMTT, dose-related reductions were observed in 2-h PPG at week 26 with canagliflozin compared with placebo (Table6). Relative to placebo, reductions from baseline in both the total AUCG and ΔAUCG were observed with both canagliflozin groups.
Table 6.
Summary of changes from baseline in glucose-related FS-MMTT end-points and indices of β-cell function at week 26 (LOCF)*
| PBO | CANA 100 mg | CANA 300 mg | |
|---|---|---|---|
| Two-hour PPG, n† | 38 | 46 | 38 |
| Mean ± SD baseline (mmol/l) | 15.5 ± 3.4 | 16.5 ± 3.7 | 16.0 ± 4.0 |
| LS mean ± SE change | –1.1 ± 0.6 | –2.6 ± 0.6 | –3.1 ± 0.6 |
| Difference vs. PBO (95% CI) | –1.5 (–3.0, –0.1) | –2.1 (–3.6, –0.5) | |
| AUCG(0–3 h), n† | 34 | 41 | 36 |
| Mean ± SD baseline (mmol/l·h) | 41.4 ± 8.2 | 44.0 ± 9.3 | 43.3 ± 8.9 |
| LS mean ± SE change | –4.3 ± 1.4 | –6.3 ± 1.3 | –9.2 ± 1.4 |
| Difference vs. PBO (95% CI) | –2.0 (–5.5, 1.6) | –4.9 (–8.5, –1.3) | |
| ΔAUCG(0–3 h), n† | 34 | 41 | 36 |
| Mean ± SD baseline (mmol/l·h) | 13.6 ± 4.5 | 14.5 ± 4.7 | 14.6 ± 4.8 |
| LS mean ± SE change | –1.8 ± 0.8 | –2.5 ± 0.8 | –3.3 ± 0.8 |
| Difference vs. PBO (95% CI) | –0.8 (–2.8, 1.2) | –1.6 (–3.6, 0.5) | |
| HOMA2-%B, n | 129 | 133 | 133 |
| Mean ± SD baseline | 55.4 ± 38.1 | 51.3 ± 32.3 | 53.0 ± 28.0 |
| LS mean ± SE change | –1.0 ± 4.8 | 12.3 ± 4.9 | 25.9 ± 4.8 |
| Difference vs. PBO (95% CI) | 13.3 (1.1, 25.5) | 26.9 (14.7, 39.1) | |
| AUCC(0–3 h), n† | 33 | 41 | 36 |
| Mean ± SD baseline (nmol/l·h) | 4.9 ± 2.0 | 5.3 ± 2.4 | 4.9 ± 2.5 |
| LS mean ± SE change | –0.4 ± 0.2 | –0.1 ± 0.2 | –0.3 ± 0.2 |
| Difference vs. PBO (95% CI) | 0.3 (–0.2, 0.8) | 0.1 (–0.4, 0.7) | |
| AUCC/AUCG ratio, n† | 33 | 40 | 35 |
| Mean ± SD baseline (pmol/mmol) | 123.1 ± 51.6 | 131.7 ± 79.8 | 122.5 ± 72.3 |
| LS mean ± SE change | –3.4 ± 10.6 | 23.7 ± 10.5 | 24.0 ± 11.1 |
| Difference vs. PBO (95% CI) | 27.1 (–0.2, 54.4) | 27.4 (–0.7, 55.6) |
FS-MMTT, frequently-sampled mixed-meal tolerance test; LOCF, last observation carried forward; PBO, placebo; CANA, canagliflozin; PPG, postprandial glucose; SD, standard deviation; LS, least squares; SE, standard error; CI, confidence interval; AUCG, glucose area under the curve; ΔAUCG, incremental glucose area under the curve; HOMA, Homeostasis Model Assessment; AUCC, C-peptide area under the curve.
Statistical comparison for CANA 100 and 300 mg vs. PBO not performed (not prespecified).
Assessed in patients who participated in the FS-MMTT.
Indices of β-cell function
At week 26, improvements in β-cell function were observed with both canagliflozin doses compared with placebo. Canagliflozin was associated with increases in HOMA2-%B among patients who participated in the FS-MMTT (Table6). Minimal changes from baseline in AUCC were seen across groups. Numerical increases in the ratio of AUCC to AUCG were seen with canagliflozin 100 and 300 mg compared with placebo.
Safety and tolerability
The overall incidence of AEs was similar across treatment groups over the 52-week treatment period (Table7). The incidence of AEs leading to study discontinuation was slightly higher with canagliflozin compared with placebo; serious AE rates were higher with placebo than with both doses of canagliflozin. During the extension period, overall incidences of AEs were higher with canagliflozin 100 and 300 mg compared with placebo (Table 8). Incidences of AEs leading to study discontinuation during the extension period were low and similar across groups; serious AE rates were higher with placebo relative to canagliflozin 100 and 300 mg. Only one serious AE was considered by the investigator as drug-related in this study, a serious AE of UTI that led to a hospitalisation in a patient in the canagliflozin 300 mg group.
Table 7.
Summary of overall safety and selected AEs over 52 weeks*
| Patients,n(%) | PBO (n = 156) | CANA 100 mg (n = 157) | CANA 300 mg (n = 156) |
|---|---|---|---|
| Any AE | 111 (71.2) | 106 (67.5) | 114 (73.1) |
| AEs leading to discontinuation | 7 (4.5) | 11 (7.0) | 12 (7.7) |
| AEs related to study drug† | 24 (15.4) | 41 (26.1) | 57 (36.5) |
| Serious AEs | 13 (8.3) | 7 (4.5) | 8 (5.1) |
| Deaths | 0 | 0 | 0 |
| Selected AEs | |||
| UTI | 12 (7.7) | 13 (8.3) | 13 (8.3) |
| Genital mycotic infection | |||
| Men‡, § | 1 (1.3) | 6 (7.9) | 5 (5.7) |
| Women¶, ** | 4 (5.0) | 15 (18.5) | 13 (18.8) |
| Osmotic diuresis-related AEs†† | 3 (1.9) | 9 (5.7) | 11 (7.1) |
| Volume-related AEs‡‡ | 3 (1.9) | 1 (0.6) | 6 (3.8) |
| Documented hypoglycaemia episodes§§ | 28 (17.9) | 53 (33.8) | 57 (36.5) |
| Severe episodes | 1 (0.6) | 1 (0.6) | 1 (0.6) |
AE, adverse event; PBO, placebo; CANA, canagliflozin; UTI, urinary tract infection.
All AEs are reported for regardless of rescue medication; hypoglycaemia episodes are reported for prior to rescue medication.
Possibly, probably, or very likely related to study drug, as assessed by investigators.
PBO, n = 76; CANA 100 mg, n = 76; CANA 300 mg, n = 87.
Including balanitis, balanitis candida, and balanoposthitis.
PBO, n = 80; CANA 100 mg, n = 81; CANA 300 mg, n = 69.
Including vaginal infection, vulvitis, vulvovaginal candidiasis, vulvovaginal mycotic infection, and vulvovaginitis.
Including dry mouth, nocturia, pollakiuria, polyuria, thirst, and urine output increased.
Including dizziness postural, hypotension, orthostatic hypotension, and syncope.
Including biochemically documented episodes (≤ 3.9 mmol/l) with or without symptoms and severe episodes (i.e. requiring the assistance of another individual or resulting in seizure or loss of consciousness).
Table 8.
Summary of overall safety and selected AEs during the 26-week double-blind extension period (weeks 26–52)*
| Patients,n(%) | PBO (n = 156) | CANA 100 mg (n = 157) | CANA 300 mg (n = 156) |
|---|---|---|---|
| Any AE | 53 (44.5) | 64 (50.4) | 72 (56.3) |
| AEs leading to discontinuation | 2 (1.7) | 2 (1.6) | 3 (2.3) |
| AEs related to study drug† | 4 (3.4) | 11 (8.7) | 21 (16.4) |
| Serious AEs | 6 (5.0) | 3 (2.4) | 2 (1.6) |
| Deaths | 0 | 0 | 0 |
| Selected AEs | |||
| UTI | 4 (3.4) | 4 (3.1) | 5 (3.9) |
| Genital mycotic infection | |||
| Menठ| 0 | 1 (1.6) | 3 (4.2) |
| Women¶, ** | 0 | 4 (6.2) | 2 (3.5) |
| Osmotic diuresis-related AEs†† | 0 | 1 (0.8) | 1 (0.8) |
| Volume-related AEs‡‡ | 1 (0.8) | 1 (0.8) | 3 (2.3) |
| Documented hypoglycaemia episodes§§ | 10 (9.7) | 28 (22.4) | 34 (27.2) |
| Severe episodes | 0 | 0 | 1 (0.8) |
AE, adverse event; PBO, placebo; CANA, canagliflozin; UTI, urinary tract infection.
All AEs are reported for regardless of rescue medication; hypoglycaemia episodes are reported for prior to rescue medication.
Possibly, probably or very likely related to study drug, as assessed by investigators.
PBO, n = 61; CANA 100 mg, n = 62; CANA 300 mg, n = 71.
Including balanitis.
PBO, n = 58; CANA 100 mg, n = 65; CANA 300 mg, n = 57.
Including vulvitis, vulvovaginal candidiasis, and vulvovaginal mycotic infection.
Including dry mouth and urine output increased.
Including dizziness postural, hypotension, and syncope.
Including biochemically documented episodes (≤ 3.9 mmol/l) with or without symptoms and severe episodes (i.e. requiring the assistance of another individual or resulting in seizure or loss of consciousness).
Over 52 weeks, both canagliflozin doses were associated with higher rates of AEs consistent with genital mycotic infections in women and men compared with placebo (Table7). These were generally mild to moderate in severity and resulted in study discontinuation in very few patients (three women and one man); most of these events were reported during the first 26 weeks of treatment. All canagliflozin-treated men with genital mycotic infections were uncircumcised, and 3 of the 11 men had a prior history of balanitis/balanoposthitis. A prior history of genital mycotic infection was also more common in women in the canagliflozin groups with a genital mycotic infection AE (36%) compared with women who received canagliflozin and did not have such an AE (17%). Genital mycotic infections were generally treated with antifungal therapies (topical and/or oral), either prescribed by the healthcare provider or self-initiated by the patient, without interruption of study drug. Incidences of UTIs were similar across treatment groups over 52 weeks.
Canagliflozin 100 and 300 mg were associated with higher rates of AEs reflecting osmotic diuresis [e.g. pollakiuria (increased urine frequency), polyuria (increased urine volume)] over 52 weeks (Table 7). Incidences of these events were low (< 4% per specific AE) and led to few study discontinuations. Incidences of AEs possibly related to volume depletion (e.g. postural dizziness, orthostatic hypotension) were low and similar across treatment groups. More patients treated with canagliflozin 100 and 300 mg than placebo had ≥ 1 documented hypoglycaemia episode (33.8%, 36.5% and 17.9%, respectively) over 52 weeks of treatment (Table7); differences (95% CI) vs. placebo were 15.8% (5.6, 26.0) for canagliflozin 100 mg and 18.6% (8.3, 28.9) for canagliflozin 300 mg. One patient in each treatment group experienced a severe hypoglycaemia event.
Overall, there were only minor differences seen in mean per cent changes in laboratory parameters with canagliflozin compared with placebo over 52 weeks (Table9). Canagliflozin 100 and 300 mg were associated with moderate reductions from baseline in alanine aminotransferase (–3.8% and –9.7%, respectively), while a modest increase was seen with placebo (6.6%). Moderate reductions in gamma glutamyl transferase were also observed with canagliflozin 100 and 300 mg compared with an increase seen with placebo (–12.3%, –8.6%, and 36.0%, respectively). Small increases in serum creatinine were seen with canagliflozin 300 mg relative to canagliflozin 100 mg and placebo (7.7%, 2.5%, and 2.8%, respectively), with commensurate decreases observed in eGFR (–5.8%, –1.6%, and –1.9%, respectively). Moderate increases in blood urea nitrogen were observed for canagliflozin 100 and 300 mg compared with placebo (14.5%, 17.5%, and 5.5%, respectively). Decreases in serum urate were seen with canagliflozin 100 and 300 mg compared with placebo (–8.8%, –9.4%, and 0.7%, respectively). Small increases in haemoglobin were observed with canagliflozin 100 and 300 mg compared with a slight decrease seen with placebo (4.2%, 4.4%, and –1.6%, respectively). No meaningful changes from baseline were observed in serum electrolytes, including chloride, potassium, sodium, or phosphate (Table9). A small to moderate increase in magnesium was observed with canagliflozin 100 and 300 mg compared with a slight decrease seen with placebo (7.1%, 9.7%, and –1.1%, respectively).
Table 9.
Mean per cent changes in clinical laboratory parameters from baseline to week 52
| Parameter | PBO | CANA 100 mg | CANA 300 mg |
|---|---|---|---|
| ALT, n | 88 | 107 | 108 |
| Mean baseline (U/l) | 28.6 | 29.4 | 29.7 |
| Mean (SD) per cent change | 6.6 ± 48.2 | –3.8 ± 31.5 | –9.7 ± 33.2 |
| BUN, n | 89 | 108 | 109 |
| Mean baseline (mmol/l) | 5.6 | 5.5 | 5.6 |
| Mean (SD) per cent change | 5.5 ± 24.5 | 14.5 ± 29.0 | 17.5 ± 29.3 |
| Chloride | 89 | 108 | 109 |
| Mean baseline (mmol/l) | 101.6 | 101.4 | 101.5 |
| Mean (SD) per cent change | 0.1 ± 2.9 | 0.6 ± 2.6 | 0.6 ± 2.3 |
| Creatinine | 89 | 108 | 109 |
| Mean baseline (μmol/l) | 72.9 | 70.3 | 71.3 |
| Mean (SD) per cent change | 2.8 ± 12.2 | 2.5 ± 11.8 | 7.7 ± 20.5 |
| eGFR, n | 89 | 108 | 109 |
| Mean baseline (ml/min/1.73 m2) | 87.4 | 91.0 | 91.9 |
| Mean (SD) per cent change | –1.9 ± 12.9 | –1.6 ± 13.7 | –5.8 ± 14.5 |
| Magnesium, n | 89 | 108 | 109 |
| Mean baseline (mmol/l) | 0.8 | 0.8 | 0.8 |
| Mean (SD) per cent change | –1.1 ± 7.8 | 7.1 ± 10.3 | 9.7 ± 9.5 |
| Phosphate, n | 89 | 108 | 109 |
| Mean baseline (mmol/l) | 1.2 | 1.2 | 1.2 |
| Mean (SD) per cent change | 4.6 ± 15.0 | 2.2 ± 14.6 | 4.2 ± 14.5 |
| Potassium, n | 89 | 108 | 109 |
| Mean baseline (mmol/l) | 4.4 | 4.4 | 4.4 |
| Mean (SD) per cent change | 1.7 ± 9.9 | 1.3 ± 10.0 | 0.6 ± 8.7 |
| Sodium, n | 89 | 108 | 109 |
| Mean baseline (mmol/l) | 139.4 | 139.6 | 139.5 |
| Mean (SD) per cent change | 0.7 ± 2.4 | 0.7 ± 1.9 | 0.5 ± 1.8 |
| Urate, n | 89 | 108 | 109 |
| Mean baseline (μmol/l) | 332.9 | 322.3 | 340.1 |
| Mean (SD) per cent change | 0.7 ± 20.2 | –8.8 ± 20.4 | –9.4 ± 17.5 |
| Haemoglobin, n | 86 | 105 | 107 |
| Mean baseline (g/l) | 142.4 | 140.1 | 141.4 |
| Mean (SD) per cent change | –1.6 ± 6.0 | 4.2 ± 5.7 | 4.4 ± 5.8 |
PBO, placebo; CANA, canagliflozin; ALT, alanine aminotransferase; SD, standard deviation; BUN, blood urea nitrogen; eGFR, estimated glomerular filtration rate.
Discussion
Over time, many T2DM patients require a combination of therapies, and eventually insulin, to maintain glycaemic control 2. Some currently available OADs are associated with adverse effects, including weight gain and increased risk of hypoglycaemia that can limit efficacy. In this study of patients with T2DM inadequately controlled with metformin plus sulphonylurea, treatment with canagliflozin 100 and 300 mg improved glycaemic control and reduced body weight compared with placebo over 52 weeks.
The reductions in HbA1c seen with canagliflozin 100 and 300 mg relative to placebo over 52 weeks in a patient population with baseline HbA1c values reflecting only mild to moderate hyperglycaemia suggest clinically valuable efficacy 22. HbA1c and FPG profiles over time demonstrated sustained effects of canagliflozin over the 52-week treatment period. Canagliflozin also provided reductions compared with placebo in 2-h PPG, AUCG, and ΔAUCG at week 26 in patients who underwent the FS-MMTT. Improvements in glycaemic control have also been observed with other SGLT2 inhibitors 18,23–25.
In addition, canagliflozin 100 and 300 mg showed greater body weight reduction compared with placebo over 52 weeks. While body composition measurements were not performed in this study, analyses conducted in other Phase 3 studies in patients with T2DM showed that approximately two-thirds of the reduction in body mass seen with canagliflozin was from fat mass and one-third was from lean body mass 9,26. In clinical studies of weight loss, modest reductions in body weight have been associated with favourable improvements in cardiovascular risk factors, including lipids, BP, and inflammatory markers 27. While the mechanism of weight loss with canagliflozin remains to be fully determined, it is likely related to the loss of calories associated with UGE.
Canagliflozin was also associated with a decrease in systolic BP and an increase in HDL-C compared with placebo over 52 weeks; only slight changes from baseline were seen in triglycerides across treatment groups. Canagliflozin 300 mg was associated with an increase in LDL-C compared with placebo at week 52, with an increase in non–HDL-C that was smaller than that observed with LDL-C; similar changes in LDL-C and non–HDL-C were seen with canagliflozin 100 mg and placebo. Minimal changes in LDL-C/HDL-C ratio were seen with canagliflozin 300 mg; a slight decrease was seen with canagliflozin 100 mg relative to placebo. While the mechanism of LDL-C increase with canagliflozin is unknown, it may reflect downstream metabolic effects of UGE, as well as modest haemoconcentration resulting from canagliflozin's osmotic diuretic effect (which has been reported with diuretic agents) 28. The clinical implications of changes in glycaemic control, body weight, BP, and lipids with canagliflozin are being assessed in the ongoing CANagliflozin cardioVascular Assessment Study (CANVAS). In a meta-analysis of cardiovascular events across the canagliflozin Phase 3 clinical trial program, no increase in cardiovascular risk was observed with canagliflozin treatment 29.
Progressive β-cell dysfunction is believed to be a critical factor in the pathogenesis of hyperglycaemia in T2DM; since glucotoxicity further reduces β-cell dysfunction, a vicious cycle ensues that contributes to this progressive loss of function 30. By decreasing hyperglycaemia through a non–insulin-dependent mechanism, canagliflozin may indirectly improve β-cell function, but whether this will translate into a reduction in the rate of progression of T2DM requires further study. In this study, canagliflozin was associated with improvements in measures of β-cell function (HOMA2-%B and AUCC/AUCG ratio) compared with placebo at week 26. These findings are consistent with improvements in measures of β-cell function expected with glucose-lowering therapy and observed in previous studies evaluating canagliflozin in patients with T2DM 5,31–33. The improvements in indices of β-cell function with canagliflozin were because of stable C-peptide concentrations in the presence of decreased plasma glucose concentrations, similar to observations with other antidiabetic agents known to increase β-cell function 34–36.
Canagliflozin 100 and 300 mg were generally well tolerated over 52 weeks, consistent with previous reports 5. Canagliflozin was associated with higher rates of genital mycotic infections; these were generally mild or moderate in severity, treated by antifungal therapies, and led to few study discontinuations. Because of its mechanism of action, canagliflozin treatment results in osmotic diuresis; incidences of AEs related to osmotic diuresis (e.g. pollakiuria, polyuria) were low in this study but were increased with canagliflozin compared with placebo. However, AEs related to volume depletion (e.g. postural dizziness, hypotension) were generally low and similar across treatment groups. Consistent with the small decrease in fluid volume with canagliflozin, a moderate increase in blood urea nitrogen and a smaller change in serum creatinine were seen. The overall safety and tolerability findings observed with canagliflozin were generally consistent with those seen with other SGLT2 inhibitors 18,23–25.
An increased incidence of hypoglycaemia relative to placebo was seen with canagliflozin, but the rate of severe events was not increased. This was not unexpected, as prior studies have shown an increase in hypoglycaemia events when antihyperglycaemic agents that are not generally associated with hypoglycaemia are added to treatment regimens associated with hypoglycaemia, including sulphonylurea and insulin therapy 21,37–40. In patients with T2DM, canagliflozin has been shown to reduce RTG to approximately 4.4–5.0 mmol/l (80–90 mg/dl) 5,41, a range that is above the threshold for hypoglycaemia [≤ 3.9 mmol/l (70 mg/dl)]. Other Phase 3 studies conducted in patients with T2DM have shown a low incidence of hypoglycaemia with canagliflozin when not used in combination with agents that are associated with hypoglycaemia 6,7,9,10. In a study comparing canagliflozin 300 mg with sitagliptin 100 mg (an agent considered to be associated with a low hypoglycaemia risk) in patients with T2DM on background metformin and sulphonylurea, a similar incidence of documented hypoglycaemia was seen with the two agents, despite a 0.4% greater reduction in HbA1c seen with canagliflozin vs. sitagliptin 8. In practice, it will be important for clinicians to consider the risk of hypoglycaemia if canagliflozin is added to the combination of metformin and a sulphonylurea and recommend appropriate glucose monitoring with consideration of lowering the dose of sulphonylurea if hypoglycaemia occurs.
One limitation of this study was the lack of an active comparator group, but a separate Phase 3 study has evaluated the efficacy of canagliflozin 300 mg vs. sitagliptin 100 mg in patients on background metformin plus sulphonylurea 8. In addition, this study enrolled patients inadequately controlled on metformin plus sulphonylurea with a reasonably wide range of baseline HbA1c (≥ 7.0% to ≤ 10.5%); thus, these results may not be generalisable to patients on other background antihyperglycaemic agents or those with milder or more severe hyperglycaemia at baseline. Longer term studies are also needed to evaluate the durability of effects associated with canagliflozin treatment.
In conclusion, canagliflozin 100 and 300 mg improved glycaemic control, reduced body weight, and were generally well tolerated compared with placebo over 52 weeks in patients with T2DM inadequately controlled with metformin plus sulphonylurea. Canagliflozin may therefore provide a new treatment option for this patient population. Results from ongoing Phase 3 studies will provide greater insight into the long-term efficacy and safety of canagliflozin in various T2DM treatment settings.
Acknowledgments
This study was supported by Janssen Research & Development, LLC. The authors acknowledge Dainius A. Balis, PharmD, Janssen Research & Development, LLC, for his assistance in clinical review of patient safety and adherence to the study protocol. The authors acknowledge Ling Deng, PhD, previously of Janssen Research & Development, LLC, for her contributions in the analysis and interpretation of study data. The authors thank all investigators, study teams, and patients for participating in this study. Editorial support was provided by Lisa Shannon, PharmD, of MedErgy, and was funded by Janssen Global Services, LLC.
Canagliflozin has been developed by Janssen Research & Development, LLC, in collaboration with Mitsubishi Tanabe Pharma Corporation.
This study was previously presented, in part, in abstract form at the 72nd Scientific Sessions of the American Diabetes Association, Philadelphia, PA, 8–12 June, 2012, at the 48th Annual Meeting of the European Association for the Study of Diabetes, Berlin, Germany, 1–5 October, 2012, and at the 49th Annual Meeting of the European Association for the Study of Diabetes, Barcelona, Spain, 23-27 September, 2013.
Author contributions
J.W., G.C., P.H., G.G., C.M., F.V., S.B., and G.M. contributed to the conduct of the study and the acquisition, analysis, and interpretation of data, and reviewed and approved the manuscript. K.U. and W.C. contributed to the design and conduct of the study and the acquisition, analysis, and interpretation of data, and reviewed and approved the manuscript. G.L. contributed to the analysis and interpretation of data, and reviewed and approved the manuscript.
References
- 1.American Diabetes Association. Standards of medical care in diabetes–2012. Diabetes Care. 2012;35:S11–63. doi: 10.2337/dc12-s011. [DOI] [PMC free article] [PubMed] [Google Scholar]
- 2.Inzucchi SE, Bergenstal RM, Buse JB, et al. Management of hyperglycemia in type 2 diabetes: a patient-centered approach. Position statement of the American Diabetes Association (ADA) and the European Association for the Study of Diabetes (EASD) Diabetes Care. 2012;35:1364–79. doi: 10.2337/dc12-0413. [DOI] [PMC free article] [PubMed] [Google Scholar]
- 3.Cook MN, Girman CJ, Stein PP, Alexander CM, Holman RR. Glycemic control continues to deteriorate after sulfonylureas are added to metformin among patients with type 2 diabetes. Diabetes Care. 2005;28:995–1000. doi: 10.2337/diacare.28.5.995. [DOI] [PubMed] [Google Scholar]
- 4.Gross JL, Kramer CK, Leitao CB, et al. Effect of antihyperglycemic agents added to metformin and a sulfonylurea on glycemic control and weight gain in type 2 diabetes: a network meta-analysis. Ann Intern Med. 2011;154:672–9. doi: 10.7326/0003-4819-154-10-201105170-00007. [DOI] [PubMed] [Google Scholar]
- 5.Rosenstock J, Aggarwal N, Polidori D, et al. Dose-ranging effects of canagliflozin, a sodium-glucose cotransporter 2 inhibitor, as add-on to metformin in subjects with type 2 diabetes. Diabetes Care. 2012;35:1232–8. doi: 10.2337/dc11-1926. [DOI] [PMC free article] [PubMed] [Google Scholar]
- 6.Stenlöf K, Cefalu WT, Kim K-A, et al. Efficacy and safety of canagliflozin monotherapy in subjects with type 2 diabetes mellitus inadequately controlled with diet and exercise. Diabetes Obes Metab. 2013;15:372–82. doi: 10.1111/dom.12054. [DOI] [PMC free article] [PubMed] [Google Scholar]
- 7.Yale JF, Bakris G, Cariou B, et al. Efficacy and safety of canagliflozin in subjects with type 2 diabetes and chronic kidney disease. Diabetes Obes Metab. 2013;15:463–73. doi: 10.1111/dom.12090. [DOI] [PMC free article] [PubMed] [Google Scholar]
- 8.Schernthaner G, Gross JL, Rosenstock J, et al. Canagliflozin compared with sitagliptin for patients with type 2 diabetes who do not have adequate glycemic control with metformin plus sulfonylurea: a 52-week, randomized trial. Diabetes Care. 2013;36:2508–15. doi: 10.2337/dc12-2491. [DOI] [PMC free article] [PubMed] [Google Scholar]
- 9.Cefalu WT, Leiter LA, Yoon K-H, et al. Efficacy and safety of canagliflozin versus glimepiride in patients with type 2 diabetes inadequately controlled with metformin (CANTATA-SU): 52 week results from a randomised, double-blind, phase 3 non-inferiority trial. Lancet. 2013;382:941–50. doi: 10.1016/S0140-6736(13)60683-2. [DOI] [PubMed] [Google Scholar]
- 10.Bode B, Stenlof K, Sullivan D, Fung A, Usiskin K. Efficacy and safety of canagliflozin in older subjects with type 2 diabetes: a randomized trial. Hosp Pract. 2013;41:72–84. doi: 10.3810/hp.2013.04.1020. [DOI] [PubMed] [Google Scholar]
- 11.Wright EM, Loo DD, Hirayama BA. Biology of human sodium glucose transporters. Physiol Rev. 2011;91:733–94. doi: 10.1152/physrev.00055.2009. [DOI] [PubMed] [Google Scholar]
- 12.Farber SJ, Berger EY, Earle DP. Effect of diabetes and insulin of the maximum capacity of the renal tubules to reabsorb glucose. J Clin Invest. 1951;30:125–9. doi: 10.1172/JCI102424. [DOI] [PMC free article] [PubMed] [Google Scholar]
- 13.Rave K, Nosek L, Posner J, Heise T, Roggen K, van Hoogdalem EJ. Renal glucose excretion as a function of blood glucose concentration in subjects with type 2 diabetes – results of a hyperglycaemic glucose clamp study. Nephrol Dial Transplant. 2006;21:2166–71. doi: 10.1093/ndt/gfl175. [DOI] [PubMed] [Google Scholar]
- 14.Liang Y, Arakawa K, Ueta K, et al. Effect of canagliflozin on renal threshold for glucose, glycemia, and body weight in normal and diabetic animal models. PLoS ONE. 2012;7:e30555. doi: 10.1371/journal.pone.0030555. [DOI] [PMC free article] [PubMed] [Google Scholar]
- 15.Devineni D, Morrow L, Hompesch M, et al. Canagliflozin improves glycemic control over 28 days in subjects with type 2 diabetes not optimally controlled on insulin. Diabetes Obes Metab. 2012;14:539–45. doi: 10.1111/j.1463-1326.2012.01558.x. [DOI] [PubMed] [Google Scholar]
- 16.Defronzo RA. Banting lecture. from the triumvirate to the ominous octet: a new paradigm for the treatment of type 2 diabetes mellitus. Diabetes. 2009;58:773–95. doi: 10.2337/db09-9028. [DOI] [PMC free article] [PubMed] [Google Scholar]
- 17.Liu JJ, Lee T, Defronzo RA. Why Do SGLT2 inhibitors inhibit only 30-50% of renal glucose reabsorption in humans? Diabetes. 2012;61:2199–204. doi: 10.2337/db12-0052. [DOI] [PMC free article] [PubMed] [Google Scholar]
- 18.Bailey CJ, Gross JL, Pieters A, Bastien A, List JF. Effect of dapagliflozin in patients with type 2 diabetes who have inadequate glycaemic control with metformin: a randomised, double-blind, placebo-controlled trial. Lancet. 2010;375:2223–33. doi: 10.1016/S0140-6736(10)60407-2. [DOI] [PubMed] [Google Scholar]
- 19.Nauck MA, Del PS, Meier JJ, et al. Dapagliflozin versus glipizide as add-on therapy in patients with type 2 diabetes who have inadequate glycemic control with metformin: a randomized, 52-week, double-blind, active-controlled noninferiority trial. Diabetes Care. 2011;34:2015–22. doi: 10.2337/dc11-0606. [DOI] [PMC free article] [PubMed] [Google Scholar]
- 20.Rosenstock J, Vico M, Wei L, Salsali A, List JF. Effects of dapagliflozin, a sodium-glucose cotransporter-2 inhibitor, on hemoglobin A1c, body weight, and hypoglycemia risk in patients with type 2 diabetes inadequately controlled on pioglitazone monotherapy. Diabetes Care. 2012;35:1473–8. doi: 10.2337/dc11-1693. [DOI] [PMC free article] [PubMed] [Google Scholar]
- 21.Strojek K, Yoon KH, Hruba V, Elze M, Langkilde AM, Parikh S. Effect of dapagliflozin in patients with type 2 diabetes who have inadequate glycaemic control with glimepiride: a randomized, 24-week, double-blind, placebo-controlled trial. Diabetes Obes Metab. 2011;13:928–38. doi: 10.1111/j.1463-1326.2011.01434.x. [DOI] [PubMed] [Google Scholar]
- 22.Bloomgarden ZT, Dodis R, Viscoli CM, Holmboe ES, Inzucchi SE. Lower baseline glycemia reduces apparent oral agent glucose-lowering efficacy: a meta-regression analysis. Diabetes Care. 2006;29:2137–9. doi: 10.2337/dc06-1120. [DOI] [PubMed] [Google Scholar]
- 23.Bailey CJ, Gross JL, Hennicken D, Iqbal N, Mansfield TA, List JF. Dapagliflozin add-on to metformin in type 2 diabetes inadequately controlled with metformin: a randomized, double-blind, placebo-controlled 102-week trial. BMC Med. 2013;11:43. doi: 10.1186/1741-7015-11-43. [DOI] [PMC free article] [PubMed] [Google Scholar]
- 24.Ferrannini E, Ramos SJ, Salsali A, Tang W, List JF. Dapagliflozin monotherapy in type 2 diabetic patients with inadequate glycemic control by diet and exercise: a randomized, double-blind, placebo-controlled, phase 3 trial. Diabetes Care. 2010;33:2217–24. doi: 10.2337/dc10-0612. [DOI] [PMC free article] [PubMed] [Google Scholar]
- 25.Ferrannini E, Seman L, Seewaldt-Becker E, Hantel S, Pinnetti S, Woerle HJ. A Phase IIb, randomized, placebo-controlled study of the SGLT2 inhibitor empagliflozin in patients with type 2 diabetes. Diabetes Obes Metab. 2013;15:721–8. doi: 10.1111/dom.12081. [DOI] [PubMed] [Google Scholar]
- 26.Toubro S, Cefalu WT, Xie J, et al. Canagliflozin, a sodium glucose co-transporter 2 inhibitor, reduces body weight mainly through loss of fat mass in subjects with type 2 diabetes. Diabetologia. 2012;55:S313–4. [Abstract 762] [Google Scholar]
- 27.Klein S, Burke LE, Bray GA, et al. Clinical implications of obesity with specific focus on cardiovascular disease: a statement for professionals from the American Heart Association Council on Nutrition, Physical Activity, and Metabolism: endorsed by the American College of Cardiology Foundation. Circulation. 2004;110:2952–67. doi: 10.1161/01.CIR.0000145546.97738.1E. [DOI] [PubMed] [Google Scholar]
- 28.Weidmann P, de Courten M, Ferrari P. Effect of diuretics on the plasma lipid profile. Eur Heart J. 1992;13(Suppl. G):61–7. doi: 10.1093/eurheartj/13.suppl_g.61. [DOI] [PubMed] [Google Scholar]
- 29.Janssen Research & Development LLC. Endocrinologic and metabolic drugs advisory committee January 10, 2013. Canagliflozin as an adjunctive treatment to diet and exercise alone or co-administered with other antihyperglycemic agents to improve glycemic control in adults with type 2 diabetes mellitus. JNJ-28431754 (Canagliflozin). NDA 204042. Available at: http://www.fda.gov/downloads/AdvisoryCommittees/CommitteesMeetingMaterials/Drugs/EndocrinologicandMetabolicDrugsAdvisoryCommittee/UCM334551.pdf. (accessed 16 August 2013)
- 30.Kahn SE. Clinical review 135: the importance of beta-cell failure in the development and progression of type 2 diabetes. J Clin Endocrinol Metab. 2001;86:4047–58. doi: 10.1210/jcem.86.9.7713. [DOI] [PubMed] [Google Scholar]
- 31.Polidori D, Zhao Y, Sha S, Canovatchel W. Canagliflozin treatment improves beta cell function in subjects with type 2 diabetes. Diabetes. 2010;59:A176. [Abstract 646-P] [Google Scholar]
- 32.Polidori D, Zhao Y, Alba M, Ferrannini E. Treatment with canagliflozin (CANA), a sodium glucose co-transporter 2 (SGLT2) inhibitor, for 26 weeks improves indices of beta-cell function (BCF) Diabetes. 2012;61:A265. [Abstract 1032-P] [Google Scholar]
- 33.Polidori D, Vercruysse F, Ferrannini E. Canagliflozin, a sodium glucose co-transporter 2 (SGLT2) inhibitor, improves indices of β-cell function in patients with type 2 diabetes on metformin plus sulphonylurea. Diabetologia. 2012;55:S313. doi: 10.1007/s00125-014-3196-x. [Abstract 761] [DOI] [PMC free article] [PubMed] [Google Scholar]
- 34.Mari A, Sallas WM, He YL, et al. Vildagliptin, a dipeptidyl peptidase-IV inhibitor, improves model-assessed beta-cell function in patients with type 2 diabetes. J Clin Endocrinol Metab. 2005;90:4888–94. doi: 10.1210/jc.2004-2460. [DOI] [PubMed] [Google Scholar]
- 35.Mari A, Degn K, Brock B, Rungby J, Ferrannini E, Schmitz O. Effects of the long-acting human glucagon-like peptide-1 analog liraglutide on beta-cell function in normal living conditions. Diabetes Care. 2007;30:2032–3. doi: 10.2337/dc07-0310. [DOI] [PubMed] [Google Scholar]
- 36.Xu L, Man CD, Charbonnel B, et al. Effect of sitagliptin, a dipeptidyl peptidase-4 inhibitor, on beta-cell function in patients with type 2 diabetes: a model-based approach. Diabetes Obes Metab. 2008;10:1212–20. doi: 10.1111/j.1463-1326.2008.00887.x. [DOI] [PubMed] [Google Scholar]
- 37.Hermansen K, Kipnes M, Luo E, Fanurik D, Khatami H, Stein P. Efficacy and safety of the dipeptidyl peptidase-4 inhibitor, sitagliptin, in patients with type 2 diabetes mellitus inadequately controlled on glimepiride alone or on glimepiride and metformin. Diabetes Obes Metab. 2007;9:733–45. doi: 10.1111/j.1463-1326.2007.00744.x. [DOI] [PubMed] [Google Scholar]
- 38.Marre M, Shaw J, Brandle M, et al. Liraglutide, a once-daily human GLP-1 analogue, added to a sulphonylurea over 26 weeks produces greater improvements in glycaemic and weight control compared with adding rosiglitazone or placebo in subjects with Type 2 diabetes (LEAD-1 SU) Diabet Med. 2009;26:268–78. doi: 10.1111/j.1464-5491.2009.02666.x. [DOI] [PMC free article] [PubMed] [Google Scholar]
- 39.Vilsboll T, Rosenstock J, Yki-Jarvinen H, et al. Efficacy and safety of sitagliptin when added to insulin therapy in patients with type 2 diabetes. Diabetes Obes Metab. 2010;12:167–77. doi: 10.1111/j.1463-1326.2009.01173.x. [DOI] [PubMed] [Google Scholar]
- 40.Wilding JP, Woo V, Soler NG, et al. Long-term efficacy of dapagliflozin in patients with type 2 diabetes mellitus receiving high doses of insulin: a randomized trial. Ann Intern Med. 2012;156:405–15. doi: 10.7326/0003-4819-156-6-201203200-00003. [DOI] [PubMed] [Google Scholar]
- 41.Sha S, Devineni D, Ghosh A, et al. Canagliflozin, a novel inhibitor of sodium glucose co-transporter 2, dose dependently reduces calculated renal threshold for glucose excretion and increases urinary glucose excretion in healthy subjects. Diabetes Obes Metab. 2011;13:669–72. doi: 10.1111/j.1463-1326.2011.01406.x. [DOI] [PubMed] [Google Scholar]