Abstract
Computerized liver volumetry has been studied, because the current “gold-standard” manual volumetry is subjective and very time-consuming. Liver volumetry is done in either CT or MRI. A number of researchers have developed computerized liver segmentation in CT, but there are fewer studies on ones for MRI. Our purpose in this study was to develop a general framework for liver segmentation in both CT and MRI. Our scheme consisted of 1) an anisotropic diffusion filter to reduce noise while preserving liver structures, 2) a scale-specific gradient magnitude filter to enhance liver boundaries, 3) a fast-marching algorithm to roughly determine liver boundaries, and 4) a geodesic-active-contour model coupled with a level-set algorithm to refine the initial boundaries. Our CT database contained hepatic CT scans of 18 liver donors obtained under a liver transplant protocol. Our MRI database contains 23 patients with 1.5T MRI scanners. To establish “gold-standard” liver volumes, radiologists manually traced the contour of the liver on each CT or MR slice. We compared our computer volumetry with “gold-standard” manual volumetry. Computer volumetry in CT and MRI reached excellent agreement with manual volumetry (intra-class correlation coefficient = 0.94 and 0.98, respectively). Average user time for computer volumetry in CT and MRI was 0.57 ± 0.06 and 1.0 ± 0.13 min. per case, respectively, whereas those for manual volumetry were 39.4 ± 5.5 and 24.0 ± 4.4 min. per case, respectively, with statistically significant difference (p < .05). Our computerized liver segmentation framework provides an efficient and accurate way of measuring liver volumes in both CT and MRI.
I. Introduction
Assessment of the liver volume is crucial in liver transplantation because graft size is a major predictor of success for both donor and recipient. Thus, accurate, noninvasive liver volumetry is necessary [1–4] for planning liver transplantation. CT or MRI is used for assessing the liver volume. Manual tracing of the liver boundary on each image is the current “gold-standard” technique for liver volume calculation. Although manual tracing provides accurate results, it is very time-consuming and subjective. It takes more than 30 minutes on average to determine the liver volume for one patient [5]. In addition, manual volumetry has relatively large intra- and inter-observer variations. To address this issue, a number of researchers have developed computerized liver segmentation schemes in CT [5–11]. However, there are fewer studies on ones for MRI [12–14]. We have developed a computerized scheme for liver volumetry for CT [15,16]. However, it was not clear that the same methodology was applicable to MRI liver volumetry. No study on the development of a computerized scheme for liver volumetry for both CT and MRI has been reported. Our purpose in this study was to develop a general framework for liver segmentation in both CT and MRI.
II. Liver Segmentation Framework
A. Anisotropic diffusion noise reduction
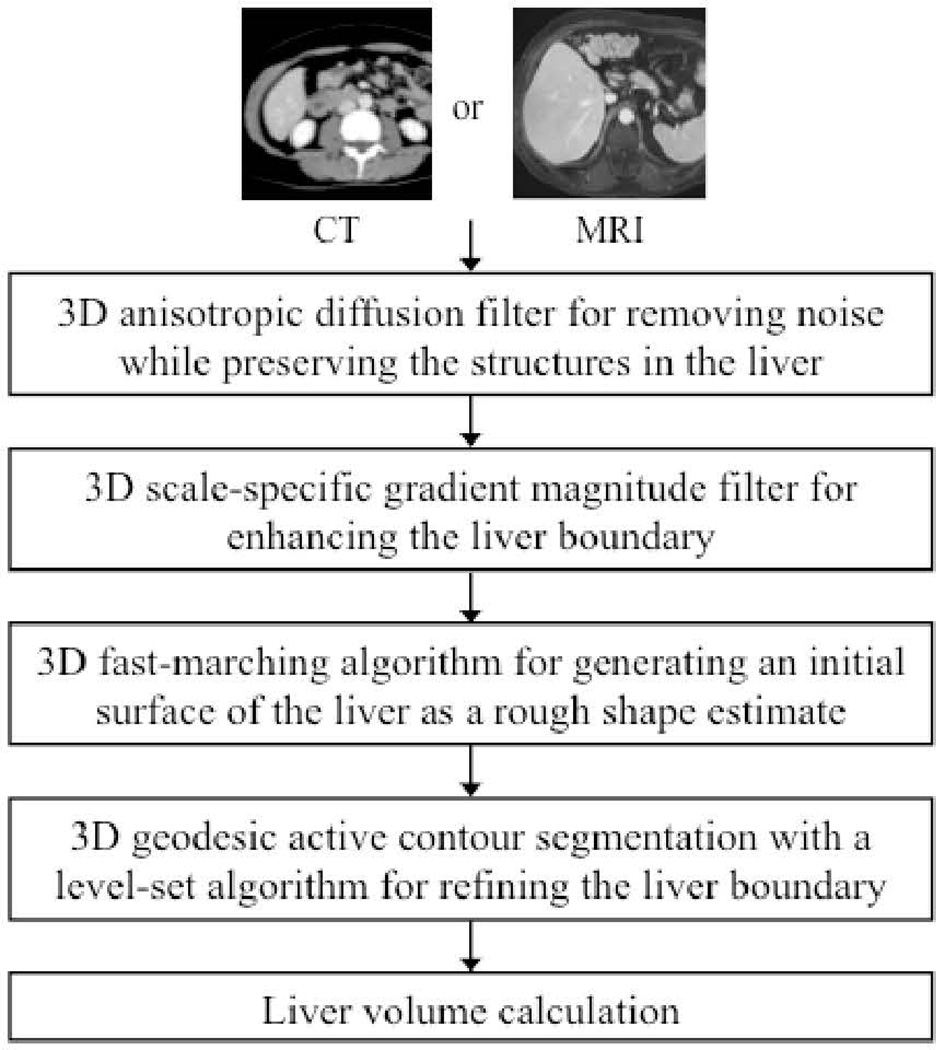
We have developed a computerized liver volumetry framework for both CT [15,16] and MRI [17] that is based on fast marching and geodesic active contour segmentation [18] coupled with level-set contour evolution [19], as shown in Fig. 1. To reduce noise without sacrificing detailed structures in the liver, we employed an anisotropic diffusion filter [20]. The anisotropic diffusion filter follows a differential equation called a modified curvature diffusion equation [21]:
| (1) |
where ∇ is the gradient operator, f is a CT or MR image,
| (2) |
is the diffusion coefficient, and K is a user-specified conductance parameter to control the filter’s sensitivity to edge contrast.
Figure 1.
Flow chart of our computerized liver segmentation framework for both CT and MRI.
B. Scale-specific gradient magnitude filter
A scale-specific gradient magnitude filter was applied to the noise-reduced CT or MR images to enhance the liver boundaries for the succeeding level-set-based segmentation. The scale of enhancing edges is controlled by the standard deviation σ of a Gaussian filter applying to the noise-reduced image. The following differential operator was used for calculating the magnitude of the image gradient at each voxel:
| (3) |
where fG is a Gaussian filtered image.
C. Fast-marching initial segmentation
Segmentation of the liver from a CT or MR volume was accomplished by use of a two-step approach involving fast marching segmentation and a geodesic active contour model [18] with a level-set methodology [19]. The fast-marching algorithm [22] was used to estimate an initial rough contour of the liver. The fast-marching level-set algorithm [22] is a simplified, efficient version of general level-set algorithms. In the fast-marching level-set algorithm, the evolution of a closed contour is expressed as a function of time, t, with speed, F(p), in the normal direction at a point, p, on the contour. The time at which the contour crosses a point, p, is obtained by solving the following partial differential equation, called the Hamilton-Jacobi equation:
| (4) |
where ψ(p, t) is a level-set function, with the initial level set at t=0 given by
| (5) |
and Γ a closed contour (curve) in R2 space.
D. Level-set geodesic active contouring
Next, a geodesic-active-contour level-set segmentation refined the initial contour (i.e., the initial level set) determined by the fast-marching algorithm to approximate the liver boundaries more precisely. The evolution of a geodesic-active-contour level-set function, ψ(p, t), is controlled by the following partial differential equation:
| (6) |
where A is an advection vector function, F is an expansion (or speed) function, and Z is a spatial modifier function for the mean curvature κ. The user-defined scalar constants α, β and γ allow us to determine the extent to which each of the three functions (advection, expansion, and curvature) affect the change, dψ/dt, of the contour of the level set, ψ.
III. Databases of Liver CT and MRI
A. CT Cases
Our database for CT consisted of dynamic contrast-enhanced hepatic CT scans of 18 living liver donors at the University of Chicago Medical Center. The patients’ mean age was 33.1 ± 10.3 years. There were 10 women (mean age, 33.2 ± 10.9) and 8 men (mean age, 33.0 ± 10.2). Scans were obtained under a liver transplant protocol with a multi-detector CT system with a 16-, 40-, or 64-channel detector scanner (Brilliance, Philips Medical Systems, Amsterdam, Netherlands). Nonionic contrast medium (iohexol, Omnipaque 350; Nycomed Amersham, Princeton, NJ) of 120–150 cc (mean, 125 ± 8) was administered to the patients intravenously for acquisition of arterial- and portal-venous-phase CT images. The CT scanning parameters included collimation of 3 (n=11), 4 (n=4), or 5 mm (n=3) and reconstruction intervals of 2.5 (n=2), 3.0 (n=13), or 4.0 mm (n=3). Each reconstructed CT slice had a matrix size of 512 × 512 pixels, with an in-plane pixel size of 0.53–0.85 mm (mean: 0.68 ± 0.08).
B. MR/Cases
Twenty-three patients (14 male and 9 female patients; ages ranged from 46 to 84 years) were scanned in the supine position with 1.5T MRI scanners (Signa HDx/HDxt, GE Medical Systems, Milwaukee, WI; and Achieva, Philips Medical Systems, Cleveland, OH) at the University of Chicago Medical Center. Intravenous gadolinium contrast agent (8–20 mL; mean: 15.3±4.2 mL) was administrated. Post-contrast MR images were obtained by use of TI-weighted liver acquisition with volume acceleration (LAV A) or T1-weighted high-resolution isotropic volume examination (THRIVE) sequence. The scanning parameters included collimation of 5 mm (for the GE system) or 4 mm (for the Philips system) and reconstruction intervals of 2.5 mm (for the GE system) or 2 mm (for the Philips system). Each MR slice had a matrix size of 256×256, 384×384, or 512×512 pixels with an in-plane pixel size ranging from 1.17 to 1.72 mm. The 23 cases in our database had liver diseases (hepatocellular carcinoma in 11 cases and metastasis in 12 cases).
C. “Gold-standard” manual segmentation
The manual liver contours in CT and MR images were traced carefully by board-certified abdominal radiologists on each slice containing the liver. The number of slices in each CT case and MR case ranged from 52 to 77 (average: 62.3) and from 88 to 120 (average: 97.9), respectively. The time required to complete the manual tracing was recorded. To calculate the entire liver volume for each case, we summed the volumes obtained by multiplying the areas of the manually traced regions in each slice by the reconstruction interval. Liver volumes obtained by use of our computerized liver segmentation framework were compared with manual liver volumes, used as the “current gold standard.”
IV. Results
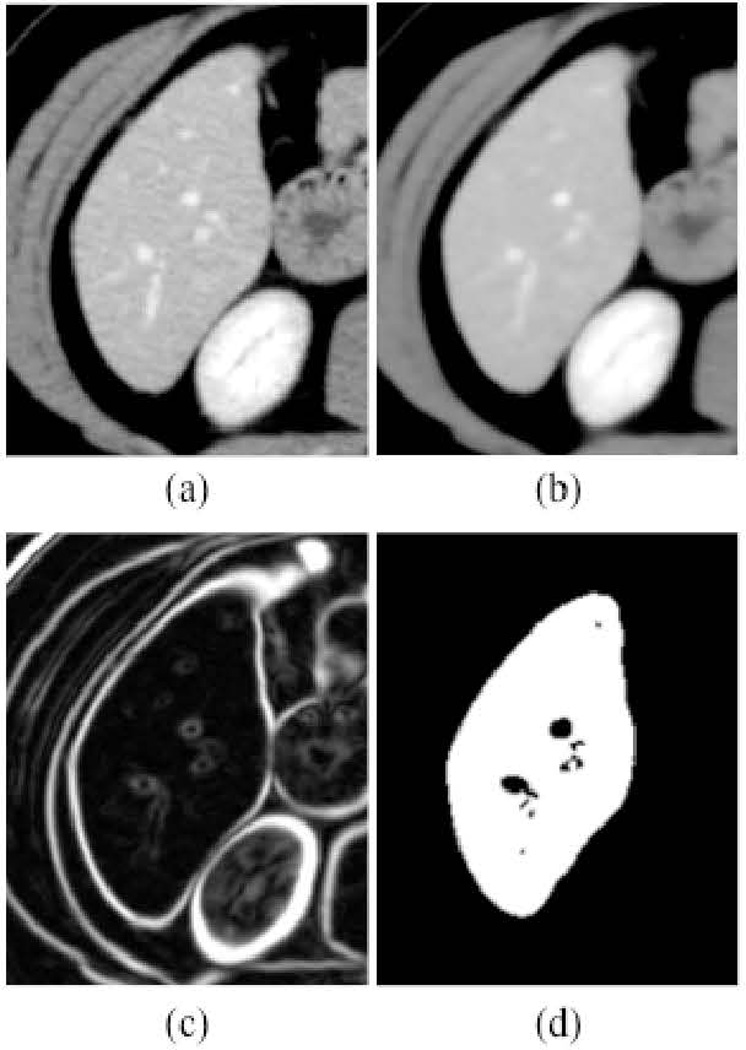
Figure 2 illustrates the intermediate images taken from each step of our framework for an example case. The noise in the original CT image in Fig. 2(a) was reduced by the anisotropic diffusion filter, while maintaining the liver structures such as the portal vein and the liver border, as shown in Fig. 2(b). A scale-specific gradient magnitude filter was applied to the noise-reduced image to enhance the liver boundary, as shown in Fig. 2(c). Finally, the liver was segmented by use of the fast-marching segmentation followed by the geodesic active contour level-set segmentation, as shown in Fig. 2(d). After the segmentation, the median filter was applied for removal of impulse noise in the extracted liver. Liver volumes were calculated using the segmented liver regions. The same liver segmentation framework was applied to MR cases where parameters of our framework had been modified to accommodate general MR images. In other words, a different single set of parameters was determined specific to MRI.
Figure 2.
Illustration of the resulting images at each step in our framework. (a) Original CT image. (b) Anisotropic diffusion noise reduction. (c) Scale-specific gradient magnitude filter. (d) Geodesic active contour segmentation.
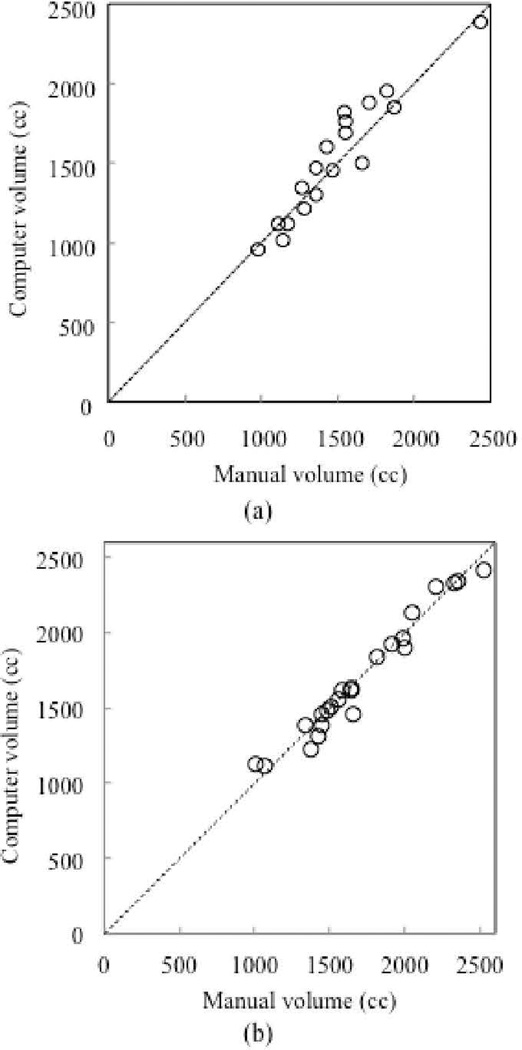
The mean liver volume obtained by use of our framework for CT cases was 1,504 cc, with a standard deviation of 407 cc (range: 956–2,381 cc), whereas the mean “gold-standard” manual volume was 1,457 cc with a standard deviation of 357 cc (range: 984–2,439 cc), with a mean absolute difference of 105 cc (7.2%). On the other hand, the mean gold-standard manual volume for MR cases was 1,710 cc with a standard deviation of 401 cc (range: 1,013–2,529 cc), while the mean volume of our computerized framework was 1,697 cc with a standard deviation of 400 cc (range: 1,120 – 2,418 cc).
The relationship between the computer-estimated volumes and the “gold-standard” manual volumes is shown in Fig. 3. The two volumetrics for CT and MRI reached excellent agreement (the intra-class correlation coefficient was 0.94 and 0.98, respectively). Pearson’s product moment correlation coefficient for CT and MRI were 0.94 and 0.98, respectively, at a non-statistically-significant level (p=11.5 and 23.65). For CT cases, the mean absolute difference and the percentage volume error (E) were 104 cc and 7.0%, respectively. On the other hand, the mean absolute difference and the percentage volume error for MR cases were 56 cc and 3.6%, respectively. The overall mean of the Dice coefficients was calculated as 93.6±1.7%, and the accuracy of liver segmentation was 99.4±1.4%.
Figure 3.
Relationship between computer-estimated volumes and “gold-standard” manual volumes. (a) CT cases. (b) MRI cases. The computer and manual volumetrics for CT and MRI reached an excellent agreement (the intra-class correlation coefficient was 0.94 and 0.98, respectively).
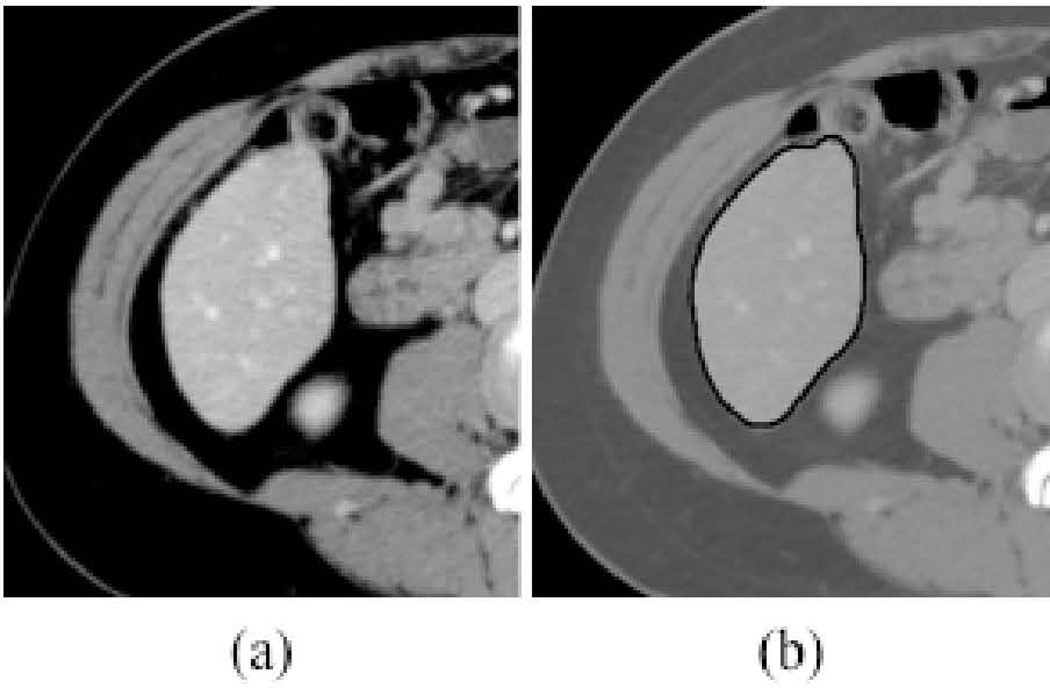
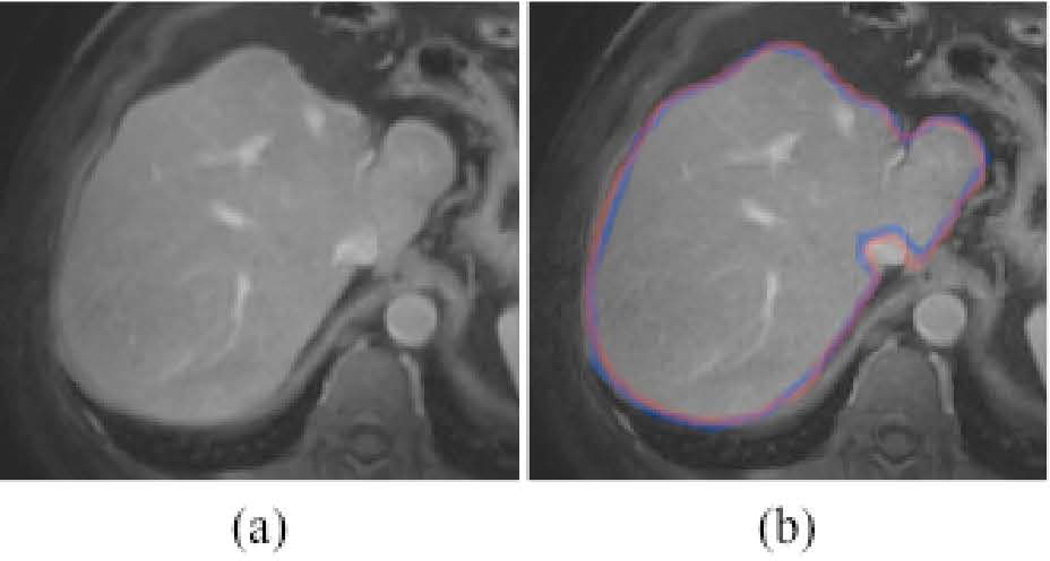
Figure 4 illustrates computerized liver segmentation and “gold-standard” manual segmentation for a CT case. The computerized liver segmentation agrees almost perfectly with the “gold-standard” manual liver segmentation for a slice through the superior portion of the liver. Figure 5 illustrates computerized liver segmentation and “gold-standard” manual segmentation for a MR case. The computerized liver segmentation agrees almost perfectly with the “gold-standard” manual segmentation.
Figure 4.
Illustrations of computerized liver segmentation and “gold-standard” manual liver segmentation for CT. (a) Original CT image. (b) Computerized liver segmentation (thick solid contour) and “gold-standard” manual segmentaton (thin dashed contour).
Figure 5.
Illustrations of computerized liver segmentation and “gold-standard” manual segmentation for MRI. (a) Original MR image. (b) Computerized liver segmentation (red contour) and “gold-standard” manual segmentation (blue contour).
The average processing time by our automated framework for CT cases was 3.6 ± 1.5 minutes per case (range: 1.7–7.0) on a computer (Intel, Xeon, 2.66 GHz). Because the time that a radiologist spent in automated volumetry was only the time for providing several initial points within the liver, we considered it as user time. The average user time for the computer volumetry was 0.57 ± 0.06 minutes per case. The difference was statistically significant (p < .025). On the other hand, the average processing time by our framework for MR cases was 1.03 ± 0.13 minutes per case (range: 0.9–1.5 min/case), whereas that for the manual method was 24.0±4.4 minutes per case (range: 18–30 min/case). The difference was statistically significant (p<0.001).
V. Conclusion
We developed a computerized framework for segmenting the liver in CT and MRI by using a fast marching and geodesic active contour segmentation coupled with level-set algorithms. Liver volumetrics determined by our computerized framework agreed excellently with “gold-standard” manual volumetrics in both CT and MRI. Our computerized framework required substantially less completion time, compared with manual segmentation. Our framework provides an efficient and accurate way of measuring liver volumes in CT and MRI; thus, it would be useful for radiologists in their measurement of liver volumes.
Acknowledgment
The authors are grateful to Drs. Richard L. Baron, Ibrahim Karademir, Ryan Kohlbrenner, and Mark L. Epstein for their valuable suggestions. This work was supported partially by the NIH SlO RR021039 and P30 CA14599. Some implementations used the Insight Segmentation and Registration Toolkit.
Contributor Information
Kenji Suzuki, Email: suzuki@uchicago.edu, Department of Radiology, University of Chicago, IL 60637 USA.
Hieu Trung Huynh, Email: hthieu@ieee.org, Faculty of Information Technology, Industrial University of Ho Chi Minh City, Viet Nam.
Yipeng Liu, Email: liuyipenghit@gmail.com, Department of Radiology, University of Chicago, IL 60637 USA.
Dominic Calabrese, Email: dcalabre@umich.edu, University of Michigan, Ann Arbor, MI 48109 USA.
Karen Zhou, Email: karen.zhou@wustl.edu, Washington University in St. Louis, MO 63130 USA.
Aytekin Oto, Email: aoto@radiology.bsd.uchicago.edu, Department of Radiology, University of Chicago, IL 60637 USA.
Masatoshi Hori, Email: mhori@radiol.med.osaka-u.ac.jp, Department of Radiology, Osaka University Graduate School of Medicine, Osaka 565-0871, Japan.
References
- 1.Kamel IR, Kruskal JB, Warmbrand G, et al. Accuracy of volumetric measurements after virtual right hepatectomy in potential donors undergoing living adult liver transplantation. AJR Am J Roentgenol. 2001;176(2):483–487. doi: 10.2214/ajr.176.2.1760483. [DOI] [PubMed] [Google Scholar]
- 2.Lemke AJ, Brinkmann MJ, Schott T, et al. Living donor right liver lobes: preoperative CT volumetric measurement for calculation of intraoperative weight and volume. Radiology. 2006;240(3):736–742. doi: 10.1148/radiol.2403042062. [DOI] [PubMed] [Google Scholar]
- 3.Emiroglu R, Coskun M, Yilmaz U, et al. Safety of multidetector computed tomography in calculating liver volume for living-donor liver transplantation. Transplant Proc. 2006;38(10):3576–3578. doi: 10.1016/j.transproceed.2006.10.101. [DOI] [PubMed] [Google Scholar]
- 4.Radtke A, Sotiropoulos GC, Nadalin S, et al. Preoperative volume prediction in adult living donor liver transplantation: how much can we rely on it? Am J Transplant. 2007;7(3):672–679. doi: 10.1111/j.1600-6143.2006.01656.x. [DOI] [PubMed] [Google Scholar]
- 5.Nakayama Y, Li Q, Katsuragawa S, et al. Automated hepatic volumetry for living related liver transplantation at multisection CT. Radiology. 2006;240(3):743–748. doi: 10.1148/radiol.2403050850. [DOI] [PubMed] [Google Scholar]
- 6.Bae KT, Giger ML, Chen CT, et al. Automatic segmentation of liver structure in CT images. Med Phys. 1993;20(1):71–78. doi: 10.1118/1.597064. [DOI] [PubMed] [Google Scholar]
- 7.Gao L, Heath DG, Kuszyk BS, et al. Automatic liver segmentation technique for three-dimensional visualization of CT data. Radiology. 1996;201(2):359–364. doi: 10.1148/radiology.201.2.8888223. [DOI] [PubMed] [Google Scholar]
- 8.Seiver MA, Kocaoglu A, Demir GK, et al. Patient oriented and robust automatic liver segmentation for pre-evaluation of liver transplantation. Comput Biol Med. 2008;38(7):765–784. doi: 10.1016/j.compbiomed.2008.04.006. [DOI] [PubMed] [Google Scholar]
- 9.Okada T, Shimada R, Hori M, et al. Automated segmentation of the liver from 3D CT images using probabilistic atlas and multilevel statistical shape model. Acad Radiol. 2008;15(11):1390–1403. doi: 10.1016/j.acra.2008.07.008. [DOI] [PubMed] [Google Scholar]
- 10.Afifi A, Nakaguchi T. Liver segmentation approach using graph cuts and iteratively estimated shape and intensity constrains. Med Image Comput Comput Assist Interv. 2012;15(Pt 2):395–403. doi: 10.1007/978-3-642-33418-4_49. [DOI] [PubMed] [Google Scholar]
- 11.Beichel R, Bornik A, Bauer C, et al. Liver segmentation in contrast enhanced CT data using graph cuts and interactive 3D segmentation refinement methods. Med Phys. 2012;39(3):1361–1373. doi: 10.1118/1.3682171. [DOI] [PMC free article] [PubMed] [Google Scholar]
- 12.Farraher Steven W, Jara Hernan, Chang Kevin J, et al. Liver and Spleen Volumetry with Quantitative MR Imaging and Dual-Space Clustering Segmentation. Radiology. 2005;237:322–328. doi: 10.1148/radiol.2371041416. [DOI] [PubMed] [Google Scholar]
- 13.Rusko L, Bekes G. Liver segmentation for contrast-enhanced MR images using partitioned probabilistic model. Int J Comput Assist Radiol Surg. 2011;6(1):13–20. doi: 10.1007/s11548-010-0493-9. [DOI] [PubMed] [Google Scholar]
- 14.Gloger O, Kuhn J, Stanski A, et al. A fully automatic three-step liver segmentation method on LDA-based probability maps for multiple contrast MR images. Magn Reson Imaging. 2010;28(6):882–897. doi: 10.1016/j.mri.2010.03.010. [DOI] [PubMed] [Google Scholar]
- 15.Suzuki K, Epstein ML, Kohlbrenner R, et al. Quantitative radiology: automated CT liver volumetry compared with interactive volumetry and manual volumetry. AJR. Am. J. Roentgenol. 2011;197(4):W706–W712. doi: 10.2214/AJR.10.5958. [DOI] [PMC free article] [PubMed] [Google Scholar]
- 16.Suzuki K, Kohlbrenner R, Epstein ML, et al. Computer-aided measurement of liver volumes in CT by means of geodesic active contour segmentation coupled with level-set algorithms. Med. Phys. 2010;37(5):2159–2166. doi: 10.1118/1.3395579. [DOI] [PMC free article] [PubMed] [Google Scholar]
- 17.Huynh HT, Suzuki K, Karademir I, et al. Program of RSNA. 2012 LL-PHS-TU7C. [Google Scholar]
- 18.Caselles Vicent, Kimmel Ron, Sapiro Guillermo. Geodesic Active Contours. Int. J. Comput. Vis. 1995;22:61–79. [Google Scholar]
- 19.Sethian JA. Level Set Methods and Fast Marching Methods. Second ed. New York: Cambridge University Press; 1999. [Google Scholar]
- 20.Perona P, Malik J. Scale-Space and edge detection using anisotropic diffusion. IEEE Transactions on Pattern Analysis Machine Intelligence. 1990;12:629–639. [Google Scholar]
- 21.Whitaker RT, Xue X. Variable-conductance, level-set curvature for image denoising; Proc. IEEE Int. Conf. Image Processing; 2001. pp. 142–145. [Google Scholar]
- 22.Sethian JA. A fast marching level set method for monotonically advancing fronts. Proc Natl Acad Sci U S A. 1996;93(4):1591–1595. doi: 10.1073/pnas.93.4.1591. [DOI] [PMC free article] [PubMed] [Google Scholar]


