

Abstract
Phenylketonuria (PKU), if not detected and treated in newborns, causes severe neurological dysfunction and cognitive and behavioral deficiencies. Despite the biochemical characterization of PKU, the molecular mechanisms underlying PKU-associated brain dysfunction remain poorly understood. The aim of this study was to gain insights into the pathogenesis of this neurological damage by analyzing protein expression profiles in brain tissue of Black and Tan BRachyury-PahEnu2 mice (a mouse model of PKU). We compared the cerebral protein expression of homozygous PKU mice with that of their heterozygous counterparts using two-dimensional difference gel electrophoresis analysis, and identified 21 differentially expressed proteins, four of which were over-expressed and 17 under-expressed. An in silico bioinformatic approach indicated that protein under-expression was related to neuronal differentiation and dendritic growth, and to such neurological disorders as progressive motor neuropathy and movement disorders. Moreover, functional annotation analyses showed that some identified proteins were involved in oxidative metabolism. To further investigate the proteins involved in the neurological damage, we validated two of the proteins that were most strikingly under-expressed, namely, Syn2 and Dpysl2, which are involved in synaptic function and neurotransmission. We found that Glu2/3 and NR1 receptor subunits were over-expressed in PKU mouse brain. Our results indicate that differential expression of these proteins may be associated with the processes underlying PKU brain dysfunction, namely, decreased synaptic plasticity and impaired neurotransmission.
Keywords: altered brain proteins, brain proteins in PKU, neurological dysfunction, phenylketonuria, PKU mouse model
Phenylketonuria (PKU, OMIM: 261600) and its hyperphenylalaninemia (HPA) variants represent the most common inherited disorders of amino acid metabolism (Blau et al. 2010; Mitchell et al. 2011). The primary cause of PKU is lack of phenylalanine hydroxylase (PAH, EC 1.14.16.1), the enzyme that in liver metabolizes L-phenylalanine (L-Phe) to L-tyrosine (L-Tyr) using 6R-L-erythro-5,6,7,8-tetrahydrobiopterin (BH4) as essential cofactor. To date, more than 600 PAH gene mutations have been discovered (http://www.pahdb.mcgill.ca) and characterized (Daniele et al. 2006; Scriver 2007; Daniele et al. 2008, 2009). The gene mutations affect many protein properties, namely, enzymatic activity, oligomerization equilibrium, thermal stability, and folding (Cerreto et al. 2011; Shi et al. 2012) thereby allowing prediction of the biochemical phenotype (Dobrowolski et al. 2009).
In untreated PKU patients, Phe concentrations in blood and tissues are high, while tyrosine concentrations are low-to-normal (Elsas et al. 2011; Demirkol et al. 2011). Accumulation of phenylalanine and its metabolites results in a variety of symptoms, including hypopigmentation of skin and hair, growth failure, and behavioral abnormalities (Pietz 1998; González et al. 2011). The symptoms of classic PKU are most prominent in the brain (van Spronsen et al. 2009; Anderson and Leuzzi 2010). Untreated patients with PKU have a lower brain weight, impaired myelination, early myelin degeneration, and lack of neuronal maturation (Martynyuk et al. 2005; van Spronsen et al. 2009).
At present, prevention of the major symptoms of the disease, including mental retardation, consists of severe restriction of Phe intake (MacDonald et al. 2011). Patients treated directly after birth have a more or less normal outcome. If dietary Phe restriction is not observed from birth, HPA leads to brain damage with severe and irreversible mental retardation, microcephaly, and other neurological abnormalities (Scriver and Kaufman 2001). Because the adverse effect of high levels of Phe on nervous tissue is progressive, it is recommended that PKU patients adhere to a low phenylalanine diet throughout their lives (Seashore et al. 1985). Patients who respond to BH4 can be treated with BH4 supplementation (Michals-Matalon et al. 2007; Ziesch et al. 2012). New therapeutic approaches, from gene therapy to potential therapeutic compounds, are being tested (van Spronsen and Enns 2010; Bélanger-Quintana et al. 2011; Cerreto et al. 2012).
Despite the extensive biochemical characterization of PKU, the mechanism by which HPA results in brain dysfunction is not yet understood. The advent of the murine PKU model, the Black and Tan BRachyury (BTBR)-PahEnu2 mouse, opened the possibility of studying the development of brain damage in PKU. In fact, it has been found that PKU mice show symptoms similar to those of human PKU patients with HPA, hypopigmentation, and neurobiological abnormalities (Embury et al. 2007; de Groot et al. 2010; Martynyuk et al. 2010; Cerreto et al. 2012).
In this study, we analyzed the protein expression profiles in brain tissue of BTBR-PahEnu2 mice in comparison to those in normal heterozygous (HTZ) mouse brain to determine the pathological changes involved in phenylalanine-induced neurological damage and to identify markers associated with the neurological damage.
Materials and methods
Mice treatment and sample preparation
PKU mice [homozygous, HTZ BTBR-PahEnu2 and wild-type (WT) mice] were housed in small groups (n = 4–5) in standard cages under controlled conditions of temperature (22 ± 1°C) and with alternating 12 h of light/dark. Mice were fed a diet containing 18.0% protein without Phe restriction (4RFU; Mucedola s.r.l, Milan, Italy) and water was provided without limits (Cerreto et al. 2012). Mice were maintained in these conditions throughout the experimental period and killed at age 12 weeks. A total of 17 male and female mice were used. All experiments were conducted in conformity with protocols approved by the Veterinary Department of the Italian Ministry of Health and in accordance with the ethical and safety rules and guidelines for the use of animals in biomedical research set-out in the relevant Italian laws and European Union directives (n. 86/609/EC). BTBR-PahEnu2 mice were purchased from The Jackson Laboratory (Bar Harbor, ME, USA).
Protein extraction
Brains collected from homozygous PKU mice and their HTZ littermates were stored at −80°C. For each group, four mice (two females and two males) were used. Brains were homogenized in a buffer containing 7 M Urea, 2 M Thiourea, 4% 3-[(3-Cholamidopropyl)dimethylammonium]-1-propanesulfonate, 30 mM Tris-HCl pH 7.5 and protease inhibitor mix (GE Healthcare, Piscataway, NJ, USA). Brain tissues were disrupted using a pre-chilled Dounce homogenizer and centrifuged at 16 000 g at 4°C for 30 min. Proteins were then precipitated and cleaned using the Ettan 2-D Clean-up Kit (GE Healthcare) following the manufacturer's instructions. Protein samples were resuspended in lysis buffer and protein concentration was determined by 2-D Quant Kit (GE Healthcare) using bovine serum albumin as the standard.
Two-dimensional difference gel electrophoresis
The pH of protein samples was adjusted to 8.5 to optimize fluorescent labeling. Protein extracts (50 μg) from four different biological replicates of PKU mouse and control mouse brains were labeled separately with 400 pmol of Cy3 and Cy5. A mix of equal amounts of all samples under analysis was labeled with Cy2 and used as internal standard for quantitative comparisons. Labeling reactions were performed as described previously (Imperlini et al. 2010). To avoid differences because of staining efficiency, we swapped the dyes between the pairs of biological replicates as reported in Table 1.
Table 1.
2D DIGE experimental design
| Gel | Cy3 (50 μg) | Cy5 (50 μg) | Cy2 (50 μg) |
|---|---|---|---|
| 1 | Control – replicate 1 | PKU – replicate 2 | Pooled standard |
| 2 | Control – replicate 3 | PKU – replicate 4 | Pooled standard |
| 3 | PKU – replicate 1 | Control – replicate 2 | Pooled standard |
| 4 | PKU – replicate 3 | Control – replicate 4 | Pooled standard |
The samples, mixed as described in Table 1, were loaded on 24-cm-long immobilized pH gradient strips with a 3-10 NL pH range (GE Healthcare) with the anodic cup-loading method. The first-dimension isoelectric focusing was carried out as described previously (Imperlini et al. 2010). After focusing, proteins were reduced and alkylated. Then, the strips were over-layered on 10% polyacrylamide gels (20 × 24 cm) and the second dimension was carried out for 18 h at 2 W per gel using an Ettan Dalt Twelve system (GE Healthcare).
Analysis of gel images
Gels were scanned using a Typhoon 9400 scanner (GE Healthcare). Fluorescence-labeled proteins were visualized at the following excitation/emission wavelengths: 532/580 nm for Cy3, 633/670 nm for Cy5, and 488/520 nm for Cy2, selecting parameters to prevent pixel saturation. Images were analyzed using the DeCyder software suite, version 5.02 (GE Healthcare) in batch processing mode as described previously (Corbo et al. 2012). Each spot intensity was expressed as mean of four standard abundances calculated for the four gels reported in Table 1. Spot intensities were then compared in the two conditions under analysis: PKU mice and control mice. The statistical significance of differences in spot intensity was determined by Student's t-test. Only protein spots with fold changes of at least 1.20 in volume (p ≤ 0.05) after normalization were considered significantly altered. We verified the accuracy of spot matching by manual investigation.
In-gel protein digestion
Two different preparative gels were prepared and the second dimension was performed using 0.75 mg of protein extracts from the control and PKU mouse brains. Preparative gels were stained as described previously (Corbo et al. 2012). Protein spots of interest were picked, using an Ettan Spot Picker (GE Healthcare), from the gels and washed in 50 mM ammonium bicarbonate, pH 8.5 and 50% acetonitrile until completely dehydrated. Gel pieces were subsequently hydrolyzed with a modified trypsin preparation (Sigma-Aldrich, Saint Louis, MO, USA) as described previously (Imperlini et al. 2013).
MS analysis and protein identification
Peptide mixtures were analyzed by liquid chromatography-tandem mass spectrometry (LC-MS/MS) using the LC/MSD Trap XCT Ultra (Agilent Technologies, Palo Alto, CA, USA) equipped with an 1100 HPLC system and a chip cube (Agilent Technologies). After loading, the peptide mixture was concentrated and washed at 4 μL/min in a 40-nL enrichment column (Agilent Technologies chip). The sample was then separated on an RP C18 column (75 μm × 43 mm) as described previously (Colavita et al. 2010). Peptides were analyzed using LC/MSD Trap software 6.0 for data acquisition (Agilent Technologies). Mascot software (Matrix Science, London, UK) was used for protein database searching. The searches were performed using the NCBI database and the following standard parameters: Mus musculus; one missed cleavage; carboxyamidomethylation of Cys, partial Met oxidation and putative modification of Gln to pyro-Glu, mass tolerance of 300 ppm on precursor ions, and 0.6 Da on the product ions. Identifications were accepted taking three issues into account: significant MASCOT scores, spectrum annotation, and expected migration on 2D gel (Corbo et al. 2012). Individual ion scores > 41 indicate identity or extensive homology (p < 0.05). Furthermore, individual MS/MS spectra for peptides with a score of 41 were inspected manually and included in the statistics only if a series of at least four continuous y or b ions were observed.
Bioinformatic analysis of identified proteins
Proteins were analyzed with the Ingenuity Pathway Analysis software 9.0 (IPA) (Ingenuity Systems, Inc. http://www.ingenuity.com). Drawing on published, peer-reviewed reports, IPA constructs networks of direct/indirect interactions between genes, proteins, and endogenous molecules. These relationships include those that occur as a result of disease and/or environmental input. The system generates a set of networks and we selected 70 as the maximum number of proteins per network. Each network is characterized by a score (p ≤ 0.05; Fisher's exact test) and one or more biological functions are assigned to it. The identified proteins were classified according to the database for annotation, visualization and integrated discovery (DAVID) 6.7 annotation system (http://david.abcc.ncifcrf.gov). This tool adopts the Fisher's exact test to measure the protein enrichment in annotation terms. In case of a p ≤ 0.05, a protein would be considered strongly enriched in the annotation categories. The proteomic data were integrated with the Human Protein Atlas 11.0 database that contains information about protein expression in standardized normal human tissues, cancers, and in vitro cultured cell lines. To date, 18 707 antibodies have been applied against the human proteome to examine the expression of corresponding proteins in the Human Protein Atlas.
Western blotting analysis
Protein extracts (50 μg) from three independent replicates of the control and of PKU mice were resolved on a 10% sodium dodecyl sulfate–polyacrylamide gel electrophoresis gel and then transferred onto nitrocellulose membranes (GE Healthcare) by Mini trans-blot electrophoresis transfer (Bio-Rad Laboratories, Hercules, CA, USA). The membranes were blocked in 5% non-fat milk in phosphate-buffered saline pH 7.5 for 2 h and incubated overnight at 4°C with 1% milk/phosphate-buffered saline pH 7.5 and 0.05% tween containing specific antibodies. Mouse anti-Dpysl2 (5 μg/mL, Abnova, Taipei, Taiwan), anti-Syn2 (1 : 500, Abnova), anti-Glu2/3 (1 : 1000, Sigma-Aldrich), and anti-NR1 (1 : 1000, Upstate, Merck, Millipore, KGaA, Darmstadt, Germany) were used for western blot analysis. A mouse anti-Gapdh (Sigma-Aldrich) antibody was used as loading control, at a dilution of 1 : 5000. Immunoblot detections were carried out using horseradish peroxidase-conjugated anti-mouse (1 : 5000) secondary antibodies (GE Healthcare). Immunoblots were detected using the enhanced chemiluminescence-Advance western blotting detection kit (GE Healthcare). The resulting western blot images were scanned by PDquest 7.1 software (Bio-Rad). The protein band images on X-ray films were acquired with the Chemidoc XRS system (Bio-Rad). Band volumes were normalized using Gapdh as control, visualized on the same film. Densitometric measurements were made with the Quantity One 4.5 tool (Bio-Rad).
Statistical analysis
For 2D DIGE analysis, Student's t-test was used to determine protein spots that were significantly altered. For bioinformatic analyses, Fisher's exact test was used to assign the most significant biological networks and processes. For all analyses, p ≤ 0.05 was considered statistically significant.
Results
Identification of differentially expressed proteins in the PKU mouse brain
To gain insights into the cascade of events underlying the pathogenesis of brain dysfunction in PKU, we measured the differential expression of mouse brain proteins from the HTZ PKU mice (control) and homozygous PKU mice (PKU) using 2D DIGE analysis. To increase the biological and statistical significance of our results, we considered four independent PKU brain extracts and four independent control brain extracts. Approximately 3000 protein spots were detected in each 2D gel. The image analysis revealed 64 statistically relevant (p ≤ 0.05) and differentially expressed protein spots with fold changes ≥ 1.20 or ≤ −1.20. Nineteen spots were more highly expressed and 45 spots were less expressed in the PKU mouse brains.
From two Sypro Ruby-stained preparative gels, one obtained from the PKU lysates and the other from the control extracts, we were able to match and pick 54 of the 64 differentially expressed protein spots, plus some unchanged spots used as reference in the 2D gel. Figure 1 shows a representative preparative 2D gel in which the excised spots are circled in yellow. Among the 54 picked spots, 26 were identified with the mass spectrometry/bioinformatic procedure. Red numbers in Fig. 1 indicate over-expressed identified spots, whereas green numbers indicate under-expressed identified spots in PKU mouse brains compared to control mouse brains. From each of these excised spots we identified only single protein species; we excluded spots that contained two or more protein species that comigrated in the 2D gel.
Fig 1.
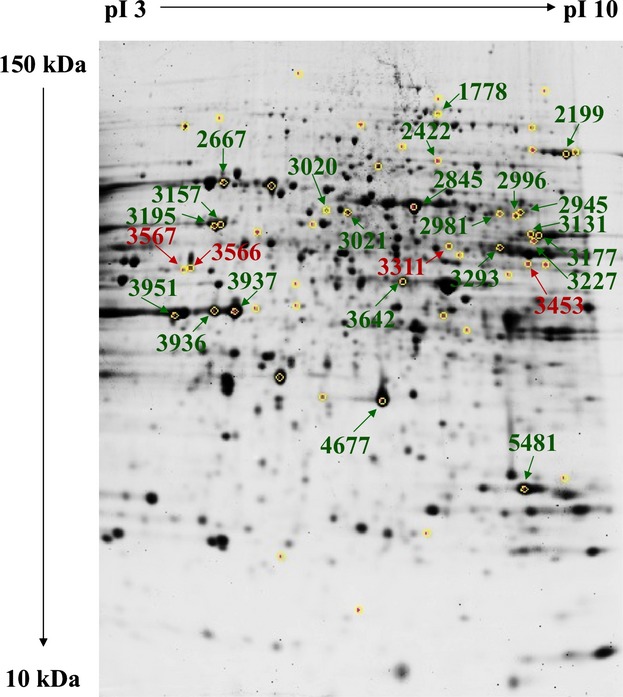
Protein expression pattern of phenylketonuria (PKU) mouse brain. Yellow circles indicate spots picked up from the heterozygous PKU mouse brain (control) and homozygous PKU mouse brain (PKU) gels. Red and green labels indicate over-expressed and under-expressed species, respectively, identified in the control and PKU gels.
Table 2 shows the spot number, fold change, p value, gene symbol, gene ID, theoretical MW and pI, the Mascot score, and number of processed peptides. The list is ranked from the lowest fold change value to the highest. Most proteins were identified by more than two peptide signals. In the case of the four species identified by a single peptide, we inspected each MS/MS spectrum manually (Figure S1).
Table 2.
Differentially expressed proteins in the PKU mouse brain
| Spot n. | Folda | p value | Gene name | Protein name | Gene ID | pIb | MWc | Mascot scorec | No. of peptides matched |
|---|---|---|---|---|---|---|---|---|---|
| 3227 | −2.38 | 0.016 | SYN2 | Syn2 protein | 42406392 | 8.59 | 63 487 | 167 | 3 |
| 3157 | −2.32 | 0.03 | INA | alpha-internexin | 148539957 | 5.35 | 55 520 | 785 | 13 |
| 2845 | −1.94 | 0.017 | DPYSL2 | dihydropyrimidinase-related protein 2 (Ulip2) | 40254595 | 5.95 | 62 638 | 929 | 14 |
| 3195 | −1.92 | 0.011 | HSPD1 | 60 kDa heat-shock protein, mitochondrial | 183396771 | 5.91 | 61 088 | 696 | 12 |
| 3177 | −1.92 | 0.012 | PKM | M2-type pyruvate kinase | 1405933 | 7.18 | 58 488 | 893 | 14 |
| 2199 | −1.87 | 0.0097 | ACO2 | aconitate hydratase, mitochondrial precursor | 18079339 | 8.08 | 86 151 | 445 | 9 |
| 3951 | −1.85 | 0.020 | ACTB | beta-actin | 49868 | 5.78 | 39 446 | 283 | 5 |
| 3293 | −1.81 | 0.0042 | DLD | dihydrolipoamide dehydrogenase | 2078522 | 7.97 | 54 478 | 382 | 8 |
| 2667 | −1.76 | 0.0099 | ATP6V1A | V-type proton ATPase catalytic subunit A | 31560731 | 5.42 | 68 625 | 670 | 13 |
| 4677 | −1.75 | 0.010 | MDH1 | cytosolic malate dehydrogenase | 387129 | 6.16 | 36 625 | 204 | 4 |
| 3937 | −1.73 | 0.0083 | CKB | creatine kinase B-type | 10946574 | 5.40 | 42 971 | 613 | 10 |
| 3131 | −1.58 | 0.0047 | PKM | M2-type pyruvate kinase | 387129 | 6.16 | 36 625 | 409 | 7 |
| 3936 | −1.57 | 0.0049 | CKB | creatine kinase B-type | 10946574 | 5.40 | 42 971 | 454 | 7 |
| 5481 | −1.53 | 0.0098 | PGAM1 | phosphoglycerate mutase 1 | 10179944 | 6.19 | 29 033 | 95 | 2 |
| 2981 | −1.36 | 0.045 | DPYSL2 | dihydropyrimidinase-related protein 1 (Ulip3) | 2342488 | 7.00 | 62 410 | 62 | 1 |
| 3642 | −1.35 | 0.049 | ENO1 | alpha-enolase | 70794816 | 6.37 | 47 453 | 386 | 7 |
| 1778 | −1.32 | 0.062 | DNM1 | dynamin 1 | 123230377 | 6.59 | 97 803 | 226 | 4 |
| 3021 | −1.28 | 0.0072 | DPYSL3 | dihydropyrimidinase-related protein 3 (Ulip1) | 6681219 | 6.04 | 62 296 | 119 | 2 |
| 2945 | −1.25 | 0.015 | DPYSL4 | dihydropyrimidinase-related protein 4 (Ulip4) | 1945273 | 6.39 | 62 388 | 165 | 3 |
| 2996 | −1.24 | 0.027 | DPYSL2 | dihydropyrimidinase-related protein 1 (Ulip3) | 2342488 | 7.00 | 62 410 | 242 | 4 |
| 2422 | −1.24 | 0.021 | NSF | N-ethylmaleimide sensitive fusion protein (SKD2) | 557878 | 6.52 | 83 083 | 53 | 1 |
| 3020 | −1.21 | 0.0078 | DPYSL3 | dihydropyrimidinase-related protein 3 (Ulip1) | 6681219 | 6.04 | 62 296 | 56 | 1 |
| 3311 | 1.21 | 0.023 | DARS | Aspartyl-tRNA synthetase, cytoplasmic | 21264011 | 6.07 | 57 537 | 95 | 2 |
| 3453 | 1.22 | 0.0054 | SEPT11 | Sept11 protein | 38328220 | 6.36 | 49 219 | 51 | 1 |
| 3566 | 1.23 | 0.044 | GDA | guanine deaminase | 6753960 | 5.36 | 51 494 | 84 | 2 |
| 3567 | 1.30 | 0.033 | GFAP | glial fibrillary acidic protein | 14193692 | 5.05 | 46 521 | 118 | 2 |
Fold is the ratio between the protein expression level of homozygous PKU mouse brain (PKU) and the expression level of heterozygous PKU mouse brain (control).
Theoretical pI and MW.
Protein score assigned by Mascot software is derived from ion scores that are −10 × Log (p), where p is the probability that the observed match is a random event.
Dihydropyrimidinase-related protein 2 (Dpysl2) and dihydropyrimidinase-related protein 3 (Dpysl3) were under-expressed in three spots (nos. 2845, 2981, and 2996) and in two spots (nos. 3021 and 3020), respectively, both at the expected molecular weight. M2-type pyruvate kinase (Pkm) was detected in two spots (nos. 3131 and 3177), both under-expressed, at the expected molecular weight. Creatine kinase B-type (Ckb) was also detected in two spots, 3937 and 3936, (fold change −1.73 and −1.57, respectively) suggesting post-translational modifications. All the above-indicated proteins are known phosphoproteins, which is why they were identified in multiple spots from 2D gels.
In summary, we identified 21 differentially expressed proteins in PKU mouse brains, four were over-expressed and 17 under-expressed.
Bioinformatic analysis
We analyzed the whole data set by means of bioinformatic tools available on the net; our aims were: (i) to identify relevant biological networks among the identified proteins; (ii) to cluster the identified species into functional annotation terms, and (iii) to evaluate the proteomic data in terms of levels of annotated protein expression in the human CNS.
Biological networks analysis
The 21 differentially expressed proteins were analyzed using the IPA software. IPA output revealed one high-score multidirectional interaction network that was associated with ‘Cell Cycle, Carbohydrate Metabolism, Cell-To-Cell Signaling, and Interaction’ (score = 55) (Fig. 2a). This network contained several protein nodes (signal transducer and activator of transcription-3, ubiquitin C, extracellular signal-regulated kinases, epidermal growth factor receptor shown on gray scale), directly or indirectly correlated with the 21 proteins we identified (Fig. 2a). The top biological function listed in the IPA output was ‘neurological disorder’ defined by 13 of the 21 identified species. The main representative neurological disorders, shown in Fig. 2b, were ‘disorder of basal ganglia’ (p value 5.72E-08), ‘progressive motor neuropathy’ (p value 1.11E-06), ‘movement disorders’ (p value 1.69E-06), and ‘schizophrenia’ (p value 3.27E-06). Moreover, IPA output showed that the top physiological system development and function was the nervous system with the following main representative neurological functions (Fig. 2c): ‘neuritogenesis’ (p value 7.14E-07), ‘morphology of nervous tissue’ (p value 1.88E-06), ‘morphogenesis of neurites’ (p value 1.22E-05), ‘differentiation of neurons’ (p value 3.02E-05), ‘branching of neurites’ (p value 3.36E-05), and ‘dendritic growth/branching’ (p value 1.42E-04). Finally, the three top canonical pathways listed in the IPA output were ‘TCA cycle’ (p value 3.71E-06), ‘gluconeogenesis’ (p value 4.81E-06), and ‘glycolysis’ (p value 5.44E-06).
Fig 2.
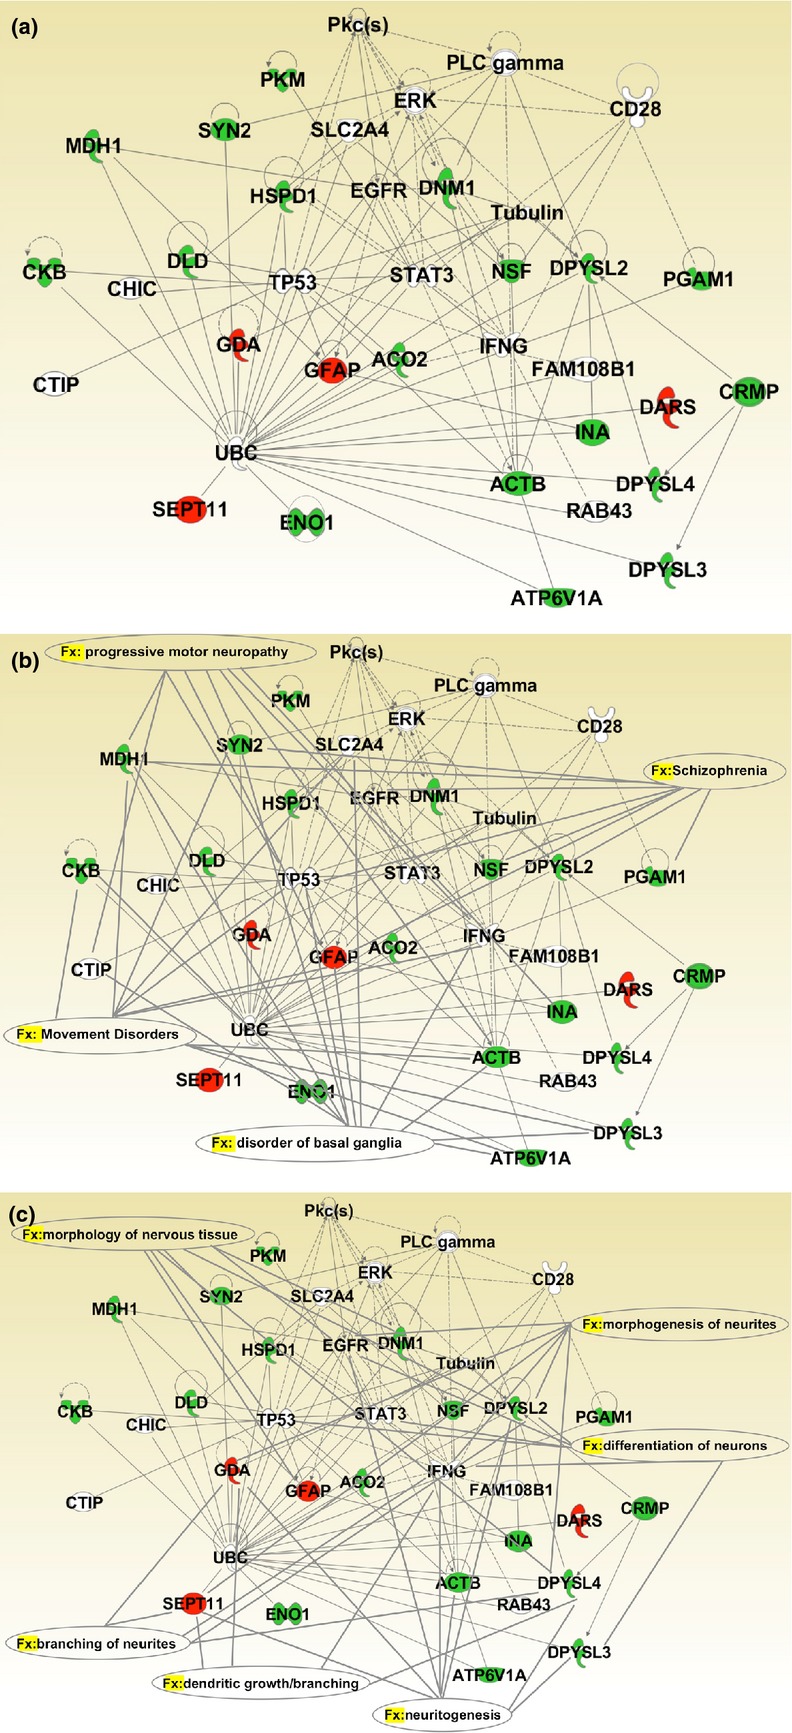
IPA analysis. (a) The proteins identified were analyzed using the IPA software. IPA output revealed one high-score multidirectional interaction network associated with ‘Cell Cycle, Carbohydrate Metabolism, Cell-To-Cell Signaling, and Interaction’ (score = 55). Red and green proteins indicate over-expressed and under-expressed proteins, respectively, in homozygous phenylketonuria (PKU) mouse brain. Direct interactions appear as a solid line; indirect interactions appear as a dotted line. (b) The four top neurological disorders listed in the IPA output were ‘disorder of basal ganglia’ (p value 5.72E-08), ‘progressive motor neuropathy’ (p value 1.11E-06), ‘movement disorders’ (p value 1.69E-06), and ‘schizophrenia’ (p value 3.27E-06). Solid lines connect the involved proteins to each neurological disorders. (c) The top physiological system development and function listed in the IPA output was ‘nervous system development and function’. Solid lines connect the involved proteins to the main representative neurological functions: ‘neuritogenesis’ (p value 7.14E-07), ‘morphology of nervous tissue’ (p value 1.88E-06), ‘morphogenesis of neurites’ (p-value 1.22E-05), ‘differentiation of neurons’ (p value 3.02E-05), ‘branching of neurites’ (p value 3.36E-05), and ‘dendritic growth/branching’ (p value 1.42E-04).
Functional annotation analysis
The identified proteins were functionally classified according to the DAVID annotation system. As shown in Fig. 3, the most significant biological processes were ‘glycolysis’ (p value 9.1E-04), ‘nucleoside binding’ (p value 1.3E-03), ‘cellular respiration’ (p value 1.6E-03), and ‘cytoskeleton’ (p value 3.1E-02).
Fig 3.
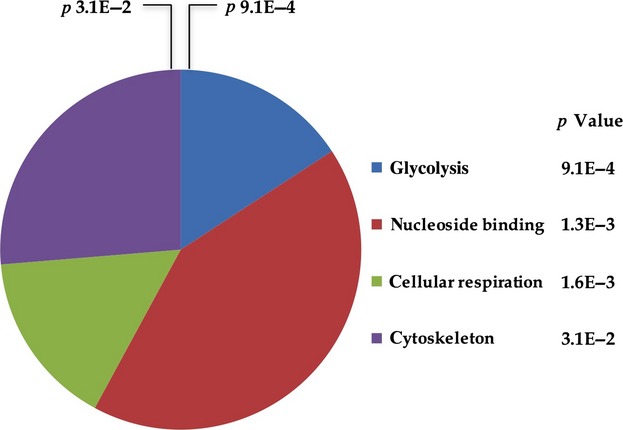
DAVID functional annotation. The proteins identified were classified using the DAVID annotation system. The Fisher's exact test was used to determine the protein enrichment in annotation terms. The functional categories are sorted by p value. The graph shows the number of proteins within each functional category.
In silico analysis of protein expression levels in brain tissue
The expression levels in brain tissue of the 17 under-expressed proteins were analyzed using the Human Protein Atlas database, which provided information for all these proteins except Syn2 and Pgam. As shown in Fig. 4, all under-expressed proteins (with the sole exception of Hspd1) were moderately expressed in the neuropil of the cerebral cortex. Moreover, more than 80% of these proteins were expressed to different degrees in neuronal cells of the cerebral cortex, hippocampus, and lateral ventricle.
Fig 4.
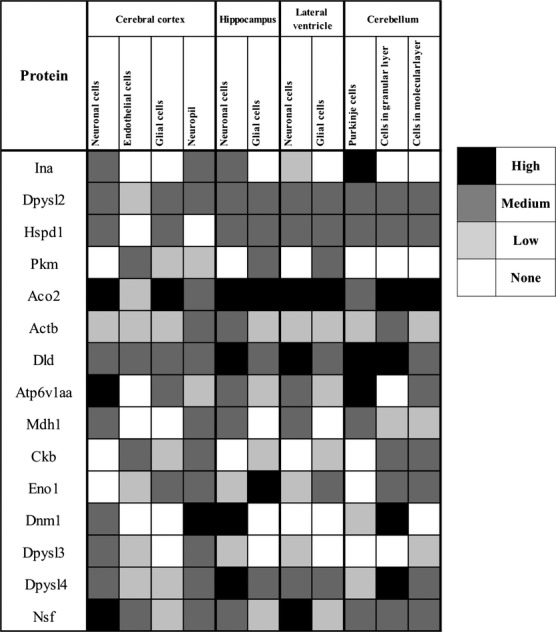
Expression profiles in the human CNS of the identified under-expressed proteins using the Human Protein Atlas database.
Validation of differentially expressed proteins
To verify the results obtained in differential proteomic analysis, we evaluated the expression of selected identified proteins by western blot analyses (Fig. 5a). Gapdh was used as loading control of each sample. Western blotting showed significant under-expression of Syn2 and Dpysl2 proteins in PKU mouse brain compared to the control – a finding that was confirmed by densitometric analysis (Fig. 5b). As controls in the experiments reported in Fig. 5a and b, we used both HTZ PKU mouse brain and WT mouse brain. There were no significant differences between these two types of controls, thereby indicating that the HTZ PKU mouse behaves like the WT mouse, at least in this context.
Fig 5.
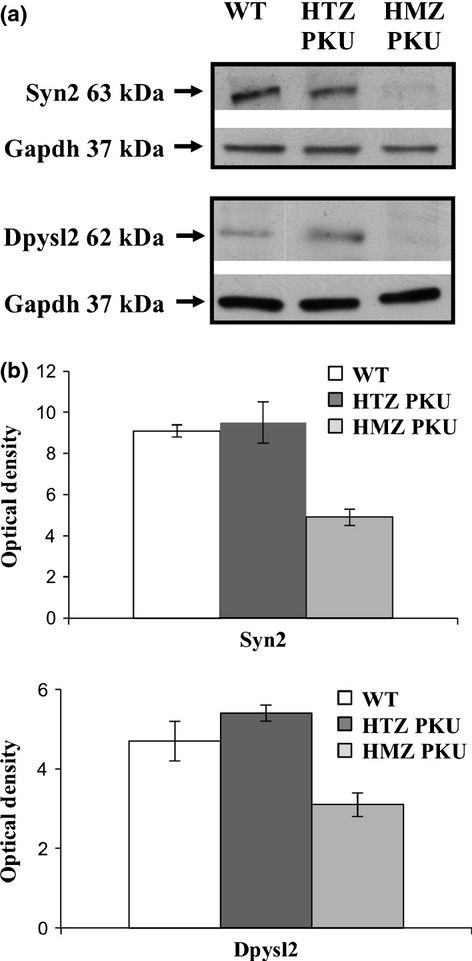
Representative western blot images of the selected identified proteins. Total protein of wild-type (WT), heterozygous (HTZ PKU), and homozygous (HMZ PKU) mouse brains were submitted to western blot analysis (a) using Gapdh as loading control. (b) Densitometric analysis of Syn2 and Dpysl2 expression of three independent replicates. The y-axis shows the optical density of protein expression. The results are shown as means ± SD.
We also evaluated the protein levels of the Glu2/3 α-Amino-3-hydroxy-5-methyl-4-isoxazolepropionic acid (AMPA) receptor subunit and the NMDA receptor subunit NR1 in the control and PKU mouse brain extracts. Western blot and densitometric analyses showed that the expressions of the Glu2/3 and NR1 receptor subunits were significantly up-regulated in PKU mouse brain (Fig. 6a and b).
Fig 6.
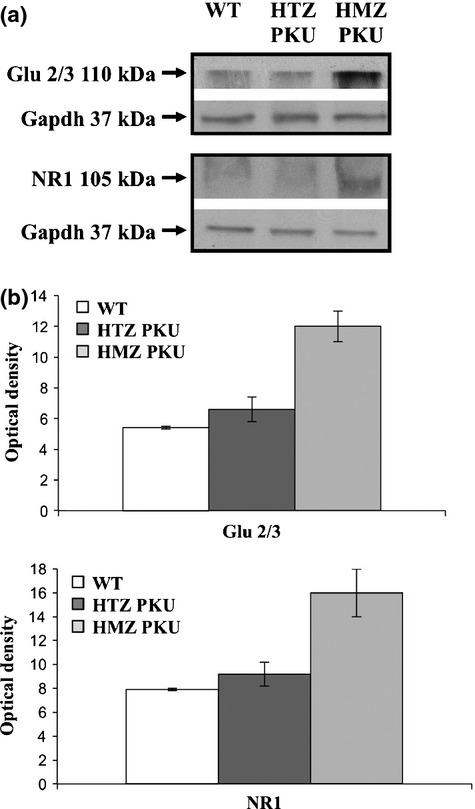
Expression of Glu2/3 and NR1 receptor subunits in PKU mouse brain. (a) Representative western blot analyses of Glu2/3 and NR1 receptor subunits performed on total protein extracts of wild-type (WT), heterozygous (HTZ PKU), and homozygous (HMZ PKU) mouse brains; Gapdh was used as loading control. (b) Densitometric analysis of Glu2/3 and NR1 receptor subunit expression performed on three independent replicates. The y-axis shows the optical density of protein expression. The results are shown as means ± SD.
Discussion
If not treated in the early newborn period, PKU patients develop severe neurologic dysfunctions, and cognitive and behavioral deficiencies. The etiopathogenesis and the underlying molecular mechanisms of PKU are not fully understood. Moreover, the dietary treatment of PKU patients is a demanding challenge for clinicians because the recommended blood Phe concentrations are difficult to maintain over the long term. Hence, insight into the mechanisms by which HPA causes neurological damage may improve therapeutic strategies and suggest alternative protocols.
The advent of BTBR-PahEnu2, the PKU animal model, opened the possibility of investigating PKU-associated brain dysfunctions. In fact, BTBR-PahEnu2 mice are characterized by biochemical and behavioral phenotypes that closely resemble untreated human PKU. They are also characterized by reduced enzymatic activity of phenylalanine hydroxylase (Cerreto et al. 2012). Akin to other neurological diseases, protein levels in PKU are more informative about physiopathological processes than the corresponding mRNA levels. Therefore, we applied a differential proteomic approach in an attempt to identify protein changes associated with brain dysfunction in a well-characterized mouse model of PKU (Martynyuk et al. 2010; Cerreto et al. 2012).
We measured protein expression levels in PKU-BTBR mice and in the HTZ counterparts and identified 21 differentially expressed cerebral proteins, four of which were over-expressed and 17 under-expressed.
The bioinformatic analysis of the identified protein data set showed that about 60% of species are related to nervous system development and functions (neuron differentiation and dendritic growth/branching) and to neurological disorders (progressive motor neuropathy and movement disorders). Hence, our proteomic approach allowed us to identify which proteins are related to neuronal survival and development, and which are affected by HPA (Li et al. 2010). Moreover, the neurological disorders identified by bioinformatic analysis seem to reflect the PKU-induced cognitive damage known to be associated with deficient functioning of the frontal lobes (Moyle et al. 2007).
We also functionally classified the differentially expressed proteins using two different bioinformatic tools. Interestingly, both tools revealed that most of the identified proteins are significantly associated with the oxidative metabolic pathways (tricarboxylic acid cycle and glycolysis). These data are in agreement with the decrease of cerebral glucose metabolism previously reported in the PKU mouse model (Qin and Smith 2007). It is noteworthy that decreased brain glucose metabolism has also been observed in another neurological disorder, i.e., Alzheimer's disease (Cunnane et al. 2011). Intriguingly, this finding suggests the possibility that because of reduced synaptic functionality and the consequent reduced energy needs, it is the neurodegenerative processes themselves that induce the decrease of brain glucose metabolism.
In this scenario, our data correlate with the in vivo finding of decreased pyruvate kinase activity and decreased energy metabolism in PKU patients described by Pietz et al. 2003. Indeed, we found that pyruvate kinase was significantly under-expressed in PKU mouse brain, which reinforces the similarity between the experimental model and the human disease. Besides energy deficit, oxidative stress has been implicated in PKU-related brain damage (Ercal et al. 2002; Ribas et al. 2011). In particular, a Phe-restricted diet can reduce endogenous antioxidants that, in addition to high levels of Phe and its metabolites, may increase the formation of reactive species, toward which the brain is very susceptible. Therefore, the addition of antioxidants to current therapy could help to prevent the oxidative stress which probably contributes to cognitive impairment in PKU patients (Ribas et al. 2011). In support of this issue, in the PKU mouse brain, we found under-expression of three oxidative-sensitive enzymes: Ckb, phosphoglycerate mutase 1 (Pgam1), and alpha-enolase (Eno1). Interestingly, in Alzheimer's disease, the increased level of oxidative stress compromises neuronal energy metabolism by causing dysfunction of these enzymes (Butterfield et al. 2006). In particular, the decreased level of protein Ckb, observed in brain regions of patients affected by Alzheimer's disease, and the consequent loss of Ckb function is a biochemical marker of brain damage (Aksenov et al. 2000) that could also be related to the oxidative stress observed in PKU.
To evaluate the potential of the identified proteins as markers of neurological damage in human PKU, we evaluated their expression levels in the CNS using the Human Protein Atlas database. It is noteworthy that all under-expressed proteins in PKU mouse brain were normally expressed in the neuropil, which is the region of the human cerebral cortex that contains the synaptic connections.
To investigate the proteins involved in neurological damage in greater detail, we validated Syn2 and Dpysl2, two of the most strikingly under-expressed proteins in the PKU mouse brain. Syn2 belongs to a family of neuron-specific phosphoproteins associated with the membranes of synaptic vesicles. It plays an important role during neuronal development because it participates in the formation and maintenance of synaptic contacts among central neurons (Ferreira and Paganoni 2002). Syn2 is a multifunctional protein that regulates the pre-synaptic terminal that controls the number of vesicles available. Interestingly, lack of Syn2 leads to a reduction in the density of synaptic vesicle proteins in nerve terminals and, hence, to severe synaptic depression which, in turn, produces an epileptic phenotype (Rosahl et al. 1995; Fornasiero et al. 2012). Moreover, Syn2 is implicated in the modulation of neurotransmitter release (Ferreira and Rapoport 2002; Bogen et al. 2011) in a phosphorylation-dependent manner (Hilfiker et al. 2005). In fact, in Syn2 knockout mice, the expression of the vesicular glutamate transporters was greatly reduced, whereas GABA was greatly increased in the spinal cord after nerve injury. These altered expressions contribute to the onset of neuropathic pain thereby suggesting that Syn2 is involved in the regulation of glutamate and GABA release (Schmidtko et al. 2008). Here, we report the first experimental evidence of a significant reduction of Syn2 protein level in the brain of the PKU mouse model. Syn2 under-expression could be related to the reduction in synaptic density, neurotransmission depletion, and white matter abnormalities observed in both PKU patients and mice in the presence of elevated brain concentrations of Phe (Hörster et al. 2006; Anderson et al. 2007; van Spronsen et al. 2009).
Among the under-expressed proteins we identified, Dpysl2 reduction could be associated with the processes underlying PKU brain dysfunction, namely, decreased synaptic plasticity and decreased axonal outgrowth (van Spronsen et al. 2009). In fact, Dpysl2 belongs to a family of collapsin mediator proteins that facilitate neuron guidance, and induce axons of hippocampal neurons (Goshima et al. 1995; Inagaki et al. 2001). Dpysl2 is a component of semaphorin signaling in neurons (Deo et al. 2004) and plays a role in synaptic signaling by interacting with calcium channels. In particular, a functional proteomic study identified Dpysl2 as a protein interactor of the N-type presynaptic Ca2+ channel (CaV2.2) that is required for neurotransmitter release (Brittain et al. 2009). These proteins colocalize within pre-synaptic sites in hippocampal neurons where, interestingly, Dpysl2 over-expression elicits a significant increase in Ca2+ channel current density and in glutamate release. Accordingly, these stimulated effects are abolished in Dpysl2 knockdown. Thus, it is conceivable that the under-expression of Dpysl2 in PKU may affect the Ca2+ channel current density in a CaV2.2-dependent manner. In fact, down-regulation of CaV2.2 is implicated in the severe brain function damage in PKU (Dzhura et al. 1998; Qin and Smith 2007). Moreover, destabilization of Ca2+ channel function is the key factor driving synaptic dysfunction associated, in turn, with cognitive impairment in several neurodegenerative conditions (Chakroborty et al. 2012).
Also Dpysl3 and Dpysl4 were under-expressed in our data set. These proteins are collapsin-mediator proteins that form homo- and hetero-tetramers and facilitate neuron guidance, growth, and polarity. Interestingly, long-term potentiation, spatial learning, and memory were affected in Dpysl4 and Dpysl1 knock-out mice, which suggests that Dpysls proteins play a role in neurotransmission and synaptogenesis (Su et al. 2007; Quach et al. 2008). Accordingly, the under-expression of these proteins may contribute to the severe behavioral phenotype observed in PKU mice in terms of spatial learning deficit and impaired long-term potentiation (Cerreto et al. 2012). In this context, there is a strong correlation between the behavioral phenotype and the biochemical phenotype of the PKU mouse model. Depressed glutamatergic synaptic transmission in PKU, in fact, may be related to the cognitive deficit. In particular, impairment of glutamatergic synaptic transmission has been reported to induce differential expression of NMDA and AMPA receptor subunits (Martynyuk et al. 2005; Cerreto et al. 2012). These alterations may underlie the deficits in hippocampal long-term potentiation and spatial learning observed in PKU mice. Accordingly, we found that Glu2/3 and NR1 receptor subunits are significantly over-expressed in PKU mouse brain.
In conclusion, we demonstrate that several cerebral proteins are significantly under-expressed in the PKU mouse model. From the functional classification of these proteins, we identified proteins that are involved in metabolic processes, mainly glycolysis and the tricarboxylic acid cycle. Furthermore, the reduction of proteins Syn2 and Dpysl2 may result in decreased synaptic plasticity as well as in decreased axonal outgrowth. Moreover, by confirming the over-expression of the NMDA and AMPA receptor subunits – considered to be the substrates for learning and memory – the alteration at the level of these proteins appears to be relevant also to the overall homeostasis of brain functions. Our results indicating that brain damage in PKU depends also on reduced expression of proteins reinforce the concept of alteration in synaptic function and glutamatergic transmission in this disease.
Glossary
- ACN
acetonitrile
- AMBIC
ammonium bicarbonate
- AMPA
α-Amino-3-hydroxy-5-methyl-4-isoxazolepropionic acid
- BH4
tetrahydrobiopterin
- Ckb
creatine kinase B-type
- DAVID
database for annotation, visualization, and integrated discovery
- Dpysl2
dihydropyrimidinase-related protein 2
- HPA
hyperphenylalaninemia
- IEF
isoelectric focusing
- IPA
ingenuity pathway analysis software
- LC-MS/MS
liquid chromatography-tandem mass spectrometry
- MS/MS
tandem mass spectrometry
- Phe
phenylalanine
- PKU
phenylketonuria
- Syn2
synapsin II
- TCA cycle
tricarboxylic acid cycle
Acknowledgments and conflict of interest disclosure
We thank Jean Ann Gilder (Scientific Communication srl., Naples, Italy) for revising and editing the text; Monica Cerreto for preparing mouse brain tissues and Vittorio Lucignano, CEINGE-Biotecnologie Avanzate for technical assistance. This work was supported by grant RF-2010-2318372 from the Ministry of Health (to F.S.), grant PONa3_00067 (PRISM) - 2012 from Italian Ministry of University and Research (to F.S.) and grant POR Campania FSE 2007/2013 (Campus-Bioframe) from the Regione Campania (to F.S.).
All experiments were conducted in compliance with the ARRIVE guidelines. The authors have no conflict of interest to declare.
Supporting Information
Additional Supporting Information may be found in the online version of this article:
Protein identification by tandem mass spectrometry.
Supplementary
References
- Aksenov M, Aksenova M, Butterfield DA, Markesbery WR. Oxidative modification of creatine kinase BB in Alzheimer's disease brain. J. Neurochem. 2000;74:2520–2527. doi: 10.1046/j.1471-4159.2000.0742520.x. [DOI] [PubMed] [Google Scholar]
- Anderson PJ, Leuzzi V. White matter pathology in phenylketonuria. Mol. Genet. Metab. 2010;99:S3–S9. doi: 10.1016/j.ymgme.2009.10.005. [DOI] [PubMed] [Google Scholar]
- Anderson PJ, Wood SJ, Francis DE, Coleman L, Anderson V, Boneh A. Are neuropsychological impairments in children with early-treated phenylketonuria (PKU) related to white matter abnormalities or elevated phenylalanine levels? Dev. Neuropsychol. 2007;3:645–668. doi: 10.1080/87565640701375963. [DOI] [PubMed] [Google Scholar]
- Bélanger-Quintana A, Burlina A, Harding CO, Muntau AC. Up to date knowledge on different treatment strategies for phenylketonuria. Mol. Genet. Metab. 2011;104:S19–S25. doi: 10.1016/j.ymgme.2011.08.009. [DOI] [PMC free article] [PubMed] [Google Scholar]
- Blau N, van Spronsen FJ, Levy HL. Phenylketonuria. Lancet. 2010;376:1417–1427. doi: 10.1016/S0140-6736(10)60961-0. [DOI] [PubMed] [Google Scholar]
- Bogen IL, Jensen V, Hvalby Ø, Walaas SI. Glutamatergic neurotransmission in the synapsin I and II double knock-out mouse. Semin. Cell Dev. Biol. 2011;22:400–407. doi: 10.1016/j.semcdb.2011.07.004. [DOI] [PubMed] [Google Scholar]
- Brittain JM, Piekarz AD, Wang Y, Kondo T, Cummins TR, Khanna R. An atypical role for collapsin response mediator protein 2 (CRMP-2) in neurotransmitter release via interaction with presynaptic voltage-gated calcium channels. J. Biol. Chem. 2009;284:31375–31390. doi: 10.1074/jbc.M109.009951. [DOI] [PMC free article] [PubMed] [Google Scholar]
- Butterfield DA, Perluigi M, Sultana R. Oxidative stress in Alzheimer's disease brain: new insights from redox proteomics. Eur. J. Pharmacol. 2006;545:39–50. doi: 10.1016/j.ejphar.2006.06.026. [DOI] [PubMed] [Google Scholar]
- Cerreto M, Cavaliere P, Carluccio C, Amato F, Zagari A, Daniele A, Salvatore F. Natural phenylalanine hydroxylase variants that confer a mild phenotype affect the enzyme's conformational stability and oligomerization equilibrium. Biochim. Biophys. Acta. 2011;1812:1435–1445. doi: 10.1016/j.bbadis.2011.07.012. [DOI] [PubMed] [Google Scholar]
- Cerreto M, Mehdawy B, Ombrone D, Nisticò R, Ruoppolo M, Usiello A, Daniele A, Pastore L, Salvatore F. Reversal of metabolic and neurological symptoms of phenylketonuric mice treated with a PAH containing helper-dependent adenoviral vector. Curr. Gene Ther. 2012;12:48–56. doi: 10.2174/156652312799789280. [DOI] [PubMed] [Google Scholar]
- Chakroborty S, Briggs C, Miller MB, et al. Stabilizing ER Ca2 + channel function as an early preventative strategy for Alzheimer's disease. PLoS ONE. 2012;7:e52056. doi: 10.1371/journal.pone.0052056. [DOI] [PMC free article] [PubMed] [Google Scholar]
- Colavita I, Esposito N, Martinelli R, Catanzano F, Melo JV, Pane F, Ruoppolo M, Salvatore F. Gaining insights into the Bcr-Abl activity-independent mechanisms of resistance to imatinib mesylate in KCL22 cells: a comparative proteomic approach. Biochim. Biophys. Acta. 2010;1804:1974–1987. doi: 10.1016/j.bbapap.2010.04.009. [DOI] [PubMed] [Google Scholar]
- Corbo C, Orrù S, Gemei M, Noto RD, Mirabelli P, Imperlini E, Ruoppolo M, Vecchio LD, Salvatore F. Protein cross-talk in CD133 + colon cancer cells indicates activation of the Wnt pathway and upregulation of SRp20 that is potentially involved in tumorigenicity. Proteomics. 2012;12:2045–2059. doi: 10.1002/pmic.201100370. [DOI] [PubMed] [Google Scholar]
- Cunnane S, Nugent S, Roy M, et al. Brain fuel metabolism, aging, and Alzheimer's disease. Nutrition. 2011;27:3–20. doi: 10.1016/j.nut.2010.07.021. [DOI] [PMC free article] [PubMed] [Google Scholar]
- Daniele A, Cardillo G, Pennino C, Carbone MT, Scognamiglio D, Correra A, Pignero A, Castaldo G, Salvatore F. Molecular epidemiology of phenylalanine hydroxylase deficiency in Southern Italy: a 96% detection rate with ten novel mutations. Ann. Hum. Genet. 2006;71:185–193. doi: 10.1111/j.1469-1809.2006.00328.x. [DOI] [PubMed] [Google Scholar]
- Daniele A, Cardillo G, Pennino C, Carbone MT, Scognamiglio D, Esposito L, Correra A, Castaldo G, Zagari A, Salvatore F. Five human phenylalanine hydroxylase proteins identified in mild hyperphenylalaninemia patients are disease-causing variants. Biochim. Biophys. Acta. 2008;1782:378–384. doi: 10.1016/j.bbadis.2008.01.012. [DOI] [PubMed] [Google Scholar]
- Daniele A, Scala I, Cardillo G, et al. Functional and structural characterization of novel mutations and genotype-phenotype correlation in 51 phenylalanine hydroxylase deficient families from Southern Italy. FEBS J. 2009;276:2048–2059. doi: 10.1111/j.1742-4658.2009.06940.x. [DOI] [PubMed] [Google Scholar]
- Demirkol M, Giżewska M, Giovannini M, Walter J. Follow up of phenylketonuria patients. Mol. Genet. Metab. 2011;104:S31–S39. doi: 10.1016/j.ymgme.2011.08.005. [DOI] [PubMed] [Google Scholar]
- Deo RC, Schmidt EF, Elhabazi A, Togashi H, Burley SK, Strittmatter SM. Structural bases for CRMP function in plexin-dependent semaphorin3A signaling. EMBO J. 2004;23:9–22. doi: 10.1038/sj.emboj.7600021. [DOI] [PMC free article] [PubMed] [Google Scholar]
- Dobrowolski SF, Pey AL, Koch R, Levy H, Ellingson CC, Naylor EW, Martinez A. Biochemical characterization of mutant phenylalanine hydroxylase enzymes and correlation with clinical presentation in hyperphenylalaninaemic patients. J. Inherit. Metab. Dis. 2009;32:10–21. doi: 10.1007/s10545-008-0942-6. [DOI] [PubMed] [Google Scholar]
- Dzhura I, Naidenov V, Zhuravleva S, Kostyuk P, Shuba Y. Expression of Ca2 + channels from rat brain with model phenylketonuria in Xenopus oocytes. Brain Res. 1998;783:280–285. doi: 10.1016/s0006-8993(97)01351-6. [DOI] [PubMed] [Google Scholar]
- Elsas LJ, Greto J, Wierenga A. The effect of blood phenylalanine concentration on Kuvan™ response in phenylketonuria. Mol. Genet. Metab. 2011;102:407–412. doi: 10.1016/j.ymgme.2010.12.003. [DOI] [PubMed] [Google Scholar]
- Embury JE, Charron CE, Martynyuk A, Zori AG, Liu B, Ali SF, Rowland NE, Laipis PJ. PKU is a reversible neurodegenerative process within the nigrostriatum that begins as early as 4 weeks of age in Pah(enu2) mice. Brain Res. 2007;1127:136–150. doi: 10.1016/j.brainres.2006.09.101. [DOI] [PMC free article] [PubMed] [Google Scholar]
- Ercal N, Aykin-Burns N, Gurer-Orhan H, McDonald JD. Oxidative stress in a phenylketonuria animal model. Free Radic. Biol. Med. 2002;32:906–911. doi: 10.1016/s0891-5849(02)00781-5. [DOI] [PubMed] [Google Scholar]
- Ferreira A, Paganoni S. The formation of synapses in the central nervous system. Mol. Neurobiol. 2002;26:69–79. doi: 10.1385/MN:26:1:069. [DOI] [PubMed] [Google Scholar]
- Ferreira A, Rapoport M. The synapsins: beyond the regulation of neurotransmitter release. Cell. Mol. Life Sci. 2002;59:589–595. doi: 10.1007/s00018-002-8451-5. [DOI] [PMC free article] [PubMed] [Google Scholar]
- Fornasiero EF, Raimondi A, Guarnieri FC, Orlando M, Fesce R, Benfenati F, Valtorta F. Synapsins contribute to the dynamic spatial organization of synaptic vesicles in an activity-dependent manner. J. Neurosci. 2012;32:12214–12227. doi: 10.1523/JNEUROSCI.1554-12.2012. [DOI] [PMC free article] [PubMed] [Google Scholar]
- González MJ, Gutiérrez AP, Gassió R, Fusté ME, Vilaseca MA, Campistol J. Neurological complications and behavioral problems in patients with phenylketonuria in a follow-up unit. Mol. Genet. Metab. 2011;104:S73–S79. doi: 10.1016/j.ymgme.2011.07.015. [DOI] [PubMed] [Google Scholar]
- Goshima Y, Nakamura F, Strittmatter P, Strittmatter SM. Collapsin-induced growth cone collapse mediated by an intracellular protein related to UNC-33. Nature. 1995;376:509–514. doi: 10.1038/376509a0. [DOI] [PubMed] [Google Scholar]
- de Groot MJ, Hoeksma M, Blau N, Reijngoud DJ, van Spronsen FJ. Pathogenesis of cognitive dysfunction in phenylketonuria: review of hypotheses. Mol. Genet. Metab. 2010;99:S86–S89. doi: 10.1016/j.ymgme.2009.10.016. [DOI] [PubMed] [Google Scholar]
- Hilfiker S, Benfenati F, Doussau F, Nairn AC, Czernik AJ, Augustine GJ, Greengard P. Structural domains involved in the regulation of transmitter release by synapsins. J. Neurosci. 2005;25:2658–2669. doi: 10.1523/JNEUROSCI.4278-04.2005. [DOI] [PMC free article] [PubMed] [Google Scholar]
- Hörster F, Schwab MA, Sauer SW, Pietz J, Hoffmann GF, Okun JG, Kölker S, Kins S. Phenylalanine reduces synaptic density in mixed cortical cultures from mice. Pediatr. Res. 2006;59:544–548. doi: 10.1203/01.pdr.0000203091.45988.8d. [DOI] [PubMed] [Google Scholar]
- Imperlini E, Mancini A, Spaziani S, Martone D, Alfieri A, Gemei M, del Vecchio L, Buono P, Orrù S. Androgen receptor signaling induced by supraphysiological doses of dihydrotestosterone in human peripheral blood lymphocytes. Proteomics. 2010;10:3165–3175. doi: 10.1002/pmic.201000079. [DOI] [PubMed] [Google Scholar]
- Imperlini E, Colavita I, Caterino M, Mirabelli P, Pagnozzi D, Del Vecchio L, Di Noto R, Ruoppolo M, Orrù S. The secretome signature of colon cancer cell lines. J. Cell. Biochem. 2013;114:2577–2587. doi: 10.1002/jcb.24600. [DOI] [PubMed] [Google Scholar]
- Inagaki N, Chihara K, Arimura N, Ménager C, Kawano Y, Matsuo N, Nishimura T, Amano M, Kaibuchi K. CRMP-2 induces axons in cultured hippocampal neurons. Nat. Neurosci. 2001;4:781–782. doi: 10.1038/90476. [DOI] [PubMed] [Google Scholar]
- Li D, Gu X, Lu L, Liang L. Effects of phenylalanine on the survival and neurite outgrowth of rat cortical neurons in primary cultures: possible involvement of brain-derived neurotrophic factor. Mol. Cell. Biochem. 2010;339:1–7. doi: 10.1007/s11010-009-0364-2. [DOI] [PubMed] [Google Scholar]
- MacDonald A, Rocha JC, van Rijn M, Feillet F. Nutrition in phenylketonuria. Mol. Genet. Metab. 2011;104:S10–S18. doi: 10.1016/j.ymgme.2011.08.023. [DOI] [PubMed] [Google Scholar]
- Martynyuk AE, Glushakov AV, Sumners C, Laipis PJ, Dennis DM, Seubert CN. Impaired glutamatergic synaptic transmission in the PKU brain. Mol. Genet. Metab. 2005;86:S34–S42. doi: 10.1016/j.ymgme.2005.06.014. [DOI] [PubMed] [Google Scholar]
- Martynyuk AE, van Spronsen FJ, Van der Zee EA. Animal models of brain dysfunction in phenylketonuria. Mol. Genet. Metab. 2010;99:S100–S105. doi: 10.1016/j.ymgme.2009.10.181. [DOI] [PubMed] [Google Scholar]
- Michals-Matalon K, Bhatia G, Guttler F, Tyring SK, Matalon R. Response of phenylketonuria to tetrahydrobiopterin. J. Nutr. 2007;137:1564S–1567S. doi: 10.1093/jn/137.6.1564S. [DOI] [PubMed] [Google Scholar]
- Mitchell JJ, Trakadis YJ, Scriver CR. Phenylalanine hydroxylase deficiency. Genet. Med. 2011;13:697–707. doi: 10.1097/GIM.0b013e3182141b48. [DOI] [PubMed] [Google Scholar]
- Moyle JJ, Fox AM, Arthur M, Bynevelt M, Burnett JR. Meta-analysis of neuropsychological symptoms of adolescents and adults with PKU. Neuropsychol. Rev. 2007;17:91–101. doi: 10.1007/s11065-007-9021-2. [DOI] [PubMed] [Google Scholar]
- Pietz J. Neurological aspects of adult phenylketonuria. Curr. Opin. Neurol. 1998;11:679–688. doi: 10.1097/00019052-199812000-00012. [DOI] [PubMed] [Google Scholar]
- Pietz J, Rupp A, Ebinger F, Rating D, Mayatepek E, Boesch C, Kreis R. Cerebral energy metabolism in phenylketonuria: findings by quantitative In vivo 31P MRspectroscopy. Pediatr. Res. 2003;53:654–656. doi: 10.1203/01.PDR.0000055867.83310.9E. [DOI] [PubMed] [Google Scholar]
- Qin M, Smith CB. Regionally selective decreases in cerebral glucose metabolism in a mouse model of phenylketonuria. J. Inherit. Metab. Dis. 2007;30:318–325. doi: 10.1007/s10545-007-0583-1. [DOI] [PubMed] [Google Scholar]
- Quach TT, Massicotte G, Belin MF, Honnorat J, Glasper ER, Devries AC, Jakeman LB, Baudry M, Duchemin AM, Kolattukudy PE. CRMP3 is required for hippocampal CA1 dendritic organization and plasticity. FASEB J. 2008;22:401–409. doi: 10.1096/fj.07-9012com. [DOI] [PMC free article] [PubMed] [Google Scholar]
- Ribas GS, Sitta A, Wajner M, Vargas CR. Oxidative stress in phenylketonuria: what is the evidence? Cell. Mol. Neurobiol. 2011;31:653–662. doi: 10.1007/s10571-011-9693-2. [DOI] [PMC free article] [PubMed] [Google Scholar]
- Rosahl TW, Spillane D, Missler M, Herz J, Selig DK, Wolff JR, Hammer RE, Malenka RC, Südhof TC. Essential functions of synapsins I and II in synaptic vesicle regulation. Nature. 1995;375:488–493. doi: 10.1038/375488a0. [DOI] [PubMed] [Google Scholar]
- Schmidtko A, Luo C, Gao W, Geisslinger G, Kuner R, Tegeder I. Genetic deletion of synapsin II reduces neuropathic pain due to reduced glutamate but increased GABA in the spinal cord dorsal horn. Pain. 2008;139:632–643. doi: 10.1016/j.pain.2008.06.018. [DOI] [PubMed] [Google Scholar]
- Scriver CR. The PAH gene, phenylketonuria, and a paradigm shift. Hum. Mutat. 2007;28:831–845. doi: 10.1002/humu.20526. [DOI] [PubMed] [Google Scholar]
- Scriver CR, Kaufman S. The hyperphenylalaninemia: phenylalanine hydroxylase deficiency. In: Scriver CR, William SS, Childs B, Beaudet AL, Valle D, Kinzler KW, Vogelstein B, editors. The Metabolic and Molecular Bases of Inherited Disease. New York: McGraw-Hill; 2001. pp. 1667–1724. [Google Scholar]
- Seashore MR, Friedman E, Novelly RA, Bapat V. Loss of intellectual function in children with phenylketonuria after relaxation of dietary phenylalanine restriction. Pediatrics. 1985;75:226–232. [PubMed] [Google Scholar]
- Shi Z, Sellers J, Moult J. Protein stability and in vivo concentration of missense mutations in phenylalanine hydroxylase. Proteins. 2012;80:61–70. doi: 10.1002/prot.23159. [DOI] [PMC free article] [PubMed] [Google Scholar]
- van Spronsen FJ, Enns GM. Future treatment strategies in phenylketonuria. Mol. Genet. Metab. 2010;99:S90–S95. doi: 10.1016/j.ymgme.2009.10.008. [DOI] [PubMed] [Google Scholar]
- van Spronsen FJ, Hoeksma M, Reijngoud DJ. Brain dysfunction in phenylketonuria: is phenylalanine toxicity the only possible cause? J. Inherit. Metab. Dis. 2009;32:46–51. doi: 10.1007/s10545-008-0946-2. [DOI] [PubMed] [Google Scholar]
- Su KY, Chien WL, Fu WM, et al. Mice deficient in collapsin response mediator protein-1 exhibit impaired long-term potentiation and impaired spatial learning and memory. J. Neurosci. 2007;27:2513–2524. doi: 10.1523/JNEUROSCI.4497-06.2007. [DOI] [PMC free article] [PubMed] [Google Scholar]
- Ziesch B, Weigel J, Thiele A, Mütze U, Rohde C, Ceglarek U, Thiery J, Kiess W, Beblo S. Tetrahydrobiopterin (BH4) in PKU: effect on dietary treatment, metabolic control, and quality of life. J. Inherit. Metab. Dis. 2012;35:983–992. doi: 10.1007/s10545-012-9458-1. [DOI] [PubMed] [Google Scholar]
Associated Data
This section collects any data citations, data availability statements, or supplementary materials included in this article.
Supplementary Materials
Protein identification by tandem mass spectrometry.
Supplementary