

Abstract
We describe a believed-novel procedure for translating metabolite profiles (metabolome) into the set of metabolic fluxes (fluxome) from which they originated. Methodologically, computational modeling is integrated with an analytical platform comprising linear optimization, continuation and dynamic analyses, and metabolic control. The procedure was tested with metabolite profiles obtained from ex vivo mice Langendorff-heart preparations perfused with glucose. The metabolic profiles were analyzed using a detailed kinetic model of the glucose catabolic pathways including glycolysis, pentose phosphate (PP), glycogenolysis, and polyols to translate the glucose metabolome of the heart into the fluxome. After optimization, the ability of the model to simulate the initial metabolite profile was confirmed, and metabolic fluxes as well as the structure of control and regulation of the glucose catabolic network could be calculated. We show that the step catalyzed by phosphofructokinase together with ATP demand and glycogenolysis exert the highest control on the glycolytic flux. The negative flux control exerted by phosphofructokinase on the PP and polyol pathways revealed that the extent of glycolytic flux directly affects flux redirection through these pathways, i.e., the higher the glycolytic flux the lower the PP and polyols. This believed-novel methodological approach represents a step forward that may help in designing therapeutic strategies targeted to diagnose, prevent, and treat metabolic diseases.
Introduction
Considerable effort has been invested in whole-genome/proteome screenings to detect genetic loci contributing to the susceptibility of complex human diseases such as diabetes and cancer. As a result, gene/protein changes have been cataloged and with the help of systems biology approaches are now transforming medical and clinical practice (1). Yet, articulating “omics” technologies into quantitative and physiologically meaningful mechanisms remains a challenging (2–4) but promising frontier to explore in the attempt to effectively combat chronic diseases such as diabetes.
The complex nature of a disease often originates from impairment of several steps in different biochemical pathways. For instance, the net effect of an inborn error of metabolism on the organ and organism levels is the alteration of one or more metabolite fluxes (5). A metabolic flux is defined as the rate (i.e., molar per unit time) at which metabolites are converted or transported between compartments in a network of biochemical reactions. Ultimately, it is the concept of metabolic flux that is crucial in the translation of genotype and environmental factors into a healthy or disease phenotype.
In systemic disorders like diabetes, a whole network of metabolic fluxes is drastically altered. Metabolic remodeling occurs at the level of the genome, transcriptome, and proteome, including posttranslational modifications (2) but, in the end, enzymatic activities and the resulting metabolite profiles will reflect all those changes. Thus, in principle, a metabolite profile could be translated into the set of fluxes that gave rise to the metabolome.
The set of metabolic fluxes, or fluxome, represents a dynamic picture of the phenotype, inasmuch as it captures the metabolome in its functional interactions with the environment and the genome (4,6). As such, the fluxome integrates information on several cellular processes, and hence it is a unique phenotypic signature of cells (2). A main advantage of fluxomics over genomics and proteomics is that it is based on information from metabolites, which are far fewer than genes or proteins (7). For instance, in the mouse there are ∼600 detectable low-molecular-weight intermediates (8), whereas there are ∼10,000 proteins and ∼22,000 protein-encoding genes (4).
For systemic metabolic remodeling, as occurs in diabetes or cancer, metabolic fluxes become crucial for quantitative interpretation (5). For example, the cardiac redox status plays a relevant role in diabetic cardiomyopathy (9). The myocardial redox balance can change in response to hyperglycemia, a prevalent condition in diabetic patients, due to redirection of glucose catabolic fluxes through the NADPH-consuming (polyol) or NADPH-generating (pentose-phosphate (PP)) pathways, respectively. To assess the extent of flux through different pathways occurring simultaneously, a quantitative systems biology approach is needed.
Herein, we introduce a believed-novel metabolomic-fluxomic procedure that enables the translation of high throughput metabolite profiles (metabolome) into the fluxome, from which the profiles emerged. Importantly, this methodology also allows one to determine the structure of control and regulation of the fluxome. Our approach consists of the combination of an analytical platform—comprising several integrated quantitative methodologies—with a detailed computational kinetic model that accounts for regulatory interactions. This analytical procedure, spanning from metabolome to fluxome, is applicable to any metabolic system that can be described by kinetic modeling. The advantage of our approach over existing methodologies (10) is that it incorporates regulatory information (e.g., effectors, feedbacks) crucial for understanding dynamic systems. Heart function is an ideal prototypic system to test the usefulness of the approach proposed herein. Because the heart is constantly changing in response to energy demand, the choice of kinetic modeling is justified because it can account for time-dependent behavior. Applying our procedure and combining metabolic flux estimation with cardiac work measurement will lend insight into mechanisms underlying contractile impairment.
Materials and Methods
Computational model description
Kinetic modeling of glycolytic, glycogenolytic, polyol, and PP pathways
The computational model consists of a detailed kinetic scheme of glucose catabolism comprising glycolysis, glycogenolysis, PP, and polyol (marked in red) pathways (Fig. 1 and see Section S1 in the Supporting Material). Depicted also are the exchanges with the extracellular medium including input (glucose, O2) and output (lactate, fructose, xylitol) fluxes (light-blue arrows).
Figure 1.
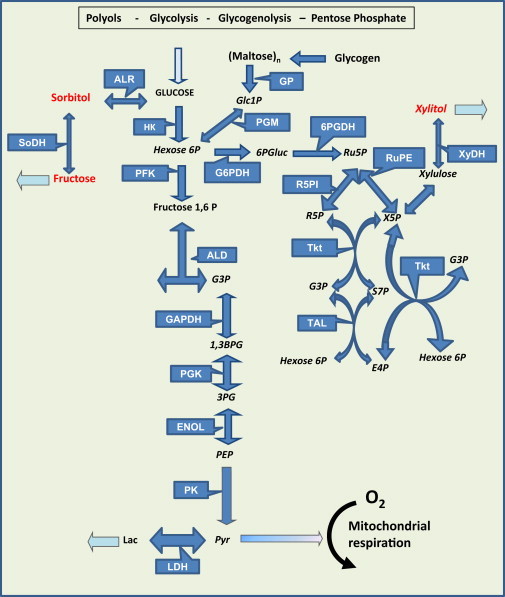
Main glucose degradation pathways in the heart. The glycolytic, glycogenolytic, pentose phosphate (PP) and polyol pathways taken into account by the computational kinetic model are displayed, along with extracellular exchanges comprising input (glucose, O2) and output (lactate, fructose, xylitol) fluxes (light-blue arrows). (Red) Intermediates of the polyol pathway. Metabolites: Glc, glucose; Hexose 6P, accounts for Glucose 6-phosphate plus Fructose 6-phosphate; G3P, glyceraldehyde 3-phosphate; 1,3-BPG, 1,3-biphosphoglycerate; 3PG, 3-phophoglycerate; PEP, phosphoenolpyruvate; Pyr, pyruvate; Lac, lactate; Glc1P, glucose 1-phosphate; (Maltose)n, maltooligosaccharides (maltose, malto-triose, -tetraose, -hexaose, etc.); 6PGluc, 6-phosphogluconate; Ru5P, ribulose 5-phosphate; R5P, ribose 5-phosphate; X5P, xylulose 5-phosphate; E4P, erythrose 4-phosphate; S7P, sedoheptulose 7-phosphate. Enzymes: ALR, aldose reductase; SoDH, sorbitol dehydrogenase; HK, hexokinase; GP, glycogen phosphorylase; PGM, phosphoglucomutase; HK, hexokinase; PFK, phosphofructokinase 1; ALD, aldolase; GAPDH, glyceraldehyde 3-phosphate dehydrogenase; PGK, phosphoglycerate kinase; ENOL, enolase; PK, pyruvate kinase; LDH, lactate dehydrogenase; G6PDH, glucose 6-phosphate dehydrogenase; 6PGDH, 6-phosphogluconate dehydrogenase; R5PI, Ribose 5-phosphate isomerase; Transket, transketolase; RuPE, Ribulose-phosphate 3-epimerase; Tkt, transketolase; TAL, transaldolase. To see this figure in color, go online.
The model rate equations account for the effect of known regulatory interactions and effectors, e.g., ATP for glucose 6 phosphate dehydrogenase (G6PDH), AMP for phosphofructokinase (PFK), or GDP for pyruvate kinase (PK). In addition to the metabolite concentrations the rate of pyruvate transport into mitochondria was provided as input. The rate at which pyruvate is consumed by mitochondria was derived from the rate of oxygen consumption reported for ex vivo heart preparations (11), analyzed under similar substrate conditions without external workload as in Langendorff-perfused hearts. Two moles of O2 will be reduced to H2O in the respiratory chain per mol of pyruvate consumed by mitochondria.
Next, we describe each pathway accounted for by the model, and in a more detailed manner all rate equations are included in the Supporting Material.
Glycolysis
The model of glycolysis was based on Lambeth and Kushmerick (12), who describe the carbohydrate degradation pathway in mammalian skeletal muscle (see Section S2 in the Supporting Material). This model starts from glucose-6-phosphate and takes into account the steps down to lactate formation, excluding hexokinase (HK). The rate expressions and kinetic parameters of HK are from Lueck and Fromm (13) (see Eq. S2). We have introduced an expression to model glucose transport based on a Fick’s law of diffusion, thus dependent on the concentration gradient across the plasma membrane (Eq. 1).
Important regulatory steps are described in the model, such as the rate expression of the following: 1) phosphofructokinase, which includes its inhibition by AMP and ATP, its dependence on substrates ATP and fructose 6P, and products ADP and fructose 1,6-bisphosphate (see Eq. S3); and 2) glyceraldehyde 3-phosphate dehydrogenase, which obeys a reversible reaction accounting for hyperbolic kinetic dependence on glyceraldehyde 3-phosphate and biphosphoglycerate, and negative cooperativity by both NAD and NADH (see Eq. S5) (14).
Glycogenolysis
The glycogen degradation pathway comprises debranching enzymes, phosphorylase a and b, and phosphoglucomutase enzymes (see Eqs. S10–S12). The enzymatic rate expressions were based on the skeletal muscle model (12).
PP pathway
The oxidative and nonoxidative branches of the PP pathway were taken into account by the model (see Eqs. S14–S20 in Section S2.3 in the Supporting Material). The rate expressions for each of the enzymatic steps involved in the PP pathway were based on Nishino et al. (15). These authors parameterized their model according to data from McIntyre et al. (16). G6PDH, the first enzyme of the pathway, was parameterized according to Buckwitz et al. (17) and includes ATP inhibition (see Eq. S14).
Polyols
Activation of the polyol pathway may have adverse consequences for heart function (18). Hyperglycemia (19) and sustained β-adrenergic stimulation are both known to stimulate polyols (20). The sorbitol route included fructose synthesis by sorbitol dehydrogenase, in addition to aldose reductase (see Section S2.4 in the Supporting Material). The rate expression and kinetic parameters of aldose reductase were derived from the work of Grimshaw et al. (21) with kinetic data from Kubiseski et al. (22) and Halder and Crabbe (23) (see Eq. S21). Sorbitol and xylitol dehydrogenases were modeled following the kinetic characterization and parameters determined by Karacaoğlan and Ozer (24) and O’Brien et al. (25) (see Eqs. S22 and S23).
ATPase, nonglycolytic NADH consumption, NADPH consumption, and polyol transport
To achieve steady-state behavior, the model formulation also includes rate expressions accounting for the consumption of adenine and pyridine nucleotides and polyol excretion. We assumed that the kinetic behavior of those processes can be represented by hyperbolic functions (see Eqs. S24–S28). The equation representing ATP hydrolysis was considered irreversible, unlike those corresponding to NAD(P)H consumption, which were modeled as reversible reactions.
Integrated analytical platform
Kinetic modeling of metabolic networks, and their continuation and dynamic analyses
Other than steady-state fluxes (26–29), a realistic representation of transient behavior requires detailed kinetic modeling including mechanistic regulatory information such as flux regulation, e.g., by substrate and product inhibition/activation. Kinetic models can also accommodate the nonlinear behavior imparted by feedback and feedforward regulatory mechanisms. Continuation analyses of nonlinear kinetic models allow the exploration of their qualitative as well as quantitative behavior (30–32).
Computer model simulations as a function of time or analyzed at the steady state were carried out with MATCONT (sourceforge.net/projects/matcont), a package designed for continuation analysis implemented in the software MATLAB (The MathWorks, Natick, MA) (33,34). The kinetic model of glucose catabolism is represented by a system of ordinary differential equations (ODEs) (see Section S1 in the Supporting Material), which was computed as a function of time until a steady state is reached, i.e., when the state variable derivatives are <1 × 10⁻¹⁰. MATLAB’s built-in solver, ODE15s, designed for stiff equations, was used as integrator. This ODE solver adjusts the integration step size during the computation.
Linear optimization of Vmax in the kinetic model
To quantify metabolic fluxes from metabolite profiles using the kinetic model, we assume the validity of the association/dissociation affinity constants determined in vitro for each of the enzymatic steps. Another assumption is that the metabolite concentrations correspond to a steady state, which is experimentally justified by whole heart analysis after 30 min perfusion under specified conditions (see Preparation and Perfusion of Mouse Hearts). Consequently, the Vmax of each enzyme is the only unknown kinetic parameter subjected to optimization. Metabolic enzymes may change their amounts after transcriptional-translational regulation, or after posttranslational modifications, which are reflected by their Vmax values.
We used linear optimization (28,35) because the number of Vmax unknowns (one per step in the network) is larger than the number of metabolites available from metabolomics, implying that the system is underdetermined. Thus, instead of calculating a unique solution for the system, we obtain a volume of possible solutions. This entails that we are able to calculate a range of fluxes compatible with the given initial input, i.e., metabolites concentration profile and exchange fluxes with the extracellular medium. This optimization procedure was inspired by the flux balance analysis developed by Savinell and Palsson (29). For optimization we proceed to represent the rate of each step in the metabolic network by explicit rate expressions that are, in all cases, a linear function of Vmax. The latter assumption is required for applying linear optimization methods.
The method is based on the general equation
| (1) |
with dx/dt representing the vector of derivatives of the state variables (intermediary metabolite concentrations); S is the stoichiometric matrix of size n × m, with n and m being the number of metabolites and metabolic fluxes, respectively; and b is the vector of transport and demand processes, e.g., biosynthesis. Finally, v stands for the vector rates expressed as the rate equation in the model with known kinetic parameters except for Vmax, which is subjected to optimization. In the network analyzed herein (Fig. 1), n = 19 and m = 25; thus, the dimension of the solution space is m−n = 6.
Optimization of the linear algebraic system is performed with the Simplex algorithm (implemented in MATLAB). Maximization of ATP synthesis fluxes or minimization of redox consumption were used as objective functions to constrain the optimization procedure. In Table S24, we quantify the impact of different objective functions on Vmax (Supporting Material).
Analytical and numerical methods utilized
-
1.
The function “linprog” from MATLAB (The MathWorks) was utilized with the Simplex algorithm for optimization of Vmax values.
-
2.
Within the volume of possible solutions, a solution was chosen in order to corroborate that the system is able to reproduce the original metabolite profile. The solution was calculated with the “linsolve” function from MATLAB using six of the maximal values of Vmax downstream in the metabolic network, e.g., , , , and ETK2, because they are relatively less interdependent as compared to upstream ones.
After exploring several combinations of the optimized Vmax values, we chose a solution that fulfilled two conditions: 1) Vmax > 0 for all enzyme activities in the network, and 2) a solution that belongs to the hypervolume of dimension 6 (see Section S2.2 in the Supporting Material).
With the solution at hand, i.e., the set of optimized Vmax values, we ran computer simulations to reproduce the initial metabolite profile; once the latter was simulated by the model at steady state, we were also able to obtain the rate or flux through each individual step of the metabolic network. We consider that the set of metabolic fluxes determined correspond to one of the vertices of the volume of solutions corresponding to the fluxome, as illustrated for a simpler system with a two-dimensional solution space (see Fig. S1). To demonstrate the potential of the method, linear algebra functions from the software MATLAB were utilized for matrix calculations to quantitate the main rate-controlling and regulatory steps of the metabolic network, as described next.
Quantifying control and regulatory steps in the metabolic network
Metabolic control analysis quantifies the control in a metabolic pathway through two types of coefficient: the flux (or metabolite concentration) control coefficient and the elasticity coefficient (4,36,37). In general terms, “control” is used to describe quantitatively the effect on flux produced by a change in enzyme activity, whereas “regulation” denotes the modulation of enzyme activity by effectors. In a quantitative sense, regulation refers to how the flux of a pathway is modified through the effect on the rate of an individual step by cellular or external factors, which may include intermediary metabolite, ion concentrations, or pH, and is quantified by the response coefficient. This coefficient measures the fractional change in flux, e.g., glycolysis, in response to a fractional change in an external or internal parameter A (e.g., an effector such as fatty acids) other than enzyme activity (37).
The method of Cortassa et al. (36) and Reder (38) was used to analyze control and regulation of the biochemical network shown in Fig. 1. In addition to the flux and metabolite control coefficients, this method represents a way to analyze, through the response coefficients the sensitivity of the metabolic system to perturbations triggered by an internal change in the system or to an environmental perturbation. The method has been extensively described and validated in Cortassa et al. (36).
The analysis uses the stoichiometric matrix, which defines the structural relationships between the processes and the intermediates participating in the metabolic network, and the elasticity matrix, defined by the dependence of each process in the network upon intermediates and effectors (e.g., metabolites, ions) included in the model (see Section S3 in the Supporting Material). The elasticity matrix is obtained from the derivatives of the rate expressions of individual processes with respect to each intermediate in the metabolic network.
The following matrix relationships were used in the computation of flux and metabolite concentration control coefficients (36),
| (2) |
| (3) |
with C and Γ referring to the matrices of flux- and metabolite-concentration control coefficients, respectively; Idr is the identity matrix of dimension r, the number of processes in the network under study; Dxv is the elasticity matrix; Sr is the reduced stoichiometric matrix; and L is the link matrix that relates the reduced- to the full-stoichiometric matrix of the system.
The stoichiometric matrix Sr is the same one used in the optimization procedure described above, after eliminating redundant rows (see Section S3 in the Supporting Material).
Translating metabolite profiles into metabolic fluxes
To quantitate metabolic fluxes through the glucose degradation pathways (Fig. 1) underpinning the metabolite profile shown Table 1, we followed the flow diagram depicted in Fig. 2.
Table 1.
Comparison of experimental and model-simulated metabolite concentrations
| Metabolite | Experimentala | Model |
|---|---|---|
| Glucose (external) | 11 | |
| Glucose (internal) | 1.52 | 1.47 |
| Maltosides | 5.6 ± 0.4 | 5.6 |
| G1P | 0.163 ± 0.004 | 0.15 |
| F6P + G6P | 4.06 ± 0.27 | 4.20 |
| F1,6bP | 0.015 ± 0.005 | 0.0147 |
| G3P | <0.01 | 0.009 |
| 1,3 DPG | <0.01 | 6.6 × 10⁻⁴ |
| 3-PG | 0.57 ± 0.04 | 0.56 |
| PEP | <0.01 | 1.99 × 10⁻³ |
| Pyruvate | <0.01 | 8.5 × 10⁻³ |
| Ru5P + X5P | 2.58 ± 0.68 | 2.54 |
| R5P | 0.29 ± 0.07 | 0.39 |
| Sorbitol | 0.67 ± 0.32 | 0.65 |
| Fructose | 1.7 ± 1.2 | 1.72 |
| Xylitol | 0.65 ± 0.18 | 0.66 |
Experimental and model-simulated concentrations are expressed in mmol/L and experimental values are displayed as mean ± SE (n = 6).
Figure 2.
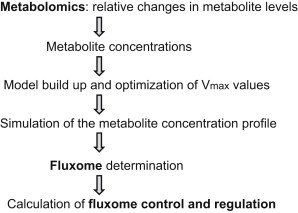
Work-flow diagram leading from metabolite profiling to the fluxome, and the analysis of its control and regulatory properties.
Conversion of metabolite profiles from relative to quantitative changes
Metabolite profiling performed under controlled conditions informs relative changes in metabolites (see Preparation and Perfusion of Mouse Hearts, and see Section S6 in the Supporting Material). To calculate the fluxes through the network, effective concentrations (in molar units) of metabolites are used. Metabolite concentrations are inputs of the rate expressions from the kinetic model, needed to calculate metabolic fluxes.
The same heart samples that were utilized to perform metabolite profiling, were analyzed by standard enzymatic assay to determine the actual concentration of representative metabolites (glucose, glycerol, glutamate, and lactate) present in the profiles. These metabolite concentration values were used to calibrate the area of the mass spectrometric (MS) peaks to determine the concentrations of all other metabolites present in the MS profiles as follows:
| (4) |
Mean Areastd was determined from the area under the peak of the corresponding molecular ion in the mass spectrum. The Massstd was calculated from the number of moles determined enzymatically in the same samples that were analyzed by MS multiplied by the mass of the molecular ion. The moles of metabolite in the sample were calculated according to
| (5) |
where MW stands for molecular weight.
In this procedure, we assume that the area under the peak is proportional to the mass of the molecular ion impacting the MS detector. The sample analyzed by MS corresponded to 20 mg wet weight heart tissue. It was considered that 1 g of wet weight tissue corresponds to 0.42 mL of intracellular water (39).
The metabolite concentrations calculated were used as input data for the model to optimize Vmax values as described before. After optimization, the model was utilized to simulate the metabolite concentration profile (Table 1). Another input of our procedure is given by the fluxes of exchange with the extracellular medium, i.e., rates of oxygen and glucose consumption, and lactate excretion. These fluxes provide a reference point to estimate the intracellular fluxes. Specifically for this work, we used rates of O2 consumption reported in How et al. (40).
Preparation and perfusion of mouse hearts
Male wild-type C57BLKS/J-lepr+/lepr+ (+/+) mice, 8–10 weeks of age, obtained from Jackson Laboratory (Bar Harbor, ME), were euthanized by pentobarbital injection following the requirements of the Institutional Animal Care/Use Committee at Johns Hopkins University, adherent to National Institutes of Health guidelines. After rapid excision, hearts were retrogradely perfused (employing the Langendorff technique) with Krebs-Henseleit buffer, pH 7.4, containing 1.2 mM Pi, 0.5 mM free Mg2+, 1.07 mM free Ca2+, and 11 mM glucose as described in Tocchetti et al. (9). Hearts were perfused during ∼30 min while paced with a pacing electrode (Radnoti, Monrovia, CA) at 600 bpm (10 Hz, 4 ms duration, 4 V) using a stimulator (Grass Instruments, Quincy, MA).
Vascular tone was assessed through coronary perfusion pressure (CPP) and LV function was monitored with a water-filled, customized latex balloon inserted in the left ventricle and connected to a P23XL pressure transducer with interface cable (Harvard Apparatus Instruments, Holliston, MA) and coupled to a model No. DA100 system (BIOPAC, Santa Barbara, CA) for continuous data recording and offline analysis. LV end-diastolic pressure was set at 5–10 mmHg by adjusting the balloon volume with a Gilmont micrometer syringe (Cole-Parmer, Vernon Hills, IL). The LV-developed (systolic-diastolic) pressure, CPP (both in mmHg), and maximal rates of contraction (dP/dtmax) and relaxation (dP/dtmin) (both in mmHg/s) were determined. After perfusion, hearts were snap-frozen in liquid nitrogen and sent to Metabolon (Research Triangle Park, NC) for nontargeted metabolite profiling (see Section S4 in the Supporting Material).
Results
Metabolomics analysis of intact mouse hearts
As a first test of our procedure for translating metabolomics into fluxomics, we performed metabolite profiling in intact Langendorff-perfused hearts. Fig. 3 shows the metabolite profiles from the glucose degradation pathways (Fig. 1) as determined in mouse hearts superfused with normal 11 mM glucose. Under these conditions, heart functional variables were (mean ± SE, n = 6–11 hearts): LV-developed pressure (mmHg) = 54 ± 6.9; dP/dtmax (mmHg s−1) = 1545 ± 166; dP/dtmin (mmHg s−1) = −1442 ± 145; CPP (mmHg) = 85.8 ± 0.97.
Figure 3.
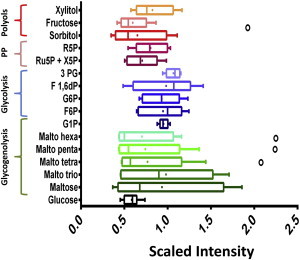
Metabolome of glucose utilization pathways obtained from intact mouse heart perfused with normal glucose. Represented are the relative metabolite levels detected in hearts perfused with 11 mM glucose under the conditions described in Materials and Methods (n = 6 hearts). Metabolites and their corresponding pathways are indicated on the y axis. The relative scale intensity in the x axis was determined rescaling each biochemical (n = 6) to set the median equal to 1.0 (Metabolon). (Whiskers plot) Median and the mean (line and dot within the box, respectively), upper and lower 75 and 25% percentiles of the box. (Dots) Outliers beyond the whiskers of the plots. To see this figure in color, go online.
Translating metabolite concentrations into metabolic fluxes
The metabolite profile (relative metabolite changes) shown in Fig. 3 constitutes the initial departure point leading to the estimation of metabolite concentration. After optimizing Vmax, we verified that a solution from the solution space can reproduce the initial metabolite profile by numerical simulation.
Table 1 shows the metabolites concentrations determined experimentally compared with model simulation. Considering experimental error, the computational model accurately reproduced metabolite concentrations from the profile observed experimentally.
Fig. 4 depicts a set of fluxes corresponding to the glucose catabolic fluxome (in μM s−1) exhibited by mouse hearts perfused with glucose only. Displayed is the flux distribution through glycolysis, immediately upstream and downstream of the branch toward the polyol (sorbitol), glycogenolytic, and PP routes. The mouse heart was able to sustain a glycolytic flux as high as 41.8 μM s−1 upstream glyceraldehyde 3-phosphate (G3P) (Fig. 4). The PP pathway sustained a flux that represents 32% of the glycolytic flux (13.6 μM s−1), and is approximately three orders-of-magnitude higher than the flux through the polyol pathway (Fig. 4). The mouse heart is able to utilize internal stores of glycogen, revealed by glycogenolysis flux values as high as 36.5 μM s−1 under these conditions.
Figure 4.
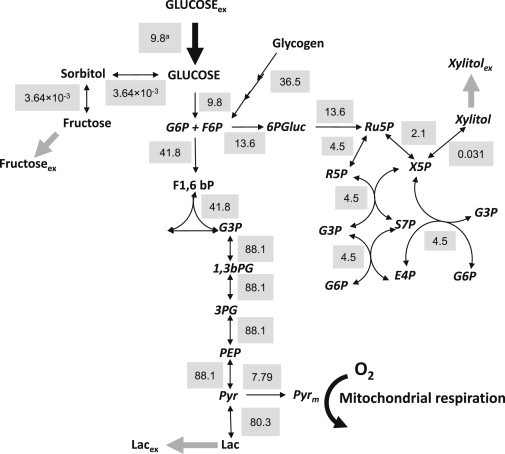
The glucose catabolic fluxome in the mouse heart. Depicted are the fluxes (shaded background) next to their respective steps in the metabolic network of glucose utilization (Fig. 1) and expressed in μM s−1 (equivalent to nmol s−1 mL−1 intracellular water). The fluxes correspond to those leading to the metabolite concentrations that reproduced the ones obtained experimentally as shown in Table 1 (see also Materials and Methods). To see this figure in color, go online.
Together, these data reveal that glucose is actively utilized from both the perfusion solution and internal glycogen stores. Although glucose from glycogen degradation is mainly broken down via glycolysis, other branching pathways such as PP and polyols were active, especially the former.
Control and regulation of the glucose fluxome
Metabolic control analysis was applied to identify and quantify the control of the flux and metabolite concentrations from the glucose fluxome determined (Fig. 4).
The main rate-controlling steps of the glycolytic flux were (Fig. 5 A) as follows: PFK ≈ glycogenolysis (flux control coefficient, C ≈ 0.65) > ATP demand with negative control (C ∼ −0.4) > Glc uptake (C ∼ 0.12) > G6PDH with negative control (C = −0.05) > HK (C = 0.03).
Figure 5.
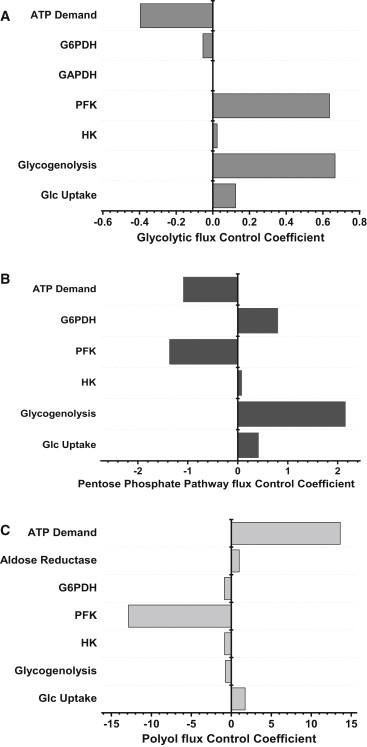
Control of the glucose fluxome in the heart. The flux control coefficients of the most rate-controlling steps of glucose catabolism are displayed. The bar length indicates the x-axis magnitude of the flux control coefficient (CC) of glycolysis (A), PP (B), and polyol (C) pathways. The corresponding enzymatic steps are indicated at the left of each bar plot. The flux CC can be either positive or negative, and in all cases it was verified that the sum of the CC = 1.0, in compliance with the summation theorem.
A positive control, e.g., C = 0.65 for PFK, means that this enzyme controls 65% of the flux through glycolysis, and that an increase in the activity of PFK will increase the glycolytic flux. On the contrary, a negative control, e.g., C = −0.05 for G6PDH, implies that this enzyme controls 5% of the flux, and an increase in its activity will actually decrease the flux through glycolysis.
The control profile of the PP pathway exhibited the same major rate-controlling steps as glycolysis but with much higher flux control coefficients (Fig. 5 B): Glycogenolysis C = 2.2 > ATP demand C = −1.1 (negative) > G6PDH C = 0.8 > glucose uptake C = 0.4 > HK C ∼ 0.1.
The negative control of PFK on PP flux means that any increase in the flux through glycolysis will have the opposite effect on the PP flux.
The control profile of the polyol pathway leading to sorbitol and fructose (Fig. 5 C) displayed a high positive control by the following steps: ATP demand (C ∼ 14) > glucose uptake (C ∼ 2) > aldose reductase (C = 1).
A high negative control was exerted by PFK (C = −13) > glycogenolysis, HK, G6PDH (C = −1).
Overall, the control of the glucose catabolic fluxome is highly distributed with glycogenolysis, PFK, and ATP demand as the major rate-controlling steps. The structure of control reveals that an overall increase in the glycolytic flux will decrease the flux redirection through PP and polyols, as revealed by the negative flux control exerted via PFK on both pathways.
Discussion
The main contribution of this work is to describe a believed-novel procedure to translate metabolite profiles (metabolome) into the fluxome, from which the metabolome originated. Tested with metabolite profiles obtained from Langendorff-perfused mouse hearts, we were able to quantitatively reproduce the metabolite concentration profile (Table 1) using a set of optimized Vmax values corresponding to a particular solution from the solution space.
The resulting parameterized computational model was utilized to calculate the structure of control of the glucose fluxome comprising all catabolic routes involved in glucose degradation. The significant control exerted by the ATP demand is expected from an energy demand-led organ like the heart. Preceding metabolic control analysis work in the heart showed that glucose transport and hexokinase were the most rate-controlling steps of the glycolytic flux (41). The main differences between our approach and Kashiwaya et al. (41) are that, in their work, the allosteric property of PFK was not taken into account, nor was the influence of ATP and ADP on various enzymatic steps. Including these regulatory interactions turned out to be important because PFK exerts a high control on glycolysis and exhibits high elasticity with respect to ATP and ADP levels.
Thus, the response coefficients of PFK, with respect to adenine nucleotides, are high and cannot be ignored. That the ATP demand exerts a negative control on the glycolytic flux, appears counterintuitive because one would expect that an increase in energy demand should be followed by an increase, not a decrease, in glycolysis. However, the negative control of glycolysis by ATP demand can be explained according to control by diffuse loops (4,36). In fact, because PFK is a main rate-controlling step of the glycolytic flux, and that this enzyme activity depends on ATP thereby responding positively to its increase, an increase in ATP demand will decrease ATP availability for PFK activity, thus yielding lower flux through glycolysis.
Alternative strategies for the quantitative analysis of metabolomics data have been proposed by Cakmak et al. (42) and Yizhak et al. (43). Our approach differs from theirs in the following ways: 1) we use mechanistic rate expressions that account for experimentally demonstrated kinetics and regulatory interactions; 2) our analytical platform combines existing analytical methods in an integrated manner for qualitative and quantitative analyses both under steady and time-dependent conditions; and 3) we are able to translate large metabolite datasets into a functional fluxome that by accounting for regulatory interactions enables the computation of the structure of control and regulation of the biochemical network from which the metabolite profiles originated.
Comparison with experimental data
Quantitative validation of our calculations comes from the published results of Buchanan et al. (44), who measured the rate of glycolysis and glucose oxidation in working heart preparations from wild-type and diabetic (db/db) mice (Table 2). The equivalent flux measurements in this work (unloaded Langendorff-perfused heart) corresponded to values extrapolated to the y axis (no workload) in Buchanan et al. (44). These authors found ∼1:10 between the glucose oxidized (∼600–700 nmol min−1 gram dry weight (gdw)−1) versus glucose catabolized through glycolysis (∼6–7 μmol min−1 gdw−1). This result agrees very well with the ratio obtained in our fluxome calculation (Fig. 4).
Table 2.
Flux values from the literature compared with fluxome calculations
| Tissue source | Flux reported μM s−1 | Flux estimation μM s−1 | Reference | |
|---|---|---|---|---|
| Glycolysis | mouse working heart | 37.5 | 41.8 | (45) |
| Glc uptake | rat working heart | 76.3 | 9.8 | (41) |
| Glyn utilization | rat working heart | 7.67 | 36.5 | (41) |
| Glycolysis | mouse working heart | 54.17 | 41.8 | (44) |
| Glc oxidation | mouse working heart | 5.42 | 7.79 | (44) |
| G6PDH | mouse liver | 45.2 | 13.6 | (46) |
| 6PGDH | mouse liver | 107.2 | 13.6 | (46) |
| Tkl | mouse liver | 49.6 | 4.5 | (46) |
| TAL | mouse liver | 45.6 | 4.5 | (46,47) |
| XyDH | mouse liver | 43.8 | 0.0031 | (47) |
| SoDH | mouse liver | 200.9 | 0.0036 | (47) |
| G6PDH | mouse liver | 7.55 | 13.6 | (47) |
| 6PGDH | mouse liver | 6.04 | 13.6 | (47) |
Abbreviations are as in Fig. 1. Glyn utilization, glycogen utilization; XyDH, xylitol dehydrogenase.
Considering ∼2 mL of intracellular water gdw−1 (39), our calculated pyruvate flux [PEP→Pyr] value of 88.1 μM s−1 corresponds to 5.3 μmol glucose min−1 gdw−1, similar to the 6–7 μmol min−1 gdw−1 measured directly in Buchanan et al. (44). Because different authors report fluxes in various units, we have translated all values to μM s−1 for direct comparison with our results (Table 2). Kashiwaya et al. (41) reported values in the same order of magnitude as those estimated herein, i.e., 76.3 μM s−1 (Table 2, rows 2 and 3). The quantitative discrepancy may be attributed to the difference in species (mouse versus rat) and physiological conditions (Langendorff versus working heart). However, the measurement of glycolytic flux in mouse working heart (also strain C57BL/6) by Dunn et al. (45) rendered a value of 37.5 μM s−1, which closely agrees with our flux estimation. Likewise, for mouse liver and the same enzymes (G6PDH, P6GDH), different authors (46,47) reported dissimilar fluxes, but one of them was close to our estimated fluxes (Table 2).
Because the volume of possible solutions depends on the choice of objective function to optimize Vmax, further validation of our procedure will need an independent experimental approach to quantify metabolic fluxes. Table S24 shows Vmax values for a number of reactions to illustrate how the solution space can change as a function of the optimization criterion. In each case, the values shown in Table S24 correspond to the vertices of the solutions volume defined by the sets of maximal Vmax values compatible with the objective function chosen. Although the maximal Vmax of some enzymes varies very little with the change in objective function, e.g., xylitol dehydrogenase, others are very sensitive, e.g., glucose transport. Another approach, by Schuetz et al. (48), performed a thorough evaluation of different objective functions (linear and nonlinear ones) with the aim of unraveling the optimization criterion that rules the metabolic network of, e.g., Escherichia coli growing in batch or chemostat culture (48), according to the goodness of the flux prediction.
Limitations of this study
Sources of error associated with the flux estimation using the procedure described herein include variability in the experimental determination of metabolite concentrations or reference fluxes (e.g., respiration, lactate secretion). In the case of metabolites, the results from the matrix composed by the derivatives of rate expressions with respect to Vmax, denoted DrV, will be affected (see Eq. S29). Although controls of recovery with four internal standards were run during metabolite profiling, quantitation of metabolite concentrations from metabolomics data may be subjected to bias due to metabolites extraction and recovery errors. Regarding reference fluxes, vector b in Eq. 1 will be influenced. A description of the maximal error associated with the Vmax estimation based on Savinell and Palsson (29) is included in Section S3 in the Supporting Material.
When applied to cell populations, metabolomics assumes an average cell that ignores cellular heterogeneity. In this sense the metabolite profile represents an average concentration throughout the heart, and only exchanges between the organ and the perfusion buffer are considered. Thus, cellular heterogeneity (e.g., cardiomyocytes, fibroblasts) and compartmentalization are not taken into account.
At this stage, our procedure generates a volume of possible solutions because the number of unknowns (Vmax) (m) is larger than the individual metabolite differential equations (n). Consequently, a unique solution cannot be determined. A possible way to restrict the solution space would be through the use of uniform sampling Monte Carlo methods such as those described in Price et al. (49).
Conclusions
We describe a believed-novel integrated procedure for translating metabolomics into fluxomics as applied to a highly dynamic organ such as the heart. This major step forward has relevant implications for complex metabolic disorders. Insights gained from applying control analysis to the fluxome indicate that glucose oxidation redirection toward pathways that may restore (e.g., pentose phosphate) or impair (e.g., polyol) cardiac redox balance, appear to be crucial for improving type-2 diabetic heart function under stressful conditions (9). Our methodological approach may also help in designing therapeutic strategies targeted to prevent cardiac dysfunction and, eventually, heart failure in diabetic patients.
Acknowledgments
In abstract and partial forms this work has been presented at the Biophysical Society meeting in Philadelphia, PA, and at the Keystone Meeting in Colorado, CO, both in February 2013.
L.N.B. is an employee of Metabolon, Inc. and, as such, has affiliations with or financial involvement with Metabolon, Inc. L.N.B. has no other relevant affiliations or financial involvement with any organization or entity with a financial interest in or financial conflict with the subject matter or materials discussed in the manuscript apart from those disclosed.
This work was supported by National Institutes of Health grants R01-HL091923-01 (to M.A.A. and N.P.) and R21HL106054 (to S.C.).
Footnotes
Viviane Caceres’ present address is Departamento de Farmacologia, Universidade Federal de São Paulo (UNIFESP/EPM), São Paulo, Brazil.
Supporting Material
Supporting Citations
References (50–53) appear in the Supporting Material.
References
- 1.Hood L., Tian Q. Systems approaches to biology and disease enable translational systems medicine. Genomics Proteomics Bioinformatics. 2012;10:181–185. doi: 10.1016/j.gpb.2012.08.004. [DOI] [PMC free article] [PubMed] [Google Scholar]
- 2.Aon M.A. Complex systems biology of networks: the riddle and the challenge. In: Aon M.A., Saks V., Schlattner U., editors. Systems Biology of Metabolic and Signaling Networks. Energy, Mass and Information Transfer. Springer; Berlin: 2013. pp. 19–35. [Google Scholar]
- 3.Cortassa S., Aon M.A. Dynamics of mitochondrial redox and energy networks: insights from an experimental-computational synergy. In: Aon M.A., Saks V., Schlattner U., editors. Systems Biology of Metabolic and Signaling Networks. Energy, Mass and Information Transfer. Springer; Berlin: 2013. pp. 115–144. [Google Scholar]
- 4.Cortassa S., Aon M.A., Lloyd D. World Scientific Publishers; Singapore: 2012. An Introduction to Metabolic and Cellular Engineering. [Google Scholar]
- 5.Lanpher B., Brunetti-Pierri N., Lee B. Inborn errors of metabolism: the flux from Mendelian to complex diseases. Nat. Rev. Genet. 2006;7:449–460. doi: 10.1038/nrg1880. [DOI] [PubMed] [Google Scholar]
- 6.Cascante M., Marin S. Metabolomics and fluxomics approaches. Essays Biochem. 2008;45:67–81. doi: 10.1042/BSE0450067. [DOI] [PubMed] [Google Scholar]
- 7.Raamsdonk L.M., Teusink B., Oliver S.G. A functional genomics strategy that uses metabolome data to reveal the phenotype of silent mutations. Nat. Biotechnol. 2001;19:45–50. doi: 10.1038/83496. [DOI] [PubMed] [Google Scholar]
- 8.Griffin J.L. The Cinderella story of metabolic profiling: does metabolomics get to go to the functional genomics ball? Philos. Trans. R. Soc. Lond. B Biol. Sci. 2006;361:147–161. doi: 10.1098/rstb.2005.1734. [DOI] [PMC free article] [PubMed] [Google Scholar]
- 9.Tocchetti C.G., Caceres V., Aon M.A. GSH or palmitate preserves mitochondrial energetic/redox balance, preventing mechanical dysfunction in metabolically challenged myocytes/hearts from type 2 diabetic mice. Diabetes. 2012;61:3094–3105. doi: 10.2337/db12-0072. [DOI] [PMC free article] [PubMed] [Google Scholar]
- 10.Winter G., Krömer J.O. Fluxomics—connecting ’omics analysis and phenotypes. Environ. Microbiol. 2013;15:1901–1916. doi: 10.1111/1462-2920.12064. [DOI] [PubMed] [Google Scholar]
- 11.Boardman N., Hafstad A.D., Aasum E. Increased O2 cost of basal metabolism and excitation-contraction coupling in hearts from type 2 diabetic mice. Am. J. Physiol. Heart Circ. Physiol. 2009;296:H1373–H1379. doi: 10.1152/ajpheart.01264.2008. [DOI] [PubMed] [Google Scholar]
- 12.Lambeth M.J., Kushmerick M.J. A computational model for glycogenolysis in skeletal muscle. Ann. Biomed. Eng. 2002;30:808–827. doi: 10.1114/1.1492813. [DOI] [PubMed] [Google Scholar]
- 13.Lueck J.D., Fromm H.J. Kinetics, mechanism, and regulation of rat skeletal muscle hexokinase. J. Biol. Chem. 1974;249:1341–1347. [PubMed] [Google Scholar]
- 14.Henis Y.I., Levitzki A. Mechanism of negative cooperativity in glyceraldehyde-3-phosphate dehydrogenase deduced from ligand competition experiments. Proc. Natl. Acad. Sci. USA. 1980;77:5055–5059. doi: 10.1073/pnas.77.9.5055. [DOI] [PMC free article] [PubMed] [Google Scholar]
- 15.Nishino T., Yachie-Kinoshita A., Tomita M. In silico modeling and metabolome analysis of long-stored erythrocytes to improve blood storage methods. J. Biotechnol. 2009;144:212–223. doi: 10.1016/j.jbiotec.2009.08.010. [DOI] [PubMed] [Google Scholar]
- 16.McIntyre L.M., Thorburn D.R., Kuchel P.W. Comparison of computer simulations of the F-type and L-type non-oxidative hexose monophosphate shunts with 31P-NMR experimental data from human erythrocytes. Eur. J. Biochem. 1989;180:399–420. doi: 10.1111/j.1432-1033.1989.tb14662.x. [DOI] [PubMed] [Google Scholar]
- 17.Buckwitz D., Jacobasch G., Gerth C. Glucose-6-phosphate dehydrogenase from Plasmodium berghei: kinetic and electrophoretic characterization. Exp. Parasitol. 1990;70:264–275. doi: 10.1016/0014-4894(90)90108-o. [DOI] [PubMed] [Google Scholar]
- 18.Vikramadithyan R.K., Hu Y., Goldberg I.J. Human aldose reductase expression accelerates diabetic atherosclerosis in transgenic mice. J. Clin. Invest. 2005;115:2434–2443. doi: 10.1172/JCI24819. [DOI] [PMC free article] [PubMed] [Google Scholar]
- 19.Brownlee M. Biochemistry and molecular cell biology of diabetic complications. Nature. 2001;414:813–820. doi: 10.1038/414813a. [DOI] [PubMed] [Google Scholar]
- 20.Kawamura M., Kopin I.J., Eisenhofer G. Effects of aldehyde/aldose reductase inhibition on neuronal metabolism of norepinephrine. J. Auton. Nerv. Syst. 1997;66:145–148. doi: 10.1016/s0165-1838(97)00086-6. [DOI] [PubMed] [Google Scholar]
- 21.Grimshaw C.E., Shahbaz M., Mathur E.J. Kinetic and structural effects of activation of bovine kidney aldose reductase. Biochemistry. 1989;28:5343–5353. doi: 10.1021/bi00439a006. [DOI] [PubMed] [Google Scholar]
- 22.Kubiseski T.J., Hyndman D.J., Flynn T.G. Studies on pig muscle aldose reductase. Kinetic mechanism and evidence for a slow conformational change upon coenzyme binding. J. Biol. Chem. 1992;267:6510–6517. [PubMed] [Google Scholar]
- 23.Halder A.B., Crabbe M.J. Bovine lens aldehyde reductase (aldose reductase). Purification, kinetics and mechanism. Biochem. J. 1984;219:33–39. doi: 10.1042/bj2190033. [DOI] [PMC free article] [PubMed] [Google Scholar]
- 24.Karacaoğlan V., Ozer I. Steady-state kinetic properties of sorbitol dehydrogenase from chicken liver. Comp. Biochem. Physiol. B Biochem. Mol. Biol. 2005;140:309–312. doi: 10.1016/j.cbpc.2004.10.017. [DOI] [PubMed] [Google Scholar]
- 25.O’Brien M.M., Schofield P.J., Edwards M.R. Polyol-pathway enzymes of human brain. Partial purification and properties of sorbitol dehydrogenase. Biochem. J. 1983;211:81–90. doi: 10.1042/bj2110081. [DOI] [PMC free article] [PubMed] [Google Scholar]
- 26.Cortassa S., Aon J.C., Aon M.A. Fluxes of carbon, phosphorylation, and redox intermediates during growth of Saccharomyces cerevisiae on different carbon sources. Biotechnol. Bioeng. 1995;47:193–208. doi: 10.1002/bit.260470211. [DOI] [PubMed] [Google Scholar]
- 27.Edwards J.S., Ibarra R.U., Palsson B.O. In silico predictions of Escherichia coli metabolic capabilities are consistent with experimental data. Nat. Biotechnol. 2001;19:125–130. doi: 10.1038/84379. [DOI] [PubMed] [Google Scholar]
- 28.Fell D.A., Small J.R. Fat synthesis in adipose tissue. An examination of stoichiometric constraints. Biochem. J. 1986;238:781–786. doi: 10.1042/bj2380781. [DOI] [PMC free article] [PubMed] [Google Scholar]
- 29.Savinell J.M., Palsson B.O. Optimal selection of metabolic fluxes for in vivo measurement. I. Development of mathematical methods. J. Theor. Biol. 1992;155:201–214. doi: 10.1016/s0022-5193(05)80595-8. [DOI] [PubMed] [Google Scholar]
- 30.Aon M.A., Cortassa S. Mitochondrial network energetics in the heart. Wiley Interdiscip. Rev. Syst. Biol. Med. 2012;4:599–613. doi: 10.1002/wsbm.1188. [DOI] [PMC free article] [PubMed] [Google Scholar]
- 31.Aon M.A., Cortassa S., O’Rourke B. Synchronized whole cell oscillations in mitochondrial metabolism triggered by a local release of reactive oxygen species in cardiac myocytes. J. Biol. Chem. 2003;278:44735–44744. doi: 10.1074/jbc.M302673200. [DOI] [PubMed] [Google Scholar]
- 32.Aon M.A., Cortassa S., O’Rourke B. Percolation and criticality in a mitochondrial network. Proc. Natl. Acad. Sci. USA. 2004;101:4447–4452. doi: 10.1073/pnas.0307156101. [DOI] [PMC free article] [PubMed] [Google Scholar]
- 33.Dhooge A., Govaerts W., Sautois B. New features of the software MATCONT for bifurcation analysis of dynamical systems. Math. Comp. Model Dyn. 2008;14:147–175. [Google Scholar]
- 34.Kembro J.M., Aon M.A., Cortassa S. Integrating mitochondrial energetics, redox and ROS metabolic networks: a two-compartment model. Biophys. J. 2013;104:332–343. doi: 10.1016/j.bpj.2012.11.3808. [DOI] [PMC free article] [PubMed] [Google Scholar]
- 35.Savinell J.M., Palsson B.O. Optimal selection of metabolic fluxes for in vivo measurement. II. Application to Escherichia coli and hybridoma cell metabolism. J. Theor. Biol. 1992;155:215–242. doi: 10.1016/s0022-5193(05)80596-x. [DOI] [PubMed] [Google Scholar]
- 36.Cortassa S., O’Rourke B., Aon M.A. Control and regulation of mitochondrial energetics in an integrated model of cardiomyocyte function. Biophys. J. 2009;96:2466–2478. doi: 10.1016/j.bpj.2008.12.3893. [DOI] [PMC free article] [PubMed] [Google Scholar]
- 37.Fell D.A. Portland Press; London, UK: 1996. Understanding the Control of Metabolism. [Google Scholar]
- 38.Reder C. Metabolic control theory: a structural approach. J. Theor. Biol. 1988;135:175–201. doi: 10.1016/s0022-5193(88)80073-0. [DOI] [PubMed] [Google Scholar]
- 39.Randle P.J., Tubbs P.K. Carbohydrate and fatty acid metabolism. In: Berne N.S.R.M., Geiger R., editors. Handbook of Physiology. American Physiology Society; Bethesda, MD: 1979. pp. 805–844. [Google Scholar]
- 40.How O.J., Aasum E., Larsen T.S. Increased myocardial oxygen consumption reduces cardiac efficiency in diabetic mice. Diabetes. 2006;55:466–473. doi: 10.2337/diabetes.55.02.06.db05-1164. [DOI] [PubMed] [Google Scholar]
- 41.Kashiwaya Y., Sato K., Passonneau J.V. Control of glucose utilization in working perfused rat heart. J. Biol. Chem. 1994;269:25502–25514. [PubMed] [Google Scholar]
- 42.Cakmak A., Qi X., Ozsoyoglu G. A new metabolomics analysis technique: steady-state metabolic network dynamics analysis. J. Bioinform. Comput. Biol. 2012;10:1240003. doi: 10.1142/S0219720012400033. [DOI] [PMC free article] [PubMed] [Google Scholar]
- 43.Yizhak K., Benyamini T., Shlomi T. Integrating quantitative proteomics and metabolomics with a genome-scale metabolic network model. Bioinformatics. 2010;26:i255–i260. doi: 10.1093/bioinformatics/btq183. [DOI] [PMC free article] [PubMed] [Google Scholar]
- 44.Buchanan J., Mazumder P.K., Abel E.D. Reduced cardiac efficiency and altered substrate metabolism precedes the onset of hyperglycemia and contractile dysfunction in two mouse models of insulin resistance and obesity. Endocrinology. 2005;146:5341–5349. doi: 10.1210/en.2005-0938. [DOI] [PubMed] [Google Scholar]
- 45.Dunn M.E., Manfredi T.G., Rodgers R.L. Mechanical function, glycolysis, and ultrastructure of perfused working mouse hearts following thoracic aortic constriction. Cardiovasc. Pathol. 2011;20:343–351. doi: 10.1016/j.carpath.2010.12.003. [DOI] [PubMed] [Google Scholar]
- 46.Bublitz C., Steavenson S. The pentose phosphate pathway in the endoplasmic reticulum. J. Biol. Chem. 1988;263:12849–12853. [PubMed] [Google Scholar]
- 47.Tulsiani D.R., Touster O. Studies on dehydrogenases of the glucuronate-xylulose cycle in the livers of diabetic mice and rats. Diabetes. 1979;28:793–798. doi: 10.2337/diab.28.9.793. [DOI] [PubMed] [Google Scholar]
- 48.Schuetz R., Kuepfer L., Sauer U. Systematic evaluation of objective functions for predicting intracellular fluxes in Escherichia coli. Mol. Syst. Biol. 2007;3:119. doi: 10.1038/msb4100162. [DOI] [PMC free article] [PubMed] [Google Scholar]
- 49.Price N.D., Schellenberger J., Palsson B.O. Uniform sampling of steady-state flux spaces: means to design experiments and to interpret enzymopathies. Biophys. J. 2004;87:2172–2186. doi: 10.1529/biophysj.104.043000. [DOI] [PMC free article] [PubMed] [Google Scholar]
- 50.Evans A.M., DeHaven C.D., Milgram E. Integrated, nontargeted ultrahigh performance liquid chromatography/electrospray ionization tandem mass spectrometry platform for the identification and relative quantification of the small-molecule complement of biological systems. Anal. Chem. 2009;81:6656–6667. doi: 10.1021/ac901536h. [DOI] [PubMed] [Google Scholar]
- 51.Ohta T., Masutomi N., Guo L. Untargeted metabolomic profiling as an evaluative tool of fenofibrate-induced toxicology in Fischer 344 male rats. Toxicol. Pathol. 2009;37:521–535. doi: 10.1177/0192623309336152. [DOI] [PubMed] [Google Scholar]
- 52.DeHaven C.D., Evans A.M., Lawton K.A. Organization of GC/MS and LC/MS metabolomics data into chemical libraries. J. Cheminform. 2010;2:9. doi: 10.1186/1758-2946-2-9. [DOI] [PMC free article] [PubMed] [Google Scholar]
- 53.Storey J.D., Tibshirani R. Statistical significance for genomewide studies. Proc. Natl. Acad. Sci. USA. 2003;100:9440–9445. doi: 10.1073/pnas.1530509100. [DOI] [PMC free article] [PubMed] [Google Scholar]
Associated Data
This section collects any data citations, data availability statements, or supplementary materials included in this article.