Abstract
The primary objective of this study was to evaluate the safety and the effect of D-tagatose on the glycemic control of subjects with type 2 diabetes as determined by HbA1c levels at the end of 6 months of therapy using the subject’s own baseline HbA1c level as a comparator. The determination of the minimal dose required to cause a statistically significant reduction in HbA1c was of particular interest. Eight weeks after screening, the qualifying subjects were randomized to receive one of three doses of D-tagatose: 2.5 g TID, 5.0 g TID or 7.5 g TID. Blood levels of HbA1c, fasting blood glucose concentrations, plasma lipids, changes in body weight, changes in body mass index, and change in insulin levels were checked at each study visit and at the end of the study. Treatment success, as measured by the reduction of HbA1c, was greatest for the 7.5 g D-tagatose dose group, although the difference between the treatments was not statistically significant. For fasting glucose, only the 7.5 g dosage group exhibited reductions from baseline at the 3- and 6-month time points. Mean body weights reduced in a dose-response fashion, with the 5.0 g and the 7.5 g D-tagatose doses providing the greatest reductions. D-tagatose at dosages of 2.5 g, 5.0 g, and 7.5 g TID for six months were well tolerated by this subject population. D-tagatose at 5.0 g TID was the minimal dose required to reduce HbA1c. D-tagatose at 7.5 g TID provided the greatest effect in most measured efficacy parameters.
Keywords: HbA1c, Triglycerides, Body weight, Insulin, LDL
INTRODUCTION
Peripheral insulin resistance and progressive failure of pancreatic β-cell function leading to inadequate insulin secretion are the two principal abnormalities that characterize the pathogenesis of type 2 diabetes [1]. Early intervention at the onset of type 2 diabetes generally consists of maintaining a proper diet and weight, along with regular exercise. If control of blood glucose deteriorates further, then pharmacological intervention with one or more oral anti-diabetic agents is required. Unfortunately for many, type 2 diabetes will continue to progress and exogenous insulin treatment as primary therapy with oral anti-diabetic agents as adjunctive therapy are required in order to achieve glycemic control. Treatment with insulin is usually a point of no return for these patients and a major treatment goal is to prevent progression to this point. Despite all of these interventions including insulin and the introduction of a number of novel agents for the treatment of type 2 diabetes in recent years, glucose control for many remains unsatisfactory.
Recently, a review that included 140 controlled trials and 26 observational studies comparing diabetes medications, both as monotherapy and in two-drug combinations, concluded that there was not enough evidence to clearly support the use of one drug or drug combination over another for stemming the complications of diabetes, including macrovascular and microvascular complications and mortality [2]. Metformin, a drug introduced in the United States in 1994 and as early as 1958 in other countries, is still the most common first drug of choice for the treatment of type 2 diabetes. Compared to the newer drugs, metformin is the drug that has the highest benefit-to-risk ratio for intermediate outcomes, such as HbA1c reduction, less weight gain and less risk of hypoglycemia. However, no currently available therapy has been shown to slow the decline in β-cell function in established type 2 diabetes. Even with aggressive intervention, it is estimated that 60% of diabetics don’t achieve target blood sugar levels with their current treatment [3]. Moreover, particular drugs available for treatment of diabetes may result in unwanted weight gain (long and rapid acting insulin, sulfonylureas, thiazolidinediones, repaglinide, nateglinide), hypoglycemia (insulin, sulfonylureas), gastrointestinal distress (metformin, α-glucosidase inhibitor, amylin mimetics, bile acid sequestrant, bromocriptine), or more serious adverse events such as pancreatitis (short and long-acting glucagon-like peptide-1(GLP-1) agonists and dipeptidyl peptidase-4 (DDP-4) inhibitors) [4,5]. These findings illustrate the limitations of drug therapies currently available for the progression of diabetes.
The observation that many diabetics are not able to consistently control their blood sugar levels within recommended limits using the best available treatments, uncovers the serious need for a drug that can slow and/or halt the progression of diabetes. Preferably, such a drug should exhibit a unique mode of action to enable additive or synergistic use with current therapies; produce no weight gain, hypoglycemia, or other limiting or unmanageable side effects; preserve or enhance β-cell function; and reduce cardiovascular risk factors that lead to morbidity and mortality.
D-tagatose is an isomer of fructose and is ~90% as sweet as sucrose, or sugar. D-tagatose was designated in 2001 as a Generally Recognized as Safe (GRAS) product by the United States Food and Drug Administration and is used as a nutritive or low-calorie sweetener [6,7]. Currently, D-tagatose may be used as a sweetener in diet beverages, light ice creams or yogurts, and regular or dietetic hard candies [Rulis Agency response letter GRAS notice]. Preliminary animal and pre-clinical studies of D-tagatose have demonstrated its ability to lower blood glucose and lipoprotein levels. When consumed, D-tagatose functions as a “sugar blocker” by inhibiting lipid formation from carbohydrates without stimulation of pancreatic beta cells for insulin production or secretion [7]. Regarding lipoprotein levels, D-tagatose has been shown to reduce total cholesterol and VLDL and LDL-cholesterol when compared to sucrose [8], and increase HDL-cholesterol levels [9]. A number of clinical trials demonstrating the ability of D-tagatose to blunt postprandial rises in blood glucose and reduce HbA1c have been conducted on healthy subjects and diabetic patients [10–16]. Single-dose and repeated-dose studies in healthy and diabetic human subjects have shown that the predominant adverse effects associated with excessive consumption of D-tagatose are gastrointestinal disturbances attributed to osmotic effects from incompletely absorbed D-tagatose [10–16]. Such effects are also commonly associated with excessive consumption of other poorly digestible carbohydrates including polyols. Therefore, D-tagatose shows promise in multiple clinical applications, including the treatment of diabetes. In short, D-tagatose provides glycemic and lipoprotein control through a mechanism of action unlike any agent that is currently available on the market in the United States.
The primary objective of this study was to evaluate the effect of three low-doses of D-tagatose on the glycemic control of subjects with type 2 diabetes. The purpose was to determine the minimum dose able to reduce HbA1c. The secondary objectives were to evaluate the effect of these three doses of D-tagatose compared to the subject’s own baseline levels for
HbA1c at each study visit
fasting plasma glucose
fasting lipid profiles
insulin concentration
changes in body weight
the number of subjects requiring additional anti-diabetic medications and/or withdrawal from the study due to high glycemic measurements
In addition, the safety of D-tagatose in regards to hypoglycemic episodes, gastrointestinal side effects, other adverse events, clinical laboratory abnormalities, and physical examinations was evaluated.
SUBJECTS AND METHODS
Ethics
The protocol was reviewed and approved by an Institutional Review Board (IRB) before the study was initiated. This trial was conducted in accordance with regulations governing clinical trials including the US Code of Federal Regulations (CFR), Title 21, Part 50; regulations governing IRBs, Title 21, Part 56; and the Declaration of Helsinki concerning medical research in humans. Additional governing regulations included US CFR Title 21, Part 54 and US CFR Title 21, Part 312. This study was also conducted according to International Conference on Harmonization (ICH) Good Clinical Practices (GCP).
Subject information and consent
Prior to entry into the study, the nature and risks of the study were reviewed with each subject. Each subject or each subject’s legal representative was given the opportunity to read the IRB-approved consent form and to ask questions.
Criteria for evaluation
The populations analyzed for efficacy endpoints were the intent-to-treat (ITT) population and the efficacy evaluable (EE) population. The population used to analyze safety parameters was identical to the ITT population. Analysis of demographic and baseline for the ITT, EE and Safety populations indicated no gross dissimilarities between the three D-tagatose dose groups. The majority of subjects in each of the treatment groups and populations were male, Asian, non-smoking, non-drinking, around 50 years of age, weighing approximately 150 lbs, with diet and exercise for control of their diabetes. Usage of allowable medications during the trial was also similar across the three treatment groups.
Primary Efficacy Endpoint
The primary endpoint for this Phase 2 dose-ranging study was a decrease of ≥ 0.5% in HbA1c level after 6 months of the study treatment.
Secondary Efficacy Endpoints
Secondary endpoints for this study included assessment of the effects of D-tagatose on other glycemic control measurements. These measurements included the proportions of subjects at each visit who achieved a decrease in HbA1c of ≥ 0.5%; proportions of subjects at each visit who achieved a decrease in HbA1c level of ≥ 1%; change from baseline to each study visit in fasting blood glucose concentrations, and plasma lipids (triglycerides, low density lipoprotein, total cholesterol, and high density lipoprotein); changes in body weight; changes in body mass index; and change in insulin levels.
Safety
Descriptive statistics and by-subject data listings were prepared for all safety parameters. No inferential statistics were performed for safety parameters. Safety was assessed through the entire duration of the study, and in the event of an adverse event (AE) or serious adverse event (SAE), safety was to be monitored until the AE/SAE resolved, or until the AE/SAE was deemed chronic or stable by the investigator.
Study design and plan
This study was designed as a prospective, randomized, 6-month, parallel dose-ranging trial in subjects with mild type 2 diabetes who, at the time of randomization, were not taking any oral anti-diabetic or anti-hyperglycemic medication or parenteral anti-diabetic medication and were controlling their diabetes with diet and exercise alone. This Phase 2 parallel dose-ranging trial was designed to evaluate the dose-response effect of minimal doses of D-tagatose (2.5, 5.0, or 7.5 g,TID) on glycemic control in subjects with type 2 diabetes, who had undergone an 8-week run-in period of standardized diet and exercise. This 8-week stabilization period was considered a sufficient duration of standardized diet and exercise to provide a homogenous population of subjects with type 2 diabetes. No active control group was utilized in the design as the study was intended as a dose-ranging trial. The data from this trial was not intended to provide evidence of equivalence or superiority to any currently marketed medication.
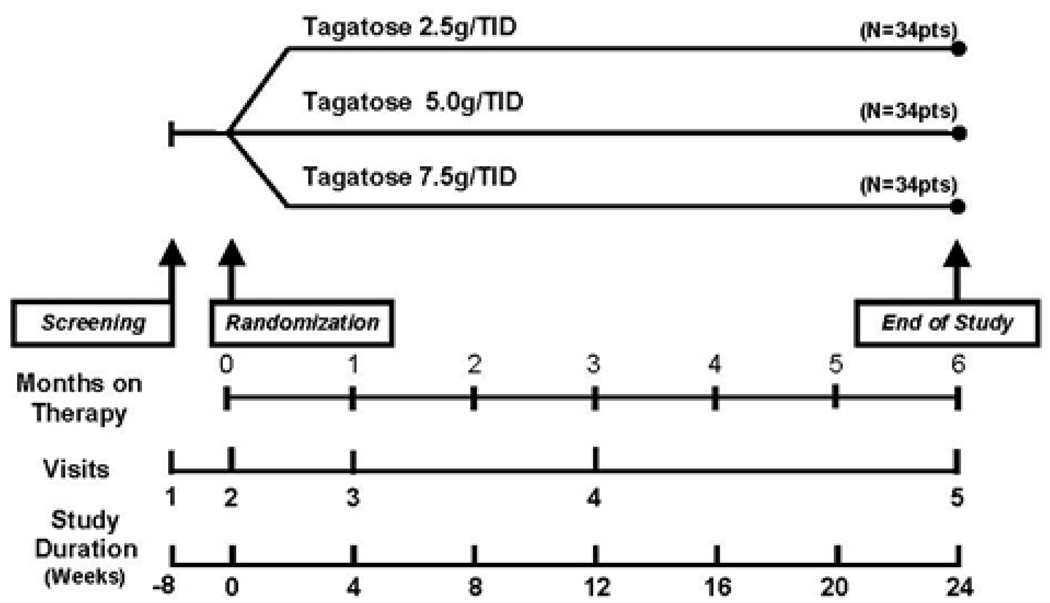
A total of 112 subjects were planned to be randomized into the study (i.e., 34 subjects to each of three treatment groups: 2.5 g, 5.0 g, and 7.5 g D-tagatose given orally, three times daily, immediately prior to meals). Eight weeks after screening and stabilization, qualified subjects were randomized to receive one of three doses of D-tagatose. All doses of D-tagatose were premixed with drinking water into a solution of 4 ounces per dose. The study design is depicted in Figure 1.
Figure 1. Study Schedule.
Subjects underwent an 8-week run-in period of standardized diet and exercise to provide a homogenous population of subjects with type 2 diabetes prior to randomization into three treatment groups. Treatment lasted for 6 months. Total duration of the study for subjects was 24 weeks with five study visits during the trial.
At the initial visit (Visit 1) subjects were screened for eligibility for entering the study. Subjects who were eligible were those diabetic subjects treated solely with diet and exercise and who had mildly elevated HbA1c levels but were otherwise in good health and were not suffering from any serious complications of diabetes or any other significant concurrent disease. Subjects were not to be taking any medications for the treatment of type 2 diabetes. The screening visit consisted of each subject undergoing a review of their relevant medical history and a physical examination, both of these primarily aimed at finding any abnormalities related to complications of diabetes. Additionally, clinical laboratory testing (including comprehensive hematology, clinical chemistry, liver function tests, lipid profile, HbA1c levels and urinalysis) was performed. At the end of the screening visit, potentially eligible study subjects were instructed to follow a weight-maintaining diet and a daily exercise program under the supervision of the investigator. They were given a blank subject diary and a nutritional diary, and were scheduled for the second visit (Visit 2) after 8 weeks of stabilization. No study drug was distributed at the screening visit (Visit 1).
All subjects who were eligible were randomized during Visit 2 which took place within 8 weeks (± 7 days) of Visit 1. This was a single-blind study, in which subjects were blinded to dose group. At Visit 2, prior to randomization, baseline procedures including a complete medical evaluation with a review of medical history changes since Visit 1 and a physical examination were performed on qualifying subjects. In addition, subjects had blood drawn for clinical laboratory testing and urinalysis.
Randomization was stratified by site and baseline HbA1c levels (< 7.5% or ≥ 7.5%) to obtain a balanced distribution of subjects across the three arms of the trial. In addition to a supply of study medication, subjects received a diary and diary completion instructions for recording side effects, intercurrent illnesses/symptoms, and concomitant medications.
For Visits 3 and 4, subjects returned to the clinic for diary assessment, blood tests, and study drug compliance assessment and dispensation of additional study drug. Each of these visits had a ± 7 day window. Subjects had blood drawn for clinical laboratory testing and urinalysis.
During the final visit (Visit 5), the diary and all used and unused medication packets were collected and all assessments conducted at Visits 3 and 4 were repeated. Additionally, a final physical examination was conducted. Subjects were instructed to return to their primary physician for subsequent diabetes care and follow-up. This visit had a ± 7 day window. The efficacy and safety measurements that were evaluated throughout the study are provided in the study schedule (Table 1).
Table 1.
Schedule of Events.
| Visit 1 Screening | Visit 2 Randomization |
Visit 3 Month 1 |
Visit 4 Month 3 |
Visit 5 End of Study |
|
|---|---|---|---|---|---|
| Subject Registration to Study | X | ||||
| Inclusion and Exclusion Criteria | X | ||||
| Informed Consent* | X | ||||
| Physical Examination | X | X | X | ||
| Medical History/Update | X | X | X | X | X |
| Record Concomitant Medications | X | X | X | X | X |
| Record Adverse Events | X | X | X | X | |
| Hematology Panel | X | X | X | X | X |
| Chemistry Panel† | X | X | X | X | X |
| Liver Function Tests‡ | X | X | X | X | X |
| Lipid Profile§ | X | X | X | X | X |
| HbA1c levels | X | X | X | X | X |
| Urinalysis Panel | X | X | X | X | X |
| Dispense Study Drug | X | X | X | ||
| Dispense diaries | X | X | X | X | |
| Compensation | X | X | X | X | X |
| Collect empty study drug vials/packages | X | X | X | ||
| Collect completed subject diaries | X | X | X | X |
Explained to and signed by subject
SMA-18 (or equivalent), creatinine clearance, and insulin levels
Alanine transaminase (ALT), aspartate aminotransferase (AST), total bilirubin, alkaline phosphatase, total protein, and albumin
Total cholesterol, high-density lipoprotein (HDL), low-density lipoprotein (LDL), and triglycerides
In the event a subject was discontinued for any reason, an attempt was to be made to keep the subject on the safety arm of the study. Study treatment for discontinued subjects was to be stopped but the subject was to continue with the protocol assigned study visits but not the interim study drug supply visits. In the event the subject declined participation in the safety arm of the trial, after treatment discontinuation, Visit 5 (the End of Study Visit) was to be scheduled at least 30 days after the last dose.
Clinical Samples
Blood samples used to assay HbA1c, blood glucose, insulin concentrations and lipids (total cholesterol, triglycerides, HDL, and LDL) were taken at each study visit, including the screening visit prior to the run-in period. All samples were collected and processed at the study center and then forwarded to the central laboratory (ICON Central Laboratories, Inc., Farmingdale, NY), by overnight courier, for assay.
Statistical Method
Three analysis populations were evaluated:
Intent-to-Treat (ITT) Population
The main efficacy analysis was conducted using the ITT Population. The ITT population included all subjects who had signed the study Informed Consent Form, received the protocol-specified treatment, and had a baseline and at least one post-baseline HbA1c value.
Efficacy Evaluable (EE) Population
The EE population was used for supportive analyses. The EE population consisted of all randomized subjects who completed treatment periods, received at least 80% of the study medication, and had no major protocol violations or eligibility violations. All protocol violations were to be identified prior to database lock.
Safety Population
The safety population was used for the analysis of safety variables. The safety population consisted of all randomized subjects who received at least one dose of study medication and had at least one post treatment visit of safety assessment.
Determination of Sample Size
The sample size calculation was based on a reduction of at least 0.5% in HbA1c level after 6 months of the study treatment compared to baseline for each dose group, a standard deviation of 1.0 for each treatment group, and an 80% statistical power with a two-sided analysis at a Type I error rate of 0.05. The required number of evaluable subjects was about 102 (34 for each D-tagatose dose group) based on nQuery Advisor, version 6.01. A total of 40 subjects per treatment group (120 subjects for the study) were to be recruited, as it was expected to observe a 15% drop out rate in this study population, and a total of 150 subjects (50 for per treatment group) was screened based on the estimated screen failure rate of 20%.
Descriptive statistics and by-subject data listings were prepared for all efficacy parameters. For continuous data, summaries included number of observations, mean, standard deviation, median, minimum, and maximum values. For categorical data, summaries included frequency counts and percentages. All statistical tests used in efficacy assessments were 2-sided, with no p-value adjustment. Data are presented as the mean ± standard deviation.
The primary efficacy variable was change in HbA1c level from baseline to 6 months. Baseline was defined as the last value obtained prior to the first randomized treatment. Changes from baseline HbA1c level were assessed using the general linear model (ANCOVA) to adjust for baseline differences and the stratification factor. Factors in the model included treatment and stratum of baseline HbA1c (< 7.5% or ≥ 7.5%). The least square means and standard error were derived from the general linear model for each dose group.
For secondary efficacy endpoints, (1) logistic regression was used to investigate the effect of treatment on the endpoint (i.e., decrease of ≥ 0.5% HbA1c reduction at each visit) and, decrease of ≥ 0.5% HbA1c reduction at each visit, and (2) analysis of covariance (with stratification factor as covariate) was used to compare changes from baseline in fasting blood glucose, triglycerides, low density lipoprotein, total cholesterol, high density lipoprotein, body weight, body mass index, and insulin level.
RESULTS
Study Population
The study evaluated the data from 18 clinical study sites (11 sites in the United States and 7 sites in India) and 161 subjects were randomized to one of the three D-tagatose dosages (2.5 g: n = 57, 5.0 g: n = 51, and 7.5 g: n = 53). Of the 161 randomized subjects, 60 (37%) were withdrawn before completing the 6-month treatment period. The most common reasons for withdrawal were subject request (18/161, 11%) and subject lost to follow up (11/161, 7%). The populations analyzed for efficacy endpoints were the ITT population (145 total; 52 in the 2.5 g treatment group, 46 in the 5.0 g treatment group and 47 in the 7.5 g treatment group) and the EE population (87 total, 31 in the 2.5 g treatment group, 29 in the 5.0 g treatment group, and 27 in the 7.5 g treatment group). The population used to analyze safety parameters was identical to the ITT population. There were no indicators of dissimilarity between the treatments in any of the analysis populations in terms of demographic or baseline characteristics, concomitant medication usage, or compliance with treatment, diet, or exercise.
Efficacy Results
Incidence of ≥ 0.5 HbA1c decrease after six months of treatment
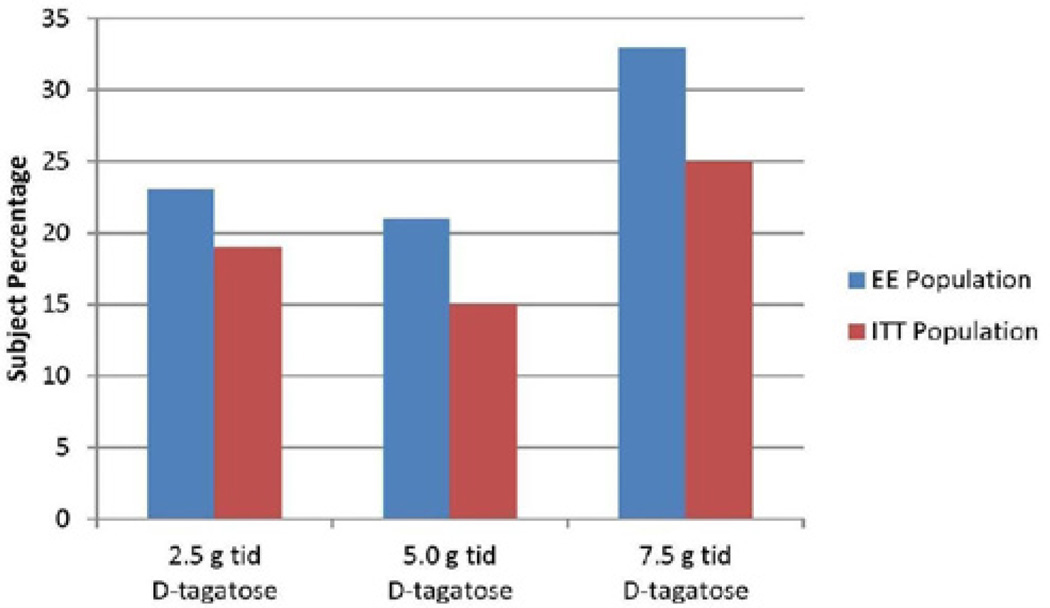
Treatment success, as measured by the incidence of a 0.5 minimum HbA1c decrease from baseline after six months of treatment, was greatest for the 7.5 g TID dose of D-tagatose in both the ITT (25%, 12/47) and the EE (33%, 9/27) populations (see Figure 2). Treatment success, as measured by the primary endpoint (a reduction from baseline of 0.5 in HbA1c after six months of treatment) was greatest for the 7.5 g D-tagatose dose group, although the difference between the treatments was not statistically significant. For the 7.5 g dose group 25% of the population achieved this treatment success parameter compared to 19% in the 2.5 g dose group and 15% in the 5.0 g dose group. The difference across the three dose groups was not statistically significant for either of the analysis populations (p > 0.05, logistic regression).
Figure 2.
Incidence of ≥ 0.5 HbA1c decrease after six months of treatment, ITT and EE populations. ANCOVA with baseline as covariate).
Incidence of ≥ 0.5 HbA1c decrease after one, three and six months of treatment
Incidence summaries of ≥ 0.5 HbA1c reduction from baseline after one, three, and six months of treatment for each of the D-tagatose dose groups are provided in Table 2 for the ITT population and in Table 3 for the EE population. Only the 7.5 g D-tagatose dose group indicated a dose-response trend over time; i.e., for the ITT population, treatment success was indicated for 4/47 (8%) after one month of treatment, for 5/47 (11%) after three months of treatment, and 12/47 (25%) after six months of treatment. For the EE population, success was indicated for 2/27 (7%) at the one and three month treatment time points and for 9/27 (33%) subjects at the six month time point. By logistic regression, the incidences across the three treatments at a single time point were not statistically significantly different.
Table 2.
Incidence of ≥ 0.5 HbA1c decrease from baseline after one, three and six months of treatment, ITT population.
| D-tagatose 2.5g | D-tagatose 5.0g | D-tagatose 7.5g | |
|---|---|---|---|
| Treatment Duration |
N = 51 n (%) |
N = 46 n (%) |
N = 47 n (%) |
| One Month | 8 (15.38%) | 9 (19.57%) | 4 (8.51%) |
| Three Months | 11 (21.15%) | 8 (17.39%) | 5 (10.64%) |
| Six Months | 10 (19.23%) | 7 (15.22%) | 12 (25.53%) |
N = denominator for all percentages
Table 3.
Incidence of ≥ 0.5 HbA1c decrease from baseline after one, three and six months of treatment, EE population.
| D-tagatose 2.5g | D-tagatose 5.0g | D-tagatose 7.5g | |
|---|---|---|---|
| Treatment Duration |
N = 31 n (%) |
N = 29 n (%) |
N = 27 n (%) |
| One Month | 6 (19.35%) | 7 (24.14%) | 2 (7.41%) |
| Three Months | 9 (29.03%) | 8 (27.59%) | 2 (7.41%) |
| Six Months | 7 (22.58%) | 6 (20.69%) | 9 (33.33%) |
N = denominator for all percentages
Effect of D-tagatose on HbA1c values
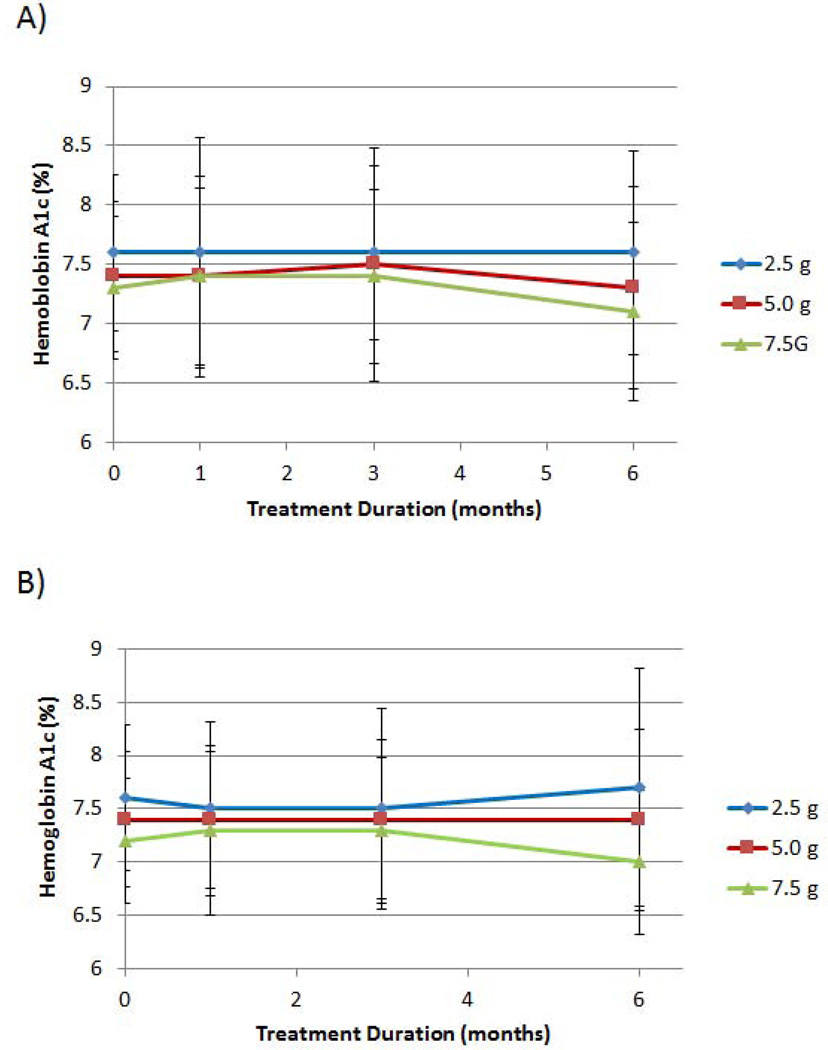
The mean HbA1c levels for the three D-tagatose groups after 1, 3 and 6 months of treatment for the ITT and the EE populations are depicted in Figures 3A and 3B, respectively. For both analysis populations, a dose-response trend was observed for the 5.0 g and 7.5 g D-tagatose doses after 3 months and 6 months of treatment. Statistically, significant differences between the doses, however, were not achieved at any of the post-treatment time points (p > 0.5, ANCOVA with baseline as covariate).
Figure 3.
Effect of D-tagatose on mean HbA1c values after 1, 3, and 6 months of treatment, ITT population (A) and EE population (B). Data are presented as the mean ± standard deviation.
Reductions from baseline to six months in mean HbA1c were observed for the 5.0 g and the 7.5 g dose groups but not for the 2.5 g dose group; i.e., mean baseline and 6-month values were 7.6 ± 0.66% and 7.6 ± 1.01%, respectively, for the 2.5 g dose group; 7.4 ± 0.63% and 7.3 ± 0.85%, respectively, for the 5.0 g dose group; and 7.3 ± 0.60% and 7.1 ± 0.75%, respectively, for the 7.5 g dose group (Figure 3B). These reductions indicate a positive dose response, although the differences in the observed mean reductions were not statistically significant between the three D-tagatose doses.
Effect of D-tagatose on fasting glucose values
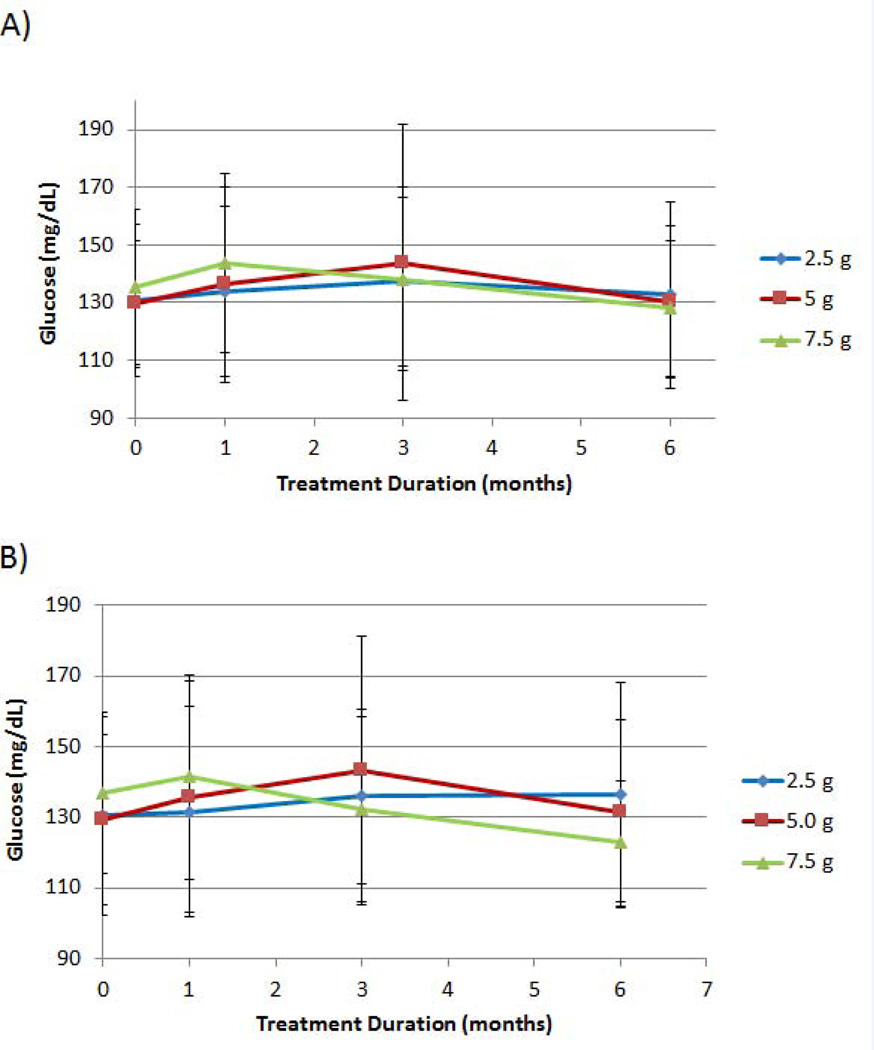
For fasting glucose, only the 7.5 g dosage group exhibited reductions from baseline at the 3- and 6-month time points in both analyzed populations (ITT and EE, Figures 4A and 4B, respectively). For the EE population, baseline and 6-month means in fasting glucose were 130.4 ± 28.8 mg/dL and 136.3 ± 31.9 mg/dL, respectively, for the 2.5 g treatment; 129.5 ± 24.0 mg/dL and 131.2 ± 26.3 mg/ dL, respectively, for the 5.0 g treatment; and 136.7 ± 22.8 mg/dL and 123.1 ± 17.1 mg/dL, respectively, for the 7.5 g treatment (p = 0.0268) (Figure 4B). For the ITT and the EE populations, the 7.5 g D-tagatose dose group provided a mean reduction in fasting glucose level after six months of treatment.
Figure 4.
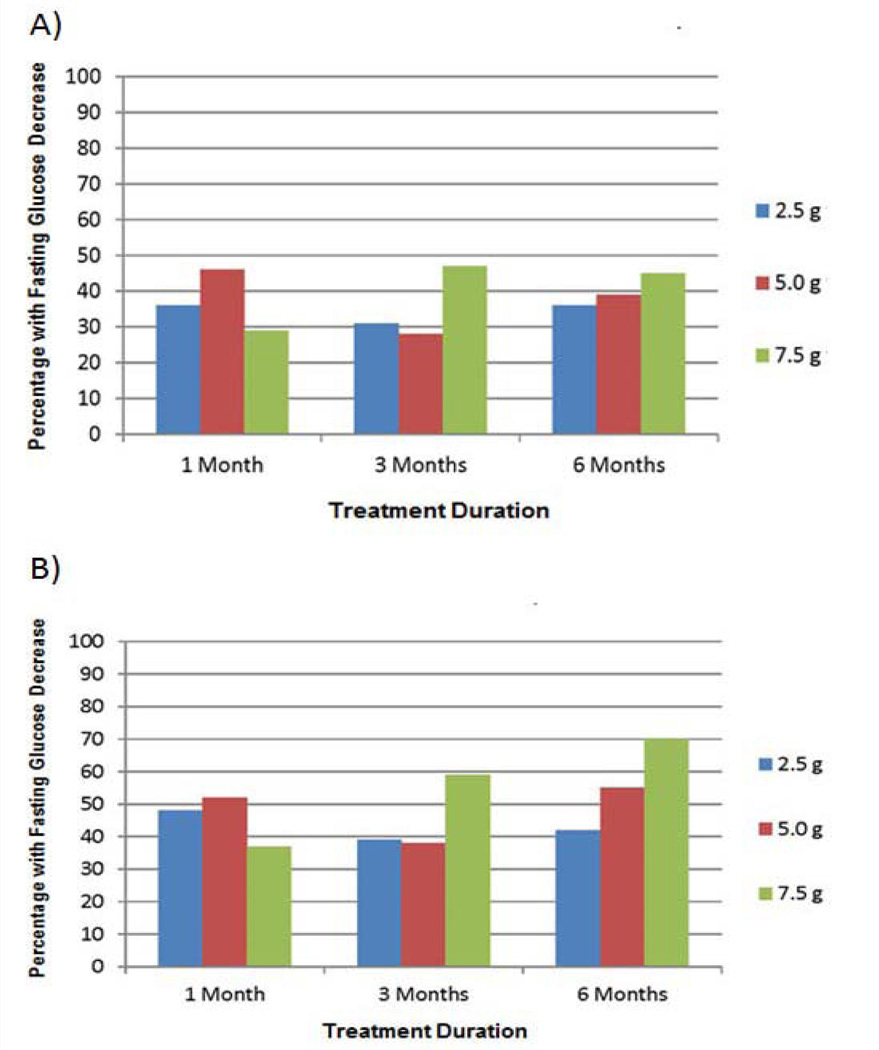
Effect of D-tagatose on mean fasting glucose values after 1, 3, and 6 months of treatment, ITT (A) and EE (B) populations. Data are presented as the mean ± standard deviation.
Incidence of decreases in fasting glucose levels
Results indicate a dose-response trend for the incidence of fasting glucose decreases at 6 months in both the ITT and the EE populations. For the ITT population, the incidences of fasting glucose decreases after six months of treatment were 45% (21/47), 39% (18/46), and 36% (19/52) for the 7.5 g, 5.0 g, and 2.5 g D-tagatose treatment groups, respectively. For the EE population, the incidences of glucose decreases were 70% (19/27), 55% (16/29), and 42% (13/31), respectively. These data are depicted in Figure 5. No statistically significant differences across the treatments (p > 0.5, logistic regression) were observed for either population at any of the post treatment time points.
Figure 5.
Effect of D-tagatose on the incidence of fasting blood sugar (i.e., glucose) decreases after 1, 3, and 6 months of treatment, ITT (A) and EE (B) populations.
Effect of D-tagatose on serum insulin
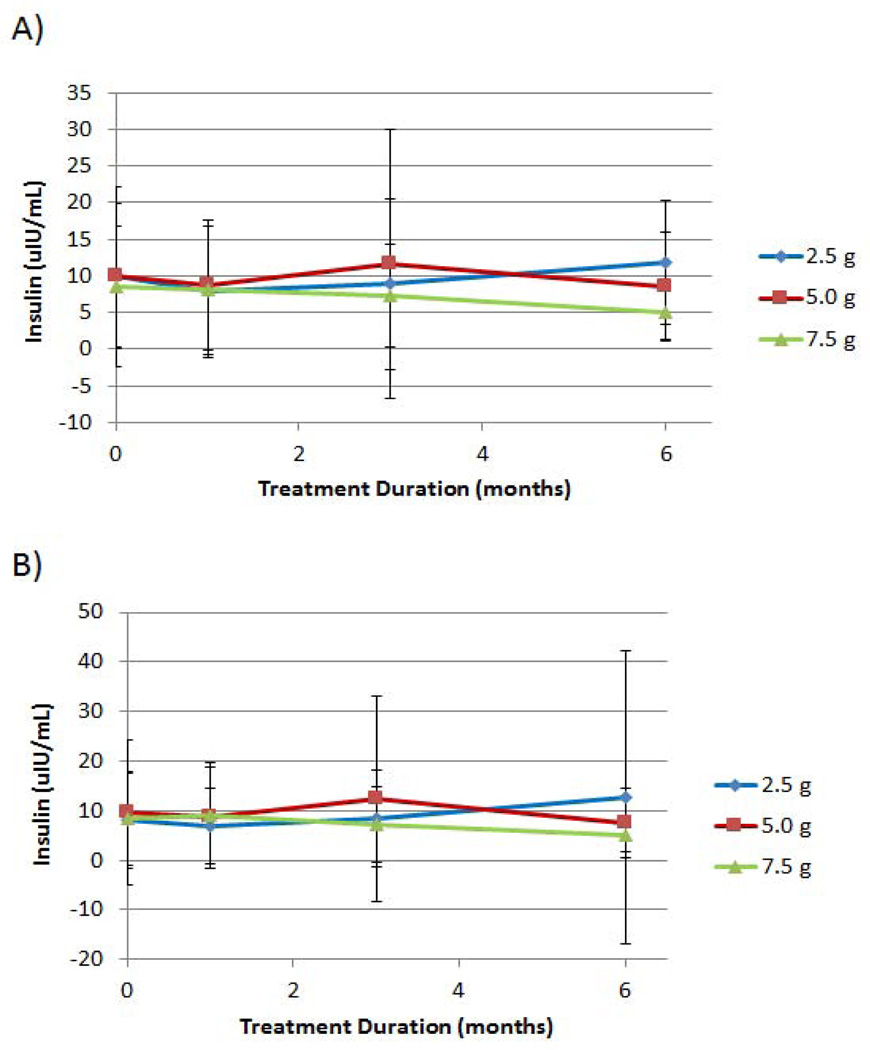
The mean insulin levels (µIU/mL) for the three D-tagatose dose groups after 1, 3 and 6 months of treatment and the two analysis populations are depicted in Figure 6. For both analysis populations, the 7.5 g D-tagatose dose group showed consistent reductions from the mean baseline insulin level after three and six months of treatment. For the ITT population (Figure 6A), the 7.5 g D-tagatose dose group demonstrated a mean baseline insulin level of 8.5 ± 8.2 µIU/mL; and after three and six months of treatment the mean insulin levels for this dose group were 7.3 ± 7.0 µIU/mL and 5.0 ± 3.6 µIU/mL, respectively. For the EE population (Figure 6B), the 7.5 g D-tagatose dose group demonstrated a mean baseline insulin level of 9.1 ± 10.6 µIU/mL; and after three and six months of treatment the mean insulin levels for this dose group were 7.2 ± 7.7 µIU/mL and 5.1 ± 3.4 µIU/mL, respectively. Statistically significant differences between the doses, however, were not achieved at any of the post-treatment time points (p > 0.5, ANCOVA with baseline as covariate) for either the ITT or the EE populations.
Figure 6.
Effect of D-tagatose on mean insulin values after 1, 3, and 6 months of treatment, ITT (A) and EE (B) populations. Data are presented as the mean ± standard deviation.
Effect of D-tagatose on lipids
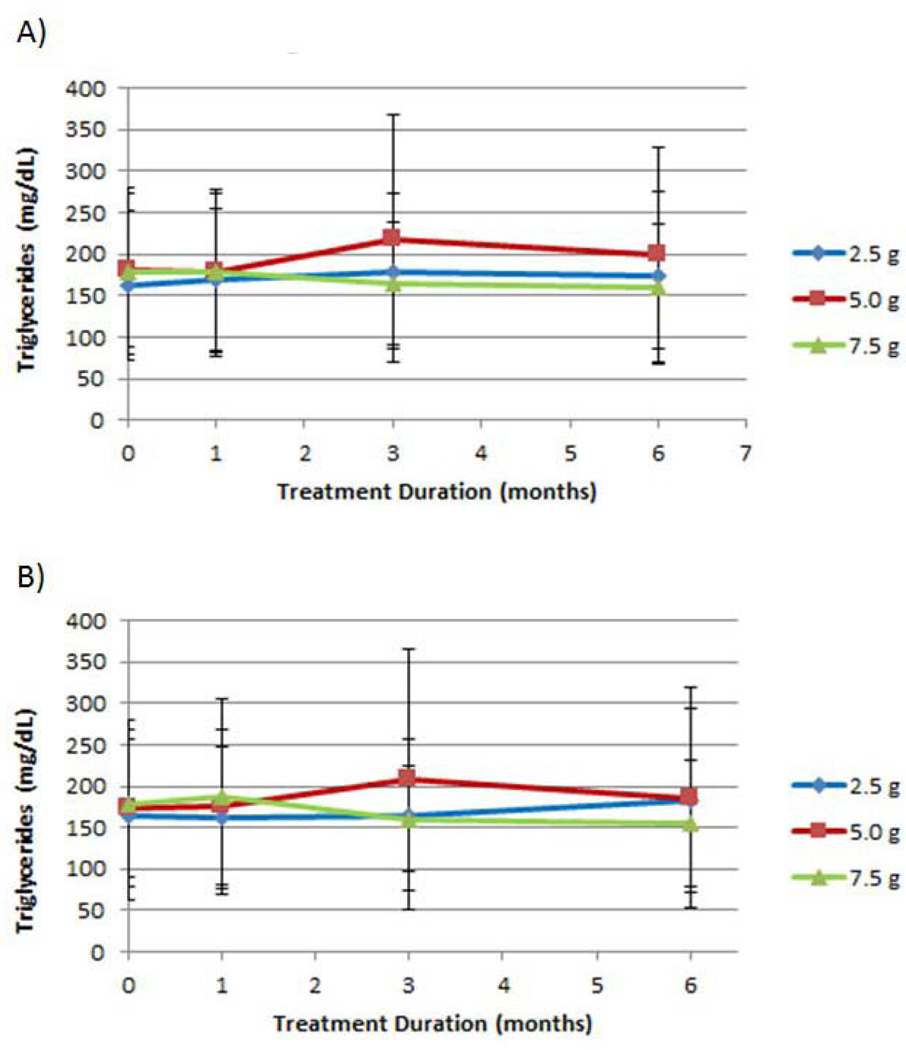
No statistically significant differences between treatments at any measured time point were observed for total, LDL, or HDL cholesterol measurements (data not shown); and all dosages provided some measure of reduction from mean baseline values at one or more time points. There was a striking elevation in mean triglyceride level after three months of treatment with the 5.0 g D-tagatose dose group in both ITT and EE populations (Figure 7). For the ITT population, the mean triglyceride concentrations at baseline and three months for the 5.0 g dose were 181 ± 92.7 mg/dL and 218 ± 149 mg/dL, respectively; 162 ± 89.8 mg/dL and 179 ± 93.4 mg/dL, respectively, for the 2.5 g dose; and 179 ± 99.8 mg/dL and 165 ± 74.7 mg/dL, respectively, for the 7.5 g dose. The difference between the treatment groups at the 3-month time point was statistically significant in the ITT population (p = 0.0296, ANCOVA with baseline as covariate). Similar results were observed with the EE population; however the difference between treatments at three months was not statistically significant with the EE population.
Figure 7.
Effect of D-tagatose on mean triglyceride values after 1, 3, and 6 months of treatment, ITT (A) and EE (B) populations. Data are presented as the mean ± standard deviation.
Effect of D-tagatose on body weight
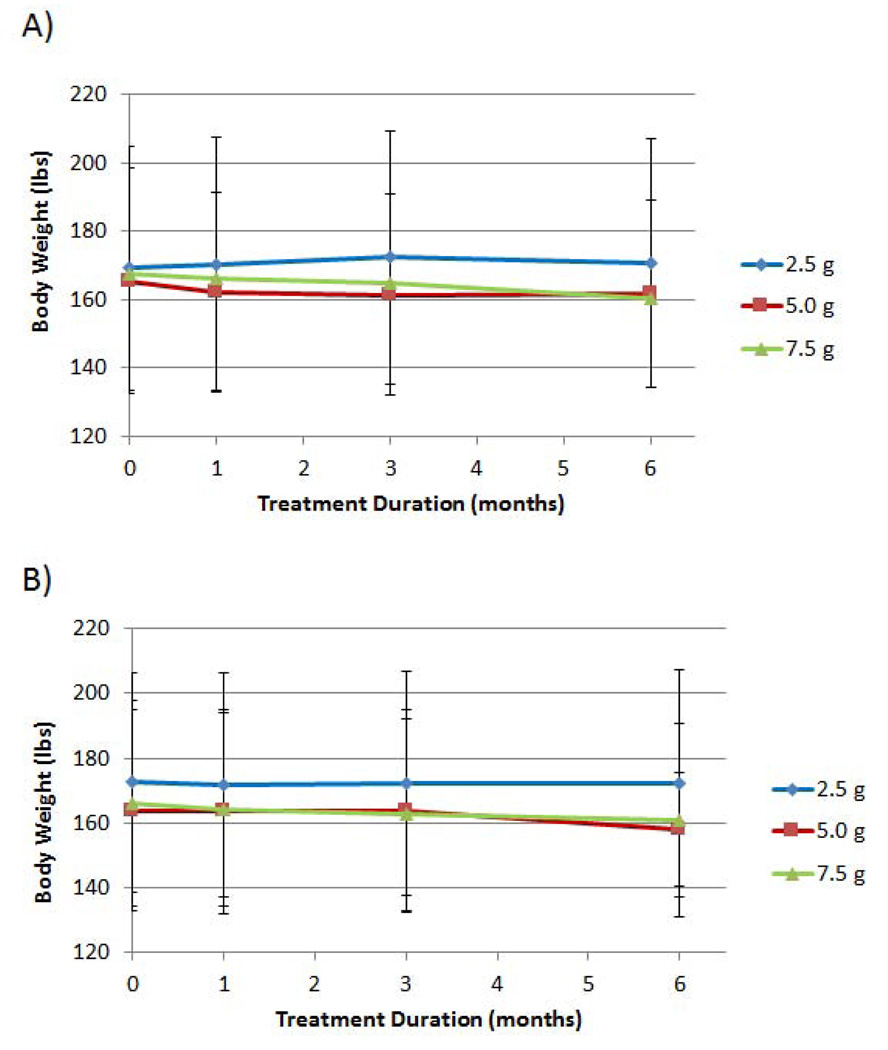
Mean body weights, over time, reduced in a dose-response fashion, with the 5.0 g and the 7.5 g D-tagatose doses providing the greatest reductions (Figure 8). Mean body weights at baseline, 3-months, and 6-months for the 5.0 g D-tagatose dose group were 165.4 ± 33.0 lbs, 161.5 ± 29.5 lbs, and 161.7 ± 27.5 lbs, respectively; and the mean body weights for the 7.5 g D-tagatose dose group were 167.4 ± 33.0 lbs, 165.1 ± 30.5 lbs, and 160.6 ± 29.3 lbs, respectively. The mean body weights for the 2.5 g D-tagatose dose group and the EE population remained within 1 lb of mean baseline weight at all post baseline time points. There was a statistically significant difference between the mean weights of the three treatments at the 3-month time point for the EE population (p = 0.0345, ANCOVA with baseline as covariate).
Figure 8.
Effect of D-tagatose on mean body weight after 1, 3, and 6 months of treatment, ITT (A) and EE (B) populations. Data are presented as the mean ± standard deviation.
Safety results
D-tagatose at all doses was well-tolerated. None of the reported adverse events were unexpected and the majority was of a gastrointestinal nature, as expected. The incidences of all reported events were similar for all treatments. There were no disparities between the three treatments in any of the assessed safety parameters. Nearly all reported AEs were of mild or moderate severity. Severe AEs occurring during the study are summarized in Table 4. There did not appear to be a dose-response relationship in terms of AE severity. As expected, the highest incidences of probably or possibly related AEs were gastrointestinal disorders. No dose-response trends were observed for any of the AEs that were assessed as possibly or probably related to study treatment.
Table 4.
Incidence of severe adverse events, safety population.
| D-tagatose 2.5g N = 52 n (%) |
D-tagatose 5.0g N = 46 n (%) |
D-tagatose 7.5g N = 47 n (%) |
Total N = 145 n (%) |
|
|---|---|---|---|---|
| Nausea | - | - | 1 (2.1%) | 1 (0.7%) |
| Retching | - | - | 1 (2.1%) | 1 (0.7%) |
| Vomiting | 1 (1.9%) | - | - | 1 (0.7%) |
| Fatigue | - | 1 (2.2%) | - | 1 (0.7%) |
| Lethargy | - | 1 (2.2%) | - | 1 (0.7%) |
| Anxiety | 1 (1.9%) | - | - | 1 (0.7%) |
Disposition of subjects
The study disposition of randomized subjects is provided in Table 5. One hundred and sixty one (161) subjects were randomized and analyzed. Of the 161 randomized subjects, 57/161 (35%) were randomized to the 2.5 g dose group, 51/161 (32%) were randomized to the 5.0 g dose group, and 53/161 (33%) were randomized to the 7.5 g dose group.
Table 5.
Study Disposition of Randomized Subjects.
| D-tagatose 2.5g |
D-tagatose 5.0g |
D-tagatose 7.5g |
Total | |
|---|---|---|---|---|
| Number Randomized (N)* | 57 | 51 | 53 | 161 |
| n (%) | n (%) | n (%) | n (%) | |
| Received ≥ 1 Dose | 55 (96.5%) | 49 (96.1%) | 51 (96.2%) | 155 (96.3%) |
| Completed Study† | 35 (61.4%) | 32 (62.7%) | 34 (64.2%) | 101 (62.7%) |
| Withdrawn | 22 (38.6%) | 19 (37.3%) | 19 (35.8%) | 60 (37.3%) |
Denominator for all percentages.
Completed study through the end of the 6-month treatment period
All treatment groups had a median study medication compliance of approximately 80%, and full to good compliance with the study-mandated diet and exercise, as assessed by the investigator, was 77% to 87% after the first month, 70% to 79% after three months, and 63% to 74% after six months. Given the similarity of the treatment groups in terms of demographics, baseline characteristics, concomitant medication usage, and compliance with treatment, diet and exercise, the resulting efficacy and safety analyses were considered reliable for comparisons between three D-tagatose dose groups.
Sixty (60) randomized subjects (37.3%) were withdrawn before completing the 6-month treatment period. Two subjects, from each of the dose groups were withdrawn prior to receiving the first dose of study medication, resulting in a similar withdrawal rate for each of the three doses. However, when individual reasons for withdrawal were evaluated, two interesting dose-response trends were noted: one for subject-initiated withdrawals and one for withdrawals due to AEs/SAEs (Table 6).
Table 6.
Reasons for Withdraw, Randomized Subjects.
| Reason for Withdrawal | D-tagatose 2.5g N = 57 n (%) |
D-tagatose 5.0g N = 51 n (%) |
D-tagatose 7.5g N = 53 n (%) |
Total N = 161 n (%) |
|---|---|---|---|---|
| Subject Request | 3 (5.3%) | 5 (9.8%) | 10 (18.9%) | 18 (11.2%) |
| Lost to Follow-up | 3 (5.3%) | 3 (5.9%) | 5 (9.4%) | 11 (6.8%) |
| AE/SAE | 5 (8.8%) | 2 (3.9%) | 1 (1.9%) | 8 (5.0%) |
| Protocol Deviation | 3 (5.3%) | 2 (3.9%)* | 2 (3.8%) | 7 (4.3%) |
| Termination by Sponsor | 2 (3.5%) | 0 (0.0%) | 0 (0.0%) | 2 (1.2%) |
| Other | 6 (10.5%)† | 7 (13.7%) | 1 (1.9%) | 14 (8.7%) |
| Total Withdrawn | 22 (38.6%) | 19 (37.3%) | 19 (35.8%) | 60 (37.3%) |
N = Randomized subjects; denominator for all percentages
One randomized subject in this dose group had a recorded reason for withdrawal of “screen failure” and was therefore tabulated with those withdrawn for a protocol deviation
One randomized subject in this dose group had no reason for withdrawal specified on the CRF and was therefore tabulated with “Other”
Subject-initiated withdrawals
Of the randomized subjects, 18.0% (29/161) were withdrawn due to subject request or lost to follow up. The highest incidence for these two reasons, combined, was with the 7.5 g dose group; i.e., 6/57 (10.5%) in the 2.5 g dose group, 8/51 (15.7%) in the 5.0 g dose group, and 15/53 (28.3%) in the 7.5 g dose group (Table 6). These data suggest that as the dosage increased so did the drop-outs due to “subject request” and “lost to follow-up,” combined (i.e., subject-initiated withdrawals). This observation is supported by the fact that, when the two reasons (subject request and lost to follow-up) were analyzed separately, each of the responses also indicated a positive dose-response. These results all appear to indicate that as the dosage increased, so did the incidence of subject-initiated withdrawals.
Withdrawals due to AEs/SAEs
The incidence of withdrawals due to AEs and SAEs for all dose groups combined was 8/161 (5.0%) with what appears to be an inverse dose-response relationship; i.e., as the dosage increased the incidence of withdrawals due to AEs decreased. The highest incidence of withdrawals due to AEs was in the 2.5 g dose group (5/57, 8.8%) and the lowest incidence of withdrawals due to AEs was in the 7.5 g group (1/53, 1.9%) (Table 6). Withdrawals due to protocol deviations were less than 5% for all doses, combined. The individual dose groups all had similar incidences, ranging from approximately 4% to approximately 5%.
DISCUSSION
This dose-ranging trial was conducted to evaluate the effect of three doses of D-tagatose (2.5 g, 5.0 g, and 7.5 g), taken three times daily over a period of six months, on various glycemic control measures and safety parameters in type 2 diabetic patients. In this trial, the 5.0 g TID dose of D-tagatose was assumed (based on previous trials [7]) to be a minimally effective dose in reducing HbA1c, a primary measurement of glycemic control. The 2.5 g TID dose of D-tagatose (which served as a nominal-effect comparator) and the 7.5 g TID dose were selected to bracket the 5.0 g TID dosage level.
The efficacy parameters selected for evaluation in this trial are all common measures of glycemic control for diabetic patients: HbA1c, fasting glucose levels, lipid parameters, blood insulin levels, and body weight. The primary efficacy parameter selected for this trial was a dichotomous variable: the treatment success as measured by a reduction from baseline HbA1c by at least 0.5 units after six months of treatment (i.e., 0.5% reduction in HbA1c after six months of treatment). Dichotomous variables, by nature, are not the most sensitive metric by which to assess treatment differences; nevertheless, a treatment difference was noted in that 12/47 (26%) of the 7.5 g D-tagatose dose group (ITT population) and 9/27 (33%) EE population in the dose groups met the endpoint (Tables 2 and 3). For both populations, of the three studied dosages, the 7.5 g D-tagatose dose exhibited the greatest incidence of success, as measured by this parameter. Interestingly, a dose response was not observed in the primary endpoint. For the ITT population and the primary endpoint, the 2.5 g and the 5.0 g D-tagatose doses had a success incidences of 10/52 (19%) and 7/46 (15%), respectively and the difference between the three dosages were not statistically significant. Similar results for the lower doses were observed with the EE population. Continuous variables are traditionally more sensitive in detecting differences between treatments. Mean HbA1c reductions after six months of treatment within the ITT population were greatest for the 7.5 g D-tagatose group (Figure 3A). The minimum dosage at which HbA1c reductions were evident was the 5.0 g TID dosage. The mean baseline and the mean 6-month HbA1c values for the 2.5 g treatment group remained the same. The differences between the treatment groups in HbA1c measurements were not statistically significant at any post treatment time point. Similar results with HbA1c reduction were observed with the EE population (Figure 3B).
Regarding fasting glucose mean values and mean changes from baseline over time, a reduction from baseline was observed only in the 7.5 g D-tagatose dose group, beginning after three months of treatment with increasing reduction at the 6-month time point, at which time statistical significance was observed (Figure 4), thereby supporting the analysis of the primary endpoint. Additionally, for the EE population, the incidence rates of subjects achieving any decrease in fasting glucose values indicated consistent increases throughout the treatment period for the 7.5 g dose group, although the differences across the groups was not statistically significant at any time point. This observation provided further support of the primary endpoint results. The observed increases and reductions in fasting glucose levels over time for the 2.5 g and the 5.0 g treatments are most likely due to the inherent variability of the fasting glucose parameter.
Each of the doses had some measure of mean insulin reduction at one or more post-baseline time points in both analyzed populations. After six months of treatment, however, only the 5.0 g and the 7.5 g dosages had mean levels that were lower than that of baseline (Figure 6A). There were no statistically significant differences between treatments at any of the measured time points. Similar results were observed with the EE population (Figure 6B).
No statistically significant difference between treatments at any measured time point was observed for total, LDL, or HDL cholesterol measurements; and all dosages provided some measure of reduction from mean baseline values at one or more time points. There was a striking elevation in mean triglyceride level after three months of treatment with the 5.0 g D-tagatose dose group in both the ITT and the EE populations (Figure 7). This rise in triglycerides at the 5.0 g dose warrants further research.
Mean body weights, over time, were reduced in a positive dose-response fashion, with the 5.0 g and the 7.5 g D-tagatose doses providing the greatest reductions (Figure 8). The mean body weights for the 2.5 g D-tagatose dose group remained within 1 lb of mean baseline weight at all post baseline time points.
D-tagatose at all doses was well tolerated. None of the reported adverse events were unexpected and the majority was of a gastrointestinal nature, as expected. The incidences of all reported events were similar for all treatments. Finally, there were no disparities between the three treatments in any of the assessed safety parameters.
Although not always statistically significant, the high dose (7.5 g TID of D-tagatose) appeared to provide the greatest efficacy of the three tested doses in terms of incidence rates achieving ≥ 0.5% decrease in HbA1c, reductions in fasting glucose values, reductions in lipid parameters, reduction in insulin concentration, and reduction in body weight. Additionally, it appears that 5.0 g TID of D-tagatose was the minimally effective dose for providing reduction in glycemic measures within this type 2 diabetic population.
Future research might investigate the inverse dose-response relationships for constipation, nausea, headache, vomiting, and eructation (Table 6).
CONCLUSIONS
Several points can be concluded from this study designed to determine the minimum dose of D-tagatose required to affect HbA1c:
D-tagatose at dosages of 2.5 g, 5.0 g, and 7.5 g TID for six months were well tolerated by this subject population.
D-tagatose at 5.0 g TID was the minimal dose required to reduce HbA1c.
D-tagatose at 7.5 g TID provided the greatest effect in most measured efficacy parameters.
Future research might investigate the elevation of mean triglycerides with the 5.0 g D-tagatose dose group after three months of treatment. However, this elevation was transient and did not appear at the 6 month timepoint. This elevation was also only observed in the ITT population. If it were a drug effect, it would also likely appear in the EE population.
Acknowledgments
CREDIT
This research was supported in part by the Biospherics subsidiary of Spherix Incorporated. The project described was also supported by the National Center for Research Resources and the National Center for Advancing Translational Sciences, National Institutes of Health, through Grant UL1TR000117. The content is solely the responsibility of the authors and does not necessarily represent the official views of the NIH.
ABBREVIATIONS
- AE
Adverse event
- EE
Efficacy evaluable
- GRAS
Generally recognized as safe
- HbA1c
Glycosylated hemoglobin A1c
- HDL
High-density lipoprotein
- ITT
Intent-to-treat
- LDL
Low density lipoprotein
- SAE
Serious adverse event
- TID
three times daily
- VLDL
Very low density lipoprotein.
Footnotes
CONFLICT OF INTEREST
Robert Lodder was president of Spherix at the time the clinical data were collected.
REFERENCES
- 1.Defronzo RA. Banting Lecture. From the triumvirate to the ominous octet: a new paradigm for the treatment of type 2 diabetes mellitus. Diabetes. 2009;58:773–795. doi: 10.2337/db09-9028. [DOI] [PMC free article] [PubMed] [Google Scholar]
- 2.Bennett WL, Bolen S, Maruthur N, Singh S, Chatterjee R, Marinopoulos SS, et al. AHRQ Publication No. 11-EHC038-EF. Rockville, MD: Agency for Healthcare Research and Quality; Oral Diabetes Medications for Adults With Type 2 Diabetes: An Update. Comparative Effectiveness. [PubMed] [Google Scholar]
- 3.Saydah SH, Fradkin J, Cowie CC. Poor control of risk factors for vascular disease among adults with previously diagnosed diabetes. JAMA. 2004;291:335–342. doi: 10.1001/jama.291.3.335. [DOI] [PubMed] [Google Scholar]
- 4.Nathan DM. Thiazolidinediones for initial treatment of type 2 diabetes? N Engl J Med. 2006;355:2477–2480. doi: 10.1056/NEJMe068264. [DOI] [PubMed] [Google Scholar]
- 5.Nathan DM. Rosiglitazone and cardiotoxicity--weighing the evidence. N Engl J Med. 2007;357:64–66. doi: 10.1056/NEJMe078117. [DOI] [PubMed] [Google Scholar]
- 6.Levin GV. Tagatose, the new GRAS sweetener and health product. J Med Food. 2002;5:23–36. doi: 10.1089/109662002753723197. [DOI] [PubMed] [Google Scholar]
- 7.Lu Y, Levin GV, Donner TW. Tagatose, a new antidiabetic and obesity control drug. Diabetes Obes Metab. 2008;10:109–134. doi: 10.1111/j.1463-1326.2007.00799.x. [DOI] [PubMed] [Google Scholar]
- 8.Police SB, Harris JC, Lodder RA, Cassis LA. Effect of diets containing sucrose vs. D-tagatose in hypercholesterolemic mice. Obesity (Silver Spring) 2009;17:269–275. doi: 10.1038/oby.2008.508. [DOI] [PMC free article] [PubMed] [Google Scholar]
- 9.Donner TW, Magder LS, Zarbalian K. Dietary supplementation with d-tagatose in subjects with type 2 diabetes leads to weight loss and raises high-density lipoprotein cholesterol. Nutr Res. 2010;30:801–806. doi: 10.1016/j.nutres.2010.09.007. [DOI] [PubMed] [Google Scholar]
- 10.Donner TW, Wilber JF, Ostrowski D. D-tagatose, a novel hexose: acute effects on carbohydrate tolerance in subjects with and without type 2 diabetes. Diabetes Obes Metab. 1999;1:285–291. doi: 10.1046/j.1463-1326.1999.00039.x. [DOI] [PubMed] [Google Scholar]
- 11.Donner TW, Wilber JF, Ostrowski D. D-tagatose, a novel hexose: acute effects on carbohydrate tolerance in subjects with and without type 2 diabetes. Diabetes Obes Metab. 1999;1:285–291. doi: 10.1046/j.1463-1326.1999.00039.x. [DOI] [PubMed] [Google Scholar]
- 12.Donner TW, Magder LS, Zarbalian K. Dietary supplementation with d-tagatose in subjects with type 2 diabetes leads to weight loss and raises high-density lipoprotein cholesterol. Nutr Res. 2010;30:801–806. doi: 10.1016/j.nutres.2010.09.007. [DOI] [PubMed] [Google Scholar]
- 13.Buemann B, Toubro S, Astrup A. D-Tagatose, a stereoisomer of D-fructose, increases hydrogen production in humans without affecting 24-hour energy expenditure or respiratory exchange ratio. J Nutr. 1998;128:1481–1486. doi: 10.1093/jn/128.9.1481. [DOI] [PubMed] [Google Scholar]
- 14.Buemann B, Toubro S, Astrup A. Human gastrointestinal tolerance to D-tagatose. Regul Toxicol Pharmacol. 1999;29:S71–S77. doi: 10.1006/rtph.1998.1265. [DOI] [PubMed] [Google Scholar]
- 15.Buemann B, Toubro S, Raben A, Astrup A. Human tolerance to a single, high dose of D-tagatose. Regul Toxicol Pharmacol. 1999;29:S66–S70. doi: 10.1006/rtph.1998.1252. [DOI] [PubMed] [Google Scholar]
- 16.Saunders JP, Donner TW, Sadler JH, Levin GV, Makris NG. Effects of acute and repeated oral doses of D-tagatose on plasma uric acid in normal and diabetic humans. Regul Toxicol Pharmacol. 1999;29:S57–S65. doi: 10.1006/rtph.1998.1264. [DOI] [PubMed] [Google Scholar]


