

Abstract
Affinity reagent pairs that recognize distinct epitopes on a target protein can greatly improve the sensitivity and specificity of molecular detection. Importantly, such pairs can be conjugated to generate reagents that achieve two-site “bidentate” target recognition, with affinities greatly exceeding either monovalent component. DNA aptamers are especially well-suited for such constructs, because they can be linked via standard synthesis techniques without requiring chemical conjugation. Unfortunately, aptamer pairs are difficult to generate, primarily because conventional selection methods preferentially yield aptamers that recognize a dominant “hot spot” epitope. Our array-based discovery platform for multivalent aptamers (AD-MAP) overcomes this problem to achieve efficient discovery of aptamer pairs. We use microfluidic selection and high-throughput sequencing to obtain an enriched pool of aptamer sequences. Next, we synthesize a custom array based on these sequences, and perform parallel affinity measurements to identify the highest-affinity aptamer for the target protein. We use this aptamer to form complexes that block the primary binding site on the target, and then screen the same array with these complexes to identify aptamers that bind secondary epitopes. We used AD-MAP to discover DNA aptamer pairs that bind distinct sites on human angiopoietin-2 with high affinities, even in undiluted serum. To the best of our knowledge, this is the first work to discover new aptamer pairs using arrays. We subsequently conjugated these aptamers with a flexible linker to construct ultra-high-affinity bidentate reagents, with equilibrium dissociation constants as low as 97 pM: >200-fold better than either component aptamer. Functional studies confirm that both aptamers critically contribute to this ultrahigh affinity, highlighting the promise of such reagents for research and clinical use.
Molecular recognition mechanisms based on multivalent receptor–ligand interactions can offer dramatically higher affinity and specificity in comparison to monovalent binding. Accordingly, many biological systems in nature have evolved to exploit multivalent interactions to their advantage. For example, multivalent lectin–carbohydrate interactions generate strong adhesive forces at the cell surface for the attachment of micro-organisms,1 and many important cell-signaling pathways exploit multivalent binding to achieve high specificity for the regulation of critical functions.2 Multivalent interactions in which two different affinity reagents recognize two distinct sites on a target molecule have also been extensively used to improve the accuracy of in vitro diagnostics. For example, the enzyme-linked immunosorbent assay (ELISA),3 the most widely used protein detection assay, utilizes antibody pairs in a sandwich format to dramatically increase its specificity. ELISA can effectively minimize false positive results because the detection signal is generated only when both antibodies independently bind to distinct epitopes on the same target protein.4,5
Importantly, these pairs can also be physically linked to create a single reagent that binds its target molecule via two-site, “bidentate” recognition. The binding affinities of these bidentate reagents can be dramatically higher than those of the individual components, as described by the Winter group and others.6 Nucleic acid aptamers are especially well-suited for the synthesis of these useful molecular constructs, because aptamers can readily be combined via standard DNA synthesis techniques without the need for additional chemical conjugation processes. Previously, this approach has been utilized to combine identical aptamers that bind in a multivalent fashion to a homodimeric target7 as well as bidentate aptamer pairs that each recognize distinct sites on a single protein.7,8 For example, Lao et al. demonstrated that that they could improve the sensitivity of an array based thrombin sensor by several orders of magnitude by synthesizing bivalent array features that display two distinct thrombin aptamers.9
Unfortunately, the discovery of aptamer pairs that can recognize distinct epitopes on a common target has proven to be exceptionally challenging. This is primarily because conventional aptamer discovery methods (i.e., SELEX)10,11 have a strong tendency to only yield aptamers that preferentially bind to the primary, dominant epitope at the expense of other aptamers that bind to secondary, nondominant epitopes.12 Furthermore, the identification of aptamer pairs remains a low-throughput process because binding measurements must be performed serially for every combination of potential binding pairs. As a result, aptamer pairs are currently available only for a handful of proteins including thrombin,13,14 prion protein (PrP),15,16 TATA-binding protein17 and integrin αVβ3.18 Thus, there is an urgent need for more efficient technologies for aptamer pair discovery.
To address this important need, here we report a systematic screening method that utilizes aptamer arrays to efficiently identify aptamer pairs in a parallel and scalable manner. Our method, which we have termed the array-based discovery platform for multivalent aptamers (AD-MAP), starts with microfluidic SELEX19 followed by high-throughput sequencing (HTS)20,21 in order to identify a high-quality pool of aptamers that bind to the target protein of interest (Figure 1A). Using the sequence information from HTS, we fabricate a custom aptamer array and identify the aptamer with the highest-affinity on the array. Then, we form an aptamer–protein complex wherein the primary binding site on the target protein is blocked by this highest-affinity aptamer. Finally, we use this aptamer–protein complex to perform systematic and parallel screening of the array in order to identify aptamers that recognize secondary binding sites on the protein. As a proof of concept, we have used AD-MAP to discover novel DNA aptamer pairs that bind to human angiopoeitin-2 (Ang2), an important protein mediator of angiogenesis for colon, prostate and breast cancers.22,23 To the best of our knowledge, this is the first work to discover aptamer pairs using arrays. We show that these aptamers are capable of binding to Ang2 in complex samples such as undiluted serum. Finally, we demonstrate that these aptamer pairs can be linked together to create ultra-high-affinity bidentate reagents with equilibrium dissociation constants (Kd) as low as 97 pM, a >200-fold improvement over the individual component aptamers. Thus, we show that AD-MAP could effectively facilitate the development of high-sensitivity, aptamer-based molecular detection assays for clinical and basic research applications.
Figure 1.

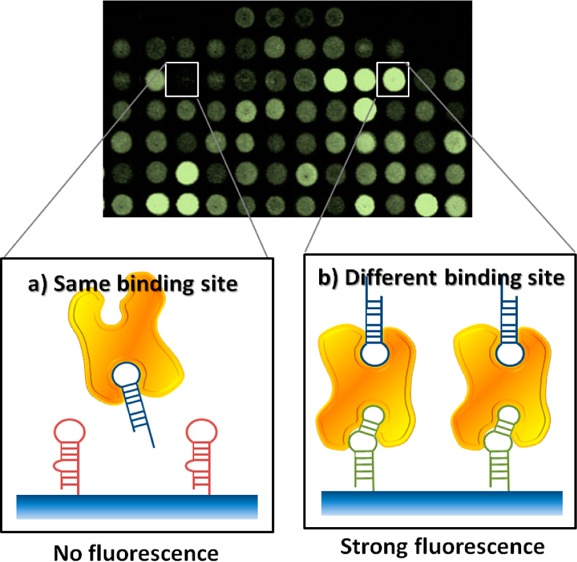
(A) Overview of the AD-MAP process. (Step 1) We obtain a pool of aptamer candidates with microfluidic selection and identify enriched candidate sequences via high-throughput sequencing. (Step 2) The sequences with the highest copy number are in situ synthesized on a custom aptamer array, which is used to measure the affinity of every candidate in parallel and identify the highest-affinity aptamer. (Step 3) We identify potential bidentate pairs by screening for array features that can bind the target simultaneously with this highest-affinity aptamer, as described in panel B. (B) We obtained the baseline fluorescence intensity (F0, left) for each aptamer feature by challenging our aptamer array with fluorescently labeled Ang2. In parallel, we obtained the fluorescence intensity (F, right) from a second, identical aptamer array challenged with fluorescently labeled Ang2–ABA1 complexes. We then determined the relative difference in fluorescence intensity (ΔF = F – F0) for each aptamer candidate; candidates that recognize the same site as ABA1 (red) will be outcompeted by this highest-affinity aptamer and yield a negative ΔF, whereas candidates recognizing distinct sites (green) will bind the ABA1–Ang2 complex and are thus predicted to yield a non-negative ΔF.
Materials and Methods
Microfluidic SELEX Targeting Human Angiopoietin-2 (Ang2)
We immobilized Ang2 (R&D Systems) on the surface of micrometer-sized magnetic beads. First, M-270 carboxylic acid Dynabeads (Life Technologies) were activated with ethyl(dimethylaminopropyl) carbodiimide (EDC) and N-hydroxysuccinimide (NHS), and target protein was immobilized after activation following the manufacturer’s procedure. Immobilized Ang2 proteins were quantified using the NanoOrange protein quantification kit (Life Technologies).
Each member of the single-stranded DNA (ssDNA) random library included 40 randomized nucleotides flanked by two 20 nt primer binding sequences for PCR (5′-AGCAGCACAGA GGTCAGATG-[40N]-CCTATGCGTGCTACCGTGAA-3′). The library was synthesized by Integrated DNA Technologies (IDT). Ang2-coated magnetic beads were washed with Ang2 binding buffer (20 mM HEPES, 150 mM NaCl, 1 mM MgCl2, 1 mM CaCl2, pH 7.4) before each selection. A total of 2 × 10⁷ protein-coated beads were used in the first round (R1), 4 × 10⁶ beads for the second round (R2), and 1 × 10⁶ beads for the third (R3) and fourth rounds (R4). The ssDNA library (∼1014 molecules) was denatured by heating at 95 °C for 10 min, and cooled down to room temperature. This ssDNA library was incubated with magnetic beads in Ang2 binding buffer for 1 h at room temperature. After incubation, we diluted the complex solution into large volumes of Ang2 wash buffer (20 mM HEPES, 150 mM NaCl, 1 mM MgCl2, 1 mM CaCl2, 0.001% Tween-20, pH 7.4) with a dilution factor of 40 (R1:1 mL), 200 (R2:10 mL) or 400 (R3 and R4:20 mL). The beads were trapped in a magnetic particle concentrator (Invitrogen) for R1 and MMS chip for R2–R4. For R2–R4, diluted samples were loaded onto the chip at a flow-rate of 100 mL/h to continuously separate protein-bound aptamers from unbound and weakly bound DNAs. Aptamer-bound beads were collected and the bound aptamers were amplified by PCR using forward and phosphorylated reverse primers. ssDNA was generated for the next round of selection by lambda exonuclease (New England Biolabs) digestion.
High-Throughput Sequencing and Data Analysis
To prepare initial DNA samples for sequencing, we collected 400 μL of eluted ssDNA pools after each washing step for amplification via PCR at an optimized cycle number determined by pilot PCR. We used unmodified forward and reverse primers for PCR and purified the resulting product via a MinElute PCR Purification Kit (Qiagen). We used Illumina’s single-read Chip-Seq DNA Sample Prep Kit to prepare double-stranded aptamers for sequencing on the Genome Analyzer IIx. We initially used 62 ng of sample, which we then subjected to end repair, addition of adenosine to the 3′ end, adapter ligation, size selection by gel extraction and PCR. After each step, samples were cleaned with DNA Clean & Concentrator columns (Zymo Research). For the adaptor ligation step, the adaptor mix was diluted 1:20 to avoid sequencing an abundance of adaptors. Following adapter ligation, a specific size range of molecules was isolated for proper cluster formation on the cluster station. We ran a 2% agarose gel, excised 100–200 base pair fragments from the gel, and cleaned these using the Gel Purification Mini kit from Qiagen. We followed the spin column protocol supplied by the kit manufacturer. After size selection, we amplified the selected fragments using Illumina-supplied PCR primers. Forward and reverse primers were diluted 1:2 before being added to the sample. We conducted ten cycles of PCR using Illumina’s recommended PCR recipe. After PCR, the sample was quantitated with the Invitrogen Qubit fluorometer.
We loaded the prepared DNA samples at a concentration of 8 pM and hybridized them to an Illumina flowcell via the Illumina cluster station. The cluster station performed bridge amplification to amplify single DNA molecules 35 times into clusters. Each cluster was then linearized, blocked, and the sequencing primer was hybridized. The flowcell was then loaded onto the Genome Analyzer IIx and run with the Single Read 75 Base Pair Recipe. Individual nucleotides of each cluster were sequenced base by base. Illumina Sequencing Control Software produced image intensities and quality-scored base calls in real-time. After sequencing was complete, Illumina Casava software processed the data for quality analysis.
Fluorescence Labeling on Ang2
Ang2 was labeled with Alexa Fluor 647 dye (Invitrogen) according to manufacturer’s protocol. Briefly, 1 mg/mL of Ang2 (100 mM NaHCO3, pH 8.3) was incubated with 3 μL of Alexa Fluor 647 succinimidyl ester (7.94 nmol/μL) for 1 h at room temperature. To separate the labeled protein from unreacted dye, a spin column was filled with 750 μL of supplied purification resin and centrifuged at 15000 rpm for 15 s. After washing the column three times with PBSM buffer (10.1 mM Na2HPO4, 1.8 mM KH2PO4, 137 mM NaCl, 2.7 mM KCl and 1 mM MgCl2, pH 7.4), we loaded the conjugate reaction mixture onto the center of the resin. After centrifuging at 15000 rpm for 1 min, we collected the purified dye-labeled protein. The eluted conjugates were analyzed using a ND-2000 spectrophotometer (NanoDrop Technologies). We obtained ∼95% yield for the conjugate with a degree of labeling (DOL) of 9.35. The labeled protein was stored at 4 °C, protected from light.
Aptamer Array Design and Analysis
We designed and ordered custom DNA microarrays through Agilent, where each slide consisted of eight identical subarrays of 15 000 individual features. The array design was based on aptamer sequences identified from high-throughput sequencing. Each aptamer sequence on the array was synthesized with a 3′ poly T20 linker. The 150 most highly represented sequences from R4 were incorporated into the array design, with each sequence synthesized in triplicate. The array also featured library, R1–R3 pool sequences and R4 aptamer sequences with different linkers. We also synthesized negative control sequences including primer repeats and linkers only, and aptamer sequences against human α thrombin and PDGF-BB (see Table S1 (Supporting Information) for details).
Identification of the Aptamer with the Highest Binding Affinity
To measure Kd, we incubated each array with 5, 10, 25, 50, 75, 100, 150 or 200 nM Alexa Fluor 647-labeled Ang2. After washing with washing buffer (10 mM Na2HPO4, 1.8 mM KH2PO4, 2.7 mM KCl, 137 mM NaCl, 1 mM MgCl2, pH 7.4) with decreasing amounts of Tween-20 (0.1%, 0.01% and 0.001%), slides were disassembled in nanopure H2O and then dried via centrifugation (1500 rpm for 2 min using a swing bucket rotor). We used an array scanner to measure the fluorescence intensity (excitation = 649 nm, emission = 666 nm) from every feature. We averaged the triplicate signals from each aptamer candidate, and used these data to calculate Kd values. We assumed a Langmuirian binding isotherm and used the equation Y = Bmax × X/(Kd + X), where Y is the net fluorescence intensity at each concentration, X is the concentration of fluorescently labeled Ang2 and Bmax is the net fluorescence intensity at saturation. We discarded sequences whose Bmax was less than double the background. We then sorted aptamer sequences with Kd values, and finally identified the aptamer with the lowest Kd value.
Aptamer Pair Screening
Slides were assembled with 8-well gaskets in an Agilent hybridization chamber for blocking and sample incubation. Each gasket was filled with 40 μL of blocking or sample solution. The microarray surface was initially blocked for 1 h at room temperature with blocking buffer (10 mg/mL casein, 0.1% Tween-20, 8.1 mM Na2HPO4, 1.1 mM KH2PO4, 2.7 mM KCl, 137 mM NaCl, 1 mM MgCl2, 138 mM NaCl, pH 7.4). Slides were disassembled in nanopure H2O and then dried by centrifuging (1500 rpm for 2 min using a swing bucket rotor). Prior to screening, we preincubated 50 nM of Alexa Fluor 647-labeled Ang2 with 10 μM of ABA1 aptamer for 1 h at room temperature. We incubated one “reference” array with Alexa Fluor 647-labeled Ang2 and another identical array with the Ang2–ABA1 complex solution and incubated for 1 h at room temperature. After sample incubation, the slides were disassembled in PBSM buffer with 0.1% Tween-20 and rinsed three times in washing buffer with decreasing amounts of Tween-20 (0.1%, 0.01% and 0.001%). Then, the slides were dipped in nanopure H2O to remove any remaining salt and dried by centrifugation (1500 rpm for 2 min using a swing bucket rotor). Slides were scanned using Bio-Rad VersArray ChipReader at a 3 μm resolution, and image data were extracted using Bio-Rad VersArray Analyzer software.
Binding Affinity Measurements Using a Magnetic Bead-based Fluorescence Assay
We tested the binding affinity of individual aptamers and bidentate aptamer constructs for Ang2 using a fluorescence binding assay. FAM-modified aptamer constructs were synthesized by Biosearch Technologies with high-performance liquid chromatography (HPLC) purification. We incubated a range of concentrations of FAM-labeled DNAs with 2 × 10⁶ Ang2-coated magnetic beads for 1 h at room temperature with gentle rotation. To remove unbound DNA, each sample was then washed three times in Ang2 binding buffer using a magnetic particle concentrator. Bound DNAs were eluted from the beads by heating at 95 °C for 10 min. Released DNAs were quantified by fluorescence measurement using a Tecan microplate reader (excitation = 490 nm, emission = 520 nm). We calculated Kd by nonlinear fitting analysis.
Enzyme-Linked Oligonucleotide Assay (ELONA)
Individual aptamers were biotinylated at the 5′ end and purified using HPLC. Streptavidin-coated microtiter plate wells were coated with biotinylated capture aptamers by adding 50 μL of DNA solution in PBS (20 μg/mL of Ang2 aptamers) and incubating at 4 °C overnight. After incubation, we washed the plate two times with 150 μL of PBS buffer with 0.1% Tween-20 (PBST buffer) and then blocked each well with 100 μL PBST plus 1% BSA for 1 h as described in ref (18). We then washed the plate with 150 μL of PBST three times, and incubated with 50 μL of protein solution in PBST (10 μg/mL of Ang2) for 1h. After washing three times with 150 μL of PBST, we added 50 μL of biotinylated detection aptamer (1 μg/mL of Ang2 aptamers) dissolved in PBST and incubated for 1 h.
For binding experiments in undiluted serum, after coating microtiter plate wells with biotinylated capture aptamers as described above, we added undiluted fetal bovine serum (FBS) containing various concentrations (0–200 nM) of Ang2. After washing, we added 50 μL of biotinylated detection aptamer (1 μg/mL of Ang2 aptamers) in PBST and incubated for 1 h.
For Kd measurements, microtiter plate wells were coated with Ang2 by adding 50 μL of protein solution in PBS (100 nM of Ang2) and incubating at 4 °C overnight. After washing the plate twice with 150 μL of PBST, we blocked each well with 100 μL of 1% BSA in PBST for 1 h. We then washed the plate with 150 μL of PBST three times, and incubated with 50 μL of biotinylated bidentate aptamers in PBST at various concentrations (0, 0.02, 0.05, 0.1, 0.2, 0.5, 1, 2, 4 and 8 nM) for 1 h.
Next, we washed the plate three times with 150 μL of PBST and added streptavidin-conjugated horseradish peroxidase (HRP) dissolved in 100 μL of PBST at 1:500 dilution. After 30 min of incubation, we washed the plate four times and added the 2,2′-azino-bis(3-ethylbenzothiazoline-6-sulfonate) (ABTS) substrate. This substrate becomes oxidized by HRP to produce a blue-green color, which we measured with a Tecan microplate reader at 405 nm.
Results and Discussion
Discovery of Aptamer Pairs via AD-MAP
As shown in Figure 1A, AD-MAP involves three main process steps. First, we perform microfluidic selection against a target protein of interest and characterize the selected pool via HTS. We then synthesize an array consisting of the most highly enriched sequences from the HTS data and identify the highest-affinity aptamer within the array. Finally, we form an aptamer–protein complex to block the primary binding site on the target protein with the highest-affinity aptamer found in step 2, and then screen the remainder of the array to identify aptamers that can recognize secondary epitopes and thus form a binding pair. As a proof of concept, we performed this screening with Ang2 as the target protein, building on our previously published work in aptamer generation from ref (24).
Briefly, we performed four rounds of microfluidic selection with Ang2, and performed HTS to obtain ∼3 × 10⁷ candidate aptamer sequences (see the Materials and Methods section). Microfluidic selection enables us to reproducibly control the washing stringency during the selection.19,25 This is important because sufficient aptamer diversity must be maintained in the final pool in order to prevent the loss of aptamers capable of binding to alternate sites on the target protein as a result of “hot spot” selection bias. We then chose the 235 most enriched sequences from the HTS data based on copy number, and synthesized these on an Agilent custom DNA aptamer array. Each aptamer feature on the array was synthesized with a 20 nt linker alongside various controls (array features are described in Table S1, Supporting Information). We used a relatively small number of sequences for this proof-of-concept experiment, but it is critical to note that far larger aptamer arrays, with hundreds of thousands of aptamer candidates, can be readily fabricated on a single array using the same approach.26 We fluorescently labeled Ang2 and measured the relative binding affinity of all of the aptamer candidates in parallel, which enabled us to identify the aptamer with the highest binding affinity. This aptamer, which we have termed Ang2-binding aptamer 1 (ABA1), exhibited a Kd of 20.5 ± 7.33 nM (Figure S1, Supporting Information).
We then used ABA1 to screen for aptamers that can form binding pairs using the aptamer array. To do so, we first used an aptamer array to establish baseline fluorescence intensity (F0) for each aptamer feature by challenging the array with fluorescently labeled Ang2 (Figure 1B, left). Next, we incubated fluorescently labeled Ang2 with an excess of ABA1 in solution to form an aptamer–protein complex. We then challenged another aptamer array with the same design with this preformed Ang2–ABA1 complex and obtained the fluorescence intensity (F) from each aptamer candidate on the array (Figure 1B, right). Using the data from these two arrays, we determined the relative difference in fluorescence intensity (ΔF = F – F0) for each aptamer candidate. We reasoned that if an aptamer array feature binds to the same site on Ang2 as ABA1, then ΔF would be negative; F would be smaller than F0 because the highest-affinity ABA1 aptamer would outcompete the candidate aptamer for that particular epitope, resulting in decreased F for that array feature (Figure 1B, red aptamer). On the other hand, we anticipated that ΔF would be non-negative if the candidate aptamer recognizes a distinct epitope and can therefore bind the preformed ABA1–Ang2 complex (Figure 1B, green aptamer).
After obtaining F and F0 for all of the aptamers on the array, we found 17 aptamers that exhibited a non-negative ΔF out of our 235 candidates; the remainder yielded a negative ΔF, and therefore bound to the same site as ABA1. Of these 17 candidates, we focused our investigations on three aptamers (ABA65, ABA92 and ABA109) that exhibited positive ΔF, with F values at least 3-fold greater than F0 (Figure 2A, all sequences are provided in Table S2, Supporting Information). We reasoned that the positive ΔF could be a result of positive allostery resulting in enhanced binding, as previously reported in the literature.27,28 We verified the affinity of these three aptamers for Ang2 by measuring their Kd values in solution using a bead-based fluorescence assay (see the Materials and Methods section). The Kd values ranged from 37.6 to 57.0 nM (Figure 2B). We note that the Kd values are ∼2–3-fold higher (i.e., lower affinity) than ABA1 as measured by the same method. This is consistent with our initial determination that ABA1 exhibits the highest affinity of the 235 candidates on the array. Although ABA92 and ABA109 were highly similar in their sequences, we characterized them separately, because even single-nucleotide differences have been shown to affect aptamer affinity and specificity.26
Figure 2.
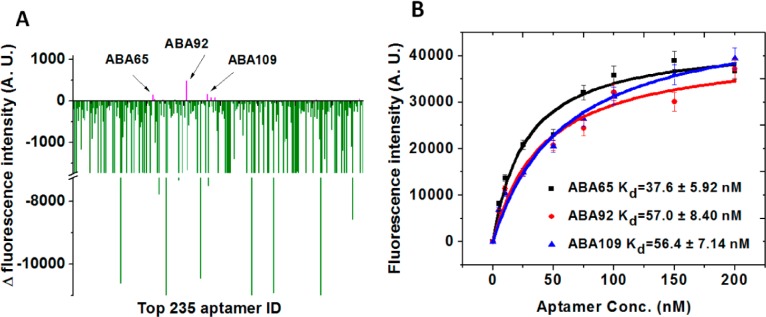
Identification of three aptamers that form binding pairs with ABA1. (A) We used our aptamer array to identify aptamers that can bind Ang2 in complex with ABA1. Negative ΔF (green) indicates an aptamer feature on the array that binds the same site on Ang2 as ABA1, while non-negative ΔF (magenta) indicates aptamer features that bind a different site on Ang2 than ABA1. (B) We identified three candidate aptamers (ABA65, ABA92 and ABA109) that potentially form binding pairs with ABA1, and measured their Kds using a bead-based fluorescence assay. As expected, their affinities were moderately lower than that of ABA1. Fluorescence intensities are the average of triplicate measurements.
Binding Performance of Aptamer Pairs
We performed multiple experiments to confirm that the three aptamers indeed form binding pairs with ABA1. First, we performed enzyme-linked oligonucleotide assays (ELONA),18,29 wherein we immobilized ABA65, ABA92 and ABA109 as “capture aptamers” on the surface of microtiter plate wells (see the Materials and Methods section). After incubating with unlabeled Ang2 and washing, we added biotinylated ABA1 as the “detection aptamer” along with streptavidin-conjugated horseradish peroxidase (HRP). The overall background signal was very low, even though both capture and detection aptamers were labeled with biotin (Figure S2, Supporting Information). To quantify binding of the detection aptamer to Ang2, we measured absorption in each well after treatment with the HRP substrate 2,2′-azino-bis(3-ethylbenzothiazoline-6-sulfonate) (ABTS). We observed high absorbance signals from wells coated with each of the three capture aptamers (Figure 3A, ABA1). As controls, we performed ELONA with these three aptamers using the same aptamer for detection as was used for capture (Figure 3A, capture aptamer); in each case, this yielded a significantly lower binding signal, because the aptamers compete for the same binding site. As further controls, we used scrambled detection aptamer sequences (Figure 3A, scrambled aptamer; see Table S2 (Supporting Information) for sequences) or no detection aptamer (Figure 3A, no aptamer), and observed minimal binding in both scenarios, providing further evidence that these three aptamers are capable of binding Ang2 in conjunction with ABA1.
Figure 3.
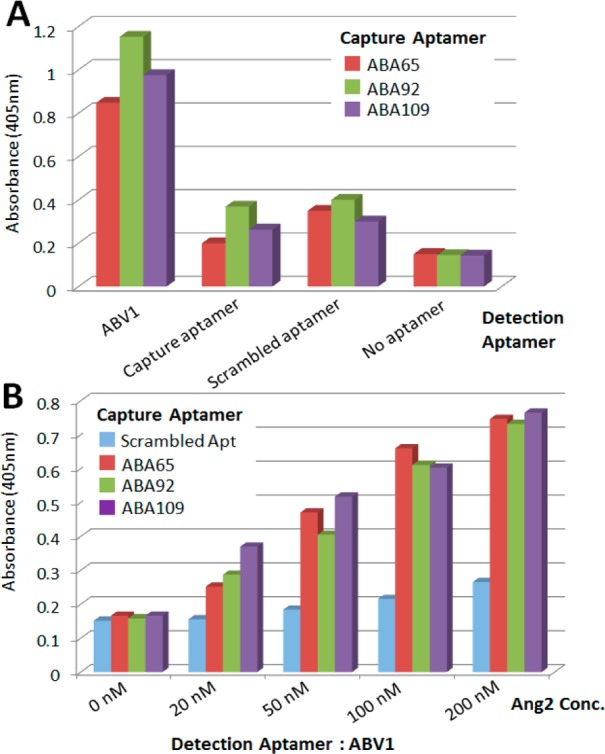
Verification of aptamer pair binding. (A) Enzyme-linked oligonucleotide assay (ELONA) using ABA65, ABA92 or ABA109 as capture aptamers. As the detection aptamer, we used biotinylated ABA1; for controls, we used the same aptamer used for capture, a scrambled aptamer sequence or no detection aptamer. The three aptamers form pairs with ABA1 as shown by the high absorbance signals. (B) ELONA experiments show that these three aptamer pairs can detect unlabeled Ang2 in undiluted fetal bovine serum. In comparison, we observed only a modest signal when we used a scrambled aptamer sequence as the capture aptamer. All error bars were obtained from triplicate measurements.
To investigate whether these aptamer pairs can function as effective reagents in complex biological samples, we subsequently performed ELONA experiments in undiluted fetal bovine serum (FBS). We used undiluted FBS because it is a challenging sample matrix with extremely high protein content (60–80 mg/mL). Specifically, we coated microtiter plate wells with each of the three capture aptamers, and then added undiluted FBS containing various concentrations (0–200 nM) of unlabeled Ang2. After washing, we added ABA1 as the detection aptamer as described above. Despite the high concentration of nontarget proteins present in the serum, all three aptamers could form pairs with ABA1 and readily detected Ang2 at concentrations as low as 20 nM (Figure 3B).
Synthesis of Bidentate Aptamer Reagent
Having demonstrated that these aptamers form binding pairs, we subsequently physically linked the aptamers with ABA1 to create various bidentate aptamer reagents, in an effort to generate molecules with significantly enhanced affinities.6 We focused our analysis on bidentate reagents synthesized by linking ABA1 with ABA65 through a flexible linker, because ABA65 exhibited the highest affinity of the three candidates (Figure 2B). We connected the two aptamers using poly-T linkers of different lengths, because these linkers typically do not interfere with the folding of the individual aptamers.7 Since we did not have a priori knowledge about the distance between the two aptamer binding sites on Ang2, we synthesized four different constructs including those with linkers that could span the end-to-end distance of the protein as well as shorter lengths (5, 10, 16 or 25T). We then measured the binding affinities of each construct using a bead-based fluorescence assay (Figure S3, Supporting Information). The construct consisting of ABA65 linked to ABA1 via a 25T linker showed the greatest increase in binding affinity compared to its individual components (Figure 4A). This ABA1–ABA65 construct exhibited a Kd of 97 pM, an affinity ∼210-fold higher than that of ABA1 and ∼390-fold higher than that of ABA65. As independent verification, we again employed ELONA to assess the affinities of our bidentate aptamer reagents. Briefly, we coated microtiter plate wells with unlabeled Ang2 and incubated each well with a different concentration of biotinylated ABA1–ABA65. After washing, we added streptavidin-conjugated HRP for detection. The resulting Kd value for ABA1–ABA65 was 62 pM, (Figure S4, Supporting Information), which is comparable with the measurement obtained via our fluorescence assay.
Figure 4.
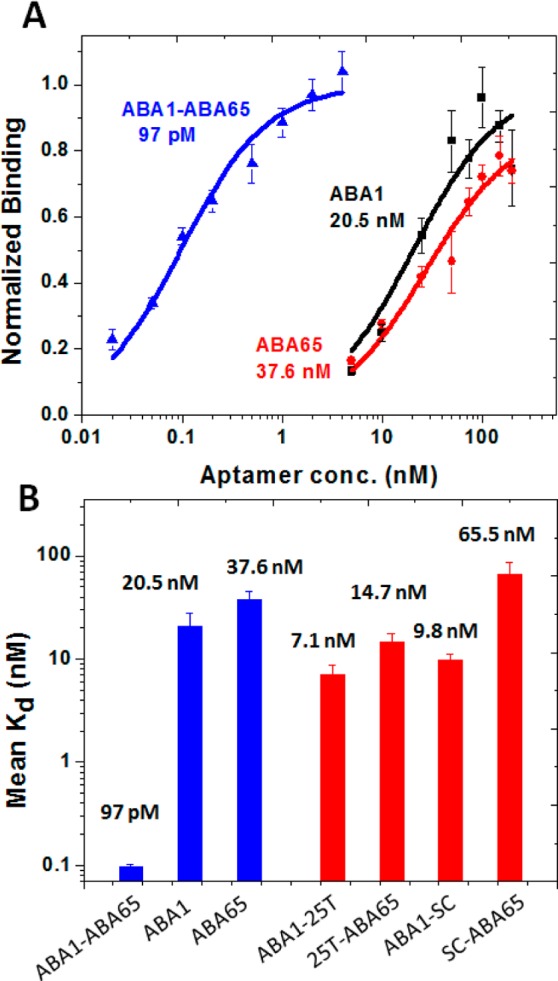
Bidentate aptamer reagent exhibits greatly enhanced binding affinity over its component aptamers. (A) Fluorescence binding assays show that the bidentate aptamer reagent formed by linking ABA1 with ABA65 via a 25T flexible linker exhibits greatly enhanced affinity. ABA1–ABA65 showed a Kd of 97 pM, a ∼210-fold and ∼390-fold improvement in affinity over those for ABA1 and ABA65, respectively. (B) Fluorescence binding assays with various controls showed that both ABA1 and ABA65 make critical contributions to this enhanced affinity. Aptamers fused only to poly-T linkers without their partner aptamer (ABA1–25T, 25T–ABA65) showed much poorer affinities. Likewise, replacing either aptamer with a scrambled sequence (SC) (ABA1–SC and SC–ABA65) yielded at least ∼100-fold reduction in affinity relative to ABA1–ABA65. All error bars were obtained from triplicate measurements.
Finally, to elucidate the mechanism behind this enhanced affinity, we performed a series of control experiments with modified versions of ABA1–ABA65, and found that both aptamers make critical contributions in binding to Ang2 (Figure 4B). First, we synthesized truncated variants of ABA1–ABA65 consisting of each individual aptamer joined only to the 25T linker without its partner aptamer (all sequences shown in Table S2, Supporting Information). Both constructs showed only slight improvements in binding affinity compared to either individual aptamer (Figure 4B). In addition, the 25T linker alone showed minimal affinity for Ang2 (Figure S5, Supporting Information). These findings exclude the possibility that the linker interacts with Ang2 directly, or contributes meaningfully to the observed affinity enhancement. Next, we synthesized constructs in which either aptamer component was substituted with a scrambled sequence (SC). SC alone exhibited negligible binding affinity for Ang2 (Figure S5, Supporting Information). Accordingly, constructs in which either ABA1 (ABA1–SC) or ABA65 (SC–ABA65) was linked with a scrambled sequence showed minimal enhancement in affinity (Figure 4B). Given that all of these controls showed at least 100-fold poorer affinity than ABA1–ABA65, we conclude that both aptamers play critical roles in binding to Ang2.
Conclusion
In this work, we describe AD-MAP, an array-based method for the systematic discovery of aptamer pairs that are capable of simultaneously binding to two different sites on a target protein. We used AD-MAP to discover new DNA aptamer pairs that bind to human Ang2 and demonstrated that these reagents can bind to Ang2 even in highly complex samples such as undiluted serum. Importantly, by linking the aptamer pairs through a flexible linker, we were able to synthesize bidentate aptamer reagents with exceptional affinities, with Kd values as low as 97 pM. This represents a more than 200-fold improvement over either of the individual component aptamers. Through a series of controls, we showed that this dramatic enhancement in affinity is indeed the result of bidentate binding by the two component aptamers.
The key advantage of our system is that screening for pair binding is performed in parallel for all aptamers on the array simultaneously. As such, the time and labor required for measurement remain relatively constant, regardless of the number of aptamer candidates being interrogated. Although we used a relatively small number of sequences for this pilot experiment (235 aptamers), the same experimental strategy can be used to screen much larger aptamer arrays. Given that custom DNA arrays with more than 1 million features are already commercially available at reasonable costs, we believe our AD-MAP system is highly scalable and could even be potentially expanded to discover aptamer pairs for multiple target proteins simultaneously.
We have identified a number of opportunities to further improve the AD-MAP system. First, we were constrained by the maximum length of aptamers that could be synthesized on this particular array format (60 nucleotides) and thus we could not synthesize the full-length, 80 nucleotide aptamers identified in our selection. We therefore eliminated the PCR primer-binding sites and synthesized only the core sequences on the array. These primer-binding regions are known to play an important role in aptamer folding and can thus affect affinity.30 We therefore expect that aptamer arrays that can accommodate longer sequences would yield aptamer pairs with even higher affinities. Furthermore, in this proof-of-principle study, we only explored a small set of relatively simple flexible poly(T) linkers to join the two aptamers. By optimizing the linker design, we believe it will be possible to obtain aptamers with even higher affinities, as shown by the work of Ahmad et al.31
In conclusion, we believe that the highly parallel screening enabled by AD-MAP holds the potential to greatly accelerate the discovery of high-performance aptamer pairs for a wide range of target proteins. The resulting expanded access to such reagents should in turn enable the development of more sensitive molecular diagnostic assays and more effective targeted drug delivery.
Acknowledgments
We are grateful for the financial support from The Garland Initiative, California Institute of Regenerative Medicine, National Institutes of Health (U01 HL099773, U54 DK093467) and the Institute of Collaborative Biotechnologies through the Army Research Office (W911NF-09-0001, W911NF-10-2-0114).
Supporting Information Available
Equilibrium binding curve for ABA1; control experiments for aptamer pair binding; contribution of linker length to binding affinity for bidentate aptamer reagents; binding affinity measurement for ABA1-ABA65 using ELONA; binding affinity measurements for control sequences; table of aptamer array features; table of screened aptamers, bivalent aptamer reagent constructs and control sequences. This material is available free of charge via the Internet at http://pubs.acs.org.
The authors declare no competing financial interest.
Funding Statement
National Institutes of Health, United States
Supplementary Material
References
- Collins B. E.; Paulson J. C. Curr. Opin. Chem. Biol. 2004, 8, 617–625. [DOI] [PubMed] [Google Scholar]
- Liu F.; Walters K. J. Trends Biochem. Sci. 2010, 35, 352–360. [DOI] [PMC free article] [PubMed] [Google Scholar]
- Lequin R. M. Clin. Chem. 2005, 51, 2415–2418. [DOI] [PubMed] [Google Scholar]
- MacBeath G. Nat. Genet. 2002, 32Suppl526–532. [DOI] [PubMed] [Google Scholar]
- Schweitzer B.; Roberts S.; Grimwade B.; Shao W.; Wang M.; Fu Q.; Shu Q.; Laroche I.; Zhou Z.; Tchernev V. T.; Christiansen J.; Velleca M.; Kingsmore S. F. Nat. Biotechnol. 2002, 20, 359–365. [DOI] [PMC free article] [PubMed] [Google Scholar]
- Neri D.; Momo M.; Prospero T.; Winter G. J. Mol. Biol. 1995, 246, 367–373. [DOI] [PubMed] [Google Scholar]
- Hasegawa H.; Taira K.; Sode K.; Ikebukuro K. Sensors 2008, 8, 1090–1098. [DOI] [PMC free article] [PubMed] [Google Scholar]
- Müller J.; Wulffen B.; Pötzsch B.; Mayer G. ChemBioChem 2007, 8, 2223–2226. [DOI] [PubMed] [Google Scholar]
- Lao Y.-H.; Peck K.; Chen L.-C. Anal. Chem. 2009, 81, 1747–1754. [DOI] [PubMed] [Google Scholar]
- Tuerk C.; Gold L. Science 1990, 249, 505–510. [DOI] [PubMed] [Google Scholar]
- Ellington A. D.; Szostak J. W. Nature 1990, 346, 818–822. [DOI] [PubMed] [Google Scholar]
- Fitter S.; James R. J. Biol. Chem. 2005, 280, 34193–34201. [DOI] [PubMed] [Google Scholar]
- Bock L. C.; Griffin L. C.; Latham J. A.; Vermaas E. H.; Toole J. J. Nature 1992, 355, 564–566. [DOI] [PubMed] [Google Scholar]
- Tasset D. M.; Kubik M. F.; Steiner W. J. Mol. Biol. 1997, 272, 688–698. [DOI] [PubMed] [Google Scholar]
- Takemura K.; Wang P.; Vorberg I.; Surewicz W.; Priola S. A.; Kanthasamy A.; Pottathil R.; Chen S. G.; Sreevatsan S. Exp. Biol. Med. (London, U. K.) 2006, 231, 204–214. [DOI] [PubMed] [Google Scholar]
- Bibby D. F.; Gill A. C.; Kirby L.; Farquhar C. F.; Bruce M. E.; Garson J. A. J. Virol. Methods 2008, 151, 107–115. [DOI] [PubMed] [Google Scholar]
- Shi H.; Fan X.; Sevilimedu A.; Lis J. T. Proc. Natl. Acad. Sci. U. S. A. 2007, 104, 3742–3746. [DOI] [PMC free article] [PubMed] [Google Scholar]
- Gong Q.; Wang J.; Ahmad K. M.; Csordas A. T.; Zhou J.; Nie J.; Stewart R.; Thomson J. A.; Rossi J. J.; Soh H. T. Anal. Chem. 2012, 84, 5365–5371. [DOI] [PMC free article] [PubMed] [Google Scholar]
- Lou X.; Qian J.; Xiao Y.; Viel L.; Gerdon A. E.; Lagally E. T.; Atzberger P.; Tarasow T. M.; Heeger A. J.; Soh H. T. Proc. Natl. Acad. Sci. U. S. A. 2009, 106, 2989–2994. [DOI] [PMC free article] [PubMed] [Google Scholar]
- Cho M.; Xiao Y.; Nie J.; Stewart R.; Csordas A. T.; Oh S. S.; Thomson J. A.; Soh H. T. Proc. Natl. Acad. Sci. U. S. A. 2010, 107, 15373–15378. [DOI] [PMC free article] [PubMed] [Google Scholar]
- Mardis E. R. Annu. Rev. Genomics Hum. Genet. 2008, 9, 387–402. [DOI] [PubMed] [Google Scholar]
- Tsigkos S.; Koutsilieris M.; Papapetropoulos A. Expert Opin. Invest. Drugs 2003, 12, 933–941. [DOI] [PubMed] [Google Scholar]
- Hu B.; Cheng S.-Y. Curr. Oncol. Rep. 2009, 11, 111–116. [DOI] [PMC free article] [PubMed] [Google Scholar]
- Cho M.; Oh S. S.; Nie J.; Stewart R.; Eisenstein M.; Chambers J.; Marth J. D.; Walker F.; Thomson J. A.; Soh H. T. Proc. Natl. Acad. Sci. U. S. A. 2013, 110, 18460–18465. [DOI] [PMC free article] [PubMed] [Google Scholar]
- Liu Y.; Adams J. D.; Turner K.; Cochran F. V.; Gambhir S. S.; Soh H. T. Lab Chip 2009, 9, 1033–1036. [DOI] [PubMed] [Google Scholar]
- Katilius E.; Flores C.; Woodbury N. M. Nucleic Acids Res. 2007, 35, 7626–7635. [DOI] [PMC free article] [PubMed] [Google Scholar]
- Nimjee S. M.; Oney S.; Volovyk Z.; Bompiani K. M.; Long S. B.; Hoffman M.; Sullenger B. A. RNA 2009, 15, 2105–2111. [DOI] [PMC free article] [PubMed] [Google Scholar]
- Zhou G.; Huang X.; Qu Y. Biochem. Eng. J. 2010, 52, 117–122. [Google Scholar]
- Drolet D. W.; Moon-McDermott L.; Romig T. S. Nat. Biotechnol. 1996, 14, 1021–1025. [DOI] [PubMed] [Google Scholar]
- Legiewicz M.; Lozupone C.; Knight R.; Yarus M. RNA 2005, 11, 1701–1709. [DOI] [PMC free article] [PubMed] [Google Scholar]
- Ahmad K. M.; Xiao Y.; Soh H. T. Nucleic Acids Res. 2012, 40, 11777–11783. [DOI] [PMC free article] [PubMed] [Google Scholar]
Associated Data
This section collects any data citations, data availability statements, or supplementary materials included in this article.