

Abstract
Epithelial-mesenchymal transition (EMT) is a reversible and dynamic process hypothesized to be co-opted by carcinoma during invasion and metastasis. Yet, there is still no quantitative measure to assess the interplay between EMT and cancer progression. Here, we derived a method for universal EMT scoring from cancer-specific transcriptomic EMT signatures of ovarian, breast, bladder, lung, colorectal and gastric cancers. We show that EMT scoring exhibits good correlation with previously published, cancer-specific EMT signatures. This universal and quantitative EMT scoring was used to establish an EMT spectrum across various cancers, with good correlation noted between cell lines and tumours. We show correlations between EMT and poorer disease-free survival in ovarian and colorectal, but not breast, carcinomas, despite previous notions. Importantly, we found distinct responses between epithelial- and mesenchymal-like ovarian cancers to therapeutic regimes administered with or without paclitaxelin vivo and demonstrated that mesenchymal-like tumours do not always show resistance to chemotherapy. EMT scoring is thus a promising, versatile tool for the objective and systematic investigation of EMT roles and dynamics in cancer progression, treatment response and survival.
Keywords: drug response, epithelial-mesenchymal transition, gene expression signature, microarray, prognosis
Introduction
Accumulating evidence indicates that epithelial-mesenchymal transition (EMT) is of paramount importance in a plethora of cancer-related events, including cancer invasion, metastasis, resistance to cell death, refractory responses to chemotherapy and immunotherapy, immunosuppression and the acquisition of stem cell-like properties (Leeet al, 2006; Onderet al, 2008; Thieryet al, 2009; Jordanet al, 2011; Huanget al, 2012; Lee & Nelson, 2012; Frischet al, 2013; Tam & Weinberg, 2013). In EMT, polarized epithelial (Epi) cells progressively alter their junctional and polarity complexes to acquire morphological and biochemical characteristics typical of mesenchymal (Mes) cells (Thieryet al, 2009). EMT was first described as a mechanism driving critical morphogenetic steps (for example, gastrulation) in the development of most metazoans (Jordanet al, 2011; Lim & Thiery, 2012) and, more recently, in wound-healing and carcinoma progression (Thieryet al, 2009). However, despite its potential involvement in invasion and metastasis, the role of EMT in human tumours is still inadequately documented (Wanget al, 2004; Chaffer & Weinberg, 2011; Konget al, 2011). This is so even after the identification of a transitioned or ‘EMTed’ phenotype—either partially or completely—in circulating tumour cells (CTCs) (Jordanet al, 2011; Valastyan & Weinberg, 2011; Yuet al, 2013). Initially believed to be a binary process, EMT is now well documented to be a dynamic course, with the existence of intermediate states (Jordanet al, 2011; Konget al, 2011; Huanget al, 2013; Tam & Weinberg, 2013). Cells stuck or transitioning in these intermediate or ‘metastable’ states of EMT (Jordanet al, 2011)—often called ‘fused cells’ (Konget al, 2011)—have attributes of both Epi and Mes phenotypes and exhibit stem cell-like properties. They also display high plasticity between the Epi and Mes states, which is critical for metastasis, and hence, it is becoming increasingly clear that these intermediate phenotypes must also be quantitatively assessed and considered in the design of new therapeutic strategies (Chaffer & Weinberg, 2011; Valastyan & Weinberg, 2011).
Numerous signalling pathways initiate and execute the biochemical programs that lead to EMT in a context-dependent manner, including those associated with surface tyrosine or serine/threonine kinases, WNT signalling, cytokine receptors and downstream transcriptional regulators such asSNAIL,ZEB andTWIST (Thieryet al, 2009; Jordanet al, 2011; Lee & Nelson, 2012; Frischet al, 2013; Tam & Weinberg, 2013). These diverse mechanisms nonetheless converge and generate similar EMTed phenotypic endpoints (Thieryet al, 2009; Tam & Weinberg, 2013), and this convergence likely reflects a series of molecular features common to all cancers undergoing EMT (Jordanet al, 2011). Thus, we sought to establish a generic EMT signature to capture a set of universal molecular features exhibited by a broad spectrum of cancers during EMT. Here, we developed an approach to quantitatively estimate the EMT status amongst clinical samples and cell lines using transcriptomics. We first established bladder, breast, colorectal, gastric, lung and ovarian cancer-specific EMT signatures and, from these, derived a generic EMT signature. We posit that this generic EMT signature exemplifies the common molecular features of EMT in tumours and cell lines of different origins and believe that this signature will be important in the future objective and systematic study of the role EMT and its dynamic nature in cancer progression, treatment response and survival.
Results
Cancer-specific EMT signature
We first generated EMT signatures specific to bladder, breast, colorectal, gastric, lung and ovarian cancer according to the six-step scheme depicted in Fig1A (see Materials and Methods). First, we curated published EMT signatures (Subramanianet al, 2005; Leeet al, 2006; Carreteroet al, 2010) and applied single-sample gene set enrichment analysis (ssGSEA) (Verhaaket al, 2013) to provide a gross assessment of the EMT phenotype of each cell line or tumour. An EMT signature that correlated best with known EMT transcripts was next established, and the most Epi and most Mes cell lines or tumours were chosen to build the EMT signature using BinReg (Gatzaet al, 2010). This BinReg EMT signature was then used to predict the EMT phenotype in cell lines and tumours. The most Epi and most Mes cell lines or tumours were again selected to generate the final EMT signature. Finally, we computed an EMT score of a given sample using a two-sample Kolmogorov–Smirnov test (2KS). Samples with a positive (high) EMT score were more Mes, whereas those with a negative (low) score were more Epi. We developed a cancer-specific EMT signature for tumours and cell lines separately, acknowledging the limitations that cell lines mimic only certain aspects of cancer biology, do not propagate in a stromal microenvironment, and often accumulate additional mutations to survive in artificial culture systems (Borrell, 2010; Gilletet al, 2013).
Figure 1. Derivation and application of cancer-specific epithelial-mesenchymal transition (EMT) signature.

- A six-step scheme illustrating the generation of a cancer-specific EMT signature. Note that tumours and cell lines have their own cancer-specific EMT signatures. (Top right panel) Red and green bars on sample enrichment score (ES) bar chart indicate, respectively, mesenchymal-like (Mes) and epithelial-like (Epi) samples selected for building the BinReg EMT signature. (Middle right panel) Heatmap of the EMT signature from Significance Analysis of Microarray (SAM)/Receiver Operating Characteristics (ROC) analysis. The colour bar shows the EMT phenotype probability of cell line or tumour samples, sorted from most Epi to most Mes. Red and green bars indicate Mes and Epi samples selected for SAM/ROC analysis. (Bottom right panel) Plots of empirical cumulative distribution function of Mes (red) and Epi (green) gene sets.
- Dot plot of EMT score (mean ± SEM) for breast cancer cell lines (n = 34) with spindle- and non-spindle-like morphologies. Mann–WhitneyU-testP-value is shown.
- Immunohistochemistry staining heatmap of Oestrogen Receptor (ER), Progesterone Receptor (PR), and Epi (CDH1, ERBB2, CK19) as well as Mes (CK5, VIM, CDH2) markers (black = low, red = high, white = no data). Breast cancer cell lines (n = 39) are aligned from the most Epi to most Mes based on the EMT score, as shown by the bar chart. Dot plot is the-log10P-value of two-sample Kolmogorov–Smirnov test. Arbitrary threshold ofP < 0.001 was used to define Epi, intermediate and Mes cell lines. Breast cancer cell line microarrays and subtype are from GSE16795 (Hollestelleet al, 2010). Subtype colour code: blue, Luminal; maroon, Basal.
To first ensure the validity of these cancer-specific EMT signatures, we verified our breast cancer-specific EMT signature on the GSE16795 breast cancer cell line data set (Hollestelleet al, 2010). EMT scores for breast cancer cell lines with a spindle-like morphology were significantly higher than those for cell lines without a spindle-like morphology (Fig1B;P = 1.4E-6); this is consistent with the reported spindle-shaped morphology of Mes cells (Lee & Nelson, 2012). In addition, cell lines with a high EMT score displayed a significantly higher positive staining for VIM and CDH2, known markers of an EMTed phenotype (Thieryet al, 2009) (P = 2.1E-5 andP = 9.1E-6, respectively; Fig1C). Conversely, immunohistochemistry for known Epi markers, CDH1 and CK19, was significantly enriched in Luminal cell lines with a low EMT score (P = 0.035 andP = 0.005, respectively). Cell lines with an intermediate EMT score were of a mixed Basal–Luminal phenotype, with enriched expression of CK5, a myoepithelial or basal marker (P = 0.0002). Basal cell lines had an intermediate-to-high EMT score, whereas Luminal cell lines had a lower EMT score (P = 1.6E-7; Fig1C). The bladder cancer-specific EMT signature was validated (Supplementary Text, Supplementary Fig S1), whereas the ovarian cancer-specific EMT signature was already assessed in a previous study (Miowet al, 2014). These results corroborate the cancer-specific EMT signature scoring, which forms the basis of the generic EMT signature.
Generic EMT signature
To quantitatively score any cancer for its EMT status, we derived a generic EMT signature for tumours and cell lines based on the weighted sum of the significance analysis of microarray (SAM) and receiver operating characteristic (ROC) results from each of the cancer-specific EMT signatures (Fig2A; see Material and Methods). Genes that were present in all six of the cancer-specific EMT signatures with a highz-transformed weighted sum (P < 0.001) were included in the generic EMT signature (Fig2A). As illustrated by the interconnecting links in the heatmap, we noted a high overlap of genes amongst the cancer-specific EMT signatures. A total of 315 genes (Epi: 145, Mes: 170) and 218 genes (Epi: 170, Mes: 48) were selected for tumour and cell line generic EMT signatures, respectively (Supplementary Table S1A and B). Amongst these, 88 Epi and 30 Mes genes were up-regulated in both signatures (Supplementary Table S1A and B). Known EMT transcripts—CDH1,EPCAM,GRHL2,KRT19,RAB25,CDH2,VIM,ZEB1,ZEB2,SNAI2 andTWIST1 (Thieryet al, 2009; Cieplyet al, 2012; Huanget al, 2012; Zhanget al, 2013)—were consistently selected in the generic EMT signature; this successful identification of genes relevant to EMT lends support to the validity of our strategy. Furthermore, the expression of miRNAs reported to suppress EMT, such as those from the miR-200 (miR-200a, miR-200b, miR-200c, miR-141, miR-429) and miR-34 (miR-34a, miR-34b, miR-34c) families (Zhang & Ma, 2012; Haoet al, 2014), was significantly and consistently anti-correlated with the generic EMT score (Supplementary Text, Supplementary Fig S2). This suggests the potential to incorporate miRNAs in the generic EMT signature.
Figure 2. Derivation and application of generic epithelial-mesenchymal transition (EMT) signature.

- Circos plot illustrating the generic EMT signature: the overlap of ovarian (blue), breast (purple), lung (green), colorectal (yellow), bladder (red) and gastric (orange) cancer-specific EMT signatures is shown. Links indicate overlapping genes (red = mesenchymal, green = epithelial). Heatmap on the inner ring indicates weight computed based on Significance Analysis of Microarray (SAM) fold-change, false discovery rate, Receiver Operating Characteristics (ROC) and number of samples of a gene in each cancer-specific EMT signature (red = high, blue = low weight). On the outermost ring, genes are represented by ticks and aligned from the highest SAM fold-change to the lowest for each cancer type. Selected genes are labelled.
- EMT score (mean ± SEM;y-axis) of breast cancer molecular subtypes as predicted using ssGSEA and signature from Pratet al (2010) in non-laser-capture micro-dissected (non-LCM) cohort (n = 3,992; upper panel) and LCM cohort (n = 417; lower panel). The Mann–WhitneyU-testP-value of binary comparison for each subtype is given. Colour code: maroon, Basal; yellow, Claudin-low; light blue, Luminal-A; dark blue, Luminal-B; orange, ERBB2+; green, Normal-like. N.A, not applicable. Note that noP-value is available for Claudin-low and Normal-like subtypes in lower panel becausen < 3.
Functional annotation analyses on gene ontology and KEGG pathway (Huang daet al, 2009) for all 315 genes in the generic EMT signature revealed a significant enrichment in EMT-related biological processes, for example, cell adhesion (FDR = 1.2E-9) and cell migration (FDR = 6.0E-4; Supplementary Table S2). The generic EMT signature was then compared with published cancer-specific EMT signatures (Supplementary Table S1C). By comparing the enrichment score from ssGSEA, the generic EMT signature was found to strongly correlate with the six cancer-specific EMT signatures that were used for its derivation (Rho ∈ [+0.73, +0.97] and with the majority of published cancer-specific EMT signatures (Rho ∈ [+0.32, +0.84]; Supplementary Table S1C) for each respective cancer type despite the small overlap in the signature genes. Surprisingly, EMT scores computed from the generic EMT signatures of tumour and cell lines were strongly correlated (Rho > +0.89), even though the cell line generic EMT signature does not include stromal components. This indicates that stroma-related genes have a limited influence on the generic EMT score of tumours. We noted, however, that the generic EMT signature had a marginal or no correlation with four of the published EMT signatures, probably due to the small number of genes in these signatures, or because the signature was derived from non-malignant cells. Overall, these results demonstrate the consistency of the generic EMT signature with previously reported EMT-related genes and cancer-specific EMT signatures. Furthermore, the generic EMT signature is both versatile for the quantitation of EMT in all cancer types and not strikingly sensitive to the presence of stroma, two important advantages for this system of classification.
To assess the utility of this generic EMT signature, we computed the EMT scores for laser-capture-micro-dissected (LCM) and non-LCM breast carcinoma (Fig2B). Consistent with previous reports (Blicket al, 2008; Taubeet al, 2010), we observed that Luminal-A, Luminal-B and ERBB2+ breast cancers were more Epi (P = 0.0496,P = 3.34E-79 andP = 2.48E-6, respectively), whereas Basal and Claudin-Low breast cancers were more Mes (P = 1.98E-40 andP = 2.47E-68, respectively) in both non-LCM and LCM cohorts. Of note, the high similarity between the EMT profiles of breast cancer subtypes in LCM and non-LCM cohorts indicates that EMT scoring is able to capture an overall EMT status of a sample, even in the presence of stroma. To further ensure the validity of the generic EMT signature, we computed the EMT scores for a panel ofin vitro functional studies across various cancers (Supplementary Fig S3, Supplementary Table S3). In each functional study, the generic EMT score accurately reflected the EMT phenotype regardless of the cancer type (Supplementary Fig S3). For example, consistently higher EMT scores were found for cell lines withCDH1 orNOTCH3 knockdown, cell lines treated with TGFβ, and cell lines constitutively expressing EMT inducers,TWIST1,SNAIL,GSC, as compared with control cell lines (Supplementary Fig S3;P < 0.05). Conversely, cell lines with over-expressedGRHL2—a transcription factor commonly under-expressed in EMTed cells (Cieplyet al, 2012)—displayed a lower EMT score, indicating a more Epi phenotype. Thus, the EMT score could routinely identify the Epi or Mes phenotype of a cell line under different interventions, which is in full agreement with previous EMT studies (Onderet al, 2008; Hellneret al, 2009; Maliziaet al, 2009; Yanagawaet al, 2009; Maupinet al, 2010; Taubeet al, 2010; Ohashiet al, 2011; Cieplyet al, 2012; D'Amatoet al, 2012; Caiet al, 2013; Deshiereet al, 2013), thus again validating our generic EMT scoring method.
Pancreatic cancer was not included in our original derivation of the EMT signature. As EMT has been implicated in pancreatic cancers, it is important that this generic EMT signature can also accurately estimate the EMT status in pancreatic cancers. We found that the generic EMT score correlates positively with the immunofluorescence staining of EMT markers such as ZEB1, VIM and metastatic ability in various pancreatic cancer cell lines (Supplementary Fig S4, Supplementary Text). The data thus validate the generic EMT signature in pancreatic cancers.
Finally, with the aim of developing a smaller, more cost-effective EMT signature, we explored the possibility of reducing the number of genes in our generic EMT signature (Supplementary Text, Supplementary Fig S5). We identified a 40–50% smaller generic EMT signature that has an overall correlation of 0.85–0.88 with the full generic EMT signature and has good concordance (75.08–95.8%) in estimating EMT status (Supplementary Text, Supplementary Tables S3 and S4A). However, the following analyses continue to use the full generic EMT signature.
Application of the generic EMT signature
A spectrum of EMT is found in multiple cancers
We next performed generic EMT scoring on multiple clinical samples and cell lines (Fig3, Supplementary Fig S6, Supplementary Table S4A–D). A wide range of EMT scores was observed in bladder, breast, gastric, lung, ovarian and prostate cancers. Surprisingly, haematopoietic and lymphoid malignancies, such as lymphoma, acute myeloid leukaemia and multiple myeloma, also displayed a spectrum of EMT scoring, albeit over a narrower range. Colorectal cancer was predominantly Epi (P < 1E-50), whereas renal carcinoma exhibited strong Mes features (P = 2.47E-53), perhaps reflecting that kidney epithelium derives from the condensation of mesodermal Mes cells. Interestingly, although hepatocytes originate from the primitive Epi endoderm, liver carcinoma displayed an extensive range in EMT score. Other tumours that were primarily Mes included germ cell tumours (P = 1.9E-22), malignant melanoma (P = 1.38E-42), sarcoma (P = 1.7E-34), and glioblastoma and neuroblastoma (P < 1E-50). A similar mean and dispersion of the EMT score was seen in cell lines (Fig3), with a wide spectrum noted for cell lines derived from bladder, breast, gastric, liver, lung and prostate carcinoma. Colorectal carcinoma cell lines were predominantly Epi (P = 2.61E-17), whereas renal carcinoma (P = 7.92E-5), malignant melanoma (P = 8.17E-9), sarcoma (P = 1.51E-7) and glioblastoma (P = 5.67E-19) cell lines were generally Mes, mimicking the observations in tumours. In concordance with clinical samples, germ cell tumour cell lines showed a tendency to be Mes (P = 0.58); the lack of significance was presumably because of the limited number of cell lines. Note that the tumours and cell lines in Fig3 were not paired. As a result, the composition of histology, grade, stage of tumours and cell lines are different and that leads to the difference in EMT score distribution, such as is the case in prostate cancer. These results show that each cancer type has a characteristic EMT spectrum.
Figure 3. Epithelial-mesenchymal transition (EMT) scores in different cancers types.
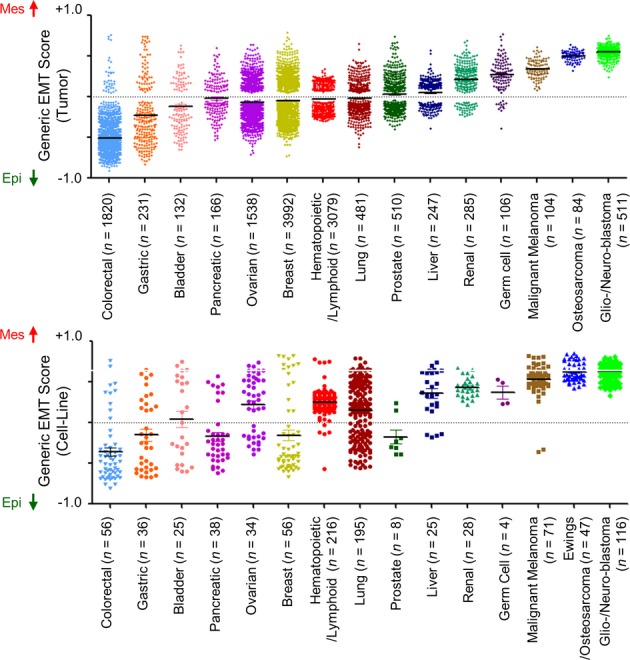
Scatter plot of EMT scores (mean ± SEM;y-axis) of various cancers in clinical samples (upper panel) and cell lines (lower panel) sorted by cancer type and mean EMT score. EMT score nearer to +1.0 is more mesenchymal-like (Mes), whereas EMT score nearer to −1.0 is more epithelial-like (Epi). EMT scores of overlapping cell lines in Cancer Cell Line Encyclopedia (CCLE) (Barretinaet al, 2012) and SANGER/COSMIC (Garnettet al, 2012) collections were averaged.
EMT status does not necessarily correlate with poorer survival
To investigate if an EMTed status universally correlates with poor survival, we performed Kaplan–Meier analyses by cohort and by cancer type comparing Epi and Mes tumours (Fig4). Intriguingly, a transitioned status did not universally correlate with overall survival (OS) or disease-free survival (DFS), as shown in the hazard ratio (HR) plots (Fig4). In order to include as many data as possible, we adopted a broad definition of DFS which encompasses progression-free, (local) recurrence-free, and distant recurrence/metastasis-free survival. In general, patients with Epi ovarian cancer (cohort mean HR [μHR] = 0.68,P = 0.018), gastric cancer, (μHR = 0.7013), pancreatic cancer (μHR = 0.6006) and glioblastoma (μHR = 0.81) showed better OS. There was no correlation between EMT status and OS for patients with acute myeloid leukaemia, colorectal or lung cancer. Surprisingly, patients with Mes breast cancer (μHR = 1.48;P = 0.006) and malignant melanoma (μHR = 1.48) had better OS (Fig4A), which is in stark contrast with previous reports (Thieryet al, 2009; Hrstkaet al, 2010; Lobodaet al, 2011; Cieplyet al, 2012; Huanget al, 2012; Byerset al, 2013; Frischet al, 2013). Equally intriguing results were observed for DFS (Fig4B), with poorer DFS for patients with ovarian and colorectal cancers (μHR = 0.5165,P < 0.001; and μHR = 0.7669,P = 0.002, respectively), and a marginal correlation noted for patients with bladder carcinoma (μHR = 0.8473). For liver and renal carcinoma, patients with Mes tumours had better DFS than their Epi counterparts (μHR = 1.238 and 3.948, respectively). The result for DFS in patients with breast cancer was unclear (HR = 0.4432–2.622;P = 0.252). Overall, the EMT status is unlikely to be the sole prognostic factor for survival where the composition of histotype or molecular subtype may play a role; this suggests the requirement for stratification of cancers in addition to deciphering the EMT status. This is exemplified by the stratification of breast cancer molecular subtypes (Prat & Perou, 2011), where there is a correlation for better DFS for patients with Epi breast cancers that are of a Basal and Claudin-Low subtypes, but no correlation for other subtypes (Supplementary Fig S7). However, this correlation of EMT and DFS in Basal and Claudin-Low subtypes was not coherent in all breast cancer cohorts probably due to small sample sizes.
Figure 4. Correlation of Epithelial-mesenchymal transition (EMT) scores and survival.

A, B Plot of log2 hazard ratio (HR; mean ± 95% confidence interval) comparing (A) overall survival (OS) and (B) disease-free survival (DFS) of Epi and Mes tumours in different cancers and cohorts. DFS includes progression-free, recurrence-free and distant metastasis-free survival (cohorts inclusive of distant metastasis-free survival were indicated with *). CorrespondingP-values from the log-rank test are given next to each cohort, and those with significant differences (P < 0.05) are marked red. Log2 HR < 0.0 indicates Epi tumours with survival benefit, whereas log2 HR > 0.0 indicates Mes tumours with survival benefit. Meta-analysisP-value for effect or heterogeneity was computed using DerSimonian–Laird binary random effect (for overall) or Peto fixed effect method (for individual cancer).
EMT status does not necessarily translate to chemotherapeutic resistance
To investigate the association between EMT and chemotherapeutic resistance, we compared the clinical outcomes of patients using the response evaluation criteria in solid tumours (RECIST) available for breast (Horaket al, 2013) and ovarian cancer (The Cancer Genome Atlas Research, 2011) cohorts (Fig5A). In these cohorts, patients with breast cancer had been treated with sequential neoadjuvant therapy (doxorubicin and cyclophosphamide), whereas patients with ovarian cancer had undergone primarily platinum-based therapy. Without considering the treatment regimen, there was no significant difference between the RECIST groups in terms of EMT score. Thus, we categorized tumours into Epi, intermediate and Mes based on 2KS (P < 0.05) and observed an enrichment of Mes breast cancers in the progressive disease (PD) category (P = 0.3303). Analyses with another 11 breast cancer cohorts (GSE48905, GSE33658, GSE23428, GSE22226, GSE18864, GSE28796, GSE16646, GSE22513, GSE4779, GSE18728 and GSE50948) (Farmeret al, 2009; Baueret al, 2010; Kordeet al, 2010; Silveret al, 2010; Lehmannet al, 2011; Massarwehet al, 2011; Careyet al, 2012; Essermanet al, 2012; Evanset al, 2012; Knudsenet al, 2014; Pratet al, 2014), within which patients had been administered with different neoadjuvant treatment regimens, including fulvestrant, anastrazole, carboplatin, doxorubicin and other drugs (Supplementary Fig S8A), showed a similar distribution of Epi, intermediate and Mes breast cancers in each clinical response group. Notably, the worst response group (PD or residual disease) comprised mostly patients with Mes breast cancers. Thus, there was a trend towards either an increasing proportion of Mes or a decreasing proportion of Epi breast cancers amongst chemo-resistant patients. We also noted a trend towards a decrease in the Epi proportion amongst patients with ovarian cancer and a change from complete response (CR) to PD (50–42%), albeit there was no significant enrichment in PD for patients with Mes ovarian cancers (P = 0.556).
Figure 5. Generic epithelial-mesenchymal transition (EMT) and drug sensitivity.

- Bar plots of breast (n = 270; left panel) and ovarian (n = 328; right panel) cancers stratified by EMT status and clinical response based on response evaluation criteria in solid tumours (RECIST). Regimen was neoadjuvant doxorubicin and cyclophosphamide for breast cancer, and platinum-based adjuvant/progression/recurrence chemotherapy for ovarian cancer. Percentage distribution of EMT status is given in each clinical response group. Abbreviation: CR, complete response; PR, partial response; SD, stable disease; PD, progressive disease. Green, epithelial-like (Epi); orange, intermediate; red, mesenchymal-like (Mes).
- Volcano plot of EMT correlation with drug sensitivity regardless of cancer type.Rho ∈ [−1.0, +1.0] (x-axis) and-log10P-value (y-axis) were computed by Spearman's correlation coefficient test. Dashed line ofP-value = 0.1 is plotted. Red and green indicate higher drug resistance in Mes tumours (Rho ∈ [0, +1.0]) and Epi tumours (Rho ∈ [−1.0, 0]), respectively.
- Kaplan–Meier analysis comparing overall survival (left panel) and disease-free survival (right panel) of Epi (green) and Mes (red) ovarian cancer patients who underwent a treatment regimen with (dark colour) or without (light colour) paclitaxel.P-value reported was computed by log-rank test. Abbreviation: HR = hazard ratio.
Since the distribution of the EMT score did not allow us to segregate certain other cancers into Epi, intermediate and Mes groups, we next investigated the EMT score profiles of responders and non-responders in these cancers (Supplementary Fig S8B). This was performed using cohorts of predominantly Epi colorectal cancers (GSE19862, GSE35452, GSE46862) (Gimet al, 2014), a cohort of head and neck cancers (GSE32877) (Tomkiewiczet al, 2012) and a cohort of predominantly Mes melanoma (GSE22968) (Beasleyet al, 2011). There was no significant difference between responders and non-responders in terms of EMT score, albeit there was a slight trend towards responders tending to have a higher EMT score in predominantly Epi colorectal cancer, and a slight trend that responders tended to have lower EMT score in predominantly Mes melanoma (Supplementary Fig S8B). These data suggest that EMT may correlate with chemotherapeutic resistance; however, the results remain inconclusive at this time. The lack of a conclusive result might be because the majority of these patients had been treated with more than one chemotherapeutic compound, which may confound the role of EMT and chemotherapeutic resistance in these patients. Furthermore, as these data are from relatively small cohorts, further study is required to validate the current observations.
Thus, to search for an association between EMT and chemotherapeutics, and to explore the potential therapeutic options for Epi and Mes cancers, we analysed drug sensitivity data from the SANGER/COSMIC (Garnettet al, 2012) database (April 16, 2013) in cell line models. We correlated the EMT score with the half-maximal inhibitory concentration (IC50) of 138 compounds (Fig5B, Supplementary Fig S9, Supplementary Table S5) using the Spearman's correlation coefficient test, as it measures the overall trend and requires no definition of sensitive or resistant categories. We employed a less stringent threshold (P < 0.1) because of the limited samples for certain drugs. Surprisingly, the EMT status did not systematically translate to cellular chemotherapeutic resistance (Fig5B, Supplementary Fig S9), contradicting previous associations between cellular phenotype and attaining resistance (Wittaet al, 2006; Arumugamet al, 2009; Hrstkaet al, 2010; Sethiet al, 2010; Marchiniet al, 2013). Regardless of the cancer type, Mes and Epi cell lines were preferentially sensitive to certain compounds. Mes cell lines were more resistant to Afatinib and Gefinitib (againstEGFR), but were more sensitive to the PDK1 kinase inhibitor, BX-795 and the HSP-90 inhibitor, Elesclomol (Fig5B). Intriguingly, Epi cell lines were resistant to 64 compounds, whereas Mes cell lines were resistant to only 7, albeit the correlation was weak (Rho ∈ [−0.35, +0.37]). When stratified by cancer type, we observed a similar pattern of preferential sensitivity to certain compounds. Notably, Mes pancreatic cancer, malignant melanoma, renal cancer and liver cancer cell lines were more sensitive to compounds targeting microtubule dynamics, such as Vinblastine and Docetaxel. Comparatively, Mes breast, lung and uterine cancer cell lines were more resistant to Afatinib and Gefinitib (Supplementary Fig S9). Previous observations reported that EMT is associated withEGFR inhibitor resistance in non-small cell lung cancer (NSCLC) (Byerset al, 2013). Using our generic EMT score, we observed that Epi cell lines not limited to NSCLC were more sensitive to inhibitors ofEGFR or bothEGFR andERBB2 (Erlotinib, Lapatinib, BIBW2992 and Gefitinib) in the SANGER/COSMIC (Garnettet al, 2012) and Cancer Cell Line Encyclopedia (CCLE) (Barretinaet al, 2012) databases (Supplementary Table S5). Cell lines with sensitizingEGFR activating mutations (L861Q, G719S, exon 19 in-frame deletion) (Carret al, 2004) exhibited significantly lower EMT scores compared with wild-type cell lines (P = 0.0056). On the other hand, cell lines harbouring the secondary gatekeeperEGFR-T790M mutation, which confers resistance toEGFR inhibitors (Gazdar, 2009), were more Mes (EMT score = +0.23). Hence, a higher prevalence of sensitizingEGFR mutations could account for the higher response rate of Epi cancers toEGFR inhibitors. Although it is too preliminary to conclude if Epi or Mes is resistant to certain compounds (due to the modest correlation andP-values), these results suggest that Epi and Mes cell lines have differential responses to certain compounds. In addition, we show that Epi and Mes cell lines also have preferential responses to certain compounds and that EMT is not the only mechanism driving resistance in all chemo- or targeted therapies.
These intriguing preferential drug sensitivities of Epi and Mes cancers in the correlation analysis of EMT score and the IC50 of 138 compounds (EMT score–IC50; Supplementary Table S5) prompted us to investigate the relevance of these findings, as cell lines do not fully exemplify the behaviours of primary tumours. We selected ovarian cancer as a model for this pilot study because the first-line treatment for ovarian cancer is primarily cisplatin/carboplatin and paclitaxel, which could provide a less convoluted mechanism of interaction between EMT and the drugs. Provocatively, in the EMT score–IC50 correlation analysis, we found that Mes ovarian cancers have preferential sensitivity to cisplatin (Rho = −0.37) and paclitaxel (Rho = −1.0; Supplementary Table S5). A Kaplan–Meier analysis was then performed to stratify the treatment regimens into Epi versus Mes ovarian cancer patients (Fig5C); this was performed using the 2KS criteria described for Fig5A. Because few patients were treated without cis-/carboplatin (n < 10), we focused our analysis on the effect of paclitaxel. Surprisingly, patients with Epi and Mes ovarian cancers, who had received a regimen with paclitaxel, had significantly different OS and DFS outcomes as compared with those who had received a regimen without paclitaxel (Fig5C). Epi patients receiving a regimen containing paclitaxel showed poorer DFS (P = 0.0039), whereas Mes patients treated with paclitaxel showed better DFS (P = 0.039) and OS (P = 0.0006); these results for the Mes patients mirrored those garnered from the EMT score–IC50 analysis, indicating that Mes is more sensitive to paclitaxel. We found no significant difference in DFS or OS outcome for ovarian cancer patients who exhibited an intermediate EMTed phenotype. Such differential therapeutic response in Epi and Mes tumours is also observed in glioma (Desmedtet al, 2009) and multiple myeloma (Erdem-Eraslanet al, 2013) (Supplementary Fig S10, Supplementary Information). Even though glioma patients receiving radiotherapy and chemotherapy generally have better OS, the benefit is greater in patients with Mes glioma (P = 0.0117). In contrast, patients with Epi multiple myeloma have better DFS rates when administered with bortezomib instead of dexamethasone (P = 0.0349). However, we observed no difference in patients with ER+ breast cancers (Mulliganet al, 2007) who were administered with letrozole or tamoxifen in terms of EMT stratification. Overall, these results providein vivo evidence for the findings of the EMT score–IC50 correlation analysis and show the preferential drug sensitivity in patients with Epi and Mes tumours as well as their differential responses to particular chemotherapeutic regimens.
Discussion
Increasing evidence points to the role of EMT in cancer progression, metastasis and drug resistance. However, the difficulty in making an adequate assessment of EMT in tumours has caused dispute as to whether EMT exists in cancer (Jordanet al, 2011). To address this issue, we developed a generic EMT signature to quantitatively estimate the extent of EMT in tumours and cell lines. To the best of our knowledge, this is the first time a generic EMT signature has been sought in order to capture the universal features of EMT in tumours or in cells. Previous reports indicate that intermediate states of EMT display the highest plasticity (Jordanet al, 2011; Huanget al, 2013) and thus represent an appropriate stage within which to induce or reverse EMT. The change in EMT score captures and reflects this phenotypic transition in the cell or tissue; this method is judiciously illustrated in a previous application where Epi MCF7 breast cancer cells displayed a shift in the EMT spectrum when transfected withSNAI1 (Akalayet al, 2013). Having the capacity to monitor such a transition would be instrumental for assessing the effectiveness of EMT reversion therapy and for identifying an intermediate state of EMT that would have an improved chemotherapeutic response. It is important to note that full reversion of EMT may not be desirable, as Mes micro-metastases must re-acquire an Epi phenotype to proliferate at the metastatic site (Thiery, 2002); in agreement was the recent demonstration that reversing EMT may promote metastatic colonization (Tsaiet al, 2012). The main challenge, therefore, is that we do not know the precise intermediate states and under what conditions or context cancer cells in the primary tumour or at the distant metastatic sites can exit dormancy and resume growth or become chemo-resistant. Here, we validated the efficacy of our generic EMT scoring system to reflect the EMT transition in a panel of functional studies across multiple cancer types. The spectrum of EMT identified across the various tumours implies a causal role of the EMT status in the differential characteristics of these cancers and in their responses to treatment. Remarkably, the EMT spectrum was highly similar between cell lines and tumours in a given cancer type, which verifies the capacity of the EMT score to capture the EMT phenotype rather than the influence of the stroma.
The type of cancer is generally considered to be a good indicator of the EMT status (Fig3). For example, colorectal carcinoma is primarily Epi, whereas glioblastoma, neuroblastoma, osteosarcoma, malignant melanoma and germ cell tumours are primarily Mes. It is unclear, however, whether these phenotypic traits are inherent or acquired. Inherent EMT traits could be a reflection of the cell of origin or the lineage of the cancer. Indeed, melanoma and neuroblastoma are derived from transformed melanocytes and sympathetic neural progenitor cells, respectively (Nakaya & Sheng, 2013), which originate from the neural crest and delaminate through an EMT before colonizing different embryonic sites where they undergo differentiation into melanocytes, glial cells and neurons of the peripheral nervous system. Thus, these neural crest cell derivatives maintain an intrinsic Mes phenotype. Another example is found in breast cancer. The most EMTed breast cancers belong to the Claudin-Low subtype and are likely derived from the highly plastic cells of the basal layer of the mammary gland; the less plastic luminal cells, in contrast, are thought to give rise to the Basal subtype (Taddeiet al, 2008; Limet al, 2009; Molyneuxet al, 2010) (Fig2B). In the case of acquired EMT, the process may be triggered by changes in the tumour microenvironment (Valastyan & Weinberg, 2011; Lee & Nelson, 2012; Tam & Weinberg, 2013; Van den Eyndenet al, 2013) or the influence of drug treatment or cytotoxic stress (Frischet al, 2013; Marchiniet al, 2013), amongst other factors. This is exemplified in pancreatic carcinoma, which derives from the same endodermal anlage as the colon yet exhibits a relatively Mes phenotype as compared with colon carcinoma. Although pancreatic carcinoma comprises a large fraction of stromal cells (Beattyet al, 2011), pancreatic carcinoma cell lines exhibit the same EMT spectrum as colon cells (Fig3), supporting the notion that the EMT score still arises from the contributions of the pancreatic carcinoma cells not just the stromal cells. In a similar way, liver carcinoma shows a wide spectrum of EMT scores. As the liver also derives from the primitive endoderm, it would be expected that liver carcinoma would exhibit an Epi phenotype. In this case, in addition to the role of the stroma, it is intriguing to consider that the cell of origin may have undergone an E- to N-cadherin switch.
Although many reports have associated the EMT status with survival (Wittaet al, 2006; Arumugamet al, 2009; Hrstkaet al, 2010; Sethiet al, 2010; Lobodaet al, 2011; Cieplyet al, 2012; Byerset al, 2013; Marchiniet al, 2013), our EMT scoring does not wholly support these findings. We show that the EMT status is linked to OS in ovarian cancer, gastric cancer and glioblastoma, but not in other carcinoma types. In terms of DFS, patients with Epi ovarian and colorectal cancers have a better prognosis. The discrepancy in the reported correlations between EMT status and survival is intriguing, as EMT was posited to be involved in cancer progression, metastasis and drug resistance, all of which are strongly connected with poorer survival. It is noteworthy that most breast carcinoma of the lobular histotype, which are notoriously known for not expressing E-cadherin, are not more aggressive than E-cadherin-positive invasive ductal carcinoma (Ferlicotet al, 2004). Here, we also showed that patients with Mes breast cancers appear to have better OS and DFS than those with Epi breast cancers, seemingly in opposition to what has been previously reported (Hrstkaet al, 2010; Taubeet al, 2010; Caiet al, 2013). On closer look, this difference likely arises from the distribution of patients with luminal and triple-negative breast cancers in the cohort. As shown in Fig4B, a breast cancer cohort (GSE25066) with a lower percentage of Luminal-B and ERBB2+ breast cancers would show a better DFS for Epi breast cancers. Even though Luminal-B and ERBB2+ breast cancer subtypes are of the Epi type (Blicket al, 2008) (Fig2B), they have poor OS and DFS, similar to that of the Mes type, triple-negative breast cancers (Prat & Perou, 2011; Ishitobiet al, 2013). Consequently, the more prevalent Epi Luminal-B and ERBB2+ breast cancers give rise to poorer survival curves in Epi breast cancer cohorts, suggesting that heterogeneity within a cancer type could mask and perplex the role of EMT. Thus, stratification by molecular subtypes may be required to study the role of EMT. Indeed, when stratified by breast cancer molecular subtype (Prat & Perou, 2011), patients with Epi breast cancers show better DFS if their cancers are of the Basal and Claudin-Low subtypes, but not the other subtypes (Supplementary Fig S7).
The crosstalk between stromal and cancer cells plays a major role in metastasis (Parket al, 2011) and hence may influence the results of EMT scoring. In breast cancer, mammary Epi cells can adopt a stromal gene expression pattern indistinguishable from reactive stroma when undergoing EMT (Farmeret al, 2009). As there is no distinction between reactive stroma and EMT-induced stromal expression, this may generate a high EMT score in some Epi tumours. The EMT scores of LCM and non-LCM breast cancer cohorts (Fig2B) showed a marginally lower EMT score for Epi, Luminal-A subtype, suggesting that stromal contribution may, to some extent, obscure a precise assessment of the EMT score. However, assessing the stromal contribution is non-trivial given the RNA instability and labour-intensive procedure of segregating stromal from cancer cells (Parket al, 2011). It is therefore difficult to quantify the influence of stroma in our EMT scoring. Nevertheless, in addition to the minute EMT score differences in LCM and non-LCM breast cancer cohorts, we have also shown a strong correlation of the generic EMT score computed using tumour- and cell line-specific signatures (Supplementary Table S1C). This result indicates that whereas stroma may obscure a precise assessment of EMT by transcriptome, the influence is not overwhelmingly striking. Thus, we believe the EMT scoring is relatively independent of stromal influence, but likely not of clonal heterogeneity. Others have shown that, although there is a higher proportion of EMT carcinoma cells in basal-like tumours, such cells are also seen in luminal breast tumours (Sarrioet al, 2008). It would thus be useful to analyse the phenotype and clonogenicity of these EMTed cells and of CTCs in addition to EMT scoring (Thiery & Lim, 2013). On-going studies on CTCs in our laboratory are exploring whether the EMT score reflects the propensity of a cancer to disseminate and become refractory to therapy. CTCs exhibit a wide spectrum of EMT phenotypes, irrespective of the primary tumour (Valastyan & Weinberg, 2011; Thiery & Lim, 2013; Yuet al, 2013). Thus, the capacity of a primary tumour to metastasize may reside in a small subset of cells, the phenotype of which is not known and cannot be assessed by an EMT scoring method.
Our findings are apparently discrepant with previous connections between EMT status and drug resistance (Wittaet al, 2006; Arumugamet al, 2009; Hrstkaet al, 2010; Sethiet al, 2010; Marchiniet al, 2013). Whilst we acknowledge the limitations of cell lines and IC50 as a drug assay (Haibe-Kainset al, 2013), we believe our results give a bird's-eye view of EMT and drug resistance. By assessing OS and DFS outcomes of ovarian cancer patients through EMT status and treatment regimen, we found that Epi ovarian cancers are more resistant to paclitaxel, whereas Mes ovarian cancers have a preferential sensitivity to paclitaxel. This shows that cancers with different degrees of EMT respond distinctly to particular compounds—in accordance with our previous work in ovarian cancer (Miowet al, 2014)—and is supportive of the utility of the EMT score-IC50 correlation analysis in cell lines. More importantly, these results identify that patients with Mes, but not Epi, ovarian cancer would benefit from therapeutic regimens that contain paclitaxel. In line with this, the Japanese Gynecologic Oncology Group demonstrated a survival advantage for a weekly administration of paclitaxel compared with a once in 3 week administration of paclitaxel in combination with carboplatin in relapsed patients with ovarian cancer (Bairdet al, 2010), where relapsed ovarian cancer is shown to be enriched for Mes (Tanet al, 2013). Similar to our findings, gastric cancer patients, who have an enrichment for Mes, respond differently to chemotherapy from the subtype of patients not enriched for Mes and are more sensitive to cisplatin (Tanet al, 2011). Overall, our data indicate that not all Mes carcinoma are resistant to chemotherapy and that the EMT status does not necessarily translate to a propensity towards drug resistance. Indeed, testicular carcinoma, a highly Mes, germ cell tumour, is extraordinarily sensitive to cisplatin (Masters & Koberle, 2003; Eckstein, 2011). Furthermore, even though EMT is often linked with the acquisition of stem cell-like features,Prrx1 uncouples EMT and stemness, resulting in a drug-resistant, metastatic colonization (Ocanaet al, 2012). Thus, we postulate that it is not solely the acquisition of EMT but the EMT stem cell-like phenotype that engenders drug resistance (Brabletz, 2012). Frischet al (2013) proposed a similar concept, suggesting that EMT is acquired by triggering EMT inducers to repress cell polarity and that stem cell-like features are acquired by engaging additional programs such as the WNT and Hippo pathways. It is likely that the present generic EMT signature estimates the degree of EMT but cannot estimate the degree or behaviour of a cancer stem cell-like phenotype. This distinction is evident in the minute differences between control andHMGA2-knockdown—a gene implicated in stemness (Copleyet al, 2013)—MDA-MB-231 breast cancer cells (Supplementary Fig S3) and may explain the limited correlation between generic EMT score and therapeutic resistance, as cancer stem cells may have an impact on tumour progression in breast (Sarrioet al, 2008) and colon (Brabletz, 2012) Epi tumours. In our preliminary analysis, although there are some moderate correlations between stemness and generic EMT score, the correlation was not consistent across cancer types, which may suggest that different cancers enrol distinct programs to acquire stemness (Supplementary Text, Supplementary Fig S11). In addition, the existence of different types of stem cells within a cancer—as shown in breast cancers—has to be taken into account when considering the correlation of stemness and EMT (Liuet al, 2014). Finally, the lower sensitivity of Mes cell lines to various compounds (EGFR inhibitors) may be due to a lower prevalence of the targeted mutations in these cell lines. However, it is still unknown whether anEGFR mutation is the main driver in these cancers and whether these mutations—acquired or inherent—play a role in initiating or regulating EMT.
Overall, we demonstrate the feasibility of applying a generic EMT score for the examination of the EMT spectrum in different cancers, as well as its correlation with survival and chemotherapeutic resistance. We believe the proposed generic EMT score is a promising, general-purpose tool with which to estimate EMT phenotypes, regardless of cancer type, to systematically investigate EMT and to more objectively assess the impact of EMT effectors or drugs on phenotype changes. It also offers a more objective EMT scoringin vitro as opposed to estimations by visual inspection or marker assessment.
Materials and Methods
Data pre-processing for Affymetrix microarray expression data
Pre-processing and quality checks were performed as described (Tanet al, 2013) (Supplementary Materials and Methods). Data sets on the Affymetrix U133A or U133Plus2 platforms for bladder (n = 132), breast (n = 3992), colorectal (n = 1820), gastric (n = 231) and ovarian (n = 1538) cancers, as well as NSCLC and lung adenocarcinoma (n = 481) were downloaded from Gene Expression Omnibus (GEO), Array Express, Expression Project for Oncology (ExpO) and The Cancer Genome Atlas (TCGA) (Supplementary Table S6). An LCM breast cancer cohort (n = 417) was provided by the Japanese Foundation for Cancer Research (http://www.jfcr.or.jp/english; Supplementary Materials and Methods; GSE54002). Normalization was performed independently on each cohort using R version 3.01, Bioconductor Affy Package 1.38.1, Robust Multichip Average (Gautieret al, 2004), and ComBat (Johnsonet al, 2007) was applied for batch adjustment on the compiled, normalized data sets separately. Normal tissues were removed from the batch-adjusted data. Cell line collections (Supplementary Table S7), including SANGER/COSMIC (Garnettet al, 2012), CCLE (Barretinaet al, 2012) data sets and validation data sets (Supplementary Table S8), were subjected to the same normalization procedure.
Predictive modelling and validation by BinReg
Expression data analysis based on a binary regression model using the BinReg v2.0 (Profiler, http://dig.genome.duke.edu/software.html) was described previously (Gatzaet al, 2010; Tanet al, 2013). Details are given in the Supplementary Materials and Methods.
Generation of cancer-specific EMT signature
Aside from an ovarian- and breast cancer-specific EMT signatures, which we derived previously from CDH2 and CDH1 immunofluorescence staining (Akalayet al, 2013; Miowet al, 2014), we devised a strategy to generate cancer-specific EMT signatures for the other types of cancer (bladder, colorectal, gastric and lung), as depicted by the six-step scheme in Fig1A:
Published EMT gene sets from Molecular Signature database v4.0 (Subramanianet al, 2005) and previous literature (Leeet al, 2006; Carreteroet al, 2010) (Supplementary Table S9) were collated.
ssGSEA score (Verhaaket al, 2013) was computed for EMT gene sets on cancer cell lines and correlated with gene expression of known Mes and Epi markers (TWIST1,SNAI1,SNAI2,VIM,CDH2,ZEB1 andCDH1,DDR1,ERBB2,ERBB3,KRT19) (Thieryet al, 2009).
The gene set that best correlated with the enrichment score was chosen to rank the cell lines. The 10–20 most Mes and most Epi cell lines were selected for BinReg modelling. Two data sets, GSE9691 (Onderet al, 2008) and GSE24202 (Taubeet al, 2010), were used for BinReg parameter settings and to ensure validity of the derived EMT signature. (Note: Steps 1–3 can be recursive to identify an initial BinReg EMT signature of sufficient accuracy in predicting the EMT status.)
The BinReg EMT signature was then used to predict the EMT status of cell lines and tumour samples specific to a particular cancer type.
The extreme 25% of the most Mes and Epi cell lines or the extreme 100 Mes and Epi tumours were chosen to generate the EMT signatures for cell lines and tumours, respectively; this prevented the signature from over-fitting the training data. EMT signatures were generated using SAM/ROC (Tusheret al, 2001; Verhaaket al, 2013), with applied thresholds of: SAMq% = 0, and ROC > 0.8–0.85 or < 0.15–0.2.
Using this SAM/ROC-derived EMT signature, we then computed the EMT score of a sample using a two-sample Kolmogorov–Smirnov test (2KS).
The final cancer-specific EMT signature (generated by SAM/ROC) is a refinement of the initial EMT signature (generated by BinReg). Although it seems redundant to have an initial followed by a refined final EMT signature, the benefit of this approach is threefold. First, since some of the collected, published EMT signatures are derived from different cell types and from a relatively smaller number of cell lines, these published EMT signatures may not be applicable universally, as they may be cell line-specific or cancer-specific. In this study, we used a large panel of cell lines to derive an EMT signature specific to each cancer type, and hence, it is less likely that the derived signature contains features unique to a single cell line. Second, to ensure accuracy of the final EMT signature, we validated the initial EMT signature on two independent functional EMT studies. Third, regenerating the EMT signature by SAM/ROC from the most Epi or most Mes tumours ensured the additional changes sometimes acquired in cell lines would not be included and distort the EMT signature for tumours in general.
Derivation of generic EMT signature
We derived a generic EMT signature from the overlap between specific EMT signatures generated for bladder, breast, colorectal, gastric, lung and ovarian cancer types. We weighted the genes that were selected in six cancer-specific EMT signatures using the formula: for geneg, the weight of the gene is given by:
whereD is the total number of diseases (D = 6 in this case),fcgd andqgd are the fold-change andq-value% of the gene,g, of disease,d, as computed by SAM.ROCgd is the ROC value of gene,g, of disease,d, andnd is the number of samples in disease,d. The formula will give higher weights to genes that have a large fold-change, a smallq-value%, a large ROC value and a large number of samples. We ranked and selected the genes with az-transformed weight > 3.09 orP < 0.001 (Supplementary Table S1A and B).
Computation of EMT score
To compute the EMT score of a sample, we adopted a similar approach to that used in ssGSEA (Verhaaket al, 2013). The empirical cumulative distribution function (ECDF) was estimated for Epi and Mes gene sets. The 2KS test was employed to compute the difference between Mes ECDF (ECDFMes) and Epi ECDF (ECDFEpi). The 2KS score was then taken as the EMT score. A sample with a positive EMT score exhibits a more Mes phenotype, whereas a negative EMT score reflects a more Epi phenotype. Note that the 2KS test allows segregation of samples into Epi (2KS score ECDFEpi > ECDFMes;P < 0.05), intermediate Epi (2KS score ECDFEpi > ECDFMes;P ≥ 0.05), intermediate Mes (2KS score ECDFEpi < ECDFMes,P ≥ 0.05) and Mes (2KS score ECDFEpi < ECDFMes,P < 0.05). The EMT signature is given in Supplementary Table S1A and B. The Matlab® R2012a script for computing the EMT score and computation of the EMT score can be requested through http://www.csi.nus.edu.sg/bioinfo/index.php.
The paper explained
Problem
During epithelial-mesenchymal transition (EMT), epithelial cells lose polarity and acquire migratory properties reminiscent of mesenchymal cells. EMT is a dynamic process, not a binary process, with intermediary states, and is thus still not easily ascertained in cultures orin vivo. Consequently, its role in cancer remains controversial.
Results
We used gene expression to establish an EMT scoring method and quantitatively estimated the degree of EMT (−1.0 to +1.0) in a large collection of cell lines and tumours reflecting epithelial and mesenchymal states as well as the potential intermediate states that occur during transition.
Impact
We applied EMT scoring to ascertain its efficacy in correlating EMT status with patient survival rates and responses to treatment. Such versatile EMT scoring may enable the objective and systematic investigation of EMT across many parameters of cancer progression, survival and throughout the clinical response to therapy.
Statistical analysis
DerSimonian–Laird binary random or Peto fixed effect meta-analysis was conducted using OpenMeta[Analyst] software with the default settings. The log-rank test in the Kaplan–Meier analyses was computed by GraphPad Prism® version 5.0 (GraphPad Software, La Jolla, CA). Mann–Whitney, Fisher's exact and Spearman's correlation coefficient tests were computed by Matlab® R2012a, statistics toolbox version 8.0 (MathWorks, Natick, MA).
Acknowledgments
We thank Dr. R. Jackson for her careful English editing. We thank the financial support from the Cancer Science Institute of Singapore, National Research Foundation Prime Minister's Office Singapore, National Medical Research Council/National University Cancer Institute of Singapore Center Grant/EMT Theme CG12Aug12, Department of Biochemistry of the National University of Singapore, and Institute of Molecular and Cell Biology at A*STAR, Singapore.
Author contributions
JPT and RYH conceived the idea; JPT and RYH devised the project and obtained funding; TZT, QHM, JPT and RYH wrote the paper; TZT performed bioinformatics analyses; YM, MM, TN and SM provided on laser-capture micro-dissected breast cancer samples.
Conflict of interest
The authors declare that they have no conflict of interest.
For more information
Gene Expression Omnibus (GEO): http://www.ncbi.nlm.nih.gov/gds
ArrayExpress: http://www.ebi.ac.uk/arrayexpress/
The Cancer Genome Atlas (TCGA): https://tcga-data.nci.nih.gov/tcga/
Molecular Signature Database (MSigDB): http://www.broadinstitute.org/gsea/msigdb/index.jsp
Cancer Cell Line Encyclopedia (CCLE): http://www.broadinstitute.org/ccle/home
SANGER COSMIC cell line: http://cancer.sanger.ac.uk/cancergenome/projects/cell_lines/
Compute Generic EMT score: http://www.csi.nus.edu.sg/bioinfo/index.php
BinReg/Profiler software: http://dig.genome.duke.edu/software.html
DAVID functional annotation tool: http://david.abcc.ncifcrf.gov/summary.jsp
Supporting Information
Supplementary information for this article is available online: http://embomolmed.embopress.org
References
- Akalay I, Janji B, Hasmim M, Noman MZ, Andre F, De Cremoux P, Bertheau P, Badoual C, Vielh P, Larsen AK, et al. Epithelial-to-mesenchymal transition and autophagy induction in breast carcinoma promote escape from T-cell-mediated lysis. Cancer Res. 2013;73:2418–2427. doi: 10.1158/0008-5472.CAN-12-2432. [DOI] [PubMed] [Google Scholar]
- Arumugam T, Ramachandran V, Fournier KF, Wang H, Marquis L, Abbruzzese JL, Gallick GE, Logsdon CD, McConkey DJ, Choi W. Epithelial to mesenchymal transition contributes to drug resistance in pancreatic cancer. Cancer Res. 2009;69:5820–5828. doi: 10.1158/0008-5472.CAN-08-2819. [DOI] [PMC free article] [PubMed] [Google Scholar]
- Baird RD, Tan DS, Kaye SB. Weekly paclitaxel in the treatment of recurrent ovarian cancer. Nat Rev Clin Oncol. 2010;7:575–582. doi: 10.1038/nrclinonc.2010.120. [DOI] [PubMed] [Google Scholar]
- Barretina J, Caponigro G, Stransky N, Venkatesan K, Margolin AA, Kim S, Wilson CJ, Lehar J, Kryukov GV, Sonkin D, et al. The Cancer Cell Line Encyclopedia enables predictive modelling of anticancer drug sensitivity. Nature. 2012;483:603–607. doi: 10.1038/nature11003. [DOI] [PMC free article] [PubMed] [Google Scholar]
- Bauer JA, Chakravarthy AB, Rosenbluth JM, Mi D, Seeley EH, De Matos Granja-Ingram N, Olivares MG, Kelley MC, Mayer IA, Meszoely IM, et al. Identification of markers of taxane sensitivity using proteomic and genomic analyses of breast tumors from patients receiving neoadjuvant paclitaxel and radiation. Clin Cancer Res. 2010;16:681–690. doi: 10.1158/1078-0432.CCR-09-1091. [DOI] [PMC free article] [PubMed] [Google Scholar]
- Beasley GM, Riboh JC, Augustine CK, Zager JS, Hochwald SN, Grobmyer SR, Peterson B, Royal R, Ross MI, Tyler DS. Prospective multicenter phase II trial of systemic ADH-1 in combination with melphalan via isolated limb infusion in patients with advanced extremity melanoma. J Clin Oncol. 2011;29:1210–1215. doi: 10.1200/JCO.2010.32.1224. [DOI] [PMC free article] [PubMed] [Google Scholar]
- Beatty GL, Chiorean EG, Fishman MP, Saboury B, Teitelbaum UR, Sun W, Huhn RD, Song W, Li D, Sharp LL, et al. CD40 agonists alter tumor stroma and show efficacy against pancreatic carcinoma in mice and humans. Science. 2011;331:1612–1616. doi: 10.1126/science.1198443. [DOI] [PMC free article] [PubMed] [Google Scholar]
- Blick T, Widodo E, Hugo H, Waltham M, Lenburg ME, Neve RM, Thompson EW. Epithelial mesenchymal transition traits in human breast cancer cell lines. Clin Exp Metastasis. 2008;25:629–642. doi: 10.1007/s10585-008-9170-6. [DOI] [PubMed] [Google Scholar]
- Borrell B. How accurate are cancer cell lines? Nature. 2010;463:858. doi: 10.1038/463858a. [DOI] [PubMed] [Google Scholar]
- Brabletz T. To differentiate or not–routes towards metastasis. Nat Rev Cancer. 2012;12:425–436. doi: 10.1038/nrc3265. [DOI] [PubMed] [Google Scholar]
- Byers LA, Diao L, Wang J, Saintigny P, Girard L, Peyton M, Shen L, Fan Y, Giri U, Tumula PK, et al. An epithelial-mesenchymal transition gene signature predicts resistance to EGFR and PI3K inhibitors and identifies Axl as a therapeutic target for overcoming EGFR inhibitor resistance. Clin Cancer Res. 2013;19:279–290. doi: 10.1158/1078-0432.CCR-12-1558. [DOI] [PMC free article] [PubMed] [Google Scholar]
- Cai J, Guan H, Fang L, Yang Y, Zhu X, Yuan J, Wu J, Li M. MicroRNA-374a activates Wnt/beta-catenin signaling to promote breast cancer metastasis. J Clin Invest. 2013;123:566–579. doi: 10.1172/JCI65871. [DOI] [PMC free article] [PubMed] [Google Scholar]
- Carey LA, Rugo HS, Marcom PK, Mayer EL, Esteva FJ, Ma CX, Liu MC, Storniolo AM, Rimawi MF, Forero-Torres A, et al. TBCRC 001: randomized phase II study of cetuximab in combination with carboplatin in stage IV triple-negative breast cancer. J Clin Oncol. 2012;30:2615–2623. doi: 10.1200/JCO.2010.34.5579. [DOI] [PMC free article] [PubMed] [Google Scholar]
- Carr EA, Mead J, Vershon AK. Alpha1-induced DNA bending is required for transcriptional activation by the Mcm1-alpha1 complex. Nucleic Acids Res. 2004;32:2298–2305. doi: 10.1093/nar/gkh560. [DOI] [PMC free article] [PubMed] [Google Scholar]
- Carretero J, Shimamura T, Rikova K, Jackson AL, Wilkerson MD, Borgman CL, Buttarazzi MS, Sanofsky BA, McNamara KL, Brandstetter KA, et al. Integrative genomic and proteomic analyses identify targets for Lkb1-deficient metastatic lung tumors. Cancer Cell. 2010;17:547–559. doi: 10.1016/j.ccr.2010.04.026. [DOI] [PMC free article] [PubMed] [Google Scholar]
- Chaffer CL, Weinberg RA. A perspective on cancer cell metastasis. Science. 2011;331:1559–1564. doi: 10.1126/science.1203543. [DOI] [PubMed] [Google Scholar]
- Cieply B, Riley P, Pifer PM, Widmeyer J, Addison JB, Ivanov AV, Denvir J, Frisch SM. Suppression of the epithelial-mesenchymal transition by Grainyhead-like-2. Cancer Res. 2012;72:2440–2453. doi: 10.1158/0008-5472.CAN-11-4038. [DOI] [PMC free article] [PubMed] [Google Scholar]
- Copley MR, Babovic S, Benz C, Knapp DJ, Beer PA, Kent DG, Wohrer S, Treloar DQ, Day C, Rowe K, et al. The Lin28b-let-7-Hmga2 axis determines the higher self-renewal potential of fetal haematopoietic stem cells. Nat Cell Biol. 2013;15:916–925. doi: 10.1038/ncb2783. [DOI] [PubMed] [Google Scholar]
- D'Amato NC, Ostrander JH, Bowie ML, Sistrunk C, Borowsky A, Cardiff RD, Bell K, Young LJ, Simin K, Bachelder RE, et al. Evidence for phenotypic plasticity in aggressive triple-negative breast cancer: human biology is recapitulated by a novel model system. PLoS ONE. 2012;7:e45684. doi: 10.1371/journal.pone.0045684. [DOI] [PMC free article] [PubMed] [Google Scholar]
- Deshiere A, Duchemin-Pelletier E, Spreux E, Ciais D, Combes F, Vandenbrouck Y, Coute Y, Mikaelian I, Giusiano S, Charpin C, et al. Unbalanced expression of CK2 kinase subunits is sufficient to drive epithelial-to-mesenchymal transition by Snail1 induction. Oncogene. 2013;32:1373–1383. doi: 10.1038/onc.2012.165. [DOI] [PubMed] [Google Scholar]
- Desmedt C, Giobbie-Hurder A, Neven P, Paridaens R, Christiaens MR, Smeets A, Lallemand F, Haibe-Kains B, Viale G, Gelber RD, et al. The Gene expression Grade Index: a potential predictor of relapse for endocrine-treated breast cancer patients in the BIG 1-98 trial. BMC Med Genomics. 2009;2:40. doi: 10.1186/1755-8794-2-40. [DOI] [PMC free article] [PubMed] [Google Scholar]
- Eckstein N. Platinum resistance in breast and ovarian cancer cell lines. J Exp Clin Cancer Res. 2011;30:91. doi: 10.1186/1756-9966-30-91. [DOI] [PMC free article] [PubMed] [Google Scholar]
- Erdem-Eraslan L, Gravendeel LA, de Rooi J, Eilers PH, Idbaih A, Spliet WG, den Dunnen WF, Teepen JL, Wesseling P, Sillevis Smitt PA, et al. Intrinsic molecular subtypes of glioma are prognostic and predict benefit from adjuvant procarbazine, lomustine, and vincristine chemotherapy in combination with other prognostic factors in anaplastic oligodendroglial brain tumors: a report from EORTC study 26951. J Clin Oncol. 2013;31:328–336. doi: 10.1200/JCO.2012.44.1444. [DOI] [PMC free article] [PubMed] [Google Scholar]
- Esserman LJ, Berry DA, Cheang MC, Yau C, Perou CM, Carey L, DeMichele A, Gray JW, Conway-Dorsey K, Lenburg ME, et al. Chemotherapy response and recurrence-free survival in neoadjuvant breast cancer depends on biomarker profiles: results from the I-SPY 1 TRIAL (CALGB 150007/150012; ACRIN 6657) Breast Cancer Res Treat. 2012;132:1049–1062. doi: 10.1007/s10549-011-1895-2. [DOI] [PMC free article] [PubMed] [Google Scholar]
- Evans AL, Faial T, Gilchrist MJ, Down T, Vallier L, Pedersen RA, Wardle FC, Smith JC. Genomic targets of Brachyury (T) in differentiating mouse embryonic stem cells. PLoS ONE. 2012;7:e33346. doi: 10.1371/journal.pone.0033346. [DOI] [PMC free article] [PubMed] [Google Scholar]
- Farmer P, Bonnefoi H, Anderle P, Cameron D, Wirapati P, Becette V, Andre S, Piccart M, Campone M, Brain E, et al. A stroma-related gene signature predicts resistance to neoadjuvant chemotherapy in breast cancer. Nat Med. 2009;15:68–74. doi: 10.1038/nm.1908. [DOI] [PubMed] [Google Scholar]
- Ferlicot S, Vincent-Salomon A, Medioni J, Genin P, Rosty C, Sigal-Zafrani B, Freneaux P, Jouve M, Thiery JP, Sastre-Garau X. Wide metastatic spreading in infiltrating lobular carcinoma of the breast. Eur J Cancer. 2004;40:336–341. doi: 10.1016/j.ejca.2003.08.007. [DOI] [PubMed] [Google Scholar]
- Frisch SM, Schaller M, Cieply B. Mechanisms that link the oncogenic epithelial-mesenchymal transition to suppression of anoikis. J Cell Sci. 2013;126:21–29. doi: 10.1242/jcs.120907. [DOI] [PMC free article] [PubMed] [Google Scholar]
- Garnett MJ, Edelman EJ, Heidorn SJ, Greenman CD, Dastur A, Lau KW, Greninger P, Thompson IR, Luo X, Soares J, et al. Systematic identification of genomic markers of drug sensitivity in cancer cells. Nature. 2012;483:570–575. doi: 10.1038/nature11005. [DOI] [PMC free article] [PubMed] [Google Scholar]
- Gatza ML, Lucas JE, Barry WT, Kim JW, Wang Q, Crawford MD, Datto MB, Kelley M, Mathey-Prevot B, Potti A, et al. A pathway-based classification of human breast cancer. Proc Natl Acad Sci U S A. 2010;107:6994–6999. doi: 10.1073/pnas.0912708107. [DOI] [PMC free article] [PubMed] [Google Scholar]
- Gautier L, Cope L, Bolstad BM, Irizarry RA. affy—analysis of Affymetrix GeneChip data at the probe level. Bioinformatics. 2004;20:307–315. doi: 10.1093/bioinformatics/btg405. [DOI] [PubMed] [Google Scholar]
- Gazdar AF. Activating and resistance mutations of EGFR in non-small-cell lung cancer: role in clinical response to EGFR tyrosine kinase inhibitors. Oncogene. 2009;28(Suppl 1):S24–S31. doi: 10.1038/onc.2009.198. [DOI] [PMC free article] [PubMed] [Google Scholar]
- Gillet JP, Varma S, Gottesman MM. The clinical relevance of cancer cell lines. J Natl Cancer Inst. 2013;105:452–458. doi: 10.1093/jnci/djt007. [DOI] [PMC free article] [PubMed] [Google Scholar]
- Gim JCY, Hong SH, Kim HC, Chun HK, Park T, Park WY, Lee WY. 2014. Predicting multi-class response to preoperative chemoradiotherapy in rectal cancer patients, manuscript in preparation.
- Haibe-Kains B, El-Hachem N, Birkbak NJ, Jin AC, Beck AH, Aerts HJ, Quackenbush J. Inconsistency in large pharmacogenomic studies. Nature. 2013;50:389–393. doi: 10.1038/nature12831. [DOI] [PMC free article] [PubMed] [Google Scholar]
- Hao J, Zhang Y, Deng M, Ye R, Zhao S, Wang Y, Li J, Zhao Z. MicroRNA control of epithelial-mesenchymal transition in cancer stem cells. Int J Cancer. 2014;135:1019–1027. doi: 10.1002/ijc.28761. [DOI] [PubMed] [Google Scholar]
- Hellner K, Mar J, Fang F, Quackenbush J, Munger K. HPV16 E7 oncogene expression in normal human epithelial cells causes molecular changes indicative of an epithelial to mesenchymal transition. Virology. 2009;391:57–63. doi: 10.1016/j.virol.2009.05.036. [DOI] [PMC free article] [PubMed] [Google Scholar]
- Hollestelle A, Nagel JH, Smid M, Lam S, Elstrodt F, Wasielewski M, Ng SS, French PJ, Peeters JK, Rozendaal MJ, et al. Distinct gene mutation profiles among luminal-type and basal-type breast cancer cell lines. Breast Cancer Res Treat. 2010;121:53–64. doi: 10.1007/s10549-009-0460-8. [DOI] [PubMed] [Google Scholar]
- Horak CE, Pusztai L, Xing G, Trifan OC, Saura C, Tseng LM, Chan S, Welcher R, Liu D. Biomarker analysis of neoadjuvant doxorubicin/cyclophosphamide followed by ixabepilone or Paclitaxel in early-stage breast cancer. Clin Cancer Res. 2013;19:1587–1595. doi: 10.1158/1078-0432.CCR-12-1359. [DOI] [PubMed] [Google Scholar]
- Hrstka R, Nenutil R, Fourtouna A, Maslon MM, Naughton C, Langdon S, Murray E, Larionov A, Petrakova K, Muller P, et al. The pro-metastatic protein anterior gradient-2 predicts poor prognosis in tamoxifen-treated breast cancers. Oncogene. 2010;29:4838–4847. doi: 10.1038/onc.2010.228. [DOI] [PubMed] [Google Scholar]
- Huang RY, Chung VY, Thiery JP. Targeting pathways contributing to epithelial-mesenchymal transition (EMT) in epithelial ovarian cancer. Curr Drug Targets. 2012;13:1649–1653. doi: 10.2174/138945012803530044. [DOI] [PubMed] [Google Scholar]
- Huang RY, Wong MK, Tan TZ, Kuay KT, Ng AHC, Chung VY, Chu Y-S, Matsumura N, Lai H-C, Lee YF, et al. An EMT Spectrum defines an anoikis resistant and spheroidogenic Intermediate Mesenchymal state that is sensitive to E-cadherin restoration by a Src-kinase inhibitor, Saracatinib (AZD0530) Cell Death Dis. 2013;4:e915. doi: 10.1038/cddis.2013.442. [DOI] [PMC free article] [PubMed] [Google Scholar]
- Huang da W, Sherman BT, Lempicki RA. Systematic and integrative analysis of large gene lists using DAVID bioinformatics resources. Nat Protoc. 2009;4:44–57. doi: 10.1038/nprot.2008.211. [DOI] [PubMed] [Google Scholar]
- Ishitobi M, Okumura Y, Arima N, Yoshida A, Nakatsukasa K, Iwase T, Shien T, Masuda N, Tanaka S, Tanabe M, et al. Breast cancer subtype and distant recurrence after ipsilateral breast tumor recurrence. Ann Surg Oncol. 2013;20:1886–1892. doi: 10.1245/s10434-012-2825-1. [DOI] [PubMed] [Google Scholar]
- Johnson WE, Li C, Rabinovic A. Adjusting batch effects in microarray expression data using empirical Bayes methods. Biostatistics. 2007;8:118–127. doi: 10.1093/biostatistics/kxj037. [DOI] [PubMed] [Google Scholar]
- Jordan NV, Johnson GL, Abell AN. Tracking the intermediate stages of epithelial-mesenchymal transition in epithelial stem cells and cancer. Cell Cycle. 2011;10:2865–2873. doi: 10.4161/cc.10.17.17188. [DOI] [PMC free article] [PubMed] [Google Scholar]
- Knudsen S, Jensen T, Hansen A, Mazin W, Lindemann J, Kuter I, Laing N, Anderson E. Development and validation of a gene expression score that predicts response to fulvestrant in breast cancer patients. PLoS ONE. 2014;9:e87415. doi: 10.1371/journal.pone.0087415. [DOI] [PMC free article] [PubMed] [Google Scholar]
- Kong D, Li Y, Wang Z, Sarkar FH. Cancer stem cells and epithelial-to-mesenchymal transition (EMT)-phenotypic cells: are they cousins or twins? Cancers (Basel) 2011;3:716–729. doi: 10.3390/cancers30100716. [DOI] [PMC free article] [PubMed] [Google Scholar]
- Korde LA, Lusa L, McShane L, Lebowitz PF, Lukes L, Camphausen K, Parker JS, Swain SM, Hunter K, Zujewski JA. Gene expression pathway analysis to predict response to neoadjuvant docetaxel and capecitabine for breast cancer. Breast Cancer Res Treat. 2010;119:685–699. doi: 10.1007/s10549-009-0651-3. [DOI] [PMC free article] [PubMed] [Google Scholar]
- Lee JM, Dedhar S, Kalluri R, Thompson EW. The epithelial-mesenchymal transition: new insights in signaling, development, and disease. J Cell Biol. 2006;172:973–981. doi: 10.1083/jcb.200601018. [DOI] [PMC free article] [PubMed] [Google Scholar]
- Lee K, Nelson CM. New insights into the regulation of epithelial-mesenchymal transition and tissue fibrosis. Int Rev Cell Mol Biol. 2012;294:171–221. doi: 10.1016/B978-0-12-394305-7.00004-5. [DOI] [PubMed] [Google Scholar]
- Lehmann BD, Bauer JA, Chen X, Sanders ME, Chakravarthy AB, Shyr Y, Pietenpol JA. Identification of human triple-negative breast cancer subtypes and preclinical models for selection of targeted therapies. J Clin Invest. 2011;121:2750–2767. doi: 10.1172/JCI45014. [DOI] [PMC free article] [PubMed] [Google Scholar]
- Lim E, Vaillant F, Wu D, Forrest NC, Pal B, Hart AH, Asselin-Labat ML, Gyorki DE, Ward T, Partanen A, et al. Aberrant luminal progenitors as the candidate target population for basal tumor development in BRCA1 mutation carriers. Nat Med. 2009;15:907–913. doi: 10.1038/nm.2000. [DOI] [PubMed] [Google Scholar]
- Lim J, Thiery JP. Epithelial-mesenchymal transitions: insights from development. Development. 2012;139:3471–3486. doi: 10.1242/dev.071209. [DOI] [PubMed] [Google Scholar]
- Liu S, Cong Y, Wang D, Sun Y, Deng L, Liu Y, Martin-Trevino R, Shang L, McDermott SP, Landis MD, et al. Breast cancer stem cells transition between epithelial and mesenchymal states reflective of their normal counterparts. Stem Cell Rep. 2014;2:78–91. doi: 10.1016/j.stemcr.2013.11.009. [DOI] [PMC free article] [PubMed] [Google Scholar]
- Loboda A, Nebozhyn MV, Watters JW, Buser CA, Shaw PM, Huang PS, Van't Veer L, Tollenaar RA, Jackson DB, Agrawal D, et al. EMT is the dominant program in human colon cancer. BMC Med Genomics. 2011;4:9. doi: 10.1186/1755-8794-4-9. [DOI] [PMC free article] [PubMed] [Google Scholar]
- Malizia AP, Lacey N, Walls D, Egan JJ, Doran PP. CUX1/Wnt signaling regulates epithelial mesenchymal transition in EBV infected epithelial cells. Exp Cell Res. 2009;315:1819–1831. doi: 10.1016/j.yexcr.2009.04.001. [DOI] [PubMed] [Google Scholar]
- Marchini S, Fruscio R, Clivio L, Beltrame L, Porcu L, Nerini IF, Cavalieri D, Chiorino G, Cattoretti G, Mangioni C, et al. Resistance to platinum-based chemotherapy is associated with epithelial to mesenchymal transition in epithelial ovarian cancer. Eur J Cancer. 2013;49:520–530. doi: 10.1016/j.ejca.2012.06.026. [DOI] [PubMed] [Google Scholar]
- Massarweh S, Tham YL, Huang J, Sexton K, Weiss H, Tsimelzon A, Beyer A, Rimawi M, Cai WY, Hilsenbeck S, et al. A phase II neoadjuvant trial of anastrozole, fulvestrant, and gefitinib in patients with newly diagnosed estrogen receptor positive breast cancer. Breast Cancer Res Treat. 2011;129:819–827. doi: 10.1007/s10549-011-1679-8. [DOI] [PMC free article] [PubMed] [Google Scholar]
- Masters JR, Koberle B. Curing metastatic cancer: lessons from testicular germ-cell tumours. Nat Rev Cancer. 2003;3:517–525. doi: 10.1038/nrc1120. [DOI] [PubMed] [Google Scholar]
- Maupin KA, Sinha A, Eugster E, Miller J, Ross J, Paulino V, Keshamouni VG, Tran N, Berens M, Webb C, et al. Glycogene expression alterations associated with pancreatic cancer epithelial-mesenchymal transition in complementary model systems. PLoS ONE. 2010;5:e13002. doi: 10.1371/journal.pone.0013002. [DOI] [PMC free article] [PubMed] [Google Scholar]
- Miow QH, Tan TZ, Ye J, Lau JA, Yokomizo T, Thiery J-P, Mori S. Epithelial-mesenchymal status renders differential responses to cisplatin in ovarian cancer. Oncogene. 2014 doi: 10.1038/onc.2014.136. doi: 10.1038/onc.2014.136. [DOI] [PubMed] [Google Scholar]
- Molyneux G, Geyer FC, Magnay FA, McCarthy A, Kendrick H, Natrajan R, Mackay A, Grigoriadis A, Tutt A, Ashworth A, et al. BRCA1 basal-like breast cancers originate from luminal epithelial progenitors and not from basal stem cells. Cell Stem Cell. 2010;7:403–417. doi: 10.1016/j.stem.2010.07.010. [DOI] [PubMed] [Google Scholar]
- Mulligan G, Mitsiades C, Bryant B, Zhan F, Chng WJ, Roels S, Koenig E, Fergus A, Huang Y, Richardson P, et al. Gene expression profiling and correlation with outcome in clinical trials of the proteasome inhibitor bortezomib. Blood. 2007;109:3177–3188. doi: 10.1182/blood-2006-09-044974. [DOI] [PubMed] [Google Scholar]
- Nakaya Y, Sheng G. EMT in developmental morphogenesis. Cancer Lett. 2013;341:9–15. doi: 10.1016/j.canlet.2013.02.037. [DOI] [PubMed] [Google Scholar]
- Ocana OH, Corcoles R, Fabra A, Moreno-Bueno G, Acloque H, Vega S, Barrallo-Gimeno A, Cano A, Nieto MA. Metastatic colonization requires the repression of the epithelial-mesenchymal transition inducer Prrx1. Cancer Cell. 2012;22:709–724. doi: 10.1016/j.ccr.2012.10.012. [DOI] [PubMed] [Google Scholar]
- Ohashi S, Natsuizaka M, Naganuma S, Kagawa S, Kimura S, Itoh H, Kalman RA, Nakagawa M, Darling DS, Basu D, et al. A NOTCH3-mediated squamous cell differentiation program limits expansion of EMT-competent cells that express the ZEB transcription factors. Cancer Res. 2011;71:6836–6847. doi: 10.1158/0008-5472.CAN-11-0846. [DOI] [PMC free article] [PubMed] [Google Scholar]
- Onder TT, Gupta PB, Mani SA, Yang J, Lander ES, Weinberg RA. Loss of E-cadherin promotes metastasis via multiple downstream transcriptional pathways. Cancer Res. 2008;68:3645–3654. doi: 10.1158/0008-5472.CAN-07-2938. [DOI] [PubMed] [Google Scholar]
- Prat A, Parker JS, Karginova O, Fan C, Livasy C, Herschkowitz JI, He X, Perou CM. Phenotypic and molecular characterization of the claudin-low intrinsic subtype of breast cancer. Breast Cancer Res. 2010;12:R68. doi: 10.1186/bcr2635. [DOI] [PMC free article] [PubMed] [Google Scholar]
- Park ES, Kim SJ, Kim SW, Yoon SL, Leem SH, Kim SB, Kim SM, Park YY, Cheong JH, Woo HG, et al. Cross-species hybridization of microarrays for studying tumor transcriptome of brain metastasis. Proc Natl Acad Sci U S A. 2011;108:17456–17461. doi: 10.1073/pnas.1114210108. [DOI] [PMC free article] [PubMed] [Google Scholar]
- Prat A, Bianchini G, Thomas M, Belousov A, Cheang MC, Koehler A, Gomez P, Semiglazov V, Eiermann W, Tjulandin S, et al. Research-based PAM50 subtype predictor identifies higher responses and improved survival outcomes in HER2-positive breast cancer in the NOAH study. Clin Cancer Res. 2014;20:511–521. doi: 10.1158/1078-0432.CCR-13-0239. [DOI] [PubMed] [Google Scholar]
- Prat A, Perou CM. Deconstructing the molecular portraits of breast cancer. Mol Oncol. 2011;5:5–23. doi: 10.1016/j.molonc.2010.11.003. [DOI] [PMC free article] [PubMed] [Google Scholar]
- Sarrio D, Rodriguez-Pinilla SM, Hardisson D, Cano A, Moreno-Bueno G, Palacios J. Epithelial-mesenchymal transition in breast cancer relates to the basal-like phenotype. Cancer Res. 2008;68:989–997. doi: 10.1158/0008-5472.CAN-07-2017. [DOI] [PubMed] [Google Scholar]
- Sethi S, Macoska J, Chen W, Sarkar FH. Molecular signature of epithelial-mesenchymal transition (EMT) in human prostate cancer bone metastasis. Am J Transl Res. 2010;3:90–99. [PMC free article] [PubMed] [Google Scholar]
- Silver DP, Richardson AL, Eklund AC, Wang ZC, Szallasi Z, Li Q, Juul N, Leong CO, Calogrias D, Buraimoh A, et al. Efficacy of neoadjuvant Cisplatin in triple-negative breast cancer. J Clin Oncol. 2010;28:1145–1153. doi: 10.1200/JCO.2009.22.4725. [DOI] [PMC free article] [PubMed] [Google Scholar]
- Subramanian A, Tamayo P, Mootha VK, Mukherjee S, Ebert BL, Gillette MA, Paulovich A, Pomeroy SL, Golub TR, Lander ES, et al. Gene set enrichment analysis: a knowledge-based approach for interpreting genome-wide expression profiles. Proc Natl Acad Sci U S A. 2005;102:15545–15550. doi: 10.1073/pnas.0506580102. [DOI] [PMC free article] [PubMed] [Google Scholar]
- Taddei I, Deugnier MA, Faraldo MM, Petit V, Bouvard D, Medina D, Fassler R, Thiery JP, Glukhova MA. Beta1 integrin deletion from the basal compartment of the mammary epithelium affects stem cells. Nat Cell Biol. 2008;10:716–722. doi: 10.1038/ncb1734. [DOI] [PMC free article] [PubMed] [Google Scholar]
- Tam WL, Weinberg RA. The epigenetics of epithelial-mesenchymal plasticity in cancer. Nat Med. 2013;19:1438–1449. doi: 10.1038/nm.3336. [DOI] [PMC free article] [PubMed] [Google Scholar]
- Tan IB, Ivanova T, Lim KH, Ong CW, Deng N, Lee J, Tan SH, Wu J, Lee MH, Ooi CH, et al. Intrinsic subtypes of gastric cancer, based on gene expression pattern, predict survival and respond differently to chemotherapy. Gastroenterology. 2011;141:476–485. doi: 10.1053/j.gastro.2011.04.042. [DOI] [PMC free article] [PubMed] [Google Scholar]
- Tan TZ, Miow QH, Huang RY, Wong MK, Ye J, Lau JA, Wu MC, Bin Abdul Hadi LH, Soong R, Choolani M, et al. Functional genomics identifies five distinct molecular subtypes with clinical relevance and pathways for growth control in epithelial ovarian cancer. EMBO Mol Med. 2013;5:983–998. doi: 10.1002/emmm.201201823. [DOI] [PMC free article] [PubMed] [Google Scholar]
- Taube JH, Herschkowitz JI, Komurov K, Zhou AY, Gupta S, Yang J, Hartwell K, Onder TT, Gupta PB, Evans KW, et al. Core epithelial-to-mesenchymal transition interactome gene-expression signature is associated with claudin-low and metaplastic breast cancer subtypes. Proc Natl Acad Sci U S A. 2010;107:15449–15454. doi: 10.1073/pnas.1004900107. [DOI] [PMC free article] [PubMed] [Google Scholar]
- The Cancer Genome Atlas. Integrated genomic analyses of ovarian carcinoma. Nature. 2011;474:609–615. doi: 10.1038/nature10166. [DOI] [PMC free article] [PubMed] [Google Scholar]
- Thiery JP. Epithelial-mesenchymal transitions in tumour progression. Nat Rev Cancer. 2002;2:442–454. doi: 10.1038/nrc822. [DOI] [PubMed] [Google Scholar]
- Thiery JP, Acloque H, Huang RY, Nieto MA. Epithelial-mesenchymal transitions in development and disease. Cell. 2009;139:871–890. doi: 10.1016/j.cell.2009.11.007. [DOI] [PubMed] [Google Scholar]
- Thiery JP, Lim CT. Tumor dissemination: an EMT affair. Cancer Cell. 2013;23:272–273. doi: 10.1016/j.ccr.2013.03.004. [DOI] [PubMed] [Google Scholar]
- Tomkiewicz C, Hans S, Mucchielli MH, Agier N, Delacroix H, Marisa L, Brasnu D, Aggerbeck LP, Badoual C, Barouki R, et al. A head and neck cancer tumor response-specific gene signature for cisplatin, 5-fluorouracil induction chemotherapy fails with added taxanes. PLoS ONE. 2012;7:e47170. doi: 10.1371/journal.pone.0047170. [DOI] [PMC free article] [PubMed] [Google Scholar]
- Tsai JH, Donaher JL, Murphy DA, Chau S, Yang J. Spatiotemporal regulation of epithelial-mesenchymal transition is essential for squamous cell carcinoma metastasis. Cancer Cell. 2012;22:725–736. doi: 10.1016/j.ccr.2012.09.022. [DOI] [PMC free article] [PubMed] [Google Scholar]
- Tusher VG, Tibshirani R, Chu G. Significance analysis of microarrays applied to the ionizing radiation response. Proc Natl Acad Sci U S A. 2001;98:5116–5121. doi: 10.1073/pnas.091062498. [DOI] [PMC free article] [PubMed] [Google Scholar]
- Valastyan S, Weinberg RA. Tumor metastasis: molecular insights and evolving paradigms. Cell. 2011;147:275–292. doi: 10.1016/j.cell.2011.09.024. [DOI] [PMC free article] [PubMed] [Google Scholar]
- Van den Eynden GG, Majeed AW, Illemann M, Vermeulen PB, Bird NC, Hoyer-Hansen G, Eefsen RL, Reynolds AR, Brodt P. The multifaceted role of the microenvironment in liver metastasis: biology and clinical implications. Cancer Res. 2013;73:2031–2043. doi: 10.1158/0008-5472.CAN-12-3931. [DOI] [PubMed] [Google Scholar]
- Verhaak RG, Tamayo P, Yang JY, Hubbard D, Zhang H, Creighton CJ, Fereday S, Lawrence M, Carter SL, Mermel CH, et al. Prognostically relevant gene signatures of high-grade serous ovarian carcinoma. J Clin Invest. 2013;123:517–525. doi: 10.1172/JCI65833. [DOI] [PMC free article] [PubMed] [Google Scholar]
- Wang W, Goswami S, Lapidus K, Wells AL, Wyckoff JB, Sahai E, Singer RH, Segall JE, Condeelis JS. Identification and testing of a gene expression signature of invasive carcinoma cells within primary mammary tumors. Cancer Res. 2004;64:8585–8594. doi: 10.1158/0008-5472.CAN-04-1136. [DOI] [PubMed] [Google Scholar]
- Witta SE, Gemmill RM, Hirsch FR, Coldren CD, Hedman K, Ravdel L, Helfrich B, Dziadziuszko R, Chan DC, Sugita M, et al. Restoring E-cadherin expression increases sensitivity to epidermal growth factor receptor inhibitors in lung cancer cell lines. Cancer Res. 2006;66:944–950. doi: 10.1158/0008-5472.CAN-05-1988. [DOI] [PubMed] [Google Scholar]
- Yanagawa J, Walser TC, Zhu LX, Hong L, Fishbein MC, Mah V, Chia D, Goodglick L, Elashoff DA, Luo J, et al. Snail promotes CXCR2 ligand-dependent tumor progression in non-small cell lung carcinoma. Clin Cancer Res. 2009;15:6820–6829. doi: 10.1158/1078-0432.CCR-09-1558. [DOI] [PMC free article] [PubMed] [Google Scholar]
- Yu M, Bardia A, Wittner BS, Stott SL, Smas ME, Ting DT, Isakoff SJ, Ciciliano JC, Wells MN, Shah AM, et al. Circulating breast tumor cells exhibit dynamic changes in epithelial and mesenchymal composition. Science. 2013;339:580–584. doi: 10.1126/science.1228522. [DOI] [PMC free article] [PubMed] [Google Scholar]
- Zhang J, Ma L. MicroRNA control of epithelial-mesenchymal transition and metastasis. Cancer Metastasis Rev. 2012;31:653–662. doi: 10.1007/s10555-012-9368-6. [DOI] [PMC free article] [PubMed] [Google Scholar]
- Zhang JX, Wei J, Lu J, Tong Z, Liao B, Yu B, Zheng F, Huang X, Chen Z, Fang Y, et al. Overexpression of Rab25 contributes to metastasis of bladder cancer through induction of epithelial-mesenchymal transition and activation of Akt/GSK-3beta/Snail signaling. Carcinogenesis. 2013;34:2401–2408. doi: 10.1093/carcin/bgt187. [DOI] [PubMed] [Google Scholar]
Associated Data
This section collects any data citations, data availability statements, or supplementary materials included in this article.