

Abstract
Background
The purpose of low-vision rehabilitation is to allow people to resume or to continue to perform daily living tasks, with reading being one of the most important. This is achieved by providing appropriate optical devices and special training in the use of residual-vision and low-vision aids, which range from simple optical magnifiers to high-magnification video magnifiers.
Objectives
To assess the effects of reading aids for adults with low vision.
Search methods
We searched CENTRAL (which contains the Cochrane Eyes and Vision Group Trials Register) (The Cochrane Library 2013, Issue 1), Ovid MEDLINE, Ovid MEDLINE In-Process and Other Non-Indexed Citations, Ovid MEDLINE Daily, Ovid OLDMEDLINE, (January 1950 to January 2013), EMBASE (January 1980 to January 2013), Latin American and Caribbean Literature on Health Sciences (LILACS) (January 1982 to January 2013), OpenGrey (System for Information on Grey Literature in Europe) (www.opengrey.eu/), the metaRegister of Controlled Trials (mRCT) (www.controlled-trials.com), ClinicalTrials.gov (www.clinicaltrials.gov/) and the WHO International Clinical Trials Registry Platform (ICTRP) (www.who.int/ictrp/search/en). We did not use any date or language restrictions in the electronic searches for trials. We last searched the electronic databases on 31 January 2013. We searched the reference lists of relevant articles and used the Science Citation Index to find articles that cited the included studies and contacted investigators and manufacturers of low-vision aids. We handsearched the British Journal of Visual Impairment from 1983 to 1999 and the Journal of Visual Impairment and Blindness from 1976 to 1991.
Selection criteria
This review includes randomised and quasi-randomised trials in which any device or aid used for reading had been compared to another device or aid in people aged 16 or over with low vision as defined by the study investigators.
Data collection and analysis
At least two authors independently assessed trial quality and extracted data.
Main results
We included nine small studies with a cross-over-like design (181 people overall) and one study with three parallel arms (243 participants) in the review. All studies reported the primary outcome, results for reading speed.
Two studies including 92 participants found moderate- or low-quality evidence suggesting that reading speed is higher with stand-mounted electronic devices or electronic devices with the camera mounted in a ‘mouse’ than with optical magnifiers, which in these trials were generally stand-mounted or, less frequently, hand-held magnifiers or microscopic lenses. In another study of 20 participants there was moderate-quality evidence that optical devices are better than head-mounted electronic devices (four types).
There was low-quality evidence from three studies (93 participants) that reading using head-mounted electronic devices is slower than with stand-based electronic devices. The technology of electronic devices may have changed and improved since these studies were conducted.
One study suggested no difference between a diffractive spectacle-mounted magnifier and either refractive (15 participants) or aplanatic (15 participants) magnifiers.
One study of 10 people suggested that several overlay coloured filters were no better and possibly worse than a clear filter.
A parallel-arm study including 243 participants with age-related macular degeneration found that custom or standard prism spectacles were no different from conventional reading spectacles, although the data did not allow precise estimates of performance to be made.
Authors' conclusions
There is insufficient evidence on the effect of different types of low-vision aids on reading performance. It would be necessary to investigate which patient characteristics predict performance with different devices, including costly electronic devices. Better-quality research should also focus on assessing sustained long-term use of each device. Authors of studies testing several devices on the same person should consider design and reporting issues related to their sequential presentation and to the cross-over-like study design.
Medical Subject Headings (MeSH): *Reading, *Sensory Aids, Eyeglasses, Lenses, Macular Degeneration [complications], Optical Devices [*standards], Randomized Controlled Trials as Topic, Vision, Low [*rehabilitation], Visual Acuity, Visually Impaired Persons [*rehabilitation]
MeSH check words: Adult, Humans
Background
Description of the condition
There is no single globally-accepted definition of low vision (also known as partial sight, visual impairment and subnormal vision). However, there is general consensus that low vision is an uncorrectable loss of vision that interferes with daily activities. Definitions normally incorporate an estimate of visual loss in terms of impairment (e.g. measuring visual acuity or visual fields), or in terms of disability (measuring the ability to perform a certain task). One such definition states that low vision is the inability to read a newspaper at a normal reading distance (40 cm) with best refractive correction (Legge 1991).
The World Health Organization (WHO) has established criteria for low vision which are used in the International Classification of Diseases (WHO 2010). Low vision is defined as a best-corrected visual acuity worse than 0.5 logMAR (Snellen 6/18 or 20/60) but equal to or better than 1.3 logMAR (3/60 or 20/400) in the better eye, or visual field loss corresponding to less than 20 degrees in the better eye with best possible correction. Blindness is defined as a best-corrected visual acuity worse than 1.3 logMAR or a visual field no greater than10 degrees around central fixation in the better eye with best possible correction. Visual impairment includes low vision as well as blindness. In the United States, legal blindness is defined as a visual acuity of 1.0 logMAR (6/60 or 20/200) or worse in the better eye.
Blindness is one of the most common disabilities (Congdon 2003): an estimated 39 million people were blind a decade ago, i.e. at the time of the last accurate assessment (Pascolini 2011). Among people older than 40 years in the USA, 937,000 were blind in 2002. Figures for the developing world, where 90% of world blindness exists, and for the developed world are expected to increase significantly during the next decades as the world's population ages. Causes of blindness are associated with race and ethnicity in the USA (Congdon 2004): age-related macular degeneration (AMD) is the most common cause in white people, whereas cataract, glaucoma and diabetic retinopathy are the leading causes in Hispanic and black people. Different treatable or preventable conditions are the most frequent causes of blindness in developing countries: infectious disease, nutritional causes, and especially cataract and refractive error (Congdon 2003; Pascolini 2011).
In industrialised countries, low vision is found principally in the 75+ age group (Margrain 1999; Tielsch 1990) and has been ranked third behind arthritis and heart disease among conditions that cause people older than 70 years to need assistance in activities of daily living (Scott 1999). The aging population, combined with the dramatic increase in visual impairment in the older age groups, explains the significant increase seen in the demand for low-vision services.
Description of the intervention
The purpose of low-vision rehabilitation is to allow the person to resume or to continue to perform daily living tasks. This is achieved by providing appropriate optical devices, environmental modifications and special training in the use of residual vision and use of low-vision aids (Massof 1998). Without rehabilitation people with decreased visual acuity often abandon reading and other tasks requiring detailed vision. For individuals with extensive loss of visual field, orientation and mobility can become difficult. For a person with low vision, reading has been identified as one of the most important tasks or goals to achieve (Leat 1994; Shuttleworth 1995). People using low-vision aids have reported improvements in reading a specific letter size both during distance and near work and have found optical aids useful to perform tasks (Humphry 1986; Nilsson 1990; Virtanen 1991). A low-vision aid (LVA) is any device that enables a person with low vision to improve visual performance.
Common optical low-vision devices or aids include:
magnifiers - these sometimes have their own illumination and are either battery-powered or rechargeable from mains electricity. They may be hand-held or mounted on a stand or on spectacles;
telescopes - for work where the reading matter is distant, a telescope can be mounted on a spectacle frame. This gives a longer working distance, although less can be seen at one time because the field is necessarily restricted. Telescopes may also be hand-held.
Electronic aids include primarily closed-circuit television and other readers incorporating a monitor or an LCD screen, which provide improved contrast and magnification.
How the intervention might work
Like many types of rehabilitation, low-vision rehabilitation includes heterogeneous interventions, which may have several components. Moreover, people who are prescribed a low-vision device usually receive training to use it. Several training techniques are employed, often using both office- and home-based exercises with the device for a few hours in different sessions. Overall, modern rehabilitation services tend to be provided by multidisciplinary services (Langelaan 2007). Besides prescription of LVAs and training on their use, especially focused on reading tasks, services can provide psychological support, home environmental assessment, and, for people of working age, social worker support. Moreover, different types of follow-up are provided, either in low-vision clinics or at home, by several types of professionals.
As was intended, this review concentrates on reading aids that magnify text, sometimes also improving its contrast.
Why it is important to do this review
The most suitable device depends on the person's needs and the visual functioning they have. Rehabilitation should be tailored to correspond to the type of visual loss and may also be modified by the individual's choice or expectations or by more general cultural demands (Dickinson 1998; Margrain 1999). Besides the level of magnification, there are other factors that are important when choosing an optical device, such as ease of use and cosmetic appearance. Devices may be rejected if they have an unusual cosmetic appearance that call attention to the person's disability.
Reading is an extremely complex visual task, which involves the integration of visual, cognitive, and motor processes. In everyday reading, it is important for people to achieve their optimal reading rate (measured usually in words per minute), and, for people with low vision, a speed that is sufficient to complete the task within an acceptable amount of time. The effect of slow reading on comprehension is variable, as low reading speed was found to decrease comprehension by Dickinson 1998 but not by Legge 1989.
Given the availability of a wide range of aids from simple magnifiers to high-power video magnifiers, all of which have advantages and disadvantages, an assessment of their effects on reading would be very useful.
Objectives
The objective of this review is to assess the effects of reading aids for adults with low vision. We consider reading aids that maximise the person's visual reading capacity, e.g. by increasing image magnification (optical and electronic magnifiers), augmenting text contrast (coloured filters), or trying to optimise the viewing angle or gaze position (such as prisms). We have not included studies investigating reading aids that allow reading through hearing, such as talking books or screen readers, or through touch, such as Braille-based devices. Finally, we did not consider rehabilitation strategies or complex low-vision interventions.
Methods
Criteria for considering studies for this review
Types of studies
We included randomised and quasi-randomised trials.
Types of participants
We included trials in which participants were aged 16 or over with low vision as defined by the study investigators. Where possible we grouped participants according to the type or cause of visual impairment.
Types of interventions
We included trials in which any device or aid used for reading visually was compared to another device or aid. This included non-electronic aids, i.e. optical devices such as magnifiers and telescopes, and electronic aids such as several types of closed circuit television (CCTV). These devices are rated in terms of the equivalent power measured in diopters, which allows devices to be compared to each other (Sloan 1971). We also considered other low-vision aids (LVAs) such as coloured filters and optical prisms, which are commonly prescribed in low-vision rehabilitation as they are supposed to improve reading in some people.
We excluded trials in which the intervention is a device to read though hearing, such as screen readers or talking books, or through touch, such as Braille-based devices.
Types of outcome measures
Using World Health Organization (WHO) language on Functioning, Disability and Health (accessed at WHO website on July 17th, 2011), maximum reading speed and reading acuity under ideal conditions of text magnification and contrast, such as when using the Minnesota Low-Vision Reading test (MNREAD), is the person's capacity. Capacity may be partly an individual trait (slow or fast reader) and can be limited by several visually and non-visually impairing diseases. Vision-based reading aids aim at maximising the person's performance by compensating their diminished visual function, especially by magnification. The choice of outcome measures in this review is driven by its emphasis on the vision-related component of performance.
Research on psychophysics of reading has shown that reading speed is typically stable across a range of print sizes (maximum reading speed) that are larger than a certain threshold (critical print size), whereas at smaller print sizes, below the critical print size, the reading speed slows and the reading acuity limit is reached (Ahn 1995a; Ahn 1995b; Legge 1985a; Legge 2007). Font size at critical print size is usually two or three times larger than reading acuity. A similar pattern is also found in most people with low vision (Legge 1985b; Legge 2007). A plot of reading speed against font size (adjusted by reading distance and expressed in logMAR) can be obtained using reading charts such as the MNREAD charts (Legge 2007). The following definitions developed by the authors of the MNREAD charts (Ahn 1995a) are adopted in the updated version of this review:
READING ACUITY: the smallest print that the person can read without making significant errors;
CRITICAL PRINT SIZE: the smallest print that the person can read with maximum speed;
MAXIMUM READING SPEED: the person's reading speed when reading is not limited by print size, i.e. for print size larger than the critical print size.
The issue of measuring reading performance in LVA research has been recently reviewed in Rubin 2013, He found that the methods for assessing reading performance and the algorithms for scoring reading tests need to be optimised so that the reliability and responsiveness of reading tests can be improved. A broader perspective on outcome measures, including quality of life measures, is also included in a systematic review on effectiveness of low vision service provision (Binns 2012).
Primary outcomes
In the 2013 update of this review, we decided to change our primary outcome, as defined in the original protocol (reading speed), by including print size in its definition in order to make it more similar to real-world tasks. The primary outcome for this updated version was reading speed in words per minute, recorded using typical point size (i.e. approximately 10 to 14 point size), in books or newspapers.
Maximum reading speed recorded across a range of point sizes, using MNREAD or Bailey-Lovie charts, was also accepted. However, it may be unclear, unless specified, whether maximum reading speed is achieved for common book text size with each reading aid. Thus, we rated studies reporting only maximum reading speed as providing indirect evidence regarding the primary outcome of this review.
Secondary outcomes
The review conclusions were based on the primary outcome, whereas secondary outcomes were mainly assessed for consistency with the primary outcome. Secondary outcomes include:
reading duration in minutes; defined as the time the person could read without visual discomfort causing the need to take a pause;
reading acuity in logMAR; because this is mostly a function of magnification, we analyse this outcome only if devices are matched by magnification (e.g. a difference between unmatched electronic and optical aids needs no demonstration);
ease and frequency of use as reported by the participants;
quality of life as measured by any validated scale that aims to measure the impact of visual function loss on quality of life;
reported adverse outcomes.
Search methods for identification of studies
Electronic searches
We searched the Cochrane Central Register of Controlled Trials (CENTRAL) 2013, Issue 1, part of The Cochrane Library. www.thecochranelibrary.com (accessed 31 January 2013), Ovid MEDLINE, Ovid MEDLINE In-Process and Other Non-Indexed Citations, Ovid MEDLINE Daily, Ovid OLDMED-LINE, (January 1950 to January 2013), EMBASE (January 1980 to January 2013), Latin American and Caribbean Literature on Health Sciences (LILACS) (January 1982 to January 2013), OpenGrey (System for Information on Grey Literature in Europe) (www.opengrey.eu/), the metaRegister of Controlled Trials (mRCT) (www.controlled-trials.com), ClinicalTrials.gov (www.clinicaltrials.gov/) and the WHO International Clinical Trials Registry Platform (ICTRP) (www.who.int/ictrp/search/en). We did not use any date or language restrictions in the electronic searches for trials. We last searched the electronic databases on 31 January 2013.
See: Appendices for details of search strategies for CENTRAL (Appendix 1), MEDLINE (Appendix 2), EMBASE (Appendix 3), LILACS (Appendix 4), OpenGrey (Appendix 5), mRCT (Appendix 6), ClinicalTrials.gov (Appendix 7) and the ICTRP (Appendix 8).
Searching other resources
We handsearched the British Journal of Visual Impairment from 1983 to 1999 and the Journal of Visual Impairment and Blindness from 1976 to 1991 for relevant trials. We searched the reference lists of relevant articles to find additional trials. We used the Science Citation Index to find articles that cited relevant articles. We contacted investigators and manufacturers of low-vision aids to identify other published and unpublished reports.
Data collection and analysis
Selection of studies
Two authors working independently assessed the titles and abstracts resulting from the electronic searches. We obtained the full copy of all relevant or potentially relevant trials and assessed these according to the ‘Criteria for considering studies for this review’. Only trials meeting these criteria were assessed for methodological quality. The authors were not masked to any trial details when making their assessments. We resolved disagreements about whether a trial should be included by discussion and consensus. We attempted to obtain additional information where necessary.
Data extraction and management
Two authors working independently extracted data using a form developed by the Cochrane Eyes and Vision Group using Chapter 7 of the Cochrane Handbook for Systematic Reviews of Interventions (Higgins 2011a). We resolved any discrepancies by discussion. We contacted investigators to obtain missing data where necessary. For three studies, individual data were reported in tables of the publication. These were used for further analyses.
Assessment of risk of bias in included studies
Two authors working independently assessed trial quality according to the methods set out in Chapters 8 and 10 of the Cochrane Handbook for Systematic Reviews of Interventions (Higgins 2011b; Sterne 2011). The following parameters were considered: method of allocation to treatment; allocation concealment (selection bias); documentation of exclusions and completenessof follow-up (attrition bias); selective outcome reporting (reporting bias). Masking of participants, study personnel (performance bias) and outcome assessors (detection bias) was not used in this review since it is not possible with most LVAs. Moreover, masking is meaningless for some outcomes, such as participant's preference for each device. We graded each parameter of trial quality as being at low, high or unclear risk of bias. We contacted study authors for clarification on any item graded as unclear. Authors were not masked to any trial details during the assessment.
Evaluation of cross-over-like studies was an issue in this review. Assessing the performance of the same participant who tries different LVAs is a common study design used by researchers into low vision, and is also known as a ‘within-subject’ design. This is an efficient design since we do not need to allow for all variations which occur between arms of parallel-group studies. In practice this means that, for the same number of participants, a cross-over design is likely to be more powerful. However, cross-over trials are not always appropriate. The most important consideration is whether the participants start the second period in a similar state to how they started the first period. If the characteristics of the participant have changed in some way by the time the second period starts, then the comparison of treatments is not fair, and there will be within-participant variation. Based on The Cochrane Collaboration's Open Learning Additional Module 2, (Alderson 2002) and on Chapter 16 of the Cochrane Handbook for Systematic Reviews of Interventions (Higgins 2011c), the following questions should generally be addressed for a cross-over study:
Is the condition of the participants chronic and stable?
Does the intervention provide temporary relief, and not permanent change?
Can the outcome be repeated in the second period if it occurs in the first?
Might the effect of the first intervention last into the second treatment period?
Does the trial go on long enough for the LVA to be properly used?
In the 2013 update of this review, we applied the new ‘Risk of bias’ tool to rate methodological quality. Assessment of randomisation procedures requires consideration of two components: sequence generation and allocation concealment. A discussion among the authors led to grading both components in cross-over-like studies included in this review as being at low risk of bias. In fact, in low-vision studies adopting a cross-over-like design in this review, all participants used all devices and the order of presentation was randomised. We judged that two questions must be asked to rate the quality of randomisation and allocation in this type of study:
Does knowledge of the first LVA selected affect recruitment into the trial?
Does the order in which the LVAs are used affect the results?
Regarding question 1, the answer should be no, since knowing the order of LVA presentation in the study should not affect recruitment into the trial in studies in which testing with each device is carried out in the same session, which is often referred to by low-vision researchers as ‘within-subject’ design. As to question 2, we considered two additional items: 1) period effect, whether the condition can change during subsequent phases of testing of each device; 2) carry-over effect and period-by-treatment interaction, whether the effect on performance of using a specific device affects the performance of the following. These items will be contextu-alised in the ‘Results’ section.
Measures of treatment effect
We obtained the mean difference (MD) and the standard error (SE) of the MD, referred to as ‘SE (MD)’, when continuous data were available. We then used the generic inverse variance method when dealing with cross-over studies (Higgins 2011c); see also Appendix 9 for details and additional methods used.
Results were summarised in the Summary of Findings table using relative and absolute measures of effect, as recommended in Chapter 11 of the Cochrane Handbook for Systematic Reviews of Interventions (Schünemann 2011).
Methods for future updates to this review
The following methods will be used to analyse studies if sufficient data become available in future updates.
For dichotomous data, results will be expressed as odds ratio (OR) estimates or risk ratio (RR) estimates (with a 95% confidence interval (CI)). Odds ratios will be preferred when event probability is close to one, in order to avoid over-optimistic conclusions associated with RR estimate in such cases. The risk difference or the number needed to treat for an additional beneficial outcome will be obtained, with a 95% CI.
Unit of analysis issues
Participants, rather than eyes, are the unit of analysis in this review. Specific unit of analysis issues were found in studies comparing several devices on the same participant which we dealt with as described in other sections of this review and as shown in Appendix 9. Studies which measure outcome in the better eye will be included, whereas studies adopting eyes rather than individuals as the unit of analysis are excluded.
Dealing with missing data
There was only one parallel-arm trial in this review. Missing data for this study were enumerated for each treatment arm in the Characteristics of included studies table. The concept of missing data is more complex when several devices are tested on the same participant, since the participant may be able to read with some devices but not with others. These issues are related to study inclusion criteria and are discussed in the Results and Discussion sections.
Assessment of heterogeneity
If a sufficient number of studies are found for future updates of this review, we will assess heterogeneity using the I² statistic and its 95% confidence interval according to Chapter 9 of the Cochrane Handbook for Systematic Reviews of Interventions (Deeks 2011b).
Assessment of reporting biases
We considered reporting biases only for reading speed as the primary outcome, since we found it difficult to consider other outcomes not reported in the absence of standard measurements tools, relative to the specific aim of this review.
Data synthesis
We conducted data analysis using Chapter 8 of the Cochrane Handbook for Systematic Reviews of Interventions (Deeks 2011b). Since a cross-over design was found to be common in research on the effectiveness of LVAs, these studies were included in the review provided that the order of presentation of the devices was randomised or quasi-randomised and specific methods were used to deal with them. A number of minor statistical and data extraction issues arose from the fact that nine out of ten studies included in this review compared several devices on the same participant, e.g. methods to handle within-subject correlation and multiplicity of testing. Other items were small sample size issues, data skewness, and the availability of individual patient data in small studies. These items were dealt with using methods suggested in Elbourne 2002 and in Chapter 16 of the Cochrane Handbook for Systematic Reviews of Interventions (Higgins 2011c), as summarised in Appendix 9. These statistical manipulations were based on methods that are unchanged from the first version of this review.
Subgroup analysis and investigation of heterogeneity
If enough studies are found in future updates of this review, we will assess the effect of low-vision severity (e.g. proportion of participants below 20/100 in the better eye), matching of LVAs by magnification versus no matching, participant age (e.g. proportion of people aged 55 years or more), study design (parallel-arm versus ‘within-subject’).
Sensitivity analysis
If a sufficient number of studies are found in future updates, we will conduct sensitivity analyses with the following adjustments:
excluding studies of lower methodological quality (scoring high risk of bias on any parameter of quality);
excluding unpublished studies.
Results
Description of studies
Results of the search
The electronic searches run in July 2006 revealed 488 reports of trials. We screened the titles and abstracts and identified 20 studies which appeared relevant. We obtained full-text copies of these reports and after further assessment we included nine studies and excluded the remaining 11 studies (Figure 1).
Figure 1.
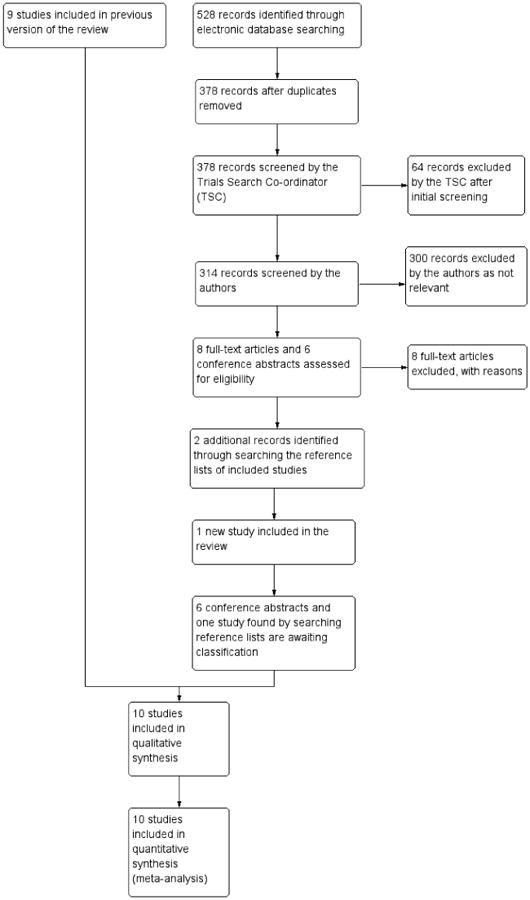
Results from searching for studies for inclusion in the review.
An update search run in January 2013 identified 528 references. The Trials Search Co-ordinator removed 150 duplicates, scanned 378 references and removed 64 records which were not relevant to the scope of the review. We screened 314 references and obtained full-text reports of eight studies; after assessment these studies were excluded. While this review was being updated, we retrieved studies in low-vision research which are conference abstracts. Currently we are unable to identify six full-text reports of studies or make contact with the trialists. Relevant sections from the conference abstracts are shown in the Characteristics of studies awaiting classification. If we are able to collect sufficient data we will assess these studies for potential inclusion in further updates. In addition, handsearching references of other reports used for this review found two studies published in 2005, of which Watson 2005 is now included and Kaida 2005 is under assessment awaiting contact from the author.
Included studies
We included 10 studies in the review (see Characteristics of included studies). A summary of the studies is given below including their methodological quality assessment, which is presented graphically in Figure 2. Interventions, outcome measures and their measurement tools were very variable and are summarised in Table 1.
Figure 2.

Risk of bias summary: review authors' judgements about each risk of bias item for each included study.
Table 1. Description of outcomes in studies.
| Study | LVAs compared | RS measurement | Reading acuity | Reading duration | Subjective preference for specific devices | Quality of life | Other outcomes reported but not included in this review |
|---|---|---|---|---|---|---|---|
| Culham 2004 | 4 electronic head-mounted versus participant's aids or spectacles | Small (N5), typical medium (N10) and large (N20) print size | Bailey-Lovie charts | Reading accuracy, contrast sensitivity (Pelli Robson), daily living tasks: grocery identification (seconds), writing checks (seconds) | |||
| Eperjesi 2004 | Coloured versus clear filter overlays | Rate of Reading Test (print size 4- to 18-point) | not available, but not relevant for filters which do not magnify text | ||||
| Goodrich 2001 | Hand-held CCTV, stand-mounted CCTV versus prescribed optical aid | 1M text (typical print size at 40 cm) | Cumulative time spent reading | Questions on subjective preference | Reading comprehension | ||
| Kleweno 2001 | Head-mounted display versus standard CCTV | Next largest size close to near acuity (MNREAD electronic version) | MNREAD charts | Single question on preference in terms of brightness and clarity | Different contrast/colour condition for cathode ray tube or virtual retinal display | ||
| Ortiz 1999 | Head-mounted display (LVES) versus CCTV | News articles MNREAD | MNREAD charts | Reading comprehension | |||
| Peterson 2003 | Head-mounted display, handheld CCTV, standard CCTV versus the participant's optimum conventional optical magnifier | MNREAD reading speed across several print sizes available in figure | MNREAD-like charts | Single question on subjective ease of use of each magnifier on a 5-step scale | Ability to read specific print sizes (0.2 - 1.0 log-MAR); navigate a text, follow a route on a map, reading medicine bottle label | ||
| Spitzberg 1995 | Mirror, prism or zoom optical magnifiers versus conventional magnifier (same magnification) | 1M or 1.5M print (ordinary print size at 40 cm) | Preference for a specific device | Note: magnification was standardised at 3x for all devices | |||
| Smith 2005 | Custom or standard bilateral prism spectacles versus conventional spectacles | MNREAD reading speed “at the critical print size” | MNREAD charts | MLVQ measuring helpfulness and use | NEI-VFQ25, MLVAI | ||
| Stelmack 1991 | CCTV, illuminated stand magnifier, spectacles | Readers Digest (silent reading) | Reading time without visual discomfort | Reading comprehension | |||
| Watson 2005 | Hybrid-diffractive spectacle magnifier compared with a refractive spectacle magnifier and an aplanatic spectacle magnifier (2 separate experiments) | MNREAD maximum RS with each reading aid; Pepper Visual skills for Reading Test | MNREAD charts | Self report of satisfaction with reading using a visual analogue scale | Reading accuracy, Morgan Low Vision reading Comprehension Assessment |
CCTV: closed circuit television
RS: reading speed
NEI-VFE: National Eye Institute Visual Functioning Questionnaire
MLVAI: Melbourne Low-Vision ADL (Activities of Daily Living) Index
MLVQ: Manchester Low Vision Questionnaire
Design
Nine studies used a ‘within-subject’ design. This design is suitable for testing several aids in each participant during the same or in consecutive examination sessions and essentially corresponds to the classic cross-over design. Studies using rotation of the order of presentation of devices could be considered quasi-randomised (Goodrich 2001; Ortiz 1999; Spitzberg 1995), while randomisation methods were unclear in Watson 2005. Nonetheless, they were scored as being at low risk of bias for reasons given in the Data collection and analysis section of this review. One study (Smith 2005) used a three parallel-arm randomised design.
Participants
All the participants recruited in the trials were from the low-vision service where the trial was conducted. The number of participants randomised in the trials ranged from 10 to 70.
Stelmack 1991 included 37 participants with age-related macular degeneration (AMD) or ocular histoplasmosis.
Spitzberg 1995 evaluated 39 participants from five centres, but did not provide their diagnosis. An unknown proportion of the people in this study did not fit our inclusion criteria since authors report an age range of 9 to 77 years.
Ortiz 1999 assessed 10 participants aged 24 to 79 years with various diseases.
AMD was also the most common disease affecting 22 people in Goodrich 2001.
Kleweno 2001 included 13 participants aged 28 to 59 years with various diseases.
Forty out of 70 people in Peterson 2003 were affected by AMD. Culham 2004 evaluated 10 individuals with AMD and 10 with early-onset macular disease (EOMD).
Eperjesi 2004 studied 10 participants with non-exudative AMD. Smith 2005 included 243 participants with AMD.
Watson 2005 included two groups of 15 participants aged 45 to 89 with macular degeneration or diabetic retinopathy.
Interventions
Several types of low-vision devices were evaluated in the studies retrieved: optical device, mainly stand or hand magnifiers or high-power spectacles; conventional, stand-mounted electronic devices, to which the acronym CCTV refers; hand-held mouse-based electronic device; head-mounted electronic devices (HMD). Prism spectacles were evaluated in one study and diffractive spectacles in another.
Stelmack 1991 compared three types of commonly used magnifiers: (1) CCTV (VTEK Voyager); (2) illuminated stand magnifier in conjunction with a bifocal or reading prescription to compensate for accommodative demand; (3) spectacle reading lenses, either prism half eyes or Aolite microscopes, which were optimised for reading standard point size. Although not specified, there were clear differences in the field of view and working distance between each of these devices.
Spitzberg 1995 compared four devices with the same nominal magnification (3×): (1) a spherical mirror magnifier covering one whole column width of newsprint; (2) a cylindrical mirror magnifier covering one whole page width; (3) a reflecting prism magnifier with a 45 degree viewing angle; (4) a zoom magnifier. There were clear differences in the field of view and working distance between each of these devices, with measurements for these given in the paper.
Ortiz 1999 compared two electronic low-vision aids (LVAs), a head-mounted video magnifier called the Low Vision Enhancement System, and a CCTV. Whether these were matched by field of view was unclear.
Goodrich 2001 assigned participants to three types of aids: (1) a prescribed optical device; (2) a stand-mounted electronic device or CCTV; (3) a hand-held mouse-based electronic device coupled with a 27-inch TV monitor.
Kleweno 2001 examined the performance of an alternative computer visual interface, the Virtual Retinal Display, an HMD for low-vision use. A matched comparison study was done between the Virtual Retinal Display and the standard stand electronic device using a cathode ray tube monitor.
Peterson 2003 compared the following magnifying devices: (1) the participant's own optical magnifier; (2) magnification and field-of-view matched mouse-based electronic device with 27-inch TV monitor viewing or head-mounted display viewing; (3) a CCTV. There were clear differences in field of view among these devices.
Culham 2004 compared four electronic HMDs (Jordy, Flipperport, Maxport and NuVision) with conventional optical LVAs. Maximum field of view (i.e. at minimum magnification) was 30 degrees horizontal by 22.5 degrees vertical for all the four electronic HMDs, and there were differences in field of view with optical devices.
Eperjesi 2004 investigated the effect of 10 different coloured light filter overlays (Intuitive Overlays) compared to a clear filter.
Smith 2005 compared custom or standard bilateral prism spectacles with conventional spectacles, which included the near prescription. Differences in field of view among these devices should be small.
Watson 2005 compared a new hybrid diffractive spectacle magnifier (Eschenbach Optik Noves) with a refractive aspheric spectacle magnifier (American Optical Aolite) and an aplanatic spectacle magnifier (Designs for Vision Clear Image2). Differences in field of view among these devices should be small.
Training may affect performance and must be considered as part of the intervention. In Stelmack 1991 all participants developed eccentric viewing skills and received training in visual skills for reading with each device. Spitzberg 1995 also used a training period of up to 10 days. Ortiz 1999 did not train the participants, but these were all proficient CCTV users. Goodrich 2001 administered one hour of training for five days with each device. Kleweno 2001 did not report training. Peterson 2003 wrote that although it has been shown that training with magnification aids improves reading speed and duration, there is neither any published information on an optimal training programme nor evidence to suggest that the benefits of training are magnifier-specific. They therefore tested participants after an explanation, a demonstration and a two-minute active training period with each magnifying device. All but 24 of 70 participants were already optical device users. Eperjesi 2004 did not use training and stated that this did not affect the type of short reading test used. Culham 2004 provided basic training and the devices were loaned to participants for use in their habitual environments for one week. No training with prism or control spectacles was delivered in Smith 2005, but participants were advised to gradually prolong their use of the test spectacles if they felt comfortable to do so and to give themselves time to adapt to the test spectacles, which could potentially replace their conventional spectacles. In Watson 2005 the research project began when the person was able to use a spectacle magnifier, maintain the correct focal distance and scan the print.
Outcome measures
Reading speed (primary outcome in this review)
All the trials reported reading speed in words per minute (Table 1).
Seven studies recorded reading speed at a point size which was close to ordinary reading material, i.e. print size approximately 10 to 14 points (Culham 2004; Eperjesi 2004; Goodrich 2001; Ortiz 1999; Peterson 2003; Stelmack 1991 Spitzberg 1995). Ortiz 1999 also recorded MNREAD maximum reading speed. Peterson 2003 used MNREAD charts and provided reading speed (standard error) data across several point sizes in a figure. We obtained reading speed data regarding ordinary print size from the authors.
Kleweno 2001 used an electronic MNREAD version and reported speed at a text size near to the critical print size, which was highly variable between persons. Smith 2005 only reported MNREAD maximum reading speed. Watson 2005 obtained MNREAD maximum reading speed and Pepper test reading rate.
Reading acuity
Six studies (Culham 2004; Kleweno 2001; Ortiz 1999; Peterson 2003; Smith 2005; Watson 2005) measured reading acuity using Bailey-Lovie, MNREAD, or other charts. Whetheror not reading acuity, measured and defined according to MNREAD-like methods (Ahn 1995a; Ahn 1995b; Legge 1985a; Legge 2007), translates into the ability to read ordinary print size is unclear and largely related to the amount and range of magnification offered by each device compared to the person's needs and the type of reading task. Thus, the issue of whether or not to match by magnification arises, depending on the study question, which ultimately depends on the study objectives and main outcome measure. We extracted reading acuity data only if MNREAD-like methods (i.e. adjusting by distance or magnification) were used or if other definitions were used but devices were matched by magnification. In fact, reading acuity is nested within the ability to read with each device. This is relevant, since unmatched studies may record a large difference in the proportion of participants who are able to read with each device, thus leading to missing data with group imbalance, which can make it difficult to analyse and interpret reading acuity data. In paired studies, this problem could be avoided by restricting the analysis to participants who are able to read with all tested devices. Data were extracted for Kleweno 2001, Smith 2005 and Watson 2005. Watson 2005 provided the critical print size, which we used as a proxy for reading acuity because they are strictly related measures using the same scale, so differences between devices are expected to be similar.
In Culham 2004 it was unclear whether LVAs were matched by magnification, and the large differences found did not suggest so. Eperjesi 2004 compared filters and we did not extract reading acuity data regarding these aids since they do not magnify text.
Quality of life
Smith 2005 also used quality of life questionnaires (National Eye Institute Visual Functioning Questionnaire, NEI-VFQ), a performance assessment (Melbourne Low Vision Activities of Daily Living Index, MLVAI) and a questionnaire assessing participant experience with the spectacles.
Reading duration
Goodrich 2001 and Stelmack 1991 measured reading duration, defined as the time the participant could read without visual discomfort, measured in minutes.
Preference for each device
Spitzberg 1995, Kleweno 2001, Goodrich 2001, Peterson 2003 and Watson 2005 recorded participants' preference for each device after their use. Due to the variability of methods, as well as the unclear quality of the instrument used for measurements, these data are summarised narratively in this review.
Outcomes not used in this review
Reading comprehension and accuracy were measured by Culham 2004, Goodrich 2001, Ortiz 1999, Stelmack 1991 and Watson 2005. However, the methods used were heterogeneous.
Peterson 2003 and Culham 2004 also used several tests chosen specifically to replicate daily living tasks, which were not used in this review.
Excluded studies
Eleven studies were considered for inclusion, but finally excluded from the review (see Characteristics of excluded studies). Some of the trials were excluded because they evaluated different settings of the same visual aid, such as Jacobs 1990 who assessed whether the colour of the screen altered the performance of a CCTV. No information on the use of randomisation was reported in Goodrich 1977 or Goodrich 2004. We contacted the study authors who informed us that randomization of presentation order was not used in these studies. LOVIT 2008 was excluded since this large study assessed the effectiveness of a low-vision rehabilitation programme using a visual function questionnaire, and did not compare reading speed with different LVAs.
Through searching the references of included studies and other reviews, we found one small randomised (Parodi 2004) and one small quasi-randomised (Rosenberg 1989) study which had assessed the effect of prismatic correction in low vision patients. We excluded both because they were designed to improve distance visual acuity rather than reading ability.
Risk of bias in included studies
The results of the quality assessment are shown in the Characteristics of included studies tables and summarised in Figure 2. Overall, masking was impossible using LVAs in cross-over-like studies, a feature which we expected and which led us not to use masking as a methodological quality item in this review. Furthermore, other items which are specific to this design were difficult to assess due to poor reporting.
Allocation
The process of randomisation of presentation order of the devices and its concealment was considered good for all ‘within-subject’ studies, since the same individual will use all devices and no selection bias can arise during randomisation. This was also the case for the only parallel-arm trial (Smith 2005). This approach differs from the previous version of our review and was the result of a discussion involving clinicians and methodologists.
Goodrich 2001 and Spitzberg 1995 used rotation, as confirmed by the authors in Goodrich 2001. For two studies (Culham 2004; Stelmack 1991) the authors confirmed good conduct of the randomisation process through personal communication. All other studies stated the use of randomisation (Eperjesi 2004; Kleweno 2001; Peterson 2003) or that they counterbalanced the order of presentation (Ortiz 1999), but did not describe the technique used.
Blinding
Masking was not used as a marker of quality in this review, but a brief description is provided here. In nine ‘within-subject’ studies, masking of participants and care providers was impossible because they identified the aid during use. All studies using conventional LVAs in this review were therefore considered to be at high risk of bias for this domain. Masking might have been possible for outcome assessors measuring reading speed if the participants' voices had been recorded. Eperjesi 2004 used a tape recorder to measure reading speed and could have masked examiners, but did not report doing so. Masking was achieved in Smith 2005, the only parallel-arm trial.
Incomplete outcome data
There was no loss to follow-up in these short-term studies, some of which seemed to have been performed in a single testing session.
Selective reporting
Reading acuity was reported or could be extracted from fewer studies (as previously stated). Only two studies measured reading duration, although all studies could have measured it. Methods of measurement of subjective preferences for each device were too heterogeneous for us to draw any conclusions on selective reporting.
We conclude that the scoring of selective reporting bias for our secondary outcomes will only be feasible after the tools for measuring these outcomes are agreed upon in broad consensus initiatives such as COMET or COSMIN,
Other potential sources of bias
The following is a description of methodological quality issues that are specific to studies adopting a ‘within-subject’ or cross-over-like design.
Period effect: stability of disease during cross-over phases
Because participation lasted a few weeks at most, ‘period effect’ (a particular type of selection bias due to the change of disease status during phases in cross-over-like studies) was not expected to be an issue when testing with each aid was done in the same session or within a few days. As reported above, only Culham 2004 allowed a one-week loan of each device before testing. We therefore rated this item as high quality for all studies.
Carry-over effect and period-by-treatment interaction: the potential risk of learning effect or fatigue during repeated testing
‘Carry-over’ effect may happen when the effect of the first intervention lasts into the following treatment period. In LVA research, ‘within-subject’ testing canbe conducted in a single session. Learning-effect, or conversely fatigue due to prolonged testing, may be forms of this type of bias with opposite actions. Randomisation is expected to balance these effects across LVAs used in the study, although it is possible the performance of some devices could be affected more than others when the participant becomes tired after repeated testing, which can be referred to as ‘period-by-treatment interaction’.
No studies provided details on the timing of testing sessions, particularly on time between longer reading duration tests. However, some provided details that were suggestive of little risk of carryover effect. Ortiz 1999 could not find a practice effect comparing the first and the last half of their tests, nor a decay in performance, but a quantitative assessment was not available. Two more studies reported short test duration, which most likely did not induce fatigue. Kleweno 2001 used a reading test based on the MNREAD. Nonetheless, one participant withdrew because of fatigue. Peterson 2003 used reading and real-word tests of very short duration. Because it was difficult to evaluate the impact of these statements, all studies were scored as being at unclear risk of bias for this item.
Effects of interventions
See: Summary of findings for the main comparison Electronic device (various types of CCTV) versus optical device for adults with low vision; Summary of findings 2 Stand-based closed-circuit television (CCTV) versus head-mounted electronic device (HMD) for adults with low vision; Summary of findings 3 Stand-based closed-circuit television (CCTV) versus hand-held, mouse-based electronic device (HHD) for adults with low vision; Summary offindings 4 Diffractive spectacle-mounted magnifiers compared to control for adults with low vision; Summary of findings 5 Overlay coloured filters versus clear filter for adults with low vision; Summary of findings 6 Prism spectacles versus conventional spectacles for adults with low vision
Electronic versus optical devices
Four studies compared electronic devices with optical devices, mainly stand or hand magnifiers (Culham 2004; Goodrich 2001; Peterson 2003; Stelmack 1991). Data could be extracted from three studies (Culham 2004; Goodrich 2001; Peterson 2003), but not for Stelmack 1991 because of marked data skewness (see Appendix 9). Summary of findings for the main comparison presents results for several types of electronic LVAs compared to optical aids. Figure 2 presents comparisons between device types, including multiple comparisons in the same study which use the same control arm and cannot be meta-analysed.
Using GRADE, the quality of this evidence was always moderate or low for reasons given in Summary of findings for the main comparison, specifically because a single small study was available and estimates were imprecise
Reading speed
In one study (Goodrich 2001) both a stand-mounted and a handheld electronic device (mean reading speed 76 words per minute (wpm) for both) tended to be superior to the participant's stand magnifier (n = 19) or microscopic spectacles (n = 3) (mean reading speed 64 wpm) with borderline statistical significance (Analysis 1.1; Figure 3).
Figure 3.
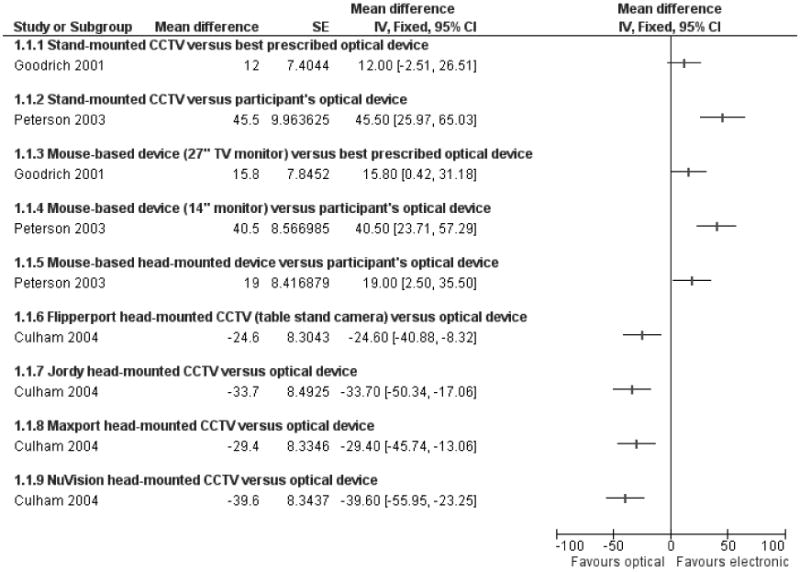
Forest plot of comparison: 1 Electronic device (various types of CCTV) versus optical device, outcome: 1.1 Reading speed (words per minute).
Peterson 2003 presented data as reading time for various print sizes, and we obtained reading speed data from the authors at a visual angle equivalent to 0.5 logMAR, about 12 points at 40 cm (Analysis 1.1). They found that a CCTV (mean reading speed 111 wpm), a mouse-based electronic device with a 14-inch monitor at 40 cm (mean reading speed 106 wpm), and a mouse-based head-mounted device (HMD) (mean reading speed 85 wpm) were better than the participant's optimum optical device (mean reading speed 61 wpm). Differences and their 95% confidence interval (CI) are shown in Summary of findings for the main comparison. Using this print size, about 55% to 60% of participants were able to read using an optical device or a mouse-based HMD, as opposed to 75% to 80% of participants using a moused-based monitor or a stand CCTV. The comparison was therefore based on a subset of participants, and nested in the ability to read. Although this could be due to the larger field of view with an electronic device, it may be that the participant's optical device was not best-prescribed, i.e. clinically evaluated and recommended as appropriate treatment, or not matched by magnification with the electronic devices. Specifically, the authors reported that subjects used their own magnifier but also, in a following sentence, the optimum optical magnifier (also see Characteristics of included studies).
In a further study, Culham 2004 found that stand or hand optical devices (mean reading speed 95 wpm) were better than four types of head-mounted electronic devices (mean reading speed from 55 to70wpm),including one with a stand-mounted camera(Analysis 1.1). The authors reported that one week of home practice improved reading, but it did not alter the pattern of the results. It was unclear whether optical devices were matched by magnification with electronic devices, and at least in some participants this was the optical device previously used by each participant.
The authors of the study for which data were not extracted (Stelmack 1991) stated that stand-mounted or hand-held electronic devices (mean speed 59 wpm, standard deviation 37 wpm) were better than optical devices (stand magnifiers mean 32 wpm, standard deviation 30 wpm; spectacle lenses mean 47 wpm, standard deviation 52 wpm).
Reading duration
In Goodrich 2001 the mean reading duration was about 36 minutes with both the stand-mounted and the hand-held CCTV com-pared to 23 minutes using an optical device (Analysis 1.2). No data could be extracted from Stelmack 1991, who reported a longer duration with a CCTV (29 minutes) than with optical aids (13 minutes) and spectacles (11 minutes). No analyses could be performed due to marked skewness problems.
Comparisons between electronic devices
Four studies compared different electronic devices (Goodrich 2001; Kleweno 2001; Ortiz 1999; Peterson 2003; Summary of findings 2; Summary of findings 3). Because several devices were tested in asingle study, Figure 2 and other following figures present the same study for more than one comparison.
Additionally, four types of electronic HMDs were simultaneously tested against an optical device in Culham 2004. Comparing electronic devices of the same class was not the main objective of our study, but it can be seen in Analysis 1.1 and Figure 2 that the performance of these devices was similar.
Using GRADE, the quality of this evidence was moderate or low for reasons given in Summary of findings 2 and Summary of findings 3; specifically because few studies were available and not all participants could read with all devices in the largest study.
Stand-mounted CCTV versus head-mounted electronic device
Reading speed
No significant differences were found between a stand-mounted CCTV and an electronic HMD in three studies (Kleweno 2001; Ortiz 1999; Peterson 2003), as seen in Analysis 2.1 and Figure 4. The confidence interval around the pooled estimate was sufficiently narrow to suggest an equivalence of the two types of devices (Summary of findings 2). This is in contrast with comparisons made indirectly, as shown above between electronic and optical devices, which found that a stand-based CCTV was better than optical devices in one study, but electronic HMDs were worse in another study (Summary of findings for the main comparison).
Figure 4.
Forest plot of comparison: 2 Stand-based closed-circuit television (CCTV) versus head-mounted electronic device (HMD), outcome: 2.1 Reading speed (words per minute).
Reading acuity
In Kleweno 2001, reading acuity was 0.15 logMAR both for the conventional CCTV and for a HMD, the Virtual Retinal Display. The 95% CI of this nil difference also excluded a clinically relevant difference (Analysis 2.2; Summary of findings 2), such as at least 0.1 logMAR which means being able to read a smaller MNREAD sentence by one step. However, this evidence is not strong since it is supported only by one small study, as explained above.
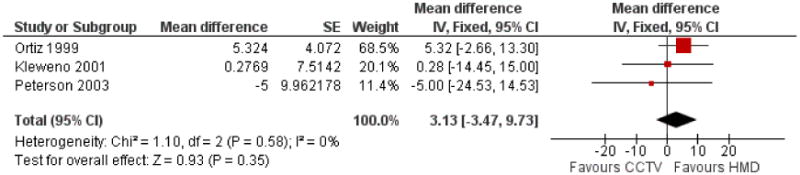
Stand-mounted CCTV versus hand-held electronic device
Two studies (Goodrich 2001; Peterson 2003 92 participants overall) compared a stand-mounted CCTV and a hand-held mouse-based CCTV with an optical magnifier, generally a stand magnifier, and less frequently a hand magnifier or microscopic lenses.
Reading speed
Goodrich 2001 could not find any differences, but Peterson 2003 found that reading using a stand-mounted CCTV was faster (Analysis 3.1; Figure 5; Summary of findings 3). We pooled these effects since they were in the same direction and also considered that statistical heterogeneity can hardly be estimated with only two small trials in the analysis. Furthermore, no other sources of clinical and methodological heterogeneity were found. Although Goodrich 2001 included only 22 participants it had a greater weight than Peterson 2003 (70 participants) in the meta-analysis because there was less between-subject variability. This highlights the problem of generalisability of results of paired studies including few and highly selected homogeneous participants.
Figure 5.
Forest plot of comparison: 3 Stand-based closed-circuit television (CCTV) versus hand-held, mouse-based electronic device (HHD), outcome: 3.1 Reading speed (words per minute).
Reading duration
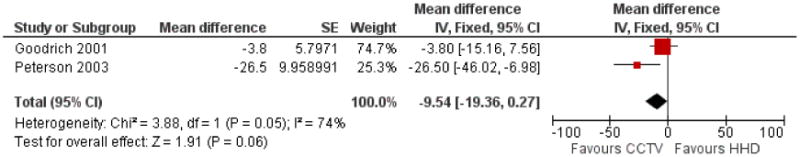
In Goodrich 2001 the mean reading duration was about 36 minutes with both the stand-mounted and the hand-held CCTV (Analysis 3.2; Summary of findings 3).
Comparisons between optical devices
Three studies compared optical LVAs (Spitzberg 1995; Stelmack 1991, Watson 2005). Data could not be extracted from Spitzberg 1995 and Stelmack 1991, because of data skewness, according to criteria described in the Data collection and analysis section. In Stelmack 1991, mean reading speed was reported to be 47 wpm for spectacle reading compared to 32 wpm for stand magnifiers. Spitzberg 1995 reported no improvement of reading speed with four new stand magnifiers as compared to a conventional one with the same power; the reading speed was about 80 wpm for all devices.
Using GRADE, the quality of this evidence was always moderate or low for reasons given in Summary of findings 4, specifically because a single small study was available and estimates were imprecise.
Reading speed and acuity
Watson 2005 compared a new hybrid-diffractive spectacle-mounted magnifier to either a refractive aspheric (experiment 1) or an aplanatic spectacle-mounted magnifier (experiment 2), with each comparison conducted on the same participant in two groups of 15 people. MNREAD maximum reading rate was about 100 wpm in both groups, witha95%CIexcluding a difference of more than 17 wpm (Analysis 4.1; Summary of findings 4; Figure 6). Critical print size was approximately 1 M for all devices (Analysis 4.2).
Figure 6.
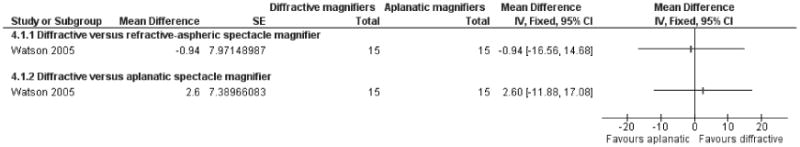
Forest plot of comparison: 6 Diffractive spectacle mounted magnifiers versus control, outcome: 6.1 MNREAD maximum reading speed (words/minute).
Participant's preference for each device
Watson 2005 measured participant's preference using a 125 mm visual analogue scale to record satisfaction and comfort with reading and cosmesis; however these data could have been extracted only in part and thus we decided not to use them.
Outcomes extracted but not considered in this review
Usable data were provided by Watson 2005 for comprehension (using the Morgan Low Vision Reading Comprehension test). Comprehension was better for the hybrid diffractive spectacle-mounted magnifier compared to the refractive aspheric magnifier, but no difference could be shown between the aplanatic magnifier and the refractive aspheric magnifier (Analysis 4.3). Watson 2005 also measured reading accuracy using the Pepper test and found no significant differences, but this could not be extracted.
Comparison of overlay coloured filters versus clear filter
A single paired study was available for this comparison (Eperjesi 2004, 13 participants). Using GRADE, the quality of this evidence was low for reasons given in Summary of findings 5, specifically because a single small study was available and estimates were imprecise.
Reading speed
Although aclinically significant benefit with any colour filter could be excluded by the width of the confidence intervals, Eperjesi 2004 reported that overlay colour filters tended to be less beneficial than a clear filter (mean 84 wpm) and found a statistically significant difference only for pink, aqua and purple filters (Analysis 5.1; Summary of findings 5).
Prism spectacles versus conventional spectacles
A three-arm randomised trial (Smith 2005, 150 participants) was found for this comparison.
Using GRADE, the quality of this evidence was always moderate or low for reasons given in Summary of findings 6, specifically because a single small study was available and estimates were imprecise.
Reading speed
Smith 2005 found no significant difference between either custom (mean reading speed 73 wpm) or standard prism spectacles (74 wpm) and conventional spectacles (67 wpm). The confidence intervals around these differences were wide, as seen in Analysis 6.1 and Summary of findings 6.
Reading acuity
In Smith 2005 both custom (mean reading acuity 0.88 logMAR) and standard prism spectacles (0.89 logMAR) were not demonstrated to be different from conventional spectacles (0.95 log-MAR). The confidence intervals around these differences excluded a difference of about 0.2 logMAR or more, as seen in Analysis 6.2 and Summary of findings 6.
Quality of life
Smith 2005 found the total National Eye Institute Visual Functioning Questionnaire (NEI-VFQ) score did not differ for custom or standard prism spectacles as compared to conventional spectacles (Analysis 6.3; Summary of findings 6). This comparison was based on evidence of moderate quality.
Adverse outcomes
None of the studies measured or reported adverse outcomes.
Factors influencing reading performance
Some studies described the effect of factors that might influence the performance with specific LVAs. We could not extract data for these outcomes.
Effect of training
Culham 2004 and Spitzberg 1995 reported that reading speed increased after five days of training or with prior CCTV use. Conversely, Peterson 2003 reported that having already used either electronic or optical aids was not associated with reading speed increase.
Print size
Peterson 2003 reported that CCTV superiority compared to optical devices tended to decrease as print size approached 1.0 log-MAR acuity. This is probably due to the fact that the magnification provided by a CCTV is larger than that with optical devices, which may be critical for people with more severe visual loss to be able to read. We could not extract any data.
Younger age
Culham 2004 found younger age was a predictor of higher reading speed when using an HMD for medium and large print size (16 wpm per decade), but we could not extract any data.
Discussion
Summary of main results
A few small studies have compared reading speed with several LVAs that are commonly used in low-vision rehabilitation. Using GRADE, the quality of the evidence was consistently moderate or low due to several problems.
The design of nine of the 10 studies was similar to a cross-over design, (referred to as a ‘within-subject’ design by most of the authors). Quality was difficult to evaluate because of insufficient reporting of relevant sources of bias regarding the cross-over-like design, which is a common finding in other systematic reviews that include cross-over studies (Elbourne 2002).
Electronic versus optical devices
In two studies, electronic stand-based (camera and monitor) CCTV and a hand-held CCTV (14-inch monitor at 40 cm) allowed faster reading than optical devices. This difference was of borderline significance in one study using best-prescribed optical device, and highly significant in another using the participant's optimal device.
In another study, participants performed significantly worse with four types of head-mounted electronic devices than with an optical device.
Improvements in technology, especially for electronic devices, may have occurred since these trials were published.
Comparisons between electronic devices
In four studies, various types of electronic devices tended to have similar performance. Overall, how the performance of HMDs compared to conventional CCTVs is unclear, as is the potential effect of age and type or severity of disease on the performance with each device. Furthermore, technological advances may mean that these devices could be outdated. In view of this and the problematic quality assessment, the results of these studies cannot be considered sufficient to support any conclusions.
Comparisons between optical devices
There was insufficient evidence of a difference between a new diffractive spectacle-mounted magnifier compared to a refractive and an aplanatic magnifier in one small study.
Comparison of overlay coloured filters versus clear filter
Several overlay coloured filters tended to reduce reading speed compared to a clear filter in one small study.
Prism spectacles versus conventional spectacles
One study found that prism spectacles are unlikely to be beneficial in people with age-related macular degeneration (AMD), although the data did not allow precise estimates of performance to be made.
Overall completeness and applicability of evidence
Problems with outcome measures used in systematic reviews of low-vision aids
Research on low-vision aids (LVAs) is typically based on multiple outcome measures in the attempt to capture the whole experience of people using them. Reading speed and reading acuity have been outcomes of interest in early LVA research focusing on the reading performance obtained with each device. No studies have used validated measurement methods to investigate important secondary outcomes such as subjective preference for each device or sustained use.
Low-vision and reading rehabilitation is a complex intervention, and factors other than reading speed are valued by LVA users. A survey among consumers of an earlier version of this review highlighted a number of issues that are of interest to users of reading aids:
Informing people with low vision about portability, usability and cost of LVAs, especially electronic devices, which were also found to evolve very rapidly and have a shelf-life as short as two years, according to consumer comments on this review; this type of information should be tailored according to intended use, e.g. “watching television, shopping, checking timetables, reading street names and bus numbers, and reading notices posted in clinics and elsewhere”.
Report on the effect of factors influencing the use of reading devices, such as training and environmental and lighting conditions.
Offering information on such issues probably goes beyond the scope of a Cochrane intervention review such as this one, which was planned several years ago and was originally restricted to assessing people's reading performance with each LVA.
Quality-of-life measures were available in only one study that was retrieved. We acknowledge that our reviewis a partial investigation of the needs of people with low vision, and that another Cochrane review currently underway will include studies using multidisciplinary or monodisciplinary rehabilitation for adults with low vision, with quality-of-life as the primary outcome (Langelaan 2007).
Finally, we did not report on cost issues in this review, since these were not an outcome in the included studies. VA HTA 2003 observed that “sustained use of these devices in the subject's life setting, resources required in terms of costs and training associated with each alternative, and the link between device use and health related quality of life were unknown”. This review also provided information on unit cost of devices in the Veteran Affairs reimbursement framework. Among excluded studies in this review, Rees 2006 compared the reading performance of low-cost and gold-standard magnifiers and found no difference between them. However, this study was available only as an abstract and there were insufficient data to include it.
Culham 2009 is an example of a well-structured study investigating which performance aspects influence LVA user opinion, and may help us understand what it is users seek or reject in low-vision devices. The study investigators considered participants' assessment of several features of LVAs both before and after their home loan, as well as participants' willingness to pay for each device. In this study, image quality and magnification facilities were the most important factors in determining overall subjective rating of the devices. They concluded that there is much to learn from listening to patients. They also commented that impressions may change with familiarity and environment, and a single clinical assessment may not provide an accurate evaluation of how useful a device might become with time. We could not include this study because our review is restricted to reading speed as the primary outcome measure, but we found that the methodology and research scope in Culham 2009 are an important research field regarding LVAs. An extensive technical discussion on the methods for assessing reading performance has been recently provided by Rubin 2013. A broader perspective on outcome measures, including quality of life measures, in low vision service research is also available by Binns et al who have conducted a systematic review on effectiveness of low vision service provision (Binns 2012).
Problems with generalisability of results from systematic reviews of low-vision aids
A further complication is that reading performance using electronic or optical devices might potentially be confounded by participant characteristics such as age, physical and mental status, and the type and severity of low vision. The type of task can also make a difference, e.g. tasks such as reading mail do not require long reading duration or a fast reading speed, while reading a magazine or a newspaper involves longer reading duration and reading speed is more critical to complete the task. It is therefore important that authors of future studies provide details on these characteristics. The question also arises of whether or not a participant's ability to use all of the LVAs under investigation should be an inclusion criterion for reading performance studies. In fact, reading speed as an outcome measure is nested in the ability to read. This methodological problem is similar to that of outcome-based subgroup analysis in Hirji 2009. In studies testing several devices on the same participant, some may be able to read with one device but not with others if the devices do not provide the same magnification. As a result, a missing data problem with group imbalance may arise for reading acuity if many more participants are unable to read with a specific, usually low-magnification, device. Whether to match for appropriate magnification depends on the research question, particularly whether people with low vision use devices with optimal magnification, i.e. enabling them to read standard print size, may be better achieved in a survey rather than in randomised controlled trials.
Other questions include whether or not devices are cost-effective and effective in the long term.
Sample sizes were small, being less than 40 participants in all but one cross-over-like study and one parallel-arm study. No study reported sample size calculation. Nonetheless, cross-over trials are more powerful than a two-parallel-arm study of equal sample size. The equivalent sample size can be obtained by multiplying sample size (N) by 1/(1-R), where R is the correlation coefficient between repeated measures in the same participant. In the studies included in this review for which R could be computed, the efficiency ranged from 3 times (R = 0.66 in Kleweno 2001) to 12 times (R = 0.92 in Ortiz 1999) that of an equally sized two-parallel-arm trial. However, the gain in power is counterbalanced by a number of potential issues, including generalisability of the findings if conducted using a small sample of homogeneous participants.
Quality of the evidence
In the previous version of this review, we judged that randomisation technique and allocation concealment were of good quality in only three studies. However, in this updated version we decided that there is no risk of selection bias in studies testing several LVAs on the same participant in the same session, so we scored all studies as being at low risk of bias for this item.
We did not use masking of participants, study personnel and outcome assessors, since this is not possible with most LVAs and it may be meaningless for secondary outcomes such as preference-based measures. Only one study evaluating prism spectacles declared masking of participants, care providers or outcome assessors.
Quality issues specific to cross-over-like trials were unclear because of poor reporting. We suggest that the risk of bias is likely to be small or moderate in the included studies. Simultaneous testing of devices avoids the risk of a period-effect, or a change of disease status between cross-over phases. The interventions should have limited carry-over effect, but this was formally assessed in only one study. Repeated testing may have induced learning effect or fatigue. Most studies addressed the issue of training regarding learning effects and seemed to reproduce testing conditions similar to the current LVA rehabilitation practice. No firm conclusion can be drawn. Methodological studies have shown that insufficient reporting often makes quality assessment of cross-over trials difficult (Elbourne 2002).
Methodological quality was downgraded because statistical heterogeneity cannot be assessed when only one or few studies are available in a meta-analysis. Another consequence was that 95% confidence intervals of effect estimates obtainedinthis review were often large, indicating that estimates were imprecise.
Potential biases in the review process
Small studies are typical of low-vision rehabilitation and we cannot exclude the possibility that other small studies exist in the grey literature. Noticeably, two other reviews, described below, did not find any additional studies that met our inclusion criteria. However, manual searches of references in articles collected for preparing this review allowed us to find two small studies that were previously missed (Kaida 2005; Watson 2005). One of these is currently under assessment because of the need for translation from Japanese (Kaida 2005).
Agreements and disagreements with other studies or reviews
Although the purpose of this review was not to systematically search for other systematic reviews, we found two others on the use of low vision aids (Hooper 2008; VA HTA 2003), one review on the use of prisms (Markowitz 2013), and a broad purpose review on low vision service provision (Binns 2012).
VA HTA 2003 is a health technology assessment conducted by the US Veteran Affairs and available at www.va.gov/VATAP/docs/OpticalDevicesAdultsLowVision2003tm.pdf. The review included studies assessing the use of devices for reading and driving, and included 11 studies. Regarding reading data, VA HTA 2003 included seven studies of which three were also in our review (Goodrich 2001; Spitzberg 1995; Stelmack 1991). The other studies included participants with hemianopia (Kuyk 1990), stroke (Rossi 1990), tried to enhance visual fields perception rather than reading performance (Lavinsky 2001), or compared different prisms (Cheng 2001). The authors concluded that the evidence for the use of low-vision aids is insufficient.
Hooper 2008 reviewed studies assessing any type of rehabilitation intervention in people with low vision, including rehabilitation programmes. They included five studies also used in our review (Culham 2004; Eperjesi 2004; Goodrich 2001; Smith 2005; Stelmack 1991), as well as a number of studies investigating rehabilitation programmes, or studies not included in our review because of study design. They concluded that “no single device emerges as the most effective device in people with AMD, because no device provides an identical level of functionality to another, nor dodevice users have precisely the same needs and expectations. Other differentiating factors include cost, ease of use, versatility, safety, universality, cosmetics, availability, serviceability, practicality, and adaptability”. They also commented that “there appears to be no particular advantage in using one optical low-vision aid over another and no apparent advantage in using electronic magnification systems over conventional optical devices”.
We cannot formally compare the results of our review with the two mentioned above concerning quantitative findings, because there were differences in inclusion criteria, and their conclusions were broad, rather than focused on specific comparisons. Nonetheless, we largely agree with Hooper 2008 on the views quoted above, since we also found it hard to constrain the complexity of the use of each type of low-vision aid, by participants with different needs and characteristics, to a single psychophysical measure of performance such as reading speed.
Markowitz 2013 conducted a systematic review to assess the effect of prisms for vision rehabilitation in people with macular function loss, including three randomised studies and six non-randomised studies or case series (727 participants). The primary outcome was distance visual acuity, which was found to be improved by -0.158 logMAR (95% CI 0.014 to 0.302 logMAR) in people wearing a prismatic correction. These results cannot be compared to ours since we assessed reading ability and not visual acuity, and their interpretation is also made difficult by the inclusion of non-randomised studies and case series.
Recently, Binns 2012 has conducted a broad scope systematic review of effectiveness of low vision service provision. The results of this review are also difficult to compare with ours, since the presentation of quantitative results was not standard and no meta-analysis was conducted or attempted. They found 58 studies which met their liberal inclusion criteria, only seven of which were randomised controlled trials. They concluded that “although the literature is sufficient to confirm that rehabilitation services result in improved clinical and functional ability outcomes, the effects on mood, vision-related quality of life (QoL) and health-related QoL are less clear. They also concluded that “the number of well-designed and adequately reported studies is pitifully small; visual rehabilitation research needs higher quality research”.
Authors' Conclusions
Implications for practice
There is insufficient evidence supporting the use of a specific type of electronic or optical device for the most common profiles of low-vision aid (LVA) users.
Two small studies found low quality evidence that stand-based CCTV and hand-held CCTV allows faster reading of ordinary print size than optical devices. However, better reading speed should be matched with portability, ease of use, and affordability. Furthermore, it is unclear how we can identify the people who benefit more with electronic devices, which are more costly than optical devices. The technology of electronic devices may have improved since these studies were conducted.
One study found that prism spectacles are unlikely to be beneficial for people with AMD, although the data did not allow precise estimates of performance to be made.
Implications for research
Low-vision researchers who designed studies comparing reading performance using different LVAs, such as studies included in this review, considered a cross-over-like design appropriate. The advantage of this design is its greater efficiency compared to parallel-arms studies. However, poor reporting of cross-over trials is considered a limitation for systematic reviews and meta-analyses.
Moreover, we suggest that results from parallel-group randomised controlled studies are easier to interpret than cross-over-like studies in people with low vision. The need for a larger sample size in parallel-group studies makes them substantially more costly than cross-over-like studies. On the other hand, the inclusion of a large number of people may favour generalisability of the results.
Reasearchers should consider that important determinantsof reading performance with respect to the optical device are magnification, field of view, working distance, illumination and clarity of the optics, which all need to be taken into account when designing a study of the use of LVAs or devices.
We recognise that achieving better reading speed is only one of the desirable properties of an LVA compared to another. Ease of use, frequency of use, sustained use and satisfaction should also be assessed using validated tools. Other considerations that are important to patients are physical comfort, weight, cosmesis and cost. Success in using an LVA may also be dependent on a person's needs and the training received, as well as other components of a multidisciplinary low-vision rehabilitation approach (Langelaan 2007).
We finally refer to Binns 2012 and to Rubin 2013 for a broader discussion on outcome measures in low vision research.
Plain Language Summary.
Magnifying reading devices or aids for adults with low vision
The number of people with low vision is increasing with the aging population. Magnifying optical and electronic aids are commonly prescribed to help people maintain the ability to read when their vision starts to fade, but still have some ability to see. We reviewed the evidence for the effect of reading aids on reading ability in people with low vision, with the aim of investigating whether there are differences in reading performance using conventional optical devices, such as hand-held or stand-based microscopic magnifiers, as compared to telescopic optical devices, or electronic devices such as stand-based, closed-circuit television and hand-held electronic magnifiers. The searches covered studies published until January 2013.
We found 10 studies (424 participants) comparing reading performance, mainly reading speed, in adults who are followed in low vision services. Most people were affected by macular degeneration, which causes loss of central vision and is often age-related.
Results from small studies of moderate or low quality were inconclusive, although they suggested faster reading speed with stand-based or hand-held electronic devices compared to stand-mounted or hand-held optical magnifiers. They also suggested that head-mounted electronic devices performed less well than optical magnifiers. The technology and versatility of electronic devices may have developed and improved since these trials were conducted between 1991 and 2005.
One study suggested that prism spectacles, or special glasses which are sometimes prescribed to try to help people with central visual loss to see objects outside their blind spot areas, were no more effective than conventional spectacles for people with age-related macular degeneration.
Acknowledgments
We are grateful to Louise Culham,Gary Rubin, Jennifer Evans, Roberta Scherer, Alicja Rudnicka and Catey Bunce for peer review comments on earlier versions of this review. We thank the Cochrane Eyes and Vision Group (CEVG) editorial staff for their assistance with the search strategies and general support throughout the review process. Elizabeth Hawes contributed to the original idea and early work on the protocol for this review.
James Wolffsohn provided raw data for Peterson 2003. Gregory Goodrich provided additional information and references and a full-text manuscript to be included in this review.
We thank Harold Burton, a low-vision aid user for commenting on the plain language summary, abstract and conclusions of the 2013 update of this review.
Richard Wormald (Co-ordinating Editor for CEVG) acknowledges financial support for his CEVG research sessions from the Department of Health through the award made by the National Institute for Health Research to Moorfields Eye Hospital NHS Foundation Trust and UCL Institute of Ophthalmology for a Specialist Biomedical Research Centre for Ophthalmology. The views expressed in this publication are those of the authors and not necessarily those of the Department of Health.
Summary Of Findings For The Main Comparison [Explanation]
| Electronic device (various types of CCTV) versus optical device for adults with low vision | |||||
|---|---|---|---|---|---|
|
Patient or population: Adults with low vision Settings: Intervention: Electronic device (various types of CCTV) Comparison: Optical device | |||||
| Outcome: reading speed in words per minute (wpm) Comparison subgroups | Illustrative comparative risks* (95% CI) | No of Participants (studies) | Quality of the evidence (GRADE) | Studies | |
| Assumed risk | Corresponding risk | ||||
| Optical device | Electronic device (various types of CCTV) versus optical device | ||||
| Stand-mounted CCTV versus best prescribed optical device | The mean reading speed in the control group (best prescribed optical device) was 64 words per minute | The mean reading speed (words per minute) using a stand-mounted CCTV was 12 higher (2.51 lower to 26.51 higher) | 22 (1 study) | ⊕⊕○○ low1,2,3 | Goodrich 2001 |
| Stand-mounted CCTV versus participant's optical device | The mean reading speed in the control group (participant's optical device) was 65.8 words per minute | The mean reading speed (words per minute) using a stand-mounted CCTV was 45.5 higher (25.07 lower to 65.03 higher) | 70 (1 study) | ⊕⊕○○ low1,2,3,4 | Peterson 2003 |
| Mouse-based device (27” TV monitor) versus optical device | The mean reading speed using an optical device was 64 words per minute | The mean reading speed using a mouse-based device (27”TV monitor) was 15.8 higher (0.42 to 31.18 higher) | 22 (1 study) | ⊕⊕○○ low1,2,3 | Goodrich 2001 |
| Mouse-based device (14” monitor) versus participant's optical device | The mean reading speed in the control group (participant's optical device) was 65.8 words per minute | The mean reading speed using a mouse-based device (14” monitor) was 40.5 higher (23.71 to 57.29 higher) | 70 (1 study) | ⊕⊕⊕○ low 1,2,3,4 | Peterson 2003 |
| Flipperport head-mounted CCTV (table stand camera) versus optical device | The mean reading speed (words per minute) using an optical device was 95 words per minute | The mean reading speed using a Flipperport head-mounted CCTV (table stand camera) was 24.6 lower (40.88 to 8.32 lower) | 20 (1 study) | ⊕⊕⊕○ moderate1,2 | Culham 2004 |
| Jordy head-mounted CCTV versus optical device | The mean reading speed (words per minute) using an optical device was 95 words per minute | The mean reading speed using Jordy head-mounted CCTV was 33.7 lower (50.34 to 17.06 lower) | 20 (1 study) | ⊕⊕⊕○ moderate1,2 | Culham 2004 |
| Maxport head-mounted CCTV versus optical device | The mean reading speed (words per minute) using an optical device was 95 word per minute | The mean reading speed using Maxport head-mounted CCTV was 29.4 lower (45.74 to 13.06 lower) | 20 (1 study) | ⊕⊕⊕○ moderate1,2 | Culham 2004 |
| NuVision head-mounted CCTV versus optical device | The mean reading speed (words per minute) using an optical device was 95 word per minute | The mean reading speed using NuVision head-mounted CCTV was 40 lower (56 to 23.3 lower) | 20 (1 study) | ⊕⊕⊕○ moderate1,2 | Culham 2004 |
| Outcome: Reading duration (minutes) Comparison: stand CCTV versus optical device | The mean reading duration (minutes) in the control groups was 23 minutes | The mean reading duration (minutes) in the intervention groups was 13.7 higher (7.9 higher to 19.5 higher) | 22 (1 study) | ⊕⊕⊕○ moderate1,2 | Goodrich 2001 |
| Outcome: Reading duration (minutes) Comparison: stand CCTV versus optical device | The mean reading duration (minutes) in the control groups was 23 minutes | The mean reading duration (minutes) in the intervention groups was 12.8 higher (9.3 higher to 16.3 higher) | 22 (1 study) | ⊕⊕⊕○ moderate1,2 | Goodrich 2001 |
The basis for the assumed risk (e.g. the median control group risk across studies) is provided in footnotes. The corresponding risk (and its 95% confidence interval) is based on the assumed risk in the comparison group and the relative effect of the intervention (and its 95% CI).
CI: Confidence interval;
GRADE Working Group grades of evidence
High quality: Further research is very unlikely to change our confidence in the estimate of effect.
Moderate quality: Further research is likely to have an important impact on our confidence in the estimate of effect and may change the estimate.
Low quality: Further research is very likely to have an important impact on our confidence in the estimate of effect and is likely to change the estimate.
Very low quality: We are very uncertain about the estimate.
Masking of participants not used in this review since it is not possible with low vision aids.
Inconsistency cannot be assessed when a single, or few, small cross-over trials are included.
Wide confidence intervals.
Not all participants in a paired study could read with both the electronic and the optical device.
Additional Summary Of Findings [Explanation]
| Stand-based closed-circuit television (CCTV) versus head-mounted electronic device (HMD) for adults with low vision | |||||
|---|---|---|---|---|---|
|
Patient or population: Adults with low vision Settings: Intervention: Stand-based closed-circuit television (CCTV) versus head-mounted electronic device (HMD) | |||||
| Outcomes | Illustrative comparative risks* (95% CI) | No of Participants (studies) | Quality of the evidence (GRADE) | Studies | |
| Assumed risk | Corresponding risk | ||||
| Control | Stand-based closed-circuit television (CCTV) versus head-mounted electronic device (HMD) | ||||
| Reading Speed (words per minute MNREAD Charts | The mean reading speed in the control groups was 66 word/minute | The mean reading speed in the intervention groups was 3.13 higher (3.47 lower to 9.73 higher) | 93 (3 studies) | ⊕⊕○○ low1,2,3,4 | Ortiz 1999; Kleweno 2001; Peterson 2003 |
| Reading acuity (logMAR) MNREAD charts | The mean reading acuity in the control groups was 1.50 logMAR | The mean reading acuity in the intervention groups was 0 higher (-0.03 to 0.03 higher) | 13(1 study) | ⊕⊕⊕○ moderate1,2 | Kleweno 2001 |
The basis for the assumed risk (e.g. the median control group risk across studies) is provided in footnotes. The corresponding risk (and its 95% confidence interval) is based on the assumed risk in the comparison group and the relative effect of the intervention (and its 95% CI).
CI: Confidence interval;
GRADE Working Group grades of evidence
High quality: Further research is very unlikely to change our confidence in the estimate of effect.
Moderate quality: Further research is likely to have an important impact on our confidence in the estimate of effect and may change the estimate.
Low quality: Further research is very likely to have an important impact on our confidence in the estimate of effect and is likely to change the estimate.
Very low quality: We are very uncertain about the estimate.
Masking of participants not used in this review since it is not possible with low vision aids.
Inconsistency cannot be assessed when a single, or few, small cross-over trials are included.
Not all participants in the largest paired study could read with both the electronic and the optical device; this equals a violation of the intention-to-treat analysis.
Not all participants in a paired study could read with both the electronic and the optical device; this equals a violation of the intention-to-treat analysis.
| Stand-based closed-circuit television (CCTV) versus hand-held, mouse-based electronic device (HHD) for adults with low vision | ||||||
|---|---|---|---|---|---|---|
|
Patient or population: Adults with low vision Settings: Intervention: Stand-based closed-circuit television (CCTV) Comparison: Hand-held, mouse-based electronic device (HHD) | ||||||
| Outcomes | Illustrative comparative risks* (95% CI) | No of Participants (studies) | Quality of the evidence (GRADE) | Studies | ||
| Assumed risk | Corresponding risk | |||||
| Control | Stand-based closedcircuit television (CCTV) versus hand-held, mouse-based electronic device (HHD) | |||||
| Maximum Reading Speed (words per minute) MNREAD charts | The mean maximum reading speed (words per minute) in the control groups was 64 word per minute | The mean maximum reading speed (words per minute) in the intervention groups was 9.54 lower (19.36 lower to 0.27 higher) | 92 (2 studies) | ⊕⊕○○ low1,2,3,4 | Goodrich 2001; Peterson 2003 | |
| Reading duration (minutes) MNREAD charts | The mean reading duration (minutes) in the control groups was 23 minutes | The mean reading duration (minutes) in the intervention groups was 0.9 lower (4.38 lower to 6.18 higher) | 22 (1 study) | ⊕⊕⊕○ moderate1,2 | Goodrich 2001 | |
The basis for the assumed risk (e.g. the median control group risk across studies) is provided in footnotes. The corresponding risk (and its 95% confidence interval) is based on the assumed risk in the comparison group and the relative effect of the intervention (and its 95% CI).
CI: Confidence interval;
GRADE Working Group grades of evidence
High quality: Further research is very unlikely to change our confidence in the estimate of effect.
Moderate quality: Further research is likely to have an important impact on our confidence in the estimate of effect and may change the estimate.
Low quality: Further research is very likely to have an important impact on our confidence in the estimate of effect and is likely to change the estimate.
Very low quality: We are very uncertain about the estimate.
Masking of participants not used in this review since it is not possible with low vision aids.
Inconsistency cannot be assessed with only one included trial.
Wide 95% confidence interval.
Not all participants in a paired study could read with both the electronic and the optical device; this equals a violation of the intention-to-treat analysis.
| Diffractive spectacle mounted magnifiers compared to control for adults with low vision | ||||||
|---|---|---|---|---|---|---|
|
Patient or population: Adults with low vision Settings: Intervention: Diffractive spectacle-mounted magnifiers Comparison: Control |
||||||
| Comparison | Outcomes | Illustrative comparative risks* (95% CI) | No of Participants (studies) | Quality of the evidence (GRADE) | Studies | |
| Assumed risk | Corresponding risk | |||||
| Control | Diffractive spectacle mounted magnifiers | |||||
| Diffractive versus refractive-aspheric spectacle magnifier | MNREAD maximum reading speed (words/minute) | The mean maximum reading speed using refractive-aspheric spectacle magnifier was 99 words per minute | The mean maximum reading speed using diffractive spectacle magnifier was 0.94 lower (16.56 lower to 14.68 higher) | 15 (1 study) | ⊕○⊕○ low1,2,3 | Watson 2005 |
| MNREAD critical print size (M print size) | The mean critical print size using refractive-as-pheric spectacle magnifier was 1.17 logMAR | The mean critical print size using diffractive spectacle magnifier was 0.10 lower (0.25 lower to 0.05 higher) | 15 (1 study) | ⊕⊕○○ low1,2,3 | Watson 2005 | |
| Morgan Low Vision Reading Comprehension Assessment | The mean reading comprehension using refractive-aspheric spectacle magnifier was 11.1 score | The mean reading comprehension using diffractive spectacle magnifier was 1.98 higher (0.67 to 3.29 higher) | 15 (1 study) | ⊕⊕○○ low1,2,3 | Watson 2005 | |
| Diffractive versus apla-natic spectacle magnifier | MNREAD maximum reading speed (words/minute) | The mean maximum reading speed using apla-natic spectacle magnifier was 110 words per minute | The mean maximum 15 reading speed using (1 study) diffractive spectacle magnifier was 2.6 higher(11.88 lower to 17.08 higher) | 15 (1 study) | ⊕⊕○○ low1,2,3 | Watson 2005 |
| MNREAD critical print size (M print size) | The mean critical print size using aplanatic spectacle magnifier was 1.03 logMAR | The mean critical print 15 size using diffractive (1 study) spectacle magnifier was 0.19 lower (0.40 lower to 0.02 higher) | 15 (1 study) | ⊕⊕○○ low1,2,3 | Watson 2005 | |
| Morgan Low Vision Reading Comprehension Assessment | The mean reading comprehension using aplanatic spectacle magnifier was 13.5 score | The mean reading com- 15 prehension using diffrac- (1 study) tive spectacle magnifier was 0.76 lower (1.98 lower to 0.46 higher) | 15 (1 study) | ⊕⊕○○ low1,2,3 | Watson 2005 | |
The basis for the assumed risk (e.g. the median control group risk across studies) is provided in footnotes. The corresponding risk (and its 95% confidence interval) is based on the assumed risk in the comparison group and the relative effect of the intervention (and its 95% CI).
CI: Confidence interval;
GRADE Working Group grades of evidence
High quality: Further research is very unlikely to change our confidence in the estimate of effect.
Moderate quality: Further research is likely to have an important impact on our confidence in the estimate of effect and may change the estimate.
Low quality: Further research is very likely to have an important impact on our confidence in the estimate of effect and is likely to change the estimate.
Very low quality: We are very uncertain about the estimate.
Masking of participants not used in this review since it is not possible with low-vision aids.
Inconsistency cannot be assessed with only one included trial.
Wide 95% confidence interval.
| Overlay coloured filters versus clear filter for adults with low vision | |||||
|---|---|---|---|---|---|
| Patient or population: Adults with low vision Settings: Intervention: Overlay coloured filters Comparison: Clear filter | |||||
| Outcome: reading speed (words per minute) Filter colour | Illustrative comparative risks* (95% CI) | No of Participants (studies) | Quality of the evidence (GRADE) | Study | |
| Assumed risk | Corresponding risk | ||||
| Control | Overlay coloured filters versus clear filter | ||||
| Rose filter | The mean reading speed (words perminute) using clear filter was 84 words per minute | The mean reading speed using rose filter was 9 lower (-24 lower to 6 higher) | 13 (1 study) | ⊕⊕○○ low1,2,3 | Eperjesi 2004 |
| Pink filter | The mean reading speed (words perminute) using clear filter was 84 words per minute | The mean reading speed using pink filter was 9 lower (-15 lower to -3 lower) | 13 (1 study) | ⊕⊕○○ low1,2,3 | Eperjesi 2004 |
| Yellow filter | The mean reading speed (words perminute) using clear filter was 84 words per minute | The mean reading speed using yellow filter was 7 lower (20 lower to 6 higher) | 13 (1 study) | ⊕⊕○○ low1,2,3 | Eperjesi 2004 |
| Orange filter | The mean reading speed (words perminute) using clear filter was 84 words per minute | The mean reading speed using orange filter was 13 lower (29 lower to 2 higher) | 13 (1 study) | ⊕⊕○○ low1,2,3 | Eperjesi 2004 |
| Mint filter | The mean reading speed (words per minute) using clear filter was 84 words per minute | The mean reading speed using mint filter was 8 lower (17 lower to 2 higher) | 13 (1 study) | ⊕⊕○○ low1,2,3 | Eperjesi 2004 |
| Lime filter | The mean reading speed (words per minute) using clear filter was 84 words per minute | The mean reading speed using rose filter was 6 lower (23.73 lower to 5.73 higher) | 13 (1 study) | ⊕⊕○○ low1,2,3 | Eperjesi 2004 |
| Gray filter | The mean reading speed (words per minute) using clear filter was 84 words per minute | The mean reading speed using grey filter was 4 lower (25 lower to 17 higher) | 13 (1 study) | ⊕⊕○○ low1,2,3 | Eperjesi 2004 |
| Blue filter | The mean reading speed (words per minute) using clear filter was 84 words per minute | The mean reading speed using blue filter was 12 lower (24 lower to 1 higher) | 13 (1 study) | ⊕⊕○○ low1,2,3 | Eperjesi 2004 |
| Aqua filter | The mean reading speed (words per minute) using clear filter was 84 words per minute | The mean reading speed using aqua filter was 9 lower (15 lower to 3 lower) | 13 (1 study) | ⊕⊕○○ low1,2,3 | Eperjesi 2004 |
| Purple filter | The mean reading speed (words per minute) using clear filter was 84 words per minute | The mean reading speed using rose filter was 14 lower (25 lower to 3 lower) | 13 (1 study) | ⊕⊕○○ low1,2,3 | Eperjesi 2004 |
The basis for the assumed risk (e.g. the median control group risk across studies) is provided in footnotes. The corresponding risk (and its 95% confidence interval) is based on the assumed risk in the comparison group and the relative effect of the intervention (and its 95% CI).
CI: Confidence interval;
GRADE Working Group grades of evidence
High quality: Further research is very unlikely to change our confidence in the estimate of effect.
Moderate quality: Further research is likely to have an important impact on our confidence in the estimate of effect and may change the estimate.
Low quality: Further research is very likely to have an important impact on our confidence in the estimate of effect and is likely to change the estimate.
Very low quality: We are very uncertain about the estimate.
Masking of participants not used in this review since it is not possible with low vision aids.
Inconsistency cannot be assessed when a single, or few, small cross-over type trials are included.
Wide confidence intervals.
| Prism spectacles versus conventional spectacles for adults with low vision | ||||||
|---|---|---|---|---|---|---|
| Patient or population: Adults with low vision Settings: Intervention: Prism spectacles Comparison: Conventional spectacles | ||||||
| Comparison | Outcomes | Illustrative comparative risks* (95% CI) | No of Participants (studies) | Quality of the evidence (GRADE) | Comments | |
| Assumed risk | Corresponding risk | |||||
| Control | Prism spectacles versus conventional spectacles | |||||
| Custom prism spectacles versus conventional spectacles | Reading speed (words per minute) | The mean reading speed using conventional spectacles was 67 words per minute | The mean reading speed using custom prism spectacles was 6 lower (25.42 lower to 13.42 higher) | 150 (1 study) | ⊕⊕○○ low1,2 | Smith 2005 |
| Reading acuity in logMAR | The mean reading acuity using conventional spectacles was 1.50 logMAR | The mean reading acuity using custom prism spectacles was 0.07 higher (0.05 lower to 0.19 higher) | 150 (1 study) | ⊕⊕○○ low1,2 | Smith 2005 | |
| Quality of life (NEIVFQ score) Scale from: 0-100. | The mean quality of life using conventional spectacles was 53 score | The mean quality of life using custom prism spectacles was 0 higher (5.62 lower to 5.62 higher) | 153 (1 study) | ⊕⊕⊕○ moderate1 | Smith 2005 | |
| Standard prism spectacles versus conventional spectacles | Reading speed (words per minute) | The mean reading speed using conventional spectacles was 67 words per minute | The mean reading speed 155 using standard prism (1 study) spectacles was 7 lower (25.91 lower to 11.91 higher) | 155 (1 study) | ⊕⊕○○ low1,2 | Smith 2005 |
| Reading acuity in logMAR | The mean reading acuity score using conventional spectacles was 1.50 logMAR | The mean reading acuity using standard prism spectacles was 0.06 higher (0.06 lower to 0.18 higher) | 155 (1 study) | ⊕⊕○○ low1,2 | Smith 2005 | |
| Quality of life (NEIVFQ score) Scale from: 0-100. | The mean quality of life score using conventional spectacles was 53 | The mean quality of 156 life using standard prism (1 study) spectacles was 1 higher (4.75 lower to 6.75 higher) | 156 (1 study) | ⊕⊕⊕○ moderate1 | Smith 2005 | |
The basis for the assumed risk (e.g. the median control group risk across studies) is provided in footnotes. The corresponding risk (and its 95% confidence interval) is based on the assumed risk in the comparison group and the relative effect of the intervention (and its 95% CI).
CI: Confidence interval;
GRADE Working Group grades of evidence
High quality: Further research is very unlikely to change our confidence in the estimate of effect.
Moderate quality: Further research is likely to have an important impact on our confidence in the estimate of effect and may change the estimate.
Low quality: Further research is very likely to have an important impact on our confidence in the estimate of effect and is likely to change the estimate.
Very low quality: We are very uncertain about the estimate.
Inconsistency cannot be assessed when a single trial is included.
Wide 95% confidence intervals.
Characteristics of Studies
Characteristics of included studies [ordered by study ID]
Culham 2004.
| Methods | Randomised presentation of devices. First, the clinician determined as many unique combinations of the order of showing each device and listed them. Second, an independent non-clinician was then asked to randomly rearrange the order of the possible combinations on the list. On completion of the clinical evaluation participants were loaned 2 of the electronic devices, each for a period of 1 week, for use at home. The devices were allocated randomly. Masking: Participant - masking issues are not described but the study participants were likely to be unmasked given the use of recognisable devices. Provider - same as above; Outcome - same as above. Exclusions after randomisation: None reported. Losses to follow-up: None reported. Unusual study design: Within-subject design, i.e. a cross-over study in which all participants try all 4 devices. After training the use is restricted to 2 devices per participant |
|
| Participants | Country: UK Number randomised: 10 individuals with AMD and 10 with EOMD were recruited from the low-vision clinic and specialist medical clinics at Moorfields Eye Hospital. Age: EOMD group: 21 - 57 (mean 41.8 years); AMD group: 54 - 82 (mean 73.5 years). Sex: 11 women, 9 men. Inclusion criteria: (1) English-speaking and prepared to attend 5 appointments; (2) visual acuity between 6/18 and 1/60 in the better eye and stable vision for at least 3 months; (3) to be experienced in the use of optical LVAs (i.e. for 1 year or more); (4) prior to recruitment all participants had to have received standard hospital care and any medical intervention required had been completed. Exclusion criteria: any co-existing conditions which may have affected the handling of devices or performance with them |
|
| Interventions | Treatment: 4 types of head-mounted electronic devices (HMDs): Flipperport, Jordy, Maxport, and NuVision. Participants' own spectacles were used with the HMDs when appropriate Control:
Duration: 1 week. |
|
| Outcomes | Use of the devices for a range of clinical and practical visual tasks. Assessment was based on clinical and practical visual tasks measured in the laboratory. On completion of the clinical evaluation, devices were also loaned to participants for use in their habitual environments for a period of 1 week, on a random basis.
|
|
| Notes | ||
| Risk of bias | ||
| Bias | Authors' judgement | Support for judgement |
| Random sequence generation (selection bias) | Low risk | Randomised presentation of devices; although no further detail was given on how randomisation sequence was generated, selection bias should be avoided since all participants used all devices (cross-over study design) |
| Allocation concealment (selection bias) | Low risk | Randomised presentation of devices; although no further detail was given on how randomisation sequence was concealed, selection bias should be avoided since all participants used all devices (cross-over study design) |
| Incomplete outcome data (attrition bias) All outcomes | Low risk | No loss to follow-up reported |
| Selective reporting (reporting bias) | Low risk | No protocol available, but primary outcome reported |
| Period effect | Low risk | Stable vision required during the last 3 months to include participants |
| Carry-over effect and period-by-treatment interaction | Unclear risk | No details reported |
| Other bias | Low risk | No other bias identified |
Eperjesi 2004.
| Methods | Method of allocation: It is reported that “the filters were presented randomly“, but no description of the methods is provided. Masking: Participant - masking issues are not described, but the study was likely to be unmasked given the use of recognisable coloured filters; Provider - same as above; Outcome - same as above. Exclusions after randomisation: None reported. Losses to follow-up: None reported. Unusual study design: Within-subject design, i.e. a cross-over study in which all participants try all 10 coloured overlay filters and the control clear one |
||
| Participants | Country: UK Number randomised: 12 consecutive participants were recruited over a 3-month period from the Focus on Blindness Low Vision Centre in Birmingham, a charitable voluntary organisation. Age: mean age 81 years, SD: 5.07 years. Sex: 9 women, 3 men. Inclusion criteria: (1) non-exudative AMD resulting in a relative scotoma with central fixation. Exclusion criteria: (1) near working reading acuity poorer than logMAR 1.00 (approximately equivalent to large print); (2) crystalline opacities greater than grade 1 on the Lens Opacity Classification System; (3) participants undergoing ophthalmological treatment |
||
| Interventions | Treatment: 10 different coloured light filter overlays (Intuitive Overlays) (figures in brackets are percentage transmission values); rose (78%); pink (78%); purple (67%); aqua (81%); blue (74%); lime-green (86%); mint-green (85%); yellow (93%); orange (83%); grey (71%) Control: a clear overlay (Roscolene # 00) (360 cdm-2) with 100% transmittance Duration: single test session |
||
| Outcomes | Reading rate calculated as the number of correct words per minute measured with the Rate of Reading Test (printed, nonsense, lower case sans serif, stationary text) | ||
| Notes | Tomeasure reading rate, tape recordings were replayed after each testing session and each participant scored by measuring the total time taken to read each block of test print and noting the errors on a score sheet | ||
| Risk of bias | |||
| Bias | Authors' judgement | Support for judgement | |
| Random sequence generation (selection bias) | Low risk | Randomised presentation of devices; although no further detail was given on how randomisation sequence was generated, selection bias should be avoided since all participants used all devices (cross-over study design) | |
| Allocation concealment (selection bias) | Low risk | Randomised presentation of devices; although no further detail was given on how randomisation sequence was concealed, selection bias should be avoided since all participants used all devices (cross-over study design) | |
| Incomplete outcome data (attrition bias) All outcomes | Low risk | No loss to follow-up or exclusion after randomisation reported | |
| Selective reporting (reporting bias) | Low risk | No protocol available, but primary outcome reported | |
| Period effect | Low risk | Participants with non-exudative AMD were included who are expected to have stable vision in the study period | |
| Carry-over effect and period-by-treatment interaction | Unclear risk | No details reported | |
| Other bias | Low risk | No other bias identified | |
Goodrich 2001.
| Methods | Method of allocation: Randomisation was not used but the order of presentation of the devices was rotated for consecutive participants (quasi-random assignment). Masking: Participant - masking issues are not described but the study was likely to be unmasked given the use of recognisable devices. Provider - same as above; Outcome - same as above Exclusions after randomisation: none reported. Losses to follow-up: none reported. Unusual study design: Within-subject design, i.e. a cross-over study in which all participants try the devices consecutively |
|
| Participants | Country: USA Number randomised: 22 veterans enrolled in the residential rehabilitation programme of the Western Blind Rehabilitation Center (none with previous reading training). Age: mean 73 (range: 53 - 87) years Sex: 20 men, 2 women. Inclusion criteria: (1) legal blindness; (2) central scotoma with a intact peripheral field; (3) stated desire for reading rehabilitation. Exclusion criteria: (1) cognitive deficits or current use of medication that would impair reading ability; (2) illiteracy |
|
| Interventions | 5 days “hands-on” training with each of the 3 types of devices (the prescribed optical device considered as control). Eccentric viewing training preceded reading training. Treatment: stand-mounted CCTV, hand-held CCTV using a 27-inch television. Control: prescribed optical device (stand magnifier n = 19; microscopic lenses n = 3). Duration: 15 training sessions plus sessions needed for evaluation |
|
| Outcomes | Reading speed using paragraphs of 250 words in Times New Roman (1 M font) with 5th-grade difficulty reading comprehension assessed with 5 question for each paragraph; Reading duration during each training session; Participants' preferences for a specific device with forced and open-ended questions | |
| Notes | ||
| Risk of bias | ||
| Bias | Authors' judgement | Support for judgement |
| Random sequence generation (selection bias) | Low risk | Quasi-randomised study: the order of presentation of the devices was rotated for consecutive participants; despite this, selection bias should be avoided since all participants used all devices (cross-over nature of the study design) |
| Allocation concealment (selection bias) | Low risk | Order of randomisation can be foreseen because rotation was used; despite this, selection bias should be avoided since all participants used all devices (cross-over nature of the study design) |
| Incomplete outcome data (attrition bias) All outcomes | Low risk | No loss to follow-up or exclusion after randomisation reported |
| Selective reporting (reporting bias) | Low risk | No protocol available, but primary outcome reported |
| Period effect | Unclear risk | No details reported |
| Carry-over effect and period-by-treatment interaction | Unclear risk | No details reported |
| Other bias | Low risk | No other bias identified |
Kleweno 2001.
| Methods | Method of allocation: The order of acuity testing in terms of viewing the standard cathode ray tube (CRT) monitor or the Virtual Retinal Display (VRD) first was randomised. The method is not described. Masking: Participant - masking issues are not described but the study should be unmasked given the use of recognisable devices; Provider - same as above; Outcome - same as aboveExclusions after randomisation: 2 participants removed from the study (1 requested to be withdrawn from the testing because of fatigue, 1 was unable to locate the VRD exit pupil and maintain a stable image on the small functional portions of peripheral retina). Losses to follow-up: None reported. Unusual study design: Within-subject design, i.e. a cross-over study in which all participants try the 2 devices consecutively |
|
| Participants | Country: USA Number randomised: 13 low-vision volunteers selected to represent the broad range of partially sighted individuals actively involved in the work force. Age: 28 - 59 years with a mean age of 41.2 years (SD 10.3). Sex: not reported. Inclusion criteria: either actively employed or in graduate school. Exclusion criteria: none. |
|
| Interventions | Treatment: the VRD scans modulated, low-power laser light to form bright, high-contrast, and high-resolution images directly onto the retina, a technology underlying the scanning laser ophthalmoscope (SLO). Each participant was given a reading speed test comprising 2 different test conditions:
Control: viewing a CRT with 2 test conditions:
Duration: single test session. |
|
| Outcomes |
|
|
| Notes | ||
| Risk of bias | ||
| Bias | Authors' judgement | Support for judgement |
| Random sequence generation (selection bias) | Low risk | Randomised presentation of devices; although no further detail was given on how randomisation sequence was generated, selection bias was likely to be avoided since all participants used all devices (cross-over nature of the study design) |
| Allocation concealment (selection bias) | Low risk | Randomised presentation of devices; although no further detail was given on how randomisation sequence was concealed, selection bias should be avoided since all participants used all devices (cross-over study design) |
| Incomplete outcome data (attrition bias) All outcomes | Low risk | No loss to follow-up or exclusion after randomisation reported |
| Selective reporting (reporting bias) | Low risk | No protocol available, but primary outcome reported |
| Period effect | Unclear risk | No details reported |
| Carry-over effect and period-by-treatment interaction | Unclear risk | No details provided. They used a reading test based on the MNREAD, which has short duration. Nonetheless, 1 participant withdrew because of fatigue |
| Other bias | Low risk | No other bias identified |
Ortiz 1999.
| Methods | Method of allocation: The order of presentation of the devices is reported to be counterbalanced across participants. It is assumed that this equals rotation or quasi-random assignment but it is not reported if randomisation was used. Masking: Participant -masking issues are not described but the study should be unmasked given the use of recognisable devices; Provider - same as above; Outcome - same as above Exclusions after randomisation: none reported. Losses to follow-up: none reported. Unusual study design: Within-subject design, i.e. a cross-over study in which all participants try the devices consecutively |
|
| Participants | Country: USA Number randomised: 10 Age: mean 47 (24 - 79) years. Sex: not reported. Inclusion criteria: proficient CCTV users. Exclusion criteria: none reported. |
|
| Interventions | Treatment: Head-mounted video magnifier called Low Vision Enhancement System (LVES). Control: CCTV. Duration: Not reported. |
|
| Outcomes |
|
|
| Notes | ||
| Risk of bias | ||
| Bias | Authors' judgement | Support for judgement |
| Random sequence generation (selection bias) | Low risk | Quasi-randomised study: the order of presentation of the devices was rotated (counterbalanced) for consecutive participants; even so, selection bias should be avoided since all participants used all devices (crossover study design) |
| Allocation concealment (selection bias) | Low risk | Order of randomisation can be foreseen because rotation was used; despite this, selection bias was likely to be avoided since all participants used all devices (cross-over study design) |
| Incomplete outcome data (attrition bias) All outcomes | Low risk | No loss to follow-up or exclusion after randomisation reported |
| Selective reporting (reporting bias) | Low risk | No protocol available, but primary outcome reported |
| Period effect | Unclear risk | No details reported |
| Carry-over effect and period-by-treatment interaction | Unclear risk | Authors reported they could not find a practice effect comparing the first and the last half of their tests, nor a decay of performance, but a quantitative assessment was not available |
| Other bias | Low risk | No other bias identified |
Peterson 2003.
| Methods | Method of allocation: Each magnifying device was presented in a random order to participants; theywere asked to complete (also in a randomorder) a series of 4 tests chosen specifically to replicate daily living tasks. Methods of randomisation are not described. Masking: Participant -masking issues are not described but the study should be unmasked given the use of recognisable devices. Provider - same as above; Outcome - same as above Exclusions after randomisation: none reported. Losses to follow-up: none reported. Unusual study design: Within-subject design, i.e. a cross-over study in which all participants try the devices consecutively |
|
| Participants | Country: UK Number randomised: 70 Age, Sex: 35 men with mean age: 68.3 (SD: 22.8) years and 35 women with mean age: 71.8 (SD: 20.6) years. Inclusion criteria: consecutive visually impaired participants. Each had previously undergone ophthalmologic care and a full low-vision examination including optimization of their refraction and their optical magnifier. Minimum magnification for comfortable reading of the participants' chosen print size was prescribed. Exclusion criteria: none. |
|
| Interventions | Treatment: various electronic vision enhancement systems (EVES) vs the subject's optimum conventional optical magnifier for near task. Optical magnifiers were a hand magnifier (n. 24), a stand magnifier (n. 45), and high-powered reading glasses (n. 1) with an average nominal magnification (lens dioptric power divided by 4) of 5.7 times (range, 2.0 - 14.7 times). EVES were:
|
|
| Outcomes | After an explanation, demonstration and a 2-minute active training period with each magnifying device the participants were asked to complete a series of 4 tests chosen to replicate daily living tasks:
4 versions of each task, equal in difficulty (in terms of number, length, and difficulty of words and page distance), were constructed and used in a randomised order to control fatigue effects |
|
| Notes | ||
| Risk of bias | ||
| Bias | Authors' judgement | Support for judgement |
| Random sequence generation (selection bias) | Low risk | Randomised presentation of devices; although no further detail was given on how the randomisation sequence was generated, selection bias should be avoided since all participants used all devices (crossover study design) |
| Allocation concealment (selection bias) | Low risk | Randomised presentation of devices; although no further detail was given on how randomisation sequence was concealed, selection bias was likely to be avoided since all participants used all devices (cross-over study design) |
| Incomplete outcome data (attrition bias) All outcomes | High risk | Not all participants could read using all devices; thus, the analysis is not intention-to-treat |
| Selective reporting (reporting bias) | Low risk | No protocol available, but primary outcome reported |
| Period effect | Unclear risk | No details reported |
| Carry-over effect and period-by-treatment interaction | Unclear risk | Authors reported they used reading and real-word tests of very short duration, but no quantitative details are available |
| Other bias | Low risk | No other bias identified |
Smith 2005.
| Methods | Participants were allocated using computer-generated randomisation codes prepared in advance. Randomisation and the ordering of spectacles were performed by a principal investigator who had no contact with participants during the study. Masking: Participant: yes Provider: no; Outcome: yes. Exclusions after randomisation: None reported. Losses to follow-up: 10 in the custom prism group, 6 in the standard prism group, and 2 in the placebo group |
|
| Participants | Country: UK Number randomised: 243 individuals with AMD at Manchester Royal Eye Hospital,England. Age: mean 81 years Sex: women 65% Inclusion criteria: English-speaking. Exclusion criteria: illiterate, resident in a hospital or a nursing home. Study duration: 3 months follow-up during the period July 15, 2001, through March31, 2003 |
|
| Interventions | Treatment: 3 types of test spectacles:
|
|
| Outcomes |
|
|
| Notes | ||
| Risk of bias | ||
| Bias | Authors' judgement | Support for judgement |
| Random sequence generation (selection bias) | Low risk | Participants were allocated to a group using computer-generated randomisation codes prepared in advance |
| Allocation concealment (selection bias) | Low risk | Randomisation and the ordering of spectacles were performed by a principal investigator who had no contact with participants during the study |
| Incomplete outcome data (attrition bias) All outcomes | Low risk | Low number of losses to follow-up: 10 in the custom prism group, 6 in the standard prism group, and 2 in the placebo group |
| Selective reporting (reporting bias) | Low risk | No protocol available, but primary outcome reported |
| Other bias | Low risk | No other bias identified |
Spitzberg 1995.
| Methods | Method of allocation: quasi-randomisation obtained by systematically rotating the order of presentation of the devices among participants. Masking: Participant - masking issues are not described but the study was likely to be unmasked given the use of recognisable devices; Provider - same as above; Outcome: same as above. Exclusions after randomisation: none reported. Losses to follow-up: none reported. Unusual study design: Within-subject design, i.e. a cross-over study in which all participants try the devices consecutively |
|
| Participants | Country: USA Number randomised: 39 from 5 low-vision clinics. Age: 9 - 77 years. Sex: not reported. Inclusion criteria: All participants were selected based on a need to use 3x magnification to read 1.0 M or 1. 5 M print. Exclusion criteria: None reported. |
|
| Interventions | Each participant trained dailywith 4 low-vision aids including at least 2 prototype devices for a minimum of 5 days. All participants practiced reading for 1 hour each day using materials developed for the study. Treatment: 4 new stand magnifiers with equivalent power: Spherical mirror magnifier covering 1 whole column width of newsprint; Cylindrical mirror magnifier covering one whole page width; reflecting prism magnifier with a 45 degree viewing angle; Zoom magnifier. Control: common stand magnifiers of the same power. Duration: 10 days. |
|
| Outcomes | Reading speed; Preference for each device including reporting detailed information on their looks, clarity, portability, comfort, ease of use, field and glare | |
| Notes | ||
| Risk of bias | ||
| Bias | Authors' judgement | Support for judgement |
| Random sequence generation (selection bias) | Low risk | Quasi-randomised study: the order of presentation of the devices was rotated (counterbalanced) for consecutive participants; even so, selection bias should be low since all participants used all devices (cross-over study design) |
| Allocation concealment (selection bias) | Low risk | Order of randomisation can be foreseen because rotation was used; despite this, selection bias should be low since all participants used all devices (cross-over study design) |
| Incomplete outcome data (attrition bias) All outcomes | Low risk | No loss to follow-up or exclusion after randomisation reported |
| Selective reporting (reporting bias) | Low risk | No protocol available, but primary outcome reported |
| Period effect | Unclear risk | No details reported |
| Carry-over effect and period-by-treatment interaction | Unclear risk | No details reported |
| Other bias | Low risk | No other bias identified |
Stelmack 1991.
| Methods | Method of allocation: The VA Cooperative Studies Center generated the randomization sequence and the code envelopes for randomising the order of device presentation. The set of envelopes was handed to the investigators at the beginning of the study. The research assistant opened an envelope at the time needed to assign the treatment order. Methods for the randomisation sequence: the 6 different possible orders of presentation of the devices were numbered in advance. A list of random numbers was computergenerated. The 7, 8, 9 and 0 were deleted and the remaining numbers used to identify the group (information provided by investigators). Masking: Participant - masking issues are not described, but the study should be unmasked given the use of recognisable devices; Provider: same as above; Outcome - same as above. Exclusions after randomisation: none reported. Losses to follow-up: none reported. Unusual study design: Within-subject design, i.e. a cross-over study in which all participants try the devices consecutively |
|
| Participants | Country: USA Number randomised: 37 participants admitted to the Central Blind Rehabilitation Center. Age: 50 or more. Sex: not reported. Inclusion criteria: 50 or older, diagnosis of post-disciform stage AMD or ocular histoplasmosis. Exclusion criteria: eye pathologies which would affect study results by compromisingvisual function |
|
| Interventions | Before allocation all participants were trained by a visual skills instructor to use his or her best retinal viewing area. Modifications of standard techniques were used, including stand with the bar, the clock method of distance training, the fixation and reading techniques. Participant progress in eccentric viewing training was monitored with the Pepper Visual Skills for Reading Test. Treatments: 3 types of commonly-used magnifiers: CCTV Illuminated Stand magnifier in conjunction with a bifocal or reading prescription to compensate for accommodative demand; Spectacle reading lenses: either prism half eyes or microscopes. The magnification used for each device was the lowest that enabled the participant to consistently read excerpts from the Readers Digest using the preferred level of illumination and a reading stand. Prior to testing each participant had a 1-hour training/practice session under the supervision of a visual skills instructor from the Central Blind Rehabilitation Center teaching staff |
|
| Outcomes | Silent reading speed recorded in words per minute; reading comprehension tested at the end of the article using 5 general questions graded from 0 - 5. Testing was considered invalid if the score was less than 4; reading duration measured in minutes and defined as the time the participant could read without visual discomfort | |
| Notes | ||
| Risk of bias | ||
| Bias | Authors' judgement | Support for judgement |
| Random sequence generation (selection bias) | Low risk | Quasi-randomised study: the order of presentation of the devices was rotated (counterbalanced) for consecutive participants; even so, selection bias should be avoided since all participants used all devices (crossover nature of the study design) |
| Allocation concealment (selection bias) | Low risk | Order of randomisation can be foreseen because rotation was used; despite this, selection bias should be low since all participants used all devices (cross-over study design) |
| Incomplete outcome data (attrition bias) All outcomes | Low risk | No loss to follow-up or exclusion after randomisation reported |
| Selective reporting (reporting bias) | Low risk | No protocol available, but primary outcome reported |
| Period effect | Low risk | Participants with disciform neovascular maculopathy were included who are expected to have stable vision during the study period |
| Carry-over effect and period-by-treatment interaction | Unclear risk | No details reported |
| Other bias | Low risk | No other bias identified |
Watson 2005.
| Methods | Within-subject study with random assignment of the first device used | |
| Participants | 2 groups of 15 veteran participants with age-related or juvenile macular degeneration or diabetic retinopathy, visual acuity 20/50 or less in the better eye | |
| Interventions | Hybrid-diffractive spectacle magnifier compared with a refractive spectacle magnifier and an aplanatic spectacle magnifier (2 separate experiments) | |
| Outcomes | MNREAD reading speed, reading acuity and critical print size. Pepper Visual skills for Reading Test. Morgan Low Vision reading Comprehensioon Assessment. Self-report of satisfaction with reading using a visual analogue scale | |
| Notes | ||
| Risk of bias | ||
| Bias | Authors' judgement | Support for judgement |
| Random sequence generation (selection bias) | Low risk | Random presentation of first device, but sequence generation method not described; even so, selection bias should be low since all participants used all devices (cross-over study design) |
| Allocation concealment (selection bias) | Low risk | Unclear if order of randomisation could be foreseen since no detail given; despite this, selection bias should be low since all participants used all devices (cross-over study design) |
| Incomplete outcome data (attrition bias) All outcomes | Low risk | No loss to follow-up or exclusion after randomisation reported |
| Selective reporting (reporting bias) | Low risk | No protocol available, but primary outcome reported |
| Period effect | Unclear risk | No details reported |
| Carry-over effect and period-by-treatment interaction | Unclear risk | No details reported |
| Other bias | Low risk | No other bias identified |
AMD - age-related macular degeneration
CCTV - closed circuit television
EOMD - early onset macular disease
ETDRS - Early Treatment of Diabetic Retinopathy Study
LVA - low-vision aid
SD - standard deviation VRD - virtual retinal display
Characteristics of excluded studies [ordered by study ID]
| Study | Reason for exclusion |
|---|---|
| Blaskey 1990 | Assessment of Irlen filters in people with reading difficulty not due to low vision |
| Bonatti 2008 | Stand magnifier compared to hand magnifier regarding subjective preference, but reading speed or reading acuity data not available |
| Cheong 2005 | Large-print reading training effect and not LVA effect studied |
| Cheong 2009 | Reading performance of 29 participants with AMD assessed using their habitual stand magnifier with and without a temporary line guide attached; no comparison of different LVAs |
| Cohen 1991 | LVAs compared in normal observers |
| Culham 2009 | The study aims to elicit the users' responses to 4 electronic HMDs and to correlate users' opinion with performance, but no reading speed or acuity data for each device are provided |
| Goodrich 1977 | Participants assigned to 2 groups but no randomisation used (information obtained by the first author) |
| Goodrich 2004 | Within-subject or cross-over study but all participants underwent training and testing with the 3 devices in the same order |
| Jacobs 1990 | Evaluated whether the colour of the screen altered performance of CCTV |
| Kuyk 1990 | Comparison of motorised and manual focus Keplerian telescopes, but target spotting and not reading performance assessed |
| Lawton 1989 | Before-and-after study on compensation filters boosting the amplitudes of the intermediate spatial frequencies more than the amplitude of the lower spatial frequencies. No control group |
| LOVIT 2008 | Multicentre randomised study comparing the effectiveness of a low-vision rehabilitation programme with control (waiting list); outcome measure was change in participants' visual reading ability estimated from participant responses to the Veterans Affairs Low-Vision Visual Functioning Questionnaire (LV VFQ-48) reading items completed at baseline compared with 4 months after enrolment for the treatment and control groups. No comparison of different reading aids |
| Margrain 2000 | No comparisons between LVAs |
| Parodi 2004 | RCT including 28 participants comparing the effect of prisms (5 to 7 prismatic dioptres) in the better eye versus control. Excluded because the aim was to improve visual acuity |
| Rees 2006 | Comparison of low-cost and high-cost hand-held magnifiers, but no comparison of different LVAs |
| Reeves 2004 | The effectiveness of 3 models of low-vision rehabilitation for people with AMD compared rather than the efficacy of specific types of LVAs |
| Rohrschneider 1998 | Assessed reading speed in CCTV with different image refresh rates (50, 60 and 70 Hz of frequency) |
| Rosenberg 1989 | Quasi-randomised study comparing prismatic correction in 19 participants versus 11 controls. Excluded because the aim of the study was to improve visual acuity not reading acuity |
| Rossi 1990 | Effect on walking and transfer assessed in stroke patients with hemianopsia or visual neglect using Fresnel prisms vs control. No reading speed data |
| Scott 2002 | Evaluation of performance in icon identification tasks while the screen features of the graphical user interface were varied |
| Wolffshon 2002 | Coloured lenses compared with no filter in 10 AMD people and 5 healthy controls, but reading speed not assessed |
AMD - age-related macular degeneration
HMD - head-mounted device
LVA - low-vision aid
Characteristics of studies awaiting assessment [ordered by study ID]
Demers-Turco 2001.
| Methods | Quote: “Twenty-nine adults (distance visual acuity 20/80-20/320) from the Vision Rehabilitation Center read short paragraphs (41-44 words) using three 10X devices (a portable electronic magnification system (EMS), a hand held magnifier (MAG) and table top CCTV). Subjects read three font sizes (18, 12, and 8 pt, san serif) with each device. We defined a weighted words per minute reading rate from the time taken to read and approximate number of words read from each paragraph. We also recorded age (19-91), diagnosis (41% ARMD) and previous use of each device.” |
| Participants | 29 adults |
| Interventions | A portable electronic magnification system (EMS), a hand held magnifier (MAG) and table top CCTV |
| Outcomes | Quote: “The group as a whole read faster with the CCTV, then magnifier, then portable EMS (P<0.0001). To our surprise, with each device, reading was slowest with 18 pt and fastest with 8 pt. There was no effect of familiarity with device. For subjects with ARMD, again, reading was fastest with CCTV but there was no difference between MAG and EMS. Unlike the group as a whole, reading rate was the same for all font sizes except with CCTV, where reading was fastest with 8 pt type. Conclusions: The portable EMS provides no benefit for low vision patients. The increase in reading performance with decreasing font size may be due to increased field of view. Further research is required.” |
| Notes | ARVO abstract only |
Goodrich 1998.
| Methods | Quote: “In this study we explored the effect reading training and device type (optical aid closed circuit television (CCTV)) on reading performance of individuals with central field loss. While a central field loss reduces reading performance, rehabilitation can restore function, but the question of how much rehabilitative training is necessary to optimize reading has not been addressed. Reading performance with low vision aids has similarly been shown to be effective, but the value of optics aids versus CCTV has not been extensively explored. METHOD: Fifty subjects with central field loss who participated in the rehabilitation program of the Western Blind Rehabilitation Center volunteered to participate in the stud; which used a randomized, counter-balances design. All subjects received comprehensive optometric examinations, were prescribed an optimum near vision optical aid and CCTV. The training group received ten days of instructor training with their optical aid and fifteen days of instructor training with their CCTV. The other group received five days of instructor training with the optical aid followed by five days of independent practice and seven days of training with the CCTV and eight days of independent practice. The variables of acuity, contrast sensitivity, reading speed and reading duration were measured.” |
| Participants | 50 subjects with central loss |
| Interventions | Optimum near vision optical aid and CCTV |
| Outcomes Notes | Quote: “Short term instructor training combined with independent practice was as effective in optimizing reading speed and duration as was the longer term instructor training. CCTVs provided greater reading speed and duration than did optical aids. Reading performance with an optical aid was only moderately correlated with reading performance with a CCTV. CONCLUSION. Instructor training combined with independent practice is an effective method of rehabilitating reading skills. CCTVs offer advantages in terms of reading speed and duration. Reading training is a variable which, if taken into account, can improve both low vision clinical practice and research”American Academy of Optometry abstract only |
Goodrich 2000a.
| Methods | Quote: “Reading aids are arguably the most frequently prescribed low vision device, yet there is little comparative information on the performance to be expected for different low vision devices prescribed for patients having different characteristics. PURPOSE. This study sought to provide comparative information for clinicians to assist in prescribing low vision reading devices, and for patients in selecting which device will best meet their needs in relation to its cost. METHOD. Subjects were 133 patients (mean age = 68.5 yrs) of the Western Blind Rehabilitation Center. Subjects were assigned to one of three groups based upon field loss: central (N = 90); peripheral (N = 28); or mixed central and peripheral field loss (N = 15). The study used a within subjects, counterbalanced design with all subjects trained in reading with an optical aid (primarily stand magnifiers or microscopic lenses) and CCTV. Reading speeds and durations were recorded.” |
| Participants | 132 low-vision participants |
| Interventions | Optical aid (primarily stand magnifiers or microscopic lenses) and CCTV |
| Outcomes | Quote: “Central loss subjects read 20% faster and 34% longer with the CCTV than their best optical aid. Peripheral loss subjects read only 12% faster and 23% longer with CCTV than their best optical aid, and mixed loss subjects read only 9% faster and 34% longer. CONCLUSIONS. CCTVs, as a low vision reading device, provided all subjects in this study with an average of 23% to 34% longer reading durations. Reading speeds averaged between 9% and 20% greater. Central loss subjects appear to gain the greatest benefit from CCTV, while mixed and peripheral loss subjects gain a greater reading duration with the CCTV. The relative benefits of devices for each patient group will be discussed in the context of information that may assist the clinician in prescribing low vision reading devices. Prescribing information should encompass the patient s reading needs and the cost of the devices, as well as, information about the performance patient's can expect from the device.” |
| Notes | American Academy of Optometry abstract only |
Goodrich 2000b.
| Methods | Quote: “Clinicians frequently prescribe reading devices for low vision patients having a central field loss, however there is an absence of critical types of information upon which to base this decision. In particular, there is a lack of information relating to the reading speed and duration to be expected from different types of low vision devices. PURPOSE. This study sought to provide comparative information for clinicians to use to assist clinicians in prescribing and patients in selecting the most cost-effective device. METHOD. The study compared optical aids with two types of CCTVs that differ in two important characteristics: price and whether the camera was stand mounted with an X-Y table or whether the camera was manually scanned. A within subjects design was chosen and we used measures of reading speed and duration as the performance measures. The 22 central field loss subjects indicated their preferences in response to seven forced choice or open-ended questions.” |
| Participants | 22 central field loss participants |
| Interventions | optical aids and 2 types of CCTVs |
| Outcomes | Quote: “Subject reading speed and duration were significantly greater with the CCTV systems than with optical aids, however no significant differences were found between the two types of CCTVs. Patients expressed clear preference for one versus the other type of CCTV, with over-all preference for the standmounted system. When considering the price differential between types of CCTVs patient preferences were equally divided. CONCLUSIONS. Clinicians can expect significant reading performance differences between optical aids and CCTVs. Patients, given the opportunity to choose, will factor features, performance, and price information into the selection of low vision reading device(s).” |
| Notes |
Goodrich 2001a.
| Methods | Quote: “Low power lasers have been used for purposes ranging from scanning laser ophthalmoscopes to heads-up displays for aircraft pilots. In this study we have begun a formal examination of one possible application as a reading display for low vision patients. The prototype device, called Nomad, is a monocular, head-mounted display that uses a red laser to display text onto the retina. A CCTV camera and XY table provided input. METHODS: Twenty subjects read with the prescribed optical device, CCTV, and Nomad. Data was collected on subject visual acuity, pathology, contrast sensitivity, duration of visual disability, and reading speed and reading duration with each device. In addition subjective impressions of the Nomad were gathered using both forced choice and open-ended questions.” |
| Participants | 20 low vision participants |
| Interventions | Prescribed optical device, CCTV, and Nomad |
| Outcomes | “Subject reading speeds with the Nomad were faster than optical devices, but slower than CCTV. Reading durations with the Nomad were similar to that with CCTV; both of which were about 3X longer than optical devices. Subjective data indicated that subjects would prefer another color, or full-color laser for the Nomad and would like a more comfortable head-mount. Most subjects preferred the brightness and sharpness of the Nomad display to the displays of the optical devices and CCTVs. The brightness and high contrast may allow patients with extremely low vision to maintain, the ability to read visually even when conventional devices are no longer effective. CONCLUSIONS: The Nomad is a prototype display with potential as both a distance and near vision aid. At present it is a useful research tool to begin examining the potential benefits of new visual display technology. We will discuss our findings in relation to this potential.” |
| Notes | American Academy of Optometry abstract only |
Kaida 2005.
| Methods | Within-subject study (2 low-vision aids tested on the same participant); order of presentation randomised (coin toss, as notified by the authors) |
| Participants | 13 low-vision persons participated in the study. Their ages ranged from 57 - 82 years, average 70 years. Their best corrected visual acuity ranged from 0.01 - 0.3, average 0.04. They were asked to read characters with these 2 devices for 20 seconds text of decreasing print size |
| Interventions | A hand-held retinal projection system was compared with a face-mounted video display using a CCTV system |
| Outcomes | Reading speed, critical print size |
| Notes | Article in Japanese; authors have been contacted to collect data |
Sonsino 2000.
| Methods | Quote: “Portability and ease of text and spot reading is a challenge for low vision patients needing high levels of magnification. ‘Powervision,’ a new, head-mounted electronic magnification system, offers portable high magnification for reading. This pilot study compared the speed and accuracy of text and spot reading by low vision patients using ‘Powervision’ (P), traditional CCTV (C) and a comparable hand held magnifier (H). METHODS. Twenty patients from the Vision Rehabilitation Center of the Mass. Eye and Ear Infirmary best corrected to < or = 20/80, could read English, and consented to participate were included. Patients were scored on time and accuracy of reading three short paragraphs of text (8, 12, 18 pt print) and spot reading of a hospital bill. Patients reported ease of reading with each of the three devices.” |
| Participants | 20 low-vision participants |
| Interventions | Powervision, traditional CCTV and a comparable hand held magnifier |
| Outcomes | Quote: “Ages ranged 22-92 (mean 58.3), with acuities of 20/80-20/800 (mean 20/267), and primary diagnoses of ARMD (23%) and other etiologies of visual loss. Text reading mean scores (360s maximum) were P: 313s, C: 180s, H: 248s, and accuracy (12.0=whole paragraph correct, 0=could not read) was P: 8.4, C: 11.3, H: 8.9. Spot reading mean times were P: 95s, C: 60s, H: 83s and accuracy (4.0= all correct, 8.0= all incorrect) measured P: 5.4, C: 4. 2, H: 5.1. Mean patient reports of ease of use (1=Very Easy, 5=Very Difficult) were P: 3.5, C: 1.9, H: 3.1 for text reading and P: 3.6, C: 1.7, H: 2.8 for spot reading. DISCUSSION. In this pilot population, despite its portability, Powervision scored less well on speed and accuracy of spot and test reading and for patient report of ease of use. Planned redesign and training in use may improve patient performance.” |
| Notes | ARVO abstract only |
Data And Analyses
Comparison 1. Electronic device (various types of CCTV) versus optical device.
| Outcome or subgroup title | No. of studies | No. of participants | Statistical method | Effect size |
|---|---|---|---|---|
| 1 Reading speed (words per minute) | 3 | Mean difference (Fixed, 95% CI) | Totals not selected | |
| 1.1 Stand-mounted CCTV versus best prescribed optical device | 1 | Mean difference (Fixed, 95% CI) | 0.0 [0.0, 0.0] | |
| 1.2 Stand-mounted CCTV versus participant's optical device | 1 | Mean difference (Fixed, 95% CI) | 0.0 [0.0, 0.0] | |
| 1.3 Mouse-based device (27” TV monitor) versus best prescribed optical device | 1 | Mean difference (Fixed, 95% CI) | 0.0 [0.0, 0.0] | |
| 1.4 Mouse-based device (14” monitor) versus participant's optical device | 1 | Mean difference (Fixed, 95% CI) | 0.0 [0.0, 0.0] | |
| 1.5 Mouse-based head-mounted device versus participant's optical device | 1 | Mean difference (Fixed, 95% CI) | 0.0 [0.0, 0.0] | |
| 1.6 Flipperport head-mounted CCTV (table stand camera) versus optical device | 1 | Mean difference (Fixed, 95% CI) | 0.0 [0.0, 0.0] | |
| 1.7 Jordy head-mounted CCTV versus optical device | 1 | Mean difference (Fixed, 95% CI) | 0.0 [0.0, 0.0] | |
| 1.8 Maxport head-mounted CCTV versus optical device | 1 | Mean difference (Fixed, 95% CI) | 0.0 [0.0, 0.0] | |
| 1.9 NuVision head-mounted CCTV versus optical device | 1 | Mean difference (Fixed, 95% CI) | 0.0 [0.0, 0.0] | |
| 2 Reading duration in minutes | 1 | Mean difference (Fixed, 95% CI) | Totals not selected | |
| 2.1 Stand CCTV versus optical device | 1 | Mean difference (Fixed, 95% CI) | 0.0 [0.0, 0.0] | |
| 2.2 Hand-held CCTV versus optical device | 1 | Mean difference (Fixed, 95% CI) | 0.0 [0.0, 0.0] |
Comparison 2. Stand-based closed-circuit television (CCTV) versus head-mounted electronic device (HMD).
| Outcome or subgroup title | No. of studies | No. of participants | Statistical method | Effect size |
|---|---|---|---|---|
| 1 Reading speed (words per minute) | 3 | Mean difference (Fixed, 95% CI) | 3.13 [-3.47, 9.73] | |
| 2 Reading acuity (logMAR) | 1 | Mean difference (Fixed, 95% CI) | Totals not selected |
Comparison 3. Stand-based (HHD) closed-circuit televiseon (CCTV) versus hand-held, mouse-based electronic device.
| Outcome or subgroup title | No. of studies | No. of participants | Statistical method | Effect size |
|---|---|---|---|---|
| 1 Reading speed (words per minute) | 2 | Mean difference (Fixed, 95% CI) | -9.54 [-19.36, 0.27] | |
| 2 Reading duration in minutes | 1 | Mean difference (Fixed, 95% CI) | Totals not selected |
Comparison 4. Diffractive spectacle mounted magnifiers vs control.
| Outcome or subgroup title | No. of studies | No. of participants | Statistical method | Effect size |
|---|---|---|---|---|
| 1 MNREAD maximum reading speed (words per minute) | 1 | Mean Difference (Fixed, 95% CI) | Totals not selected | |
| 1.1 Diffractive versus refractive-aspheric spectacle magnifier | 1 | Mean Difference (Fixed, 95% CI) | 0.0 [0.0, 0.0] | |
| 1.2 Diffractive versus aplanatic spectacle magnifier | 1 | Mean Difference (Fixed, 95% CI) | 0.0 [0.0, 0.0] | |
| 2 MNREAD critical print size (M print size) | 1 | Mean Difference (Fixed, 95% CI) | Totals not selected | |
| 2.1 Diffractive versus refractive-aspheric spectacle magnifier | 1 | Mean Difference (Fixed, 95% CI) | 0.0 [0.0, 0.0] | |
| 2.2 Diffractive versus aplanatic spectacle magnifier | 1 | Mean Difference (Fixed, 95% CI) | 0.0 [0.0, 0.0] | |
| 3 Morgan Low Vision Reading Comprehension Assessment | 1 | Mean Difference (Fixed, 95% CI) | Totals not selected | |
| 3.1 Diffractive versus refractive-aspheric spectacle magnifier | 1 | Mean Difference (Fixed, 95% CI) | 0.0 [0.0, 0.0] | |
| 3.2 Diffractive versus aplanatic spectacle magnifier | 1 | Mean Difference (Fixed, 95% CI) | 0.0 [0.0, 0.0] |
Comparison 5. Overlay coloured filters versus clear filter.
| Outcome or subgroup title | No. of studies | No. of participants | Statistical method | Effect size |
|---|---|---|---|---|
| 1 Reading speed (words per minute) | 1 | Mean difference (Fixed, 95% CI) | Totals not selected | |
| 1.1 Rose filter | 1 | Mean difference (Fixed, 95% CI) | 0.0 [0.0, 0.0] | |
| 1.2 Pink filter | 1 | Mean difference (Fixed, 95% CI) | 0.0 [0.0, 0.0] | |
| 1.3 Yellow filter | 1 | Mean difference (Fixed, 95% CI) | 0.0 [0.0, 0.0] | |
| 1.4 Orange filter | 1 | Mean difference (Fixed, 95% CI) | 0.0 [0.0, 0.0] | |
| 1.5 Mint filter | 1 | Mean difference (Fixed, 95% CI) | 0.0 [0.0, 0.0] | |
| 1.6 Lime filter | 1 | Mean difference (Fixed, 95% CI) | 0.0 [0.0, 0.0] | |
| 1.7 Gray filter | 1 | Mean difference (Fixed, 95% CI) | 0.0 [0.0, 0.0] | |
| 1.8 Blue filter | 1 | Mean difference (Fixed, 95% CI) | 0.0 [0.0, 0.0] | |
| 1.9 Aqua filter | 1 | Mean difference (Fixed, 95% CI) | 0.0 [0.0, 0.0] | |
| 1.10 Purple filter | 1 | Mean difference (Fixed, 95% CI) | 0.0 [0.0, 0.0] |
Comparison 6. Prism spectacles versus conventional spectacles.
| Outcome or subgroup title | No. of studies | No. of participants | Statistical method | Effect size |
|---|---|---|---|---|
| 1 Reading speed (words per minute) | 1 | Mean difference (Fixed, 95% CI) | Totals not selected | |
| 1.1 Custom prism spectacles versus conventional spectacles | 1 | Mean difference (Fixed, 95% CI) | 0.0 [0.0, 0.0] | |
| 1.2 Standard prism spectacles versus conventional spectacles | 1 | Mean difference (Fixed, 95% CI) | 0.0 [0.0, 0.0] | |
| 2 Critical Print Size in logMAR | 1 | Mean difference (Fixed, 95% CI) | Totals not selected | |
| 2.1 Custom prism spectacles versus conventional spectacles | 1 | Mean difference (Fixed, 95% CI) | 0.0 [0.0, 0.0] | |
| 2.2 Standard prism spectacles versus conventional spectacles | 1 | Mean difference (Fixed, 95% CI) | 0.0 [0.0, 0.0] | |
| 3 Quality of life (NEI-VFQ score) | 1 | Mean difference (Fixed, 95% CI) | Totals not selected | |
| 3.1 Custom prism spectacles versus conventional spectacles | 1 | Mean difference (Fixed, 95% CI) | 0.0 [0.0, 0.0] | |
| 3.2 Standard prism spectacles versus conventional spectacles | 1 | Mean difference (Fixed, 95% CI) | 0.0 [0.0, 0.0] |
Analysis 1.1. Comparison 1 Electronic device (various types of CCTV) versus optical device, Outcome 1 Reading speed (words per minute).
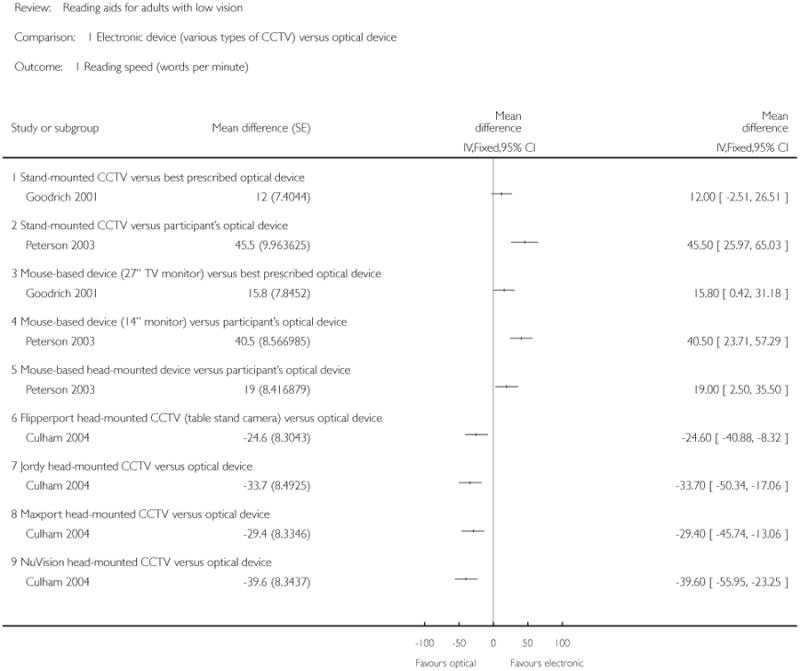
|
Analysis 1.2. Comparison 1 Electronic device (various types of CCTV) versus optical device, Outcome 2 Reading duration in minutes.
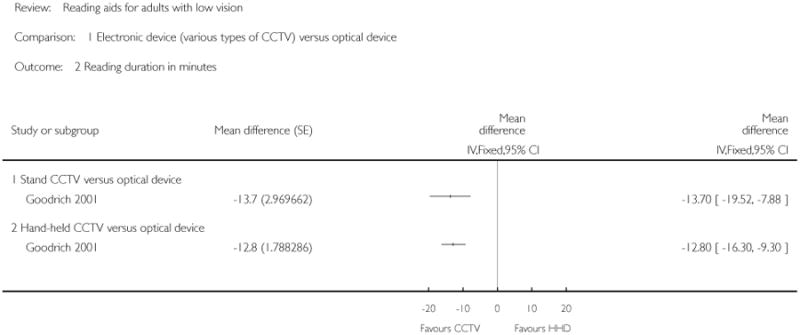
|
Analysis 2.1. Comparison 2 Stand-based closed-circuit television (CCTV) versus head-mounted electronic device (HMD), Outcome 1 Reading speed (words per minute).
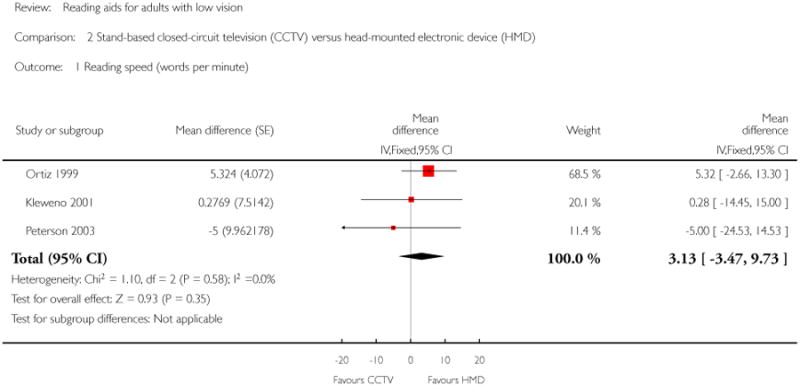
|
Analysis 2.2. Comparison 2 Stand-based closed-circuit television (CCTV) versus head-mounted electronic device (HMD), Outcome 2 Reading acuity (logMAR).
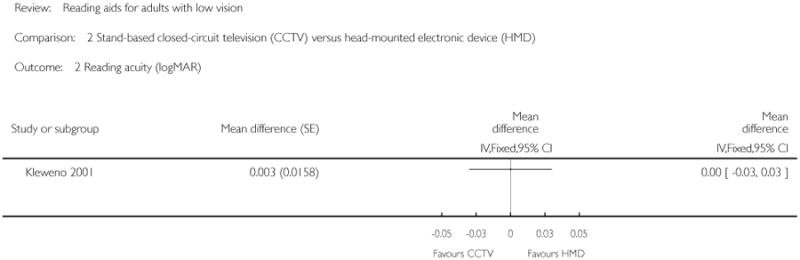
|
Analysis 3.1. Comparison 3 Stand-based closed-circuit television (CCTV) versus hand-held, mouse-based electronic device (HHD), Outcome 1 Reading speed (words per minute).
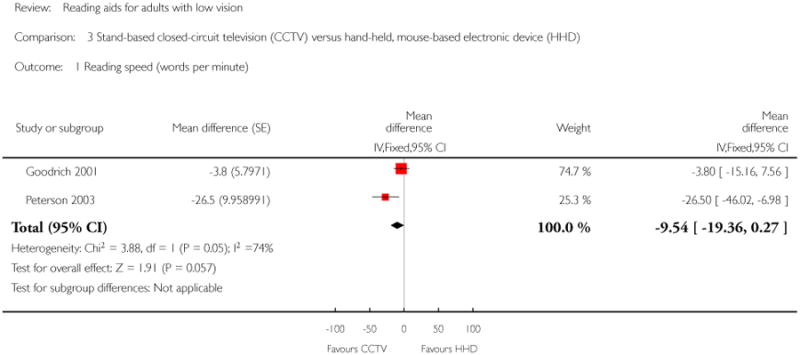
|
Analysis 3.2. Comparison 3 Stand-based closed-circuit television (CCTV) versus hand-held, mouse-based electronic device (HHD), Outcome 2 Reading duration in minutes.
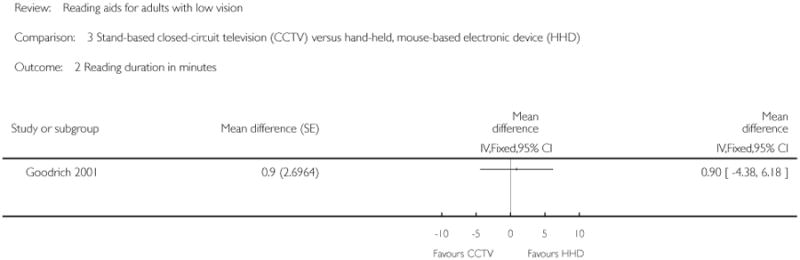
|
Analysis 4.1. Comparison 4 Diffractive spectacle mounted magnifiers vs control, Outcome 1 MNREAD maximum reading speed (words per minute).
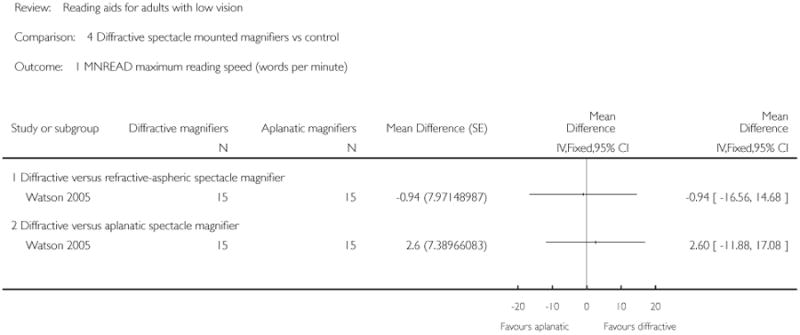
|
Analysis 4.2. Comparison 4 Diffractive spectacle mounted magnifiers vs control, Outcome 2 MNREAD critical print size (M print size).
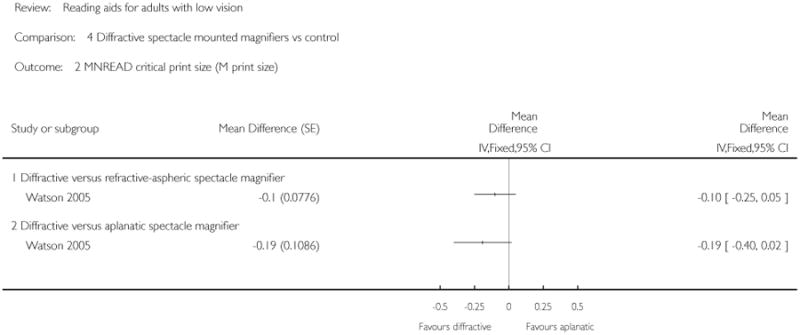
|
Analysis 4.3. Comparison 4 Diffractive spectacle mounted magnifiers vs control, Outcome 3 Morgan Low Vision Reading Comprehension Assessment.
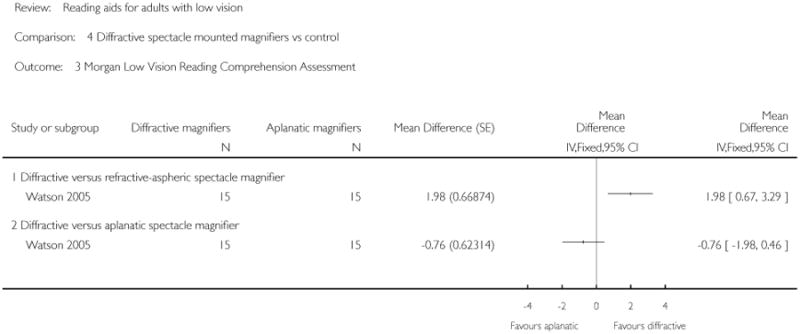
|
Analysis 5.1. Comparison 5 Overlay coloured filters versus clear filter, Outcome 1 Reading speed (words per minute).
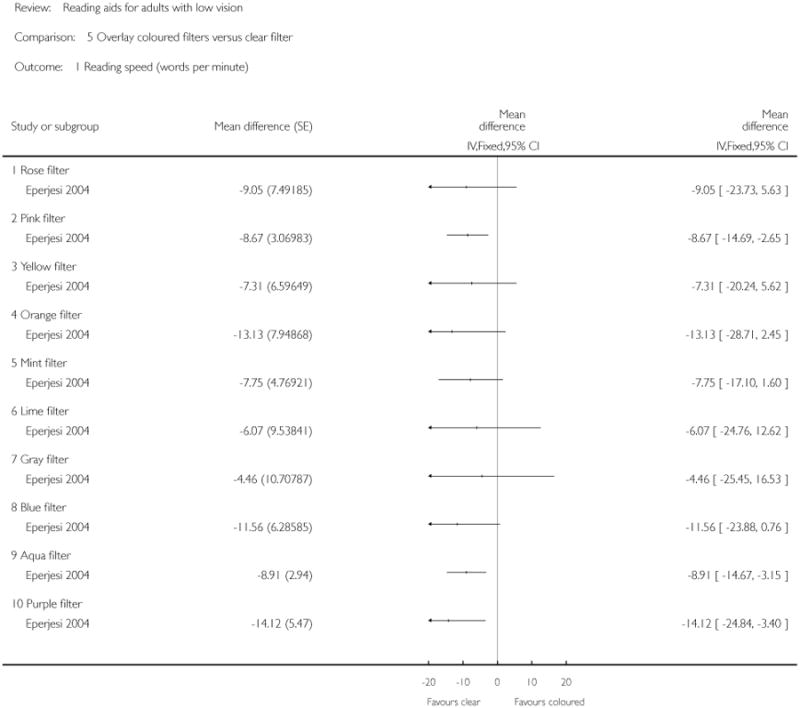
|
Analysis 6.1. Comparison 6 Prism spectacles versus conventional spectacles, Outcome 1 Reading speed (words per minute).
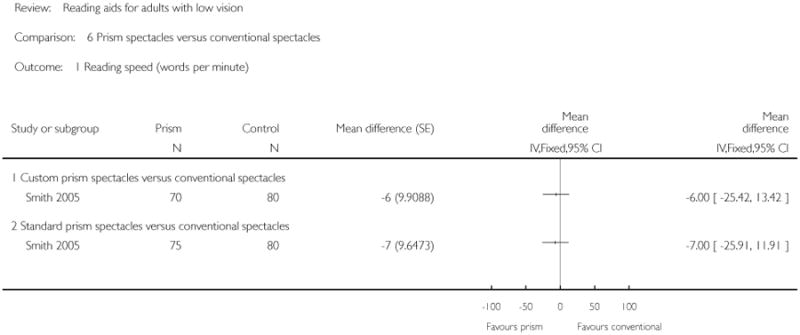
|
Analysis 6.2. Comparison 6 Prism spectacles versus conventional spectacles, Outcome 2 Critical Print Size in logMAR.
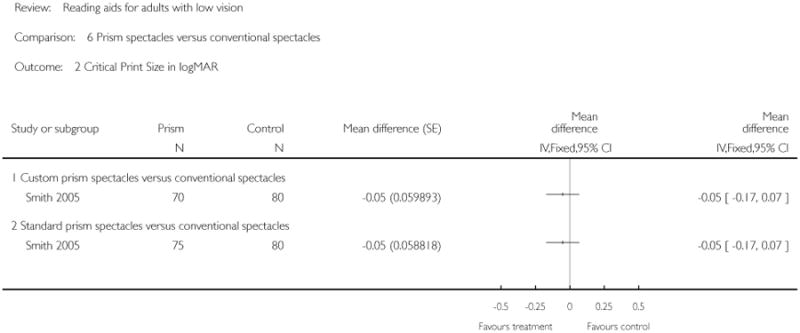
|
Analysis 6.3. Comparison 6 Prism spectacles versus conventional spectacles, Outcome 3 Quality of life (NEI-VFQ score).
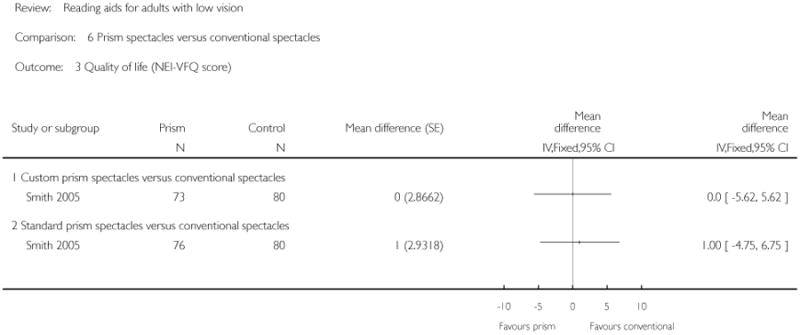
|
Appendix 1. CENTRAL search strategy
#1 MeSH descriptor: [Vision, Low] explode all trees
#2 MeSH descriptor: [Vision Disorders] explode all trees
#3 MeSH descriptor: [Visually Impaired Persons] explode all trees
#4 (low* or handicap* or subnormal* or impair* or partial* or disab*) near/3 (vision or visual* or sight*)
#5 #1 or #2 or #3 or #4
#6 MeSH descriptor: [Sensory Aids] explode all trees
#7 reading near/3 aid*
#8 telescop* or magnif* or aid* or device* or instrument* or equipment or apparatus
#9 cctv* or video* or computer* or scanner*
#10 closed near/3 circuit*
#11 #6 or #7 or #8 or #9 or #10
#12 MeSH descriptor: [Reading] explode all trees
#13 read or reading
#14 #12 or #13
#15 #5 and #11 and #14
Appendix 2. MEDLINE (OvidSP) search strategy
exp low vision/
exp vision disorders/
exp visually impaired persons/
((low$ or handicap$ or subnormal$ or impair$ or partial$ or disab$) adj3 (vision or visual$ or sight$)).tw.
or/1-4
exp sensory aids/
(closed adj3 circuit$).tw.
(cctv$ or video$ or computer$ or scanner$).tw.
(telescop$ or magnif$ or aid$ or device$ or instrument$ or equipment or apparatus).tw.
(reading adj3 aid$).tw.
or/6-10
exp reading/
(read or reading).tw.
or/12-13
5 and 11 and 14
Appendix 3. EMBASE (OvidSP) search strategy
exp visual disorder/
((low$ or handicap$ or subnormal$ or impair$ or partial$ or disab$) adj3 (vision or visual$ or sight$)).tw.
or/1-2
exp general medical aids/
(reading adj3 aid$).tw.
(telescop$ or magnif$ or aid$ or device$ or instrument$ or equipment or apparatus).tw.
(cctv$ or video$ or computer$ or scanner$).tw.
(closed adj3 circuit$).tw.
or/4-8
exp reading/
(read or reading).tw.
or/10-11
3 and 9 and 12
Appendix 4. LILACS search strategy
low or handicap$ or subnormal or impair$ or partial$ or disab$ or disorder$ and (vision or visual$ or sight$) and reading and closed circuit or closed-circuit or cctv$ or video$ or computer$ or scanner$ or aid$
Appendix 5. OpenGrey search strategy
low or handicap$ or subnormal or impair$ or partial$ or disab$ or disorder$ and (vision or visual$ or sight$) and reading and closed circuit or closed-circuit or cctv$ or video$ or computer$ or scanner$ or aid$
Appendix 6. metaRegister of Controlled Trials search strategy
reading aids AND low vision
Appendix 7. ClinicalTrials.gov search strategy
Reading Aids AND Low Vision
Appendix 8. ICTRP search strategy
Low Vision = Condition AND Reading Aids = Intervention
Appendix 9. Additional data extraction and statistical issues
Sample size and multiplicity issues
If more than two LVAs were simultaneously compared in a publication (Culham 2004; Eperjesi 2004; Goodrich 2001; Smith 2005) 95% confidence intervals (CI) of the estimates of effectiveness were adjusted using a conservative Bonferroni approach. As an example, performing three pairwise comparisons among three LVAs, such as in Goodrich 2001, requires that 95% CIs are calculated dividing the conventional probability of type I error of 0.05 by 3. The adjusted probability is therefore 0.0167. Furthermore, sample size was small in most studies, suggesting the use of a t-distribution to compute confidence intervals. To exploit the intuitive graphical presentation allowed by Review Manager 5 (RevMan), which uses the Gaussian distribution and therefore large sample statistics (> 30 people) while maintaining their correct coverage, we inflated the SE(MD) by an appropriate factor. Using Goodrich 2001 as an example, this factor was estimated as follows:
(1) the t-value with the appropriate degrees of freedom (22 participants, df = 21) corresponding to a two-tailed probability of 0.0167 is 2.60;
(2) the SE(MD) is obtained from the paper;
(3) since the z-value of 1.96 is used as a multiplier of the SE(MD) in RevMan to obtain the 95% CI, the factor used to inflate the SE(MD) is computed from the ratio 2.60/1.96 = 1.33;
(5) finally, the inflated SE is introduced in the ‘Comparisons and data’ RevMan tool in order to present forest plots that accommodate both the multiple comparisons (if any) and the small-sample statistical issues.
Correlation in cross-over studies
In Culham 2004 the mean and the standard deviation (SD) for each of the four head-mounted electronic devices compared to the participant's optical device were available. The SE(MD), which is necessary to extract data from cross-over studies, were not presented. According to Higgins 2011c the SE(MD) can still be estimated provided that the correlation coefficient among measurements is known from similar studies. The correlation coefficient for reading speed between the stand-mounted CCTV and the electronic head-mounted device (HMD) was 0.92 in Ortiz 1999, while it was 0.66 in Kleweno 2001, who used the Virtual Retinal Display as an HMD, as derived from published individual data. We used an intermediate value of 0.82 as an estimate of the correlation coefficient in Culham 2004, Goodrich 2001 and Peterson 2003. This is a conservative assumption since the type of HMD in Culham 2004 is more similar to Ortiz 1999 and considering that a lower correlation coefficient within-subjects leads to larger standard errors in cross-over studies. This can be calculated from the formulas suggested by Deeks 2005a which we used to compute the SE(MD).
Problems with data skewness
As suggested by Deeks 2005a, we chose not to extract data from Stelmack 1991 since there was evidence of marked skewness, the standard deviations being larger than the mean in at least one group, taking in to consideration that reading speed cannot take negative values. Skewness was also suggested by the asymmetry of the mean within the reported range of values.
In the first version of this review, individual reading speed data from Eperjesi 2004 were log-transformed to approach normality before undertaking calculations. In the 2011 update, we decided to use raw data (words per minute) since skewness was mild and results are more interpretable on this scale.
Analyses of individual data
In three publications (Eperjesi 2004; Kleweno 2001; Ortiz 1999), individual data were available in tables in the published reports. They were processed with repeated-measures techniques to obtain MD and SE(MD) using the software Stata 9.2 (StataCorp, College Station, Texas, USA). A paired t-test was used when two LVAs were compared and generalised estimating equations were used when more than two groups were compared. These techniques allowed estimates of SEs(MD) to be obtained that are adjusted for the correlation among measurements in the same participant. We used the Huber-White variance estimator for this purpose.
Footnotes
Indicates the major publication for the study
Contributions of authors: Conceiving the review: Elizabeth Hawes
Designing the review: Elizabeth Hawes, RA, GV
Co-ordinating the review: GV, RA
Undertaking manual searches: GV, RA
Screening search results: GV, RA, SB, LG
Organising retrieval of papers: GV, GG, RA, Cochran,e Eyes and Vision Group
Screening retrieved papers against inclusion criteria: GV, RA, SB, LG
Appraising quality of papers: GV, GG, RA
Extracting data from papers: GV, RA
Writing to authors of papers for additional information: GV, RA
Providing additional data about papers: GV, RA
Obtaining and screening data on unpublished studies: GV, GG, RA
Data management for the review: GV, GG, RA
Entering data into Review Manager 5: GV, RA
Analysis of data: GV, RA
Interpretation of data: GV, RA, SB, LG, GG
Writing the review: GV, RA, SB, LG, GG,
Declarations Of Interest: Gianni Virgili shares the patent on the MNREAD Italian charts with the University of Minnesota, Minneapolis, USA.
- We decided to remove the RCT filter from the electronic searches in order to identify as many potentially relevant studies as possible. We also specified that reading speed had to be measured at ordinary print size because this is the outcome most relevant to patients in terms of performance using a specific low-vision aid. We also specified that MNREAD definitions of maximum reading speed and reading acuity were adopted in our review and the consequences of this choice are discussed in the revised version.
- We used raw reading acuity (words per minute) rather than its log transformation, as done in the original version using individual values, because results are more interpretable on this scale, despite mild skewness.
- We also adapted the ‘Risk of bias’ assessment following new guidance. We reconsidered the scoring of ‘within-subject’ or crossover-like studies, leading to adapted criteria to score the quality of randomisation and allocation concealment.
References to studies included in this review
- *.Culham LE, Chabra A, Rubin GS. Clinical performance of electronic, head-mounted, low-vision devices. Ophthalmic and Physiological Optics. 2004;24(4):281–90. doi: 10.1111/j.1475-1313.2004.00193.x. [DOI] [PubMed] [Google Scholar]
- *.Eperjesi F, Fowler CW, Evans BJ. The effects of coloured light filter overlays on reading rates in age-related macular degeneration. Acta Ophthalmologica Scandinavica. 2004;82(6):695–700. doi: 10.1111/j.1600-0420.2004.00371.x. [DOI] [PubMed] [Google Scholar]
- *.Goodrich GL, Kirby J. A comparison of patient reading performance and preference: optical devices, handheld CCTV (Innoventions Magni-Cam), or stand-mounted CCTV (Optelec Clearview or TSI Genie) Optometry. 2001;72(8):519–28. [PubMed] [Google Scholar]
- *.Kleweno CP, Seibel EJ, Viirre ES, Kelly JP, Furness TA., 3rd The virtual retinal display as a low-vision computer interface: A pilot study. Journal of Rehabilitation Research and Development. 2001;38(4):431–42. [PubMed] [Google Scholar]
- *.Ortiz A, Chung ST, Legge GE, Jobling JT. Reading with a head-mounted video magnifier. Optometry and Vision Science. 1999;76(11):755–63. doi: 10.1097/00006324-199911000-00024. [DOI] [PubMed] [Google Scholar]
- *.Peterson RC, Wolffsohn JS, Rubinstein M, Lowe J. Benefits of electronic vision enhancement systems (EVES) for the visually impaired. American Journal of Ophthalmology. 2003;136(6):1129–35. doi: 10.1016/s0002-9394(03)00567-1. [DOI] [PubMed] [Google Scholar]
- Smith HJ, Dickinson CM, Cacho I, Reeves BC, Harper RA. A randomized controlled trial to determine the effectiveness of prism spectacles for patients with age-related macular degeneration. Archives of Ophthalmology. 2005;123(8):1042–50. doi: 10.1001/archopht.123.8.1042. [DOI] [PubMed] [Google Scholar]
- *.Spitzberg LA, Goodrich GL. New ergonomic stand magnifiers. Journal of the American Optometric Association. 1995;66(1):25–30. [PubMed] [Google Scholar]
- *.Stelmack J, Reda D, Ahlers S, Bainbridge L, McCray J. Reading performance of geriatric patients post exudative maculopathy. Journal of the American Optometric Association. 1991;62(1):53–7. [PubMed] [Google Scholar]
- Watson GR, Maino JM, de l'Aune W. Comparison of low-vision reading with spectacle mounted magnifiers. Journal of Rehabilitation Research and Development. 2005;42(4):459–70. doi: 10.1682/jrrd.2004.11.0137. [DOI] [PubMed] [Google Scholar]
References to studies excluded from this review
- *.Blaskey P, Scheiman M, Parisi M, Ciner EB, Gallaway M, Selznick R. The effectiveness of Irlen filters for improving reading performance: a pilot study. Journal of Learning Disability. 1990;23(10):604–12. doi: 10.1177/002221949002301007. [DOI] [PubMed] [Google Scholar]
- *.Bonatti FA, Bonatti JA, Sampaio MW, Haddad MA, Souza PR, José NK. Evaluation of patients using an innovative low-vision aid [Avaliacao de pacientes utilizando equipamento inovador de auxilio a visao subnormal] Arquivos Brasileiros de Oftalmologia. 2008;71(3):385–8. doi: 10.1590/s0004-27492008000300015. [DOI] [PubMed] [Google Scholar]
- *.Cheong AM, Lovie-Kitchin JE, Bowers AR, Brown B. Short-term in-office practice improves reading performance with stand magnifiers for people with AMD. Optometry and Vision Science. 2005;82(2):114–27. doi: 10.1097/01.opx.0000153244.93582.ff. [DOI] [PubMed] [Google Scholar]
- Cheong AM, Bowers AR, Lovie-Kitchin J. Does a line guide improve reading performance with stand magnifiers? Optometry and Vision Science. 2009;86(9):1078–85. doi: 10.1097/OPX.0b013e3181b4c4d9. [DOI] [PubMed] [Google Scholar]
- *.Cohen JM, Waiss B. Reading speed through different equivalent power low vision devices with identical field of view. Optometry and Vision Science. 1991;68(10):795–7. doi: 10.1097/00006324-199110000-00007. [DOI] [PubMed] [Google Scholar]
- Culham LE, Chabra A, Rubin GS. Users' subjective evaluation of electronic vision enhancement systems. Ophthalmic and Physiological Optics. 2009;29(2):138–49. doi: 10.1111/j.1475-1313.2008.00630.x. [DOI] [PubMed] [Google Scholar]
- *.Goodrich GL, Mehr EB, Quillman RD, Shaw HK, Wiley JK. Training and practice effects in performance with low-vision aids: a preliminary study. American Journal of Optometry and Physiological Optics. 1977;54(5):312–8. doi: 10.1097/00006324-197705000-00007. [DOI] [PubMed] [Google Scholar]
- *.Goodrich GL, Kirby J, Wagstaff P, Oros T, McDevitt B. A comparative study of reading performance with a head-mounted laser display and conventional low vision devices. Journal of Visual Impairment and Blindness. 2004;98(3):148–59. [Google Scholar]
- *.Jacobs RJ. Screen color and reading performance on closed-circuit television. Journal of Visual Impairment and Blindness. 1990;84(10):569–72. [Google Scholar]
- Kuyk T, James J. A pilot study of a telescopic low vision aid with a motorized focus. Journal of Vision Rehabilitation. 1990;4:21–9. [Google Scholar]
- *.Lawton TB. Improved reading performance using individualized compensation filters for observers with losses in central vision. Ophthalmology. 1989;96(1):115–26. doi: 10.1016/s0161-6420(89)32935-6. [DOI] [PubMed] [Google Scholar]
- Stelmack JA, Tang XC, Reda DJ, Rinne S, Mancil RM, Massof RW, et al. Outcomes of the Veterans Affairs Low Vision Intervention Trial (LOVIT) Archives of Ophthalmology. 2008;126(5):608–17. doi: 10.1001/archopht.126.5.608. [DOI] [PubMed] [Google Scholar]
- *.Margrain TH. Helping blind and partially sighted people to read: the effectiveness of low vision aids. British Journal of Ophthalmology. 2000;84(8):919–21. doi: 10.1136/bjo.84.8.919. [DOI] [PMC free article] [PubMed] [Google Scholar]
- Parodi MB, Toto L, Mastropasqua L, Depollo M, Ravalico G. Prismatic correction in patients affected by age-related macular degeneration. Clinical Rehabilitation. 2004;18:828–32. doi: 10.1191/0269215504cr801oa. [DOI] [PubMed] [Google Scholar]
- Rees G, Ferraro JG, Lamoureux E, Keeffe JE. Evaluation of low cost low vision devices. Investigative Ophthalmology and Visual Science. 2006;47 ARVO Abstract 4403. [Google Scholar]
- *.Reeves BC, Harper RA, Russell WB. Enhanced low vision rehabilitation for people with age related macular degeneration: a randomised controlled trial. British Journal of Ophthalmology. 2004;88(11):1443–9. doi: 10.1136/bjo.2003.037457. [DOI] [PMC free article] [PubMed] [Google Scholar]
- *.Rohrschneider K, Riede B, Blankenagel A. Image flicker frequency of television reading aids. Effect on reading comfort for visually handicapped patients [Bildwiederholfrequenz von Bildschirmlesegeraten. Einfluss auf die Lesefahigkeit von Sehbehinderten] Ophthalmologe. 1998;95(2):110–3. doi: 10.1007/s003470050246. [DOI] [PubMed] [Google Scholar]
- Rosenberg R, Faye E, Fischer M, Budick D. Role of prism relocation in improving visual performance of patients with macular dysfunction. Optometry and Vision Science. 1989;66:747–50. doi: 10.1097/00006324-198911000-00004. [DOI] [PubMed] [Google Scholar]
- Rossi PW, Kheyfets EJ, Reding MJ. Fresnel prisms improve visual perception in stroke patients with homonymous hemianopia or unilateral visual neglect. Neurology. 1990;40(10):1597–9. doi: 10.1212/wnl.40.10.1597. [DOI] [PubMed] [Google Scholar]
- *.Scott IU, Feuer WJ, Jacko JA. Impact of graphical user interface screen features on computer task accuracy and speed in a cohort of patients with age-related macular degeneration. American Journal of Ophthalmology. 2002;134(6):857–62. doi: 10.1016/s0002-9394(02)01795-6. [DOI] [PubMed] [Google Scholar]
- Wolffsohn JS, Dinardo C, Vingrys AJ. Benefit of coloured lenses for age-related macular degeneration. Ophthalmic and Physiological Optics. 2002;22(4):300–11. doi: 10.1046/j.1475-1313.2002.00036.x. [DOI] [PubMed] [Google Scholar]
References to studies awaiting assessment
- Demers-Turco P, Sonsino J, Arai M, Hirose T. Comparison of three low vision reading devices. Investigative Ophthalmology and Visual Science. 2001;42 ARVO Abstract 4598. [Google Scholar]
- Goodrich GL, Kirby J, Keswick C, Donald B, Oros T, Wagstaff P, et al. Low vision reading: effect of field loss, training and device. American Academy of Optometry. 1998;25 [Google Scholar]
- Goodrich GL, Kirby J. A comparison of low vision reading performance by type of reading aid and patient field characteristic. Optometry and Vision Science. 2000;77(12):126. [Google Scholar]
- Goodrich GL, Kirby J. A comparison of low vision reading performance with hand-held and stand-mounted CCTV. Optometry and Vision Science. 2000;77(12):125. [Google Scholar]
- Goodrich G. Nomad: a preliminary study of possible rehabilitation applications. Optometry and Vision Science. 2001;78(12):291. [Google Scholar]
- Kaida M, Maeda J, Inoue K, Murasawa M, Yamaguchi M, Nakamura H, et al. A hand-held retinal projection system as a low-vision aid. Japanese Journal of Clinical Ophthalmology. 2005;59(4):437–40. [Google Scholar]
- Sonsino J, Demers-Turco P, Arai M, Fujita K, McCabe P, Hirose T. Reading performance of a new portable head-mounted closed circuit television for low vision patients: Powervision. Optometry and Vision Science. 2000;77(12):239. [Google Scholar]
Additional references
- Ahn JS, Legge GE, Luebker A. Printed cards for measuring low-vision reading speed. Vision Research. 1995;35(13):1939–44. doi: 10.1016/0042-6989(94)00294-v. [DOI] [PubMed] [Google Scholar]
- Ahn SJ, Legge GE. Psychophysics of reading. XIII. Clinical predictors of magnifier-aided reading speed in low vision. Vision Research. 1995;35(13):1931–8. doi: 10.1016/0042-6989(94)00293-u. [DOI] [PubMed] [Google Scholar]
- Alderson P, Green S. Additional Module 2. [accessed 15 June 2006];The Cochrane Collaboration open learning material for reviewers. 2002 http://www.cochrane-net.org/openlearning/PDF/Openlearning-full.pdf.
- Binns AM, Bunce C, Dickinson C, Harper R, Tudor-Edwards R, Woodhouse M, et al. How effective is low vision service provision? A systematic review. Survey of Ophthalmology. 2012;57(1):34–65. doi: 10.1016/j.survophthal.2011.06.006. [DOI] [PubMed] [Google Scholar]
- Cheng D, Woo GC. The effect of conventional CR39 and Fresnel prisms on high and low contrast acuity. Ophthalmic and Physiological Optics. 2001;21(4):312–6. doi: 10.1046/j.1475-1313.2001.00570.x. [DOI] [PubMed] [Google Scholar]
- Congdon NG, Friedman DS, Lietman T. Important causes of visual impairment in the world today. JAMA. 2003;290(15):2057–60. doi: 10.1001/jama.290.15.2057. [DOI] [PubMed] [Google Scholar]
- Congdon N, O'Colmain B, Klaver CC, Klein R, Muñoz B, Friedman DS, et al. Causes and prevalence of visual impairment among adults in the United States. Archives of Ophthalmology. 2004;122(4):477–85. doi: 10.1001/archopht.122.4.477. [DOI] [PubMed] [Google Scholar]
- Deeks JJ, Higgins JPT, Altman DG, editors. The Cochrane Library. 3. Chichester, UK: John Wiley & Sons, Ltd; 2005. Analysing and presenting data. Cochrane Handbook for Systematic Reviews of Interventions 4.2.5. updated May 2005; Section 8. [Google Scholar]
- Deeks JJ, Higgins JPT, Altman DG, Green S, editors. Cochrane Handbook for Systematic Reviews of Interventions Version 5.1.0. The Cochrane Collaboration; 2011. Chapter 9: Analysing data and undertaking meta-analyses. updated March 2011. Available from www.cochrane-handbook.org. [Google Scholar]
- Dickinson C. Low vision: Principles and practice. 1st. Oxford: Butterworth-Heinemann; 1998. [Google Scholar]
- Elbourne DR, Altman DG, Higgins JPT, Curtin F, Worthington HV, Veil A. Meta-analyses involving crossover trials: methodological issues. Journal of Clinical Epidemiology. 2002;31(1):140–9. doi: 10.1093/ije/31.1.140. [DOI] [PubMed] [Google Scholar]
- Higgins JPT, Deeks JJ, Green S, editors. Cochrane Handbook for Systematic Reviews of Interventions Version 5.1.0. The Cochrane Collaboration; 2011. Chapter 7: Selecting studies and collecting data. updated March 2011. Available from www.cochrane-handbook.org. [Google Scholar]
- Higgins JPT, Altman DG, Green S, editors. Cochrane Handbook for Systematic Reviews of Interventions Version 5.1.0. The Cochrane Collaboration; 2011. Chapter 8: Assessing risk of bias in included studies. updated March 2011. Available from www.cochrane-handbook.org. [Google Scholar]
- Higgins JPT, Deeks JJ, Altman DG, Green S, editors. Cochrane Handbook for Systematic Reviews of Interventions Version 5.1.0. The Cochrane Collaboration; 2011. Chapter 16: Special topics in statistics. updated March 2011. Available from www.cochrane-handbook.org. [Google Scholar]
- Hirji KF, Fagerland MW. Outcome based subgroup analysis: a neglected concern. Trials. 2009;10:33. doi: 10.1186/1745-6215-10-33. [DOI] [PMC free article] [PubMed] [Google Scholar]
- Hooper P, Jutai JW, Strong G, Russel-Minda E. Age-related macular degeneration and low-vision rehabilitation: a systematic review. Canadian Journal of Ophthalmology. 2008;43(2):180–7. doi: 10.3129/i08-001. [DOI] [PubMed] [Google Scholar]
- Humphry RC, Thompson GM. Low vision aids -evaluation in a general eye department. Transactions of the Ophthalmological Societies of the United Kingdom. 1986;105(Pt 3):296–303. [PubMed] [Google Scholar]
- Langelaan M, van Nispen RMA. Multidisciplinary rehabilitation and monodisciplinary rehabilitation for visually impaired adults. Cochrane Database of Systematic Reviews. 2007;(2) doi: 10.1002/14651858.CD006543. [DOI] [PMC free article] [PubMed] [Google Scholar]
- Lavinsky J, Tomasetto G, Soares E. Use of a contact lens telescopic system in low vision patients. International Journal of Rehabilitation Research. 2001;24(4):337–40. doi: 10.1097/00004356-200112000-00012. [DOI] [PubMed] [Google Scholar]
- Leat SJ, Fryer A, Rumney NJ. Outcome of low vision aid provision: the effectiveness of a low vision clinic. Optometry and Visual Science. 1994;71(3):199–206. doi: 10.1097/00006324-199403000-00009. [DOI] [PubMed] [Google Scholar]
- Legge GE, Pelli DG, Rubin GS, Schleske MM. Psychophysics of reading. I. Normal vision. Vision Research. 1985;25(2):239–52. doi: 10.1016/0042-6989(85)90117-8. [DOI] [PubMed] [Google Scholar]
- Legge GE, Rubin GS, Pelli DG, Schleske MM. Psychophysics of reading. II. Low vision. Vision Research. 1985;25(2):253–65. doi: 10.1016/0042-6989(85)90118-x. [DOI] [PubMed] [Google Scholar]
- Legge GE, Ross JA, Maxwell KT, Luebker A. Psychophysics of reading. VII. Comprehension in normal and low vision. Clinical Vision Sciences. 1989;4:51–60. [Google Scholar]
- Legge G. Glenn A. Fry Award Lecture 1990: three perspectives on low vision reading. Optometry and Vision Science. 1991;68(10):763–9. doi: 10.1097/00006324-199110000-00001. [DOI] [PubMed] [Google Scholar]
- Legge GE. Psychophysics of Reading in Normal and Low Vision. London: Mahwah, NJ: Lawrence Erlbaum Associates; 2007. [Google Scholar]
- Margrain TH. Minimising the impact of visual impairment. Low vision aids are a simple way of alleviating impairment. BMJ. 1999;318(7197):1504. doi: 10.1136/bmj.318.7197.1504. [DOI] [PMC free article] [PubMed] [Google Scholar]
- Markowitz SN, Reyes SV, Sheng L. The use of prisms for vision rehabilitation after macular function loss: an evidence-based review. Acta Ophthalmologica. 2013;91:207–11. doi: 10.1111/j.1755-3768.2011.02336.x. [DOI] [PubMed] [Google Scholar]
- Massof RW. A systems model for low vision rehabilitation. II. Measurement of vision disabilities. Optometry and Visual Science. 1998;75(5):349–73. doi: 10.1097/00006324-199805000-00025. [DOI] [PubMed] [Google Scholar]
- Nilsson UL. Visual rehabilitation with and without educational training in the use of optical aids and residual vision. A prospective study of patients with advanced age-related macular degeneration. Clinical Vision Sciences. 1990;6(1):3–10. [Google Scholar]
- Pascolini D, Mariotti SP. Global estimates of visual impairment: 2010. British Journal of Ophthalmology. 2012;96(5):614–8. doi: 10.1136/bjophthalmol-2011-300539. [DOI] [PubMed] [Google Scholar]
- Rubin GS. Measuring reading performance. Vision Research. 2013;90:43–51. doi: 10.1016/j.visres.2013.02.015. [DOI] [PubMed] [Google Scholar]
- Schünemann HJ, Oxman AD, Higgins JPT, Vist GE, Glasziou P, Guyatt GH. Chapter 11: Presenting results and ‘Summary of findings’ tables. In: Higgins JPT, Green S, editors. Cochrane Handbook for Systematic Reviews of Interventions Version 5.1.0. The Cochrane Collaboration; 2011. updated March 2011. Available from www.cochrane-handbook.org. 2011. [Google Scholar]
- Scott I, Smiddy W, Schiffman J, Feuer W, Pappas C. Quality of life of low vision patients and the impact of low vision services. American Journal of Ophthalmology. 1999;128(1):54–61. doi: 10.1016/s0002-9394(99)00108-7. [DOI] [PubMed] [Google Scholar]
- Shuttleworth GN, Dunlop A, Collins JK, James CR. How effective is an integrated approach to low vision rehabilitation? Two year follow up results from south Devon. British Journal of Ophthalmology. 1995;79(8):719–23. doi: 10.1136/bjo.79.8.719. [DOI] [PMC free article] [PubMed] [Google Scholar]
- Sloan LL, Ryan SJ., Jr Reading aids for the partially sighted A nontechnical explanation of basic optical principles. International Ophthalmology Clinics. 1971;11(1):19–55. [PubMed] [Google Scholar]
- Sterne JAC, Egger M, Moher D, Green S, editors. Cochrane Handbook for Systematic Reviews of Interventions Version 5.1.0. The Cochrane Collaboration; 2011. Chapter 10: Addressing reporting biases. updated March 2011. Available from www.cochrane-handbook.org. [Google Scholar]
- Tielsch JM, Sommer A, Witt K, Katz J, Royall RM. Blindness and visual impairment in an American urban population. The Baltimore Eye Survey. Archives of Ophthalmology. 1990;108(2):286–90. doi: 10.1001/archopht.1990.01070040138048. [DOI] [PubMed] [Google Scholar]
- Veteran Affairs Technology Assessment Program. Optical devices for adults with low vision A systematic review of published studies of effectiveness. 2003 www.va.gov/VATAP/docs/OpticalDevicesAdultsLowVision2003tm.pdf.
- Virtanen P, Laatikainen L. Primary success with low vision aids in age-related macular degeneration. Acta Ophthalmologica Copenhagen. 1991;69(4):484–90. doi: 10.1111/j.1755-3768.1991.tb02026.x. [DOI] [PubMed] [Google Scholar]
- World Health Organization. [accessed 15 Jan 2012];International Classification of Diseases (ICD) http://www.who.int/classifications/icd/en/index.html.
References to other published versions of this review
- Virgili G, Acosta R. Reading aids for adults with low vision. Cochrane Database of Systematic Reviews. 2006;(4) doi: 10.1002/14651858.CD003303.pub2. [DOI] [PMC free article] [PubMed] [Google Scholar]