Abstract
Axial Cu–S(Met) bonds in electron transfer (ET) active sites are generally found to lower their reduction potentials. An axial S(Met) bond is also present in cytochrome c (cyt c) and is generally thought to increase the reduction potential. The highly covalent nature of the porphyrin environment in heme proteins precludes using many spectroscopic approaches to directly study the Fe site to experimentally quantify this bond. Alternatively, L-edge X-ray absorption spectroscopy (XAS) enables one to directly focus on the 3d-orbitals in a highly covalent environment and has previously been successfully applied to porphyrin model complexes. However, this technique cannot be extended to metalloproteins in solution. Here, we use metal K-edge XAS to obtain L-edge like data through 1s2p resonance inelastic X-ray scattering (RIXS). It has been applied here to a bis-imidazole porphyrin model complex and cyt c. The RIXS data on the model complex are directly correlated to L-edge XAS data to develop the complementary nature of these two spectroscopic methods. Comparison between the bis-imidazole model complex and cyt c in ferrous and ferric oxidation states show quantitative differences that reflect differences in axial ligand covalency. The data reveal an increased covalency for the S(Met) relative to N(His) axial ligand and a higher degree of covalency for the ferric states relative to the ferrous states. These results are reproduced by DFT calculations, which are used to evaluate the thermodynamics of the Fe–S(Met) bond and its dependence on redox state. These results provide insight into a number of previous chemical and physical results on cyt c.
Introduction
A common structural motif across electron transfer (ET) metalloprotein active sites is the presence of an axial metal-thioether bond, where this ligand is provided by an endogenous methionine residue.1 These are found in the mononuclear type one copper (T1 Cu), binuclear CuA, and cytochrome (cyt c and cyt b) containing ET metalloproteins. In T1 Cu and CuA active sites, the function of the Cu–S(Met) bond is now well understood:2−4 the presence of the axial S(Met) ligand lowers E0 due to the stronger stabilization energy (i.e., larger axial ligand bond strength) in the oxidized than in the reduced state,5 while not greatly affecting the reorganization energy.2−4
Interestingly, in contrast to T1 Cu and CuA, the Fe–S(Met) bond in cyt c is generally thought to be stronger in the reduced (ferrous) rather than the oxidized (ferric) state. This consideration for cyt c is based on the decrease in E0 when the Fe–S(Met) bond is lost,6,7 ligand competition8,9 and binding,10−12 protein folding studies,10,13−15 and the shorter Fe(II)-S(Met) bond (2.29 Å) relative to Fe(III)-S(Met) (2.33 Å) from extended X-ray absorption fine structure (EXAFS).16,17 Loss or rupture of the Fe–S(Met) bond in cyt c is also functionally relevant. Besides carrying out ET, cyt c is also involved in programmed cell death or apoptosis.18 During this process, cyt c switches function from an ET protein to a peroxidase enzyme. This functional switch is correlated to the loss of the axial Fe–S(Met) bond and the formation of an open coordination sphere for the activation of H2O2 in the peroxidation of cardiolipin.19−21 In addition, the Fe(II)-S(Met) bond can be photodissociated, while the Fe(III)-S(Met) bond cannot.22−25 Clearly, the difference in metal–ligand bonding, and thus bond strengths for the Fe(II) and Fe(III) states, is directly related to both functions of cyt c: ET and lipid peroxidation.
In order to understand these differences in bonding, it is necessary to employ a spectroscopic method that directly probes the electronic structure of the Fe site; however, the highly covalent porphyrin obscures the optical spectral features associated with the Fe–S(Met) bond. S K-edge X-ray absorption spectroscopy (XAS) has proven to be a powerful spectroscopic tool to quantitate the covalency of thiolate-metal bonds in proteins and models through the intensity of the pre-edge feature (i.e., the 1s → 3d transition(s)).26 However, the higher Zeff of the thioether sulfur relative to a thiolate increases the energy of the pre-edge transition such that it is located within the envelope of the edge transitions (i.e., the 1s → valence np).
The direct way to investigate the electronic structure of a heme protein, where the Fe is in the highly covalent porphyrin environment, would be to probe the unoccupied valence orbitals of the central Fe ion by Fe L-edge XAS. This is a powerful method to extract the differential orbital covalency (DOC, differences in the covalency of the different symmetry sets of d orbitals)27−30 that is particularly important for heme complexes and enzyme intermediates. However, the Fe L-edge excitation energy lies in the soft X-ray energy region (≈710 eV), which requires ultrahigh vacuum conditions and generally involves the detection of electrons within 10 Å of the surface of the sample due to the low electron escape depth. The escape depth can be enlarged to a few micrometers by detecting the fluorescence decay. However, this can suffer from significant self-absorption effects, mainly for the L3-edge. These restrictions make it challenging to apply high-resolution metal L-edge XAS to metalloproteins and enzymes.
Metal K-edge XAS does not have these restrictions due to the high excitation energy in the hard X-ray region (the Fe K-pre-edge is at ≈7110 eV). However, due to the short lifetime of the 1s core-hole, the broadening of the 1s → 3d transitions is significantly larger than for the 2p → 3d transitions. Since the 1s → 3d transitions are quadrupole allowed, they often gain intensity from small amounts of 4p mixing into the d orbitals in noncentrosymmetric ligand environments, while 2p → 3d transitions are electric dipole allowed and their intensities are a direct probe of the metal d-character in valence orbitals involved in bonding. Thus, by going from soft to hard X-rays, one wins on experimental conditions, but loses resolution and insight into bonding.
The desired combination of accessible experimental conditions, higher resolution, and d-orbital covalency can be realized by applying Kα resonant inelastic X-ray scattering (1s2p RIXS).31−36Here, a 1s electron is excited into an unoccupied 3d orbital (1s → 3d) via a quadrupole transition to a 1s12p63dn+1 intermediate state and the subsequent electric dipole allowed decay of a 2p electron into the 1s hole (2p → 1s) to the 1s22p53dn+1 final state, is detected by its photon emission. Thus, L-edge absorption and 1s2p RIXS reach the same final state configurations34,37 and allow a direct comparison, but with complementary selection rules.38 Varying the incident X-ray energies and collecting the respective emission spectra, allows one to generate the RIXS plane. “L-edge-like” spectra are obtained as vertical cuts through the RIXS plane (i.e., at fixed K-edge excitation energies), providing the energies of the same final state configurations that could be reached through direct L-edge XAS, but via an intermediate state.
It has been recently shown that the valence bond configuration interaction (VBCI) model with the same parameters reproduces both L-edge XAS and RIXS results, but with selection rules38 involving the intermediate states in RIXS, as described by the Kramers–Heisenberg scattering equation.31,32
 |
1 |
where Ω and ω are the incident and emission energy, respectively, with Ω – ω being the energy transfer, that gives “L-edge-like” spectra.
To investigate the electronic structure of Fe in a covalent porphyrin environment, and in particular the Fe–S(Met) bonding properties of ferrous and ferric cyt c, 1s2p RIXS was applied to this protein, which cannot be reasonably studied by L-edge XAS. Parallel RIXS data were collected on tetraphenyl porphyrin (TPP) complexes with bisimidazole axial ligands (FeTPP(ImH)2. These complexes have already been studied by L-edge XAS.29 The two main differences in the structures of cyt c and FeTPP(ImH)2, include replacement of one axial imidazole ligand with a thioether (Met-80), and the porphyrin ring is cross-linked to two cysteine derived thioether bonds (cys-14 and cys-17) (see Figure 1). Here, RIXS data on FeTPP(ImH)2 are correlated to the L-edge XAS data and to 1s2p RIXS data on ferrous and ferric cyt c, and analyzed using the VBCI multiplet model. These results are then used to correlate to DFT calculations on large models to distinguish specific contributions to bonding. Truncated models, which reasonably represent the large models (see Figure S1 in Supporting Information), are then used to explore the thermodynamic differences between the Fe–S(Met) and Fe–N(His) bond in the ferrous and ferric states. The results of these studies are then related to past experimental results on thioether-Fe bonding.
Figure 1.
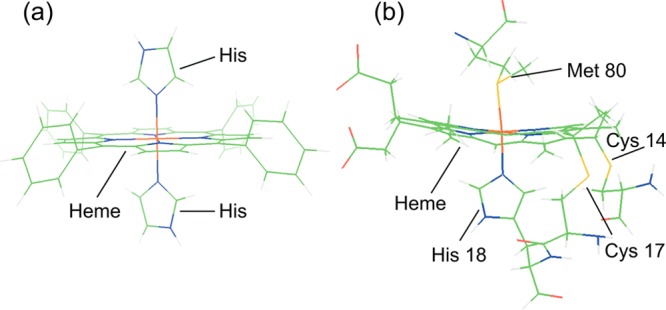
Molecular structures of (a) FeTPP(ImH)2, and (b) its active side counterpart in cyt c.
Experimental and Computational Methods
Sample Preparation
Ferrous and ferric FeTPP(ImH)2 and cyt c were prepared in-house following standard procedures. Details about the sample preparation are given in the Supporting Information.
Experimental Methods
Three experimental methods have been employed: soft X-ray L-edge XAS, as well as hard X-ray K-edge XAS and 1s2p RIXS. These experiments have been performed at the Stanford Synchrotron Radiation Lightsource (SSRL) at beamlines 10–1(L-edge XAS), 7–3 (K-edge) and 6–2 (1s2pRIXS),39 as well as the Advanced Photon Source beamline 9-ID.40,41 Experimental details on all methods are given in the Supporting Information. All data sets (L-edge, K-edge, 1s2p RIXS) have been measured at minimum twice to ensure reproducible and reliable data.
The pre-edge in a 1s2p RIXS experiment includes the tail of the intense 1s → 4p excitations at around 15 eV higher energy. This leads to an increase of the pre-edge background and further complicates a direct comparison of L-edge data with constant incident energy (CIE, i.e., vertical) cuts through the RIXS plane. In order to estimate the RIXS intensity from the tail of the rising-edge, the data were carefully fit to extract the true pre-edge region as described in the Supporting Information and in the literature.37
Computational Methods
To simulate all X-ray spectra, charge transfer multiplet calculations, that properly take the core-hole into account, were performed.42−45 Covalent mixing of ligand character is modeled using a valence bond configuration interaction (VBCI) approach, using a three configuration model including a ligand-to-metal charge transfer (LMCT) configuration dn+1L and a metal-to-ligand charge transfer (MLCT) configuration dn–1L– mixed into the dn configuration in the ground state. (L = ligand with an e– hole, L– = ligand with an additional electron) The corresponding charge transfer energies are Δ (LMCT) and Δ* (MLCT). All calculations have been performed in D4h effective symmetry for all four complexes. In the ferrous case, the x2 – y2/z2 energy splitting and covalencies are properly reflected in this approximation. In the ferrous case, the x2 – y2/z2 energy splitting is reflected properly in D4h symmetry. In the ferric case, there is one 3d? hole, and thus the quantification only reflects the covalency of this hole. The covalency value for each of the symmetry blocks was generated via the projection method27 leading to the differential orbital covalency (DOC).
Ground state DFT calculations and geometry optimizations were performed using Gaussian 0946 for a range of functionals and basis sets. Unoccupied metal d-character has been determined by subtracting the sum of their contribution to all occupied orbitals from 100%. The ligand donor character has been obtained from the occupied fragment orbital character summed over the unoccupied orbitals. Further details are given in the Supporting Information.
Results and Analysis
Ferrous Spectroscopy
Ferrous TPP-bisIm
Figure 2 presents a collection of data sets comparing the 1s2p RIXS, L-edge and K-edge XAS data. Figure 2(a) shows the full 1s2p RIXS plane, while Figure 2(b) gives the result with the rising edge subtracted as described in the Supporting Information. The features at an incident energy of ≈7112 eV and energy transfers of ≈706.5 and ≈720 eV reflect excitations into the K-pre-edge. The L3- and L2-edge-like features on the energy transfer axis are split by the spin–orbit coupling within the 2p core-hole in the final state. The intense feature starting at ≈7115 eV originates from the tail of the strong dipole allowed 1s–4p transition at ≈7130 eV. Note that possible shakeup features due to σ+π-donation and π-back-bonding could be present at the onset of the main-edge tail that have been neglected in the background subtracted RIXS in Figure 2(b).
Figure 2.
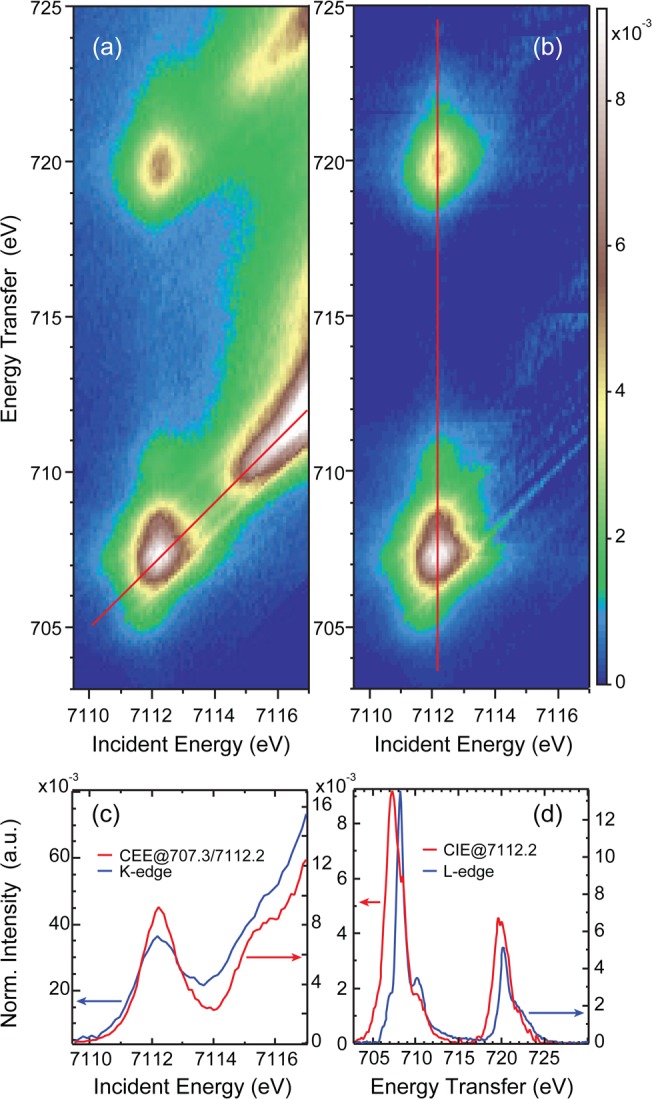
Fe(II)TPP(ImH)2: (a) Full 1s2p RIXS plane, (b) rising-edge subtracted 1s2p RIXS plane, (c) comparison of the CEE cut through the uncorrected plane (red line in (a)) with the direct K-edge, (d) comparison of the CIE cut along the red line in (b) with the direct L-edge experimental data.
Figure 2(c) compares the K-edge XAS of the Fe(II)TPP(ImH)2 model complex with the constant emission energy (CEE) cut through the RIXS plane as indicated by the diagonal red line in Figure 2(a). Both spectra show the same structure that is better resolved in the CEE spectrum (this is often also referred to as HERFD). The peak at 7112.2 eV involves excitation to the 1s13dt2g63deg final state, while the second weak peak at 7115.3 eV likely originates from π back-bonding. The existence of a small π back-bonding contribution (10%) in the ground state has already been observed in L-edge XAS and is present in DFT calculations.29
The x2 – y2 and z2 orbitals are separated in energy due to the difference in axial and equatorial bonding, associated with effective D4h symmetry. Since the xy and xz/yz orbitals are occupied, the K-pre-edge is dominated by excitations into these empty x2 – y2 and z2 orbitals. To estimate the maximum D4h final state splitting, the Fe(II)TPP(ImH)2 result was compared to the 1s2p RIXS of Fe(II)-tacn, which has Oh local symmetry and thus only one possible K-pre-edge peak (see Figure S2 in the Supporting Information).47 This comparison limits the possible eg peak splitting to ≤0.4 eV.
While no spectroscopic difference is observed between the K-edge XAS and CEE RIXS, this is not the case in comparing the L-edge XAS data with a CIE cut at hν = 7112.2 eV through the RIXS plane (red vertical line in Figure 2(b)). Figure 2(d) presents the Fe(II)TPP(ImH)2 L-edge XAS data together with the CIE cut through the main RIXS peak.
The CIE cut shows additional intensity at lower energies for both the L3- and L2-like curves (hν = 707.3 and 719.6 eV) and a reduced relative intensity at the L-edge main peak at hν = 708.2 eV. The high energy L3-edge shoulder in the CIE cut at 710.2 eV is also less pronounced compared to the corresponding L-edge feature. Similar observations hold true for the L2-edge energy region, together with the observation of a smaller L3–/L2– peak intensity ratio in comparing the CIE RIXS cut to the direct L-edge XAS for Fe(II)TPP(ImH)2.
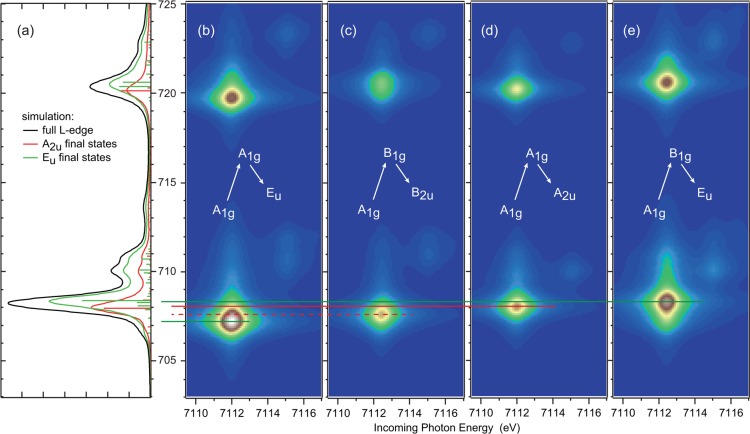
In our earlier 1s2p RIXS experiments on Oh samples, additional intensity in the CIE RIXS cuts relative to L-edge XAS was found to originate from electric dipole forbidden excitations38 that are allowed in 1s2p RIXS (see eq 1 and Figure 3(a)). In the Fe(II)TPP(ImH)2 model complex, the Fe local symmetry is approximately D4h with an A1g ground state. In D4h symmetry, the L-edge electric dipole transition operator has a2u and eu symmetry so that only A2u and Eu final states are allowed (Figure 3(b)). In the 1s2p RIXS experiment, one excites via a 1s → 3d quadrupole transition, having a1g and b1g character, into intermediate states with A1g (Fe dz2) and B1g (Fe dx2–y2) symmetry, respectively. The 2p → 1s decay from these final states again has electric dipole character, thus a2u and eu symmetry, which allows 1s2p RIXS intensity to final states with B2u, A2u and Eu symmetry (Figure 3(b)). Final states with Eu symmetry can be reached both from A1g and B1g intermediate states resulting in different final state energies. Thus, the additional intensity found in the 1s2p RIXS cuts throughout the main intensity peaks originates from both final states that cannot be reached in L-edge XAS and also from the splitting of the x2 – y2/z2 orbitals in the effective D4h symmetry of the porphyrin complex.
Figure 3.
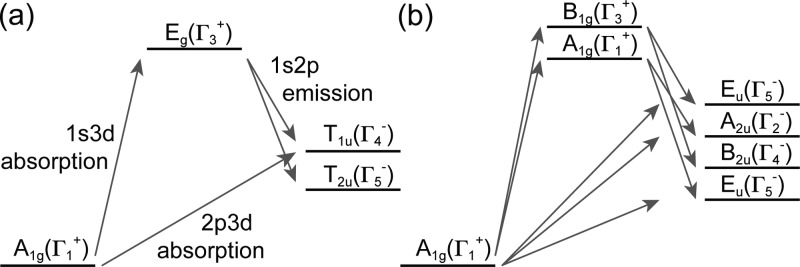
Possible excitation pathways for an L-edge and 1s2p RIXS experiment of a ferrous low-spin system for (a) Oh and (b) D4h symmetry. The pathways through B2g and Eg intermediate states in (b) have been omitted for clarity.
Ferrous cyt c
Figure 4 presents the 1s2p RIXS plane of ferrous cyt c. Figure 4(a) shows the full RIXS plane as measured, while in (b) the rising edge has been subtracted. The pre-edge peak structure contains mainly one broad intensity region at the L3- and L2-like energies, with an intense tail to higher energies. This tail however is weaker in intensity compared to the ferrous model RIXS plane (Figure 2(b)). In (c) we compare the CEE cuts of ferrous cyt c with that of the Fe(II)TPP(ImH)2 complex. Both have very similar pre-edge intensities and peak widths, as well as additional intensity at ≈7115.3 eV, likely due to π back-bonding. However, ferrous cyt c shows a steeper rising edge, which overlays the π* region. Both curves merge at higher energies, reflecting the common spin and valence state (see Figure S4 in the Supporting Information). A direct comparison of the CIE cuts for the Fe(II)TPP(ImH)2 and ferrous cyt c, is presented in (d). Two characteristic changes in spectral features are visible: Fe(II) cyt c has lower intensity in the shoulder at 710 eV, but higher intensity in the L2 relative to the L3-edge.
Figure 4.
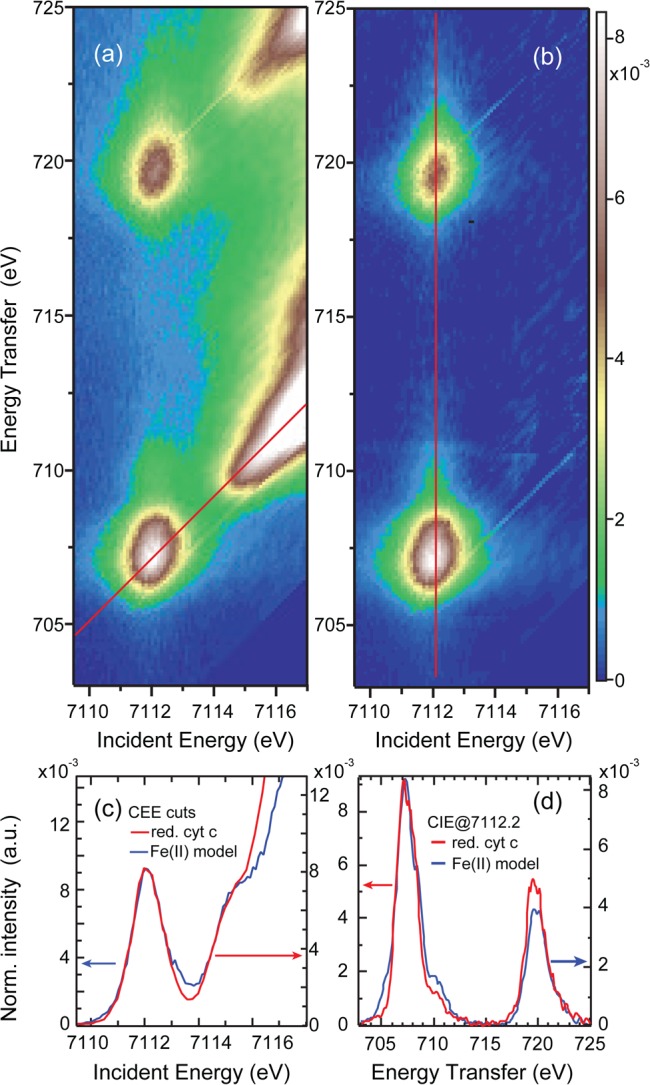
Ferrous cyt c: (a) Full 1s2p RIXS plane, (b) rising-edge subtracted 1s2p RIXS plane, (c) comparison of the CEE cut through the uncorrected plane (red line in (a)) with the CEE cut of Fe(II)TPP(ImH)2, (d) comparison of the CIE cut along the red line in (b) with the CIE cut of Fe(II)TPP(ImH)2.
Ferrous Multiplet Simulations
For quantitative analysis, the experimental data have been simulated using charge-transfer multiplet calculations within the VBCI framework. (see Supporting Information) The best fit to Fe(II)TPP(ImH)2 is shown in Figure 5: (a) K-edge and K-edge-like CEE cut, (b) the 1s2p RIXS plane, and (c) the L-edge and L-edge-like CIE cut. The corresponding parameter set is given in Table S1. The simulations reproduce the experimental results well for all three experimental methods. In line with the experiment, the simulated 1s2p RIXS cut is broader than the L-edge XAS simulation. The peak in the L-edge XAS simulation at 710 eV is reduced to a shoulder in the RIXS cut, and the ratio of the L3/L2-peak maxima is lower in the 1s2p RIXS cut. The projection of the VBCI ground state gives 70.4% dx2–y2, 77.2% dz2 metal, and 8.1% dπ* back-bonding character (Table 1).
Figure 5.
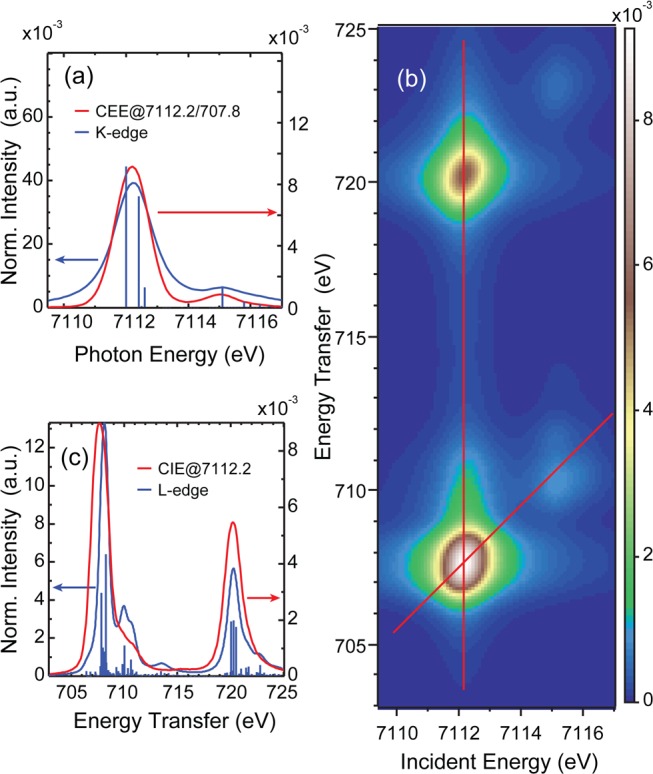
Fe(III)TPP(ImH)2 simulations: (a) comparison of the CEE cut along the red line in (b) with the simulated K-edge, (b) 1s2p RIXS plane simulation, (c) comparison of the CIE cut along the vertical red line in (b) with the direct L-edge simulation.
Table 1. Unoccupied Metal d-Character Derived from DFT Calculations Using the BP86 Functional with 0, 10, and 20% Hartree–Fock (HF) for the Full Molecule, 20% HF for the Truncated Model, and VBCI Simulationsa.
|
dx2–y2 [%] |
dz2 [%] |
π* [%] |
d(π) [%] |
|||||
|---|---|---|---|---|---|---|---|---|
| model | protein | model | protein | model | protein | model | protein | |
| ferrous: | ||||||||
| full molecules: | ||||||||
| BP86 | 71.3 | 71.6 | 71.8 | 70.4 | 9.3 | 9.2 | ||
| BP86 + 10% HF | 75.0 | 74.8 | 75.8 | 73.6 | 7.2 | 7.0 | ||
| BP86 + 20% HF | 77.3 | 77.3 | 78.5 | 76.5 | 5.2 | 4.8 | ||
| truncated models: | ||||||||
| BP86 + 20% HF | 77.7 | 77.6 | 78.5 | 77.9 | 5.2 | 5.2 | ||
| VBCI simulations: | 70.4 | 73.4 | 77.2 | 70.4 | 8.1 | 7.1 | ||
| ferric: | ||||||||
| full molecules: | ||||||||
| BP86 | 65.5 | 66.2 | 65.0 | 62.2 | 2.5 | 3.3 | 86.4 | 82.1 |
| BP86 + 10% HF | 67.3 | 68.0 | 66.5 | 63.7 | 1.6 | 1.9 | 90.9 | 87.7 |
| BP86 + 20% HF | 69.0 | 68.9 | 68.0 | 65.3 | 1.1 | 1.2 | 92.6 | 91.4 |
| truncated models: | ||||||||
| BP86 + 20% HF | 69.1 | 68.9 | 67.8 | 65.7 | 1.1 | 1.2 | 93.4 | 91.4 |
| VBCI simulations: | 68.8 | 71.5 | 66.7 | 62.3 | 2.8 | 2.5 | 75.0 | 71.0 |
Note that the full molecule cyt c is optimized with the Fe–S(met) distance constrained at 2.29 (Fe(II)) and 2.33 Å (Fe(III)), while the truncated model is fully optimized, and that the dz2 metal d-character includes the influence of both axial ligands.
From the group theory considerations in Figure 3(b), B2u final states are forbidden in direct L-edge XAS. In addition, final states with Eu symmetry can be reached through the z2 and x2 – y2 intermediate states that are split in energy due to the tetragonal geometry. Thus, the Eu final states are also split in energy by the crystal field splitting of the dσ orbitals. To identify all contributions to the 1s2p RIXS plane, we separate the excitations into their individual pathways as shown in Figure 6(b–e). Since intermediate states of different symmetries do not interfere, the full RIXS plane is given by a summation of all four pathways, which are compared to the L-edge XAS spectral splittings in Figure 6(a).
Figure 6.
Comparison of the final state L-edge XAS simulation (a), and the four 1s2p RIXS pathways carrying most intensity (b–e). Pathways through the intermediate state with B2g and Eg are omitted for clarity.
The Eu final states contribute at energies above and below the main peak with the excitation through the z2 (a1g) orbital being lower in energy than through the x2 – y2 (b1g) orbital, reflecting the ligand field energy splitting of these orbitals with the z2 being lower in energy. The 1s2p RIXS final state splitting however is significantly larger than the ground state energy splitting (≈ 1.1 eV as compared to ≈0.4 eV,29 respectively), which results from the strong 2p3d repulsive interaction. The Eu core-hole final state has mainly px, py character (pz is mixed into the wave function through 2p spin–orbit coupling), which have a lower spatial overlap with the z2 than with the x2 – y2 orbital, leading to the increased energy splitting. This is a characteristic of 1s2p RIXS, which is inaccessible through L-edge XAS due to the large differences in the electric dipole matrix elements for absorption.48 In direct L-edge XAS, the transition matrix element px,y → dx2–y2 is four times stronger than px,y → dz2, leading to an intensity distribution mainly at higher energies (Figure 6(a)).
The other two final state symmetries are energetically located between the Eu states. Both the B2u and A2u core-hole final states (Figure 3(b)) have mainly pz character, which now has stronger spatial overlap with the z2 orbital. Thus, the crystal field and 2p core-hole repulsion influences on the energy oppose each other with the core-hole being dominant, which inverts the excitation energy order relative to the Eu states.
For ferrous cyt c, simulations of the K-edge, 1s2p RIXS, and CIE cut comparisons are shown in Figure 7. All relative changes are reproduced, however they are less pronounced than in the experiment. Both K-edge simulations have equal peak widths, in line with the experimental result. The CIE cuts along the red line in the 1s2p RIXS plane in Figure 7(c) show slightly higher intensity in the shoulder at 710 eV for the model complex, while the L2 intensity is higher for the ferrous cyt c simulation.
Figure 7.
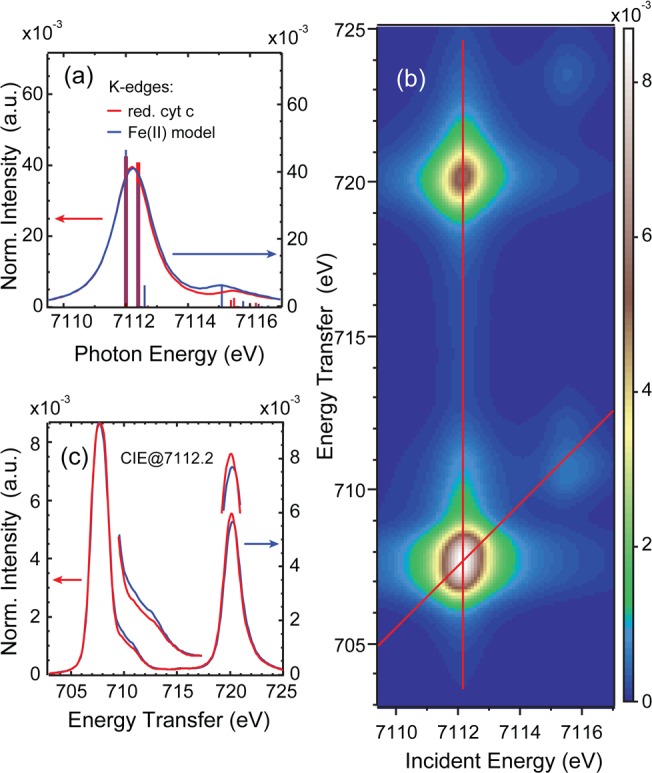
Ferrous cyt c simulations: (a) comparison of the CEE cut along the red line in (b) with the CEE cut of the model complex simulation, (b) 1s2p RIXS plane simulation, (c) comparison of the CIE cut along the vertical red line in (b) with the CIE cut of the model complex simulation.
In order to reproduce these spectral differences, the covalent mixing of the dz2 orbital must be increased in cyt c (see Table S1). This leads to a projection of the VBCI ground state of 73.4% dx2–y2, 70.4% dz2 metal, and 7.1% dπ* back-bonding character (Table 1). Thus, in going from Fe(II)TPP(ImH)2 to Fe(II) cyt c, the dz2 metal character decreases, while the dx2–y2 increases and the π back-bonding character slightly decreases due to the normalized wave function.
Ferric Spectroscopy
Ferric TPP-bisIm
Figure 8 presents the experimental results of Fe(III)TPP(ImH)2 plotted as for the ferrous complexes: Figure 8(a) shows the full 1s2p RIXS plane, while Figure 8(b) is the rising-edge subtracted plane. As a clear difference relative to the ferrous results, a well separated feature is visible at 7111.2 eV incident energy and 706 eV energy transfer in the L3-edge-like region (7111.2/718.6 eV in the L2-edge-like region). The high intensity feature around 7112.9/708.1 eV (7112.9/720.6 eV) is similar to the low-spin ferrous case. Figure 8(c) gives a comparison of the direct K-edge XAS to the CEE cut along the diagonal red line in Figure 8(a). In K-edge XAS, the low energy peak at 7111.2 eV appears as a weak shoulder, while two peaks are well resolved in the CEE cut. This is an intrinsic advantage of the two-dimensional plane as given by 1s2p RIXS and not due to experimental resolution, since the CIE integrated RIXS plane (which represents the K-edge) overlays with the direct K-edge spectrum (see Figure S5).
Figure 8.
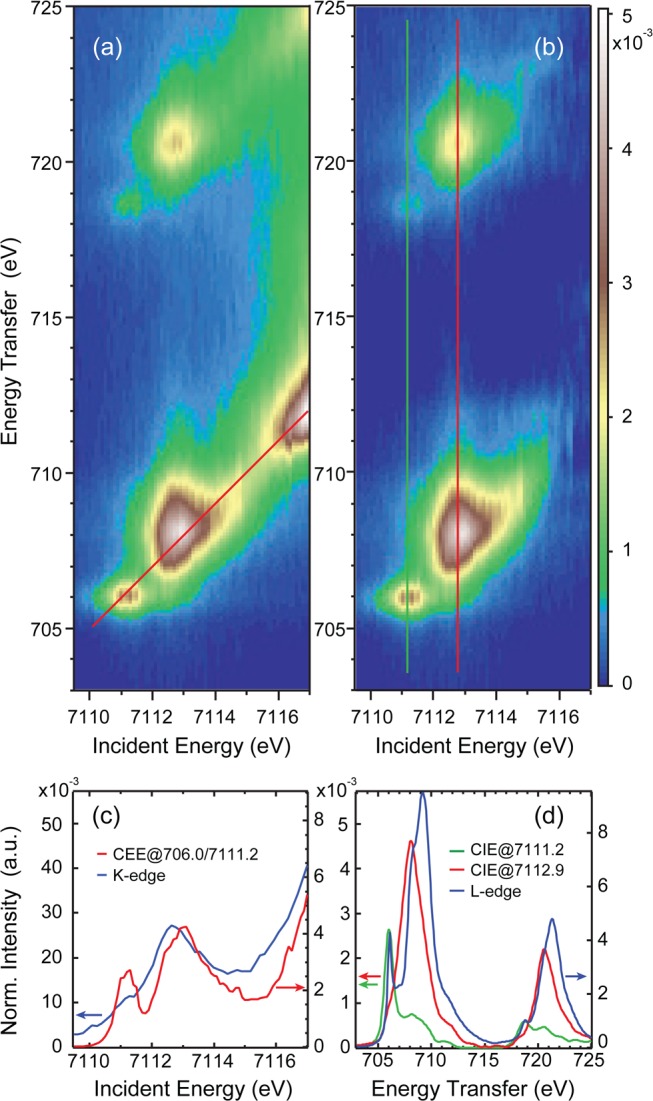
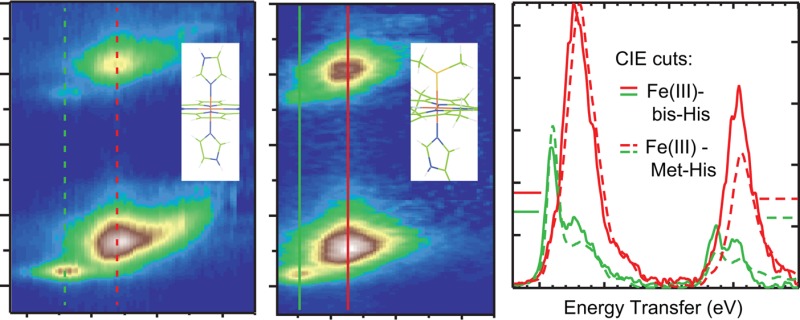
Fe(III)TPP(ImH)2: (a) Full 1s2p RIXS plane, (b) rising-edge subtracted 1s2p RIXS plane, (c) comparison of the CEE cut through the uncorrected plane (red line in (a)) with the direct K-edge, (d) comparison of the CIE cuts along the green and red lines in (b) with the direct L-edge experimental data.
One of the main advantages of 1s2p RIXS is the ability to select a specific incident energy (i.e., a specific K-pre-edge transition) and record the corresponding L-edge-like spectrum associated with this pre-edge peak. When exciting with 7111.2 eV incident energy, the low lying dπ hole (in the ferric d5 configuration) is probed, while exciting at an incident energy of 7112.7 probes dσ character in the L-edge-like spectrum. Note that due to the weak 1s3d interaction, little mixing occurs and pre-edge peak interpretation in terms of specific d orbital excitations is reasonable,47 which is not the case for 2p L-edge final states.30
In Figure 8(d), the direct L-edge XAS data are compared to two CIE cuts taken through the two features in the rising-edge subtracted RIXS plane (Figure 8(b)) along the green and red lines at 7111.2 (π) and 7112.9 eV (σ character), respectively. While the low energy cut aligns well with the lowest energy L-edge XAS feature, the higher energy cut has its maximum at a lower transfer energy than the main peak of the L-edge XAS spectrum, similar to what was observed above for the ferrous TPP(ImH)2 complex.
Ferric cyt c
Figure 9(a) and (b) presents the 1s2p RIXS results for ferric cyt c, Figure 9(a) gives the full 1s2p RIXS plane, while Figure 9(b) is the rising-edge subtracted plane. Three main differences relative to the ferric TPP(ImH)2 model complex RIXS data (Figure 8) are observed: (1) The π feature at 7111.1 eV incident energy is weaker for the protein; (2) the strong σ feature around 7112.6 eV is shifted down in incident energy by 0.3 eV toward the π region; and (3) the L2-like σ region at 7112.6/720.3 eV is higher in intensity relative to the L3-like σ region.
Figure 9.

Ferric cyt c: (a) Full 1s2p RIXS plane, (b) rising-edge subtracted 1s2p RIXS plane, (c) comparison of the CEE cut through the uncorrected plane (red line in (a)) with the CEE cut of Fe(III)TPP(ImH)2, (d) comparison of the CIE cuts along the green and red lines in (b) with the corresponding CIE cuts of the ferric model complex.
The first two points are also visible in Figure 9(c) where the two CEE cuts of Fe(III) cyt c and TPP(ImH)2 are compared. The low energy peak is slightly less intense and the main peak is shifted to lower incident energy.
In Figure 9(d), the L-edge-like cuts through the cyt c RIXS plane (solid lines) are compared to the corresponding cuts through the ferric Fe(III)TPP(ImH)2 RIXS plane (dashed lines). Comparing the two CIE spectra associated with π excitation (cuts along the green lines in Figures 8 and 9(b)), three observations can be made: (1) The peak position of the low energy feature is the same at 706 eV; (2) the protein peak is slightly lower in intensity; and (3) the shoulder at 708.2 eV is higher in intensity. CIE cuts associated with σ excitation (cuts along the red lines in Figures 8 and 9(b))) reveal two distinct differences: (1) The Fe(III) cyt c CIE spectrum is shifted toward lower energies by 0.3 eV at both the L3- and L2-edge; (2) the L3/L2 peak intensity ratio is lower for Fe(III) cyt c. Note that the lower L3/L2 peak intensity ratio was also found for the Fe(II) complexes, while the shift to lower energy of the σ excitation decay spectrum is only observed in the ferric complex comparison.
Ferric Multiplet Simulations
In parallel to the ferrous case, charge-transfer multiplet calculations within the VBCI framework were performed to simulate the above Fe(III) experimental data. Final parameters are given in Table S1. The Slater–Condon parameters were reduced to 70% of the Hartree–Fock derived values in the initial and to 60% in the final states due to covalency effects. The difference in ground and final states reduction originates from the effect of the mixing parameters on the electron distribution in the VBCI model with and without a 2p core-hole that are thus corrected using the Slater–Condon parameters. Figure 10 gives the best fits to Fe(III)TPP(ImH)2 spectra: (a) The K-edge and K-edge-like CEE cut, (b) the 1s2p RIXS plane, and (c) the L-edge and L-edge-like CIE cut. The simulations reproduce the experimental results (see Figure 8) for all three methods. The CEE cut along the diagonal red line in Figure 10(b) (see Figure 10(a)) shows a higher intensity for the dπ peak at 7111.2 eV compared to the direct K-edge simulation due to the higher intrinsic resolution of the two-dimensional RIXS plane. The dσ peak at ≈7113.2 eV appears at 0.3 eV higher energy in the CEE cut than the direct K-edge simulation, in line with the experimental result in Figure 9.
Figure 10.
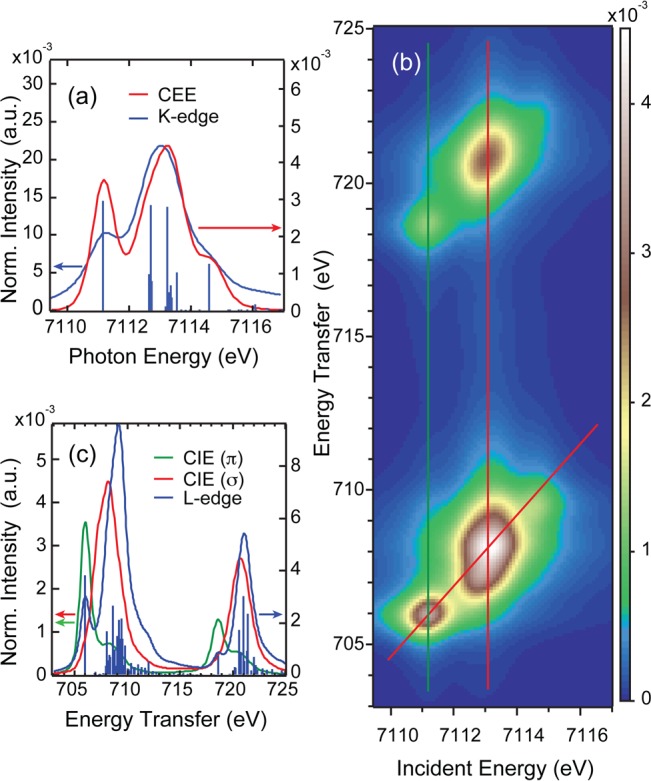
Fe(III)TPP(ImH)2 simulations: (a) Comparison of the CEE cut along the red diagonal line in (b) with the simulated K-edge, (b) 1s2p RIXS plane simulation, (c) comparison of the CIE cuts along the green and red vertical lines in (b) with the direct L-edge simulation.
The direct L-edge simulation shown in Figure 10(c) reproduces the experimental L-edge, but underestimates the intensity of the lower energy peak at 706 eV. The dπ and dσ CIE cuts (green and red vertical lines in Figure 10(b), respectively) follow the experimental results, with the dπ intensity being slightly overestimated, while the peak width, shape, and energy splitting match the experimental results. The main CIE peak at 708.2 eV appears ∼1 eV lower in energy than the L3-edge peak, similar to the behavior experimentally observed for Fe(II)TPP(ImH)2 above and in ferric complexes.38 A DOC quantitative analysis of the VBCI ground state reveals 69% dx2–y2, 67% dz2, 75% dπ metal character, and 3% dπ* back-bonding into the porphyrin.
In Figure 11, best fit simulations of ferric cyt c data are compared to the above simulation results for Fe(III)TPP(ImH)2: (a) A comparison of the CEE cut of ferric cyt c (along the diagonal red line in Figure 11(b)) with the CEE cut of Fe(III)TPP(ImH)2 (along the diagonal red line in Figure 10(b)), (b) the 1s2p RIXS plane, and (c) a comparison of the CIE cuts at lowest energy through the dπ regions (along the green vertical lines in Figures 11 and 10(b)), and the cuts at higher energies through the dσ regions (along the red vertical lines in Figures 11 and 10(b)).
Figure 11.
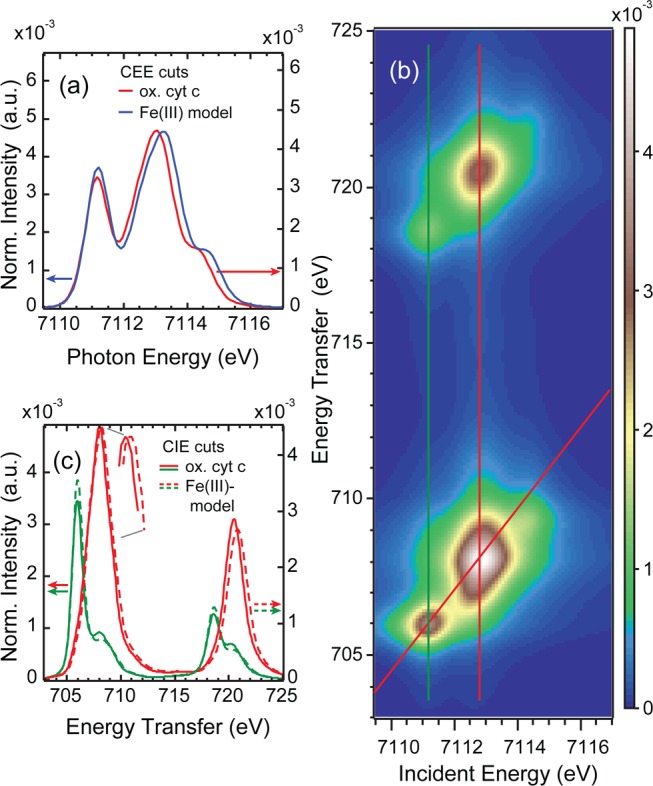
Ferric cyt c simulations: (a) Comparison of the CEE cut along the red diagonal line in (b) with the CEE cut of the model complex simulation, (b) 1s2p RIXS plane simulation, (c) comparison of the CIE cuts along the green and red vertical lines in (b) with the CIE cuts of the model complex simulation.
The CEE cuts of the simulated RIXS planes for both complexes reproduce the experimental spectral changes well: the intensity of the dπ peak at 7111.2 eV is decreased for cyt c, while the energy difference between the dπ and the dσ peak at ≈7113.0 eV is 0.2 eV smaller in the ferric cyt c simulations, in line with the experimental results in Figure 9.
In the L-edge-like CIE cuts through the simulated RIXS planes of Fe(III)TPP(ImH)2 and ferric cyt c (Figure 11(c)), three main changes in the spectral shape are observed: (1) A slight decrease of the low energy Fe(III) cyt c peak intensity at 706 eV with an increase in intensity in the shoulder at 708.2 eV in the CIE cut after π excitation (green curves); (2) a shift by 0.3 eV toward lower energy for the CIE cuts after σ excitation for ferric cyt c (red curves); and (3) an increase of the L2-like σ intensity. All of these characteristic changes are also observed in the CIE cuts through the experimental RIXS planes (Figure 9(d)).
Similar to the ferrous case, these changes required an increase in the covalent mixing of the z2 orbital for ferric cyt c relative to Fe(III)TPP(ImH)2, together with a lower crystal field (10Dq) and an increased covalent dπ mixing. This leads to a projection analysis of the VBCI ground state DOC of 69% dx2–y2, 64% dz2, 73% dπ metal, and 3% dπ* back-bonding character in the porphyrin. Thus, in going from ferric FeTPP(ImH)2 to cyt c, the dz2 and dπ metal character decrease with the increase of the covalent mixing. As a consequence, the dx2–y2 character increases and the π back-bonding character slightly decreases due to the normalized wave function.
Density Functional Calculations
Correlating Electronic Structure Calculations to 1s2p RIXS Data
As described above, VBCI multiplet calculations reproduce all observed spectroscopic changes in the 1s2p RIXS planes when going from both the ferrous and ferric FeTPP(ImH)2 model complex to cyt c. Both the ferrous and ferric complexes require an increase in the covalent a1g mixing for cyt c resulting in lower dz2 character (i.e., increased covalency), while for the dπ hole present in the ferric case, the eg mixing increases for Fe(III) cyt c, leading to a decrease in dπ character.
While VBCI simulations are able to reproduce the experimental results due to the full multiplet treatment including the 1s and 2p core-holes, they are unable to distinguish between the two axial ligands and the specific contributions from the porphyrin, as all contribute to the a1g (dz2) mixing.
DFT calculations were performed to obtain a more detailed description of the ground state. The Fe–S(Met) distance in cyt c was constrained to the crystal structure values of 2.29 Å (Fe(II) and 2.33 Å (Fe(III)) since a fully optimized structure leads to an overestimated Fe–S(Met) bond length by more than 0.1 Å. However, also the fully optimized structure find a shorter Fe(II)-S axial bond length, in-line with the experimental multishell EXAFS finding16 and previous DFT results.49 The resulting DFT derived charge densities (orbital differentiated metal d-characters) are equivalent to the VBCI derived DOC values and are used to couple the experimental results to the DFT calculations.
The results for the ferrous calculations are shown in Table 1 (top) for three functionals: BP86, BP86 + 10% Hartree–Fock (HF), and BP86 + 20% HF (in the following labeled as B(XXHF)P86). All three functionals find unchanged dx2–y2 metal d-character in ferrous cyt c compared to Fe(II)TPP(ImH)2 and a small, reproducible decrease in dz2 character. The π* bonding character does not change. These results parallel the VBCI simulations of the data, where an increase in a1g mixing leads to a decrease in dz2 character. The associated change in dx2–y2 and π* back-bonding in the VBCI simulations are due to the normalized nature of the wave function.
A collection of the various ligand characters for dz2 binding as derived from a fragment analysis of the DFT results is given in Table 2 (top). All three functionals give the same behavior. The decrease in dz2 character is accompanied by a decrease in porphyrin character and an increase in axial ligand character. This is mainly due to the exchange of an imidazole by a thioether, resulting in the ruffling of the porphyrin (the removing of the cross-links do not significantly contribute to the ruffling50 and a decrease in the Fe–N(His) bond length).
Table 2. Collection of Metal and Ligand Characters from a Fragment Analysis for Three Different Functionals for the Full Molecules as Well as for the Small Molecule Modelsa.
| BP86 |
BP86 + 10% HF |
BP86 + 20% HF |
small molecule |
|||||
|---|---|---|---|---|---|---|---|---|
| model | protein | model | protein | model | protein | model | protein | |
| ferrous: | ||||||||
| dz2 | 71.8 | 70.4 | 75.8 | 73.6 | 78.5 | 76.5 | 78.5 | 77.9 |
| por | 9.7 | 6.5 | 8.4 | 6.0 | 7.3 | 4.1 | 7.4 | 5.0 |
| imh2/met + imh | 16.7 | 20.6 | 14.3 | 18.3 | 11.6 | 13.8 | 11.8 | 16.3 |
| imh | – | 10.8 | – | 9.6 | – | 7.7 | – | 8.4 |
| met | – | 9.8 | – | 8.7 | – | 6.1 | – | 7.9 |
| ferric: dz2 | ||||||||
| dz2 | 65.0 | 62.2 | 66.5 | 63.7 | 68.0 | 65.3 | 67.8 | 65.7 |
| por | 10.3 | 8.9 | 10.4 | 8.7 | 9.9 | 8.1 | 11.1 | 7.9 |
| imh2/met + imh | 19.7 | 24.8 | 19.2 | 23.9 | 18.4 | 24.1 | 18.7 | 22.9 |
| imh | – | 12.5 | – | 12.0 | – | 11.6 | – | 11.2 |
| met | – | 12.3 | – | 12.0 | – | 12.5 | – | 11.7 |
| ferric: dπ hole | ||||||||
| dπ | 86.4 | 82.1 | 90.9 | 87.7 | 92.6 | 91.4 | 93.4 | 91.4 |
| por | 13.3 | 18.7 | 9.1 | 12.8 | 6.7 | 10.7 | 6.9 | 9.8 |
| imh2/met + imh | 2.9 | 3.1 | 2.7 | 1.8 | 2.2 | 1.4 | 2.4 | 0.0 |
| imh | – | 3.1 | – | 1.8 | – | 1.4 | – | 0.0 |
| met | – | 0.0 | – | 0.0 | – | 0.0 | – | 0.0 |
Note that the full molecule cyt c is optimized with the Fe–S(Met) distance constrained, while the small molecule is fully optimized.
The results of the DFT calculations for the ferric complexes for all three functionals are given in Table 1 (bottom). While both the dx2–y2 and π* back-bonding covalencies do not change between ferric cyt c and Fe(III)TPP(ImH)2, a decrease in dz2 metal character is found, similar to the ferrous case. The dπ hole that is present in the ferric complexes also shows a decrease in metal character for all functionals as found in the VBCI simulations of the 1s2p RIXS data.
The fragment analysis (Table 2 (bottom)) qualitatively gives the same ligand bonding behavior for the dz2 orbital in the ferric as in the ferrous case: a decrease in dz2 and porphyrin ligand character is compensated by an increase in axial ligand character due to the exchange of an imidazole with the more covalent thioether ligand. The dπ bonding is dominating between the dπ hole and the filled porphyrin 3eg orbital, where the decrease in metal dπ character reflects an increase in 3eg that is caused by the ruffling of the porphyrin ring upon the imidazole/thioether exchange. The imidazole bonding character in the dπ* hole is small and unchanged between the Fe(III)TPP(ImH)2 and Fe(III) cyt c and there is no Met contribution present in the π* hole in ferric cyt c.
Truncated models with only the Fe-porphyrin ring and two axial ligands (bis-His and His-Met) were geometry optimized and compared to the results of the larger calculations. The last column in Table 2 gives the results on the truncated models for 20% HF. Importantly, the Fe covalencies and fragment analyses of the small molecule models quantitatively reproduce those of the large molecule models that contain the propionates and thioether linkages using the same functional and basis set. The small molecule models are thus used below to quantitatively evaluate the thermodynamics of axial ligand metal bonding.
Axial Ligand Bond Strengths
In this section, axial ligand bond strengths are calculated for both N(His) and S(Met) axial ligands in both Fe(II) and Fe(III) oxidation states. The bond strength is taken as the difference in energy between the ligand-on and ligand-off forms. Calculations do not include dispersion corrections; however, this should mainly affect the absolute binding energies and not the relative bond strengths.
A range of functionals and hybrids was evaluated to best reproduce the proper spin ground state for ligand-on and ligand-off forms for both redox states. This is described in the Supporting Information. In the presentation below, we use the B(20HF)P86 hybrid functional. However, all functionals lead to equivalent ligand binding descriptions.
The calculated axial ligand bond strengths for S(Met) and N(His) in both Fe(II) and Fe(III) oxidation states are given in Table 3. Note that values are reported for ligand loss. The axial ligand Fe(II)-S(Met) bond strength is calculated to be 5.0 kcal/mol (ΔE), while the Fe(II)-N(His) bond strength is 9.9 kcal/mol; the axial ligand Fe(III)-S(Met) bond strength is 7.1 kcal/mol, while the Fe(III)-N(His) bond strength is 16.9 kcal/mol. Thus, the Fe–S(Met) bond is weaker than the Fe–N(His) in both Fe oxidation states. Interestingly, from the above 1s2p RIXS data and the differential orbital covalency, the Fe–S(Met) bond is more covalent than the Fe–N(His) bond. This apparent discrepancy between covalencies and bond strengths is addressed in the Discussion. Furthermore, the Fe(III)-S(Met) bond is stronger than the Fe(II)-S(Met) bond (ΔE = 7.1 vs 5.0 kcal/mol, respectively). This is consistent with the higher S(Met) character for Fe(III) cyt c from the RIXS data/simulations and DFT calculations presented above. However, this observation is not consistent with the literature considerations summarized in the Introduction. Lastly, the difference in Fe(III) and Fe(II) bond strengths is larger for a N(His) axial ligand than for S(Met) (Table 3, ΔΔE = 7.0 vs 2.1 kcal/mol, respectively; note the ΔΔG for H2O is also given in Table 3 and is referred to in the Discussion). The stronger bonds to the Fe(III) states are generally consistent with this higher degree of covalency than in the corresponding Fe(II) states.
Table 3. Thermodynamics of Ligand Loss from FeII/IIIa.
| B(20HF)P86b | FeII-S(Met) | FeIII-S(Met) | ΔΔcS(Met) | FeII-N(His) | FeIII-N(His) | ΔΔN(His) | FeII-H2O | FeIII-H2O | ΔΔH2O |
|---|---|---|---|---|---|---|---|---|---|
| ΔE | 5.0 | 7.1 | 2.1 | 9.9 | 16.9 | 7.0 | –0.5 | 6.7 | 7.2 |
| ΔH | 2.6 | 5.5 | 5.5 | 7.2 | 14.7 | 7.5 | –2.0 | 5.3 | 7.3 |
| ΔG | –13.9 | –8.8 | 5.1 | –9.1 | –0.4 | 8.8 | –12.3 | –4.2 | 8.1 |
| expd | 3.6 | 0.6 | –3.0 | 4.7 | 4.9 | 0.2 | |||
| exp corr.e | 3.6 | 8.7 | 5.1 | 4.7 | 13.0 | 8.3 |
All energies are in kcal/mol.
6-311+G(d,p) basis set for all atoms and PCM corrections (ε = 4.0).
ΔΔ is the difference in FeIII and FeII axial ligand bond strengths.
ΔG0 values obtained from dissociation constants for AcMet and imidazole.10
Experimental values corrected for the calculated ΔΔG of H2O dissociation from Fe(III) (i.e., 8.1 kcal/mol)
Discussion
The highly covalent environment in Fe porphyrin complexes do not allow for most methods to quantitatively determine the local electronic structure. Fe L-edge XAS using soft X-rays is a powerful tool to determine the metal d-characters for all orbitals (i.e., the DOC)27 including the ability to separately determine the σ and π donation and back-bonding.28,29,51 The soft X-ray nature of Fe L-edge XAS leads to a low lifetime broadening and a feature rich spectrum, but requires ultrahigh vacuum conditions and generally involves the detection of electrons within a few Å of the surface of the sample. The sampling depth can be enlarged to a few micrometers by detecting the fluorescence decay; however, this can lead to significant self-absorption effects. Hard X-rays do not have these restrictions, but give lower resolution spectra due to the short lifetime of the 1s core-hole as observed in Fe K-edges.47
1s2p RIXS combines the advantages of both methods, leading to two-dimensional high resolution spectra for samples in a variety of environments. The same information regarding the DOC can be extracted from 1s2p RIXS with the advantage of accessing L-edge XAS forbidden final states.38 In complexes with tetragonal symmetry like FeTPP(ImH)2, where both L-edge XAS and 1s2p RIXS have been obtained, the broadening of the L-edge-like (CIE) RIXS cut associated with σ excitation is further enlarged due to the contribution from the dx2–y2–dz2 orbital energy splitting, while this equatorial vs axial splitting is not accessible in direct L-edge XAS due to the dipole selection rule and strong multiplet effects.
To access the electronic structure of the heme center in cyt c in its ferrous and ferric form, only 1s2p RIXS experiments could be performed; these were compared to the results from corresponding ferrous and ferric FeTPP(ImH)2 model complexes. In the ferrous case, two characteristic spectral changes were observed for ferrous cyt c relative to the ferrous bis-imidazole model: A decrease in intensity of the high energy shoulder of the L3-like peak and an increase of relative intensity of the L2-like peak in the CIE cut associated with σ excitation (Figure 4). These changes require an increase of the z2 covalency. Note that these spectral changes can only be quantified by including the whole L-edge-like energy range; often, only the L3-like energy region is taken into account, which would not have been sufficient for a unique identification of this increase in z2 covalency. In the ferric complexes, two CIE cuts are required and their comparison between the ferric bis-imidazole model and ferric cyt c defines four characteristic spectral variations: (i) The L2-like relative intensity increases for ferric cyt c in the CIE RIXS cut associated with σ excitation, similar to the ferrous case; (ii) the energy positions of the L3- and L2-like peaks in the σ cut are shifted toward lower energies, which is different from the ferrous result; (iii) the main peaks in the CIE cut associated with π excitation appear at the same energy, but with weaker intensity for ferric cyt c; and (iv) the intensity of the shoulder of the main peak in the π cut increases (Figure 8). An increase of z2 covalency reproduces the increase in L2-like intensity, parallel to the ferrous case. The shift toward lower energy of the σ CIE cut is due to a decrease of the crystal field strength, 10Dq, together with an increase of π covalency, reproducing the other three observations. From DFT calculations correlated to these data, the increase of z2 covalency is due to the axial ligand change from imidazole to methionine, as methionine has a stronger σ donation than imidazole. The increase of π covalency is due to the porphyrin ring, which is ruffled due to this ligand exchange, rather than a π donation interaction with the methionine ligand. Finally, from the quantitative DOC’s obtained from the VBCI fit to the 1s2p RIXS data, the axial methionine covalent interaction is found to be larger in ferric than in ferrous cyt c.
The experimental RIXS data and simulations have indicated that the Fe–S(Met) bond is more covalent than the Fe–N(His) bond. However, the calculated axial ligand bond strengths in Table 3 indicated that the Fe–S(Met) bond is weaker than the Fe–N(His) bond. This difference can be understood in terms of basic bonding concepts. Within the framework of perturbation theory, the bond energy (BE) is proportional to (HM–L)2/Δ, where HM–L is the resonance integral between the metal and the ligand orbitals and Δ is the difference in energy between these interacting orbitals before bonding. The covalency (i.e., the coefficient squared of ligand character in the metal d-orbital, α2) is proportional to ((HM–L)/Δ)2. Thus, the BE can be estimated from the covalency scaled by Δ (i.e., BE = α2Δ). Thus, the stronger Fe–N(His) bonds relative to Fe–S(Met), despite their lower covalencies, can be understood in terms of the difference in their valence donor orbital energies, where the ImH σ donor bond is 1.1 eV lower in energy than the Met b1 valence donor orbital. This results in a significantly larger Δ for N(His) and thus a stronger M–L bond.52
It was found above that the Fe(III)-S(Met) bond is stronger than the Fe(II)-S(Met) bond (7.1 vs 5.0 kcal/mol, respectively, Table 3). The energy of the axial ligand bond was calculated as the difference in energy between the ligand-on (S = 1/2 and S = 0 for Fe(III) and Fe(II), respectively) and ligand-off ground states (S = 3/2 quantum mixed and S = 2 for Fe(III) and Fe(II), respectively). Thus, there can be additional contributions to the calculated bond strengths due to the different spin states involved in ligand loss. These can be taken into account using the potential energy surfaces (PESs) of ligand binding to the Fe(III) and Fe(II) states. Figure 12 gives the PESs for Met ligand loss for the ferrous state in the gas phase leading to an S = 0 to S = 2 surface crossing. The gas-phase axial S(Met) ligand bond strength is 5.6 kcal/mol. Note that energies for the corresponding two-box calculations (i.e., the prophyrin and axial ligand are calculated separately) are given in parentheses (e.g., 5.8 kcal/mol for the Fe(II)-S(Met) bond strength). The energy of ligand loss on the S = 0 surface is calculated to be 12.3 kcal/mol (Figure 12, right). The difference in energy for these two processes of ligand loss is the exchange stabilization energy corresponding to a change in Fe(II) spin-state (i.e., S = 0 → S = 2) and is calculated to be 6.2 kcal/mol (Figure 12). (Note that the exchange stabilization energy is taken to be the difference in energy between the S = 0 and S = 2 spin states without an additional axial ligand in order to directly compare to Fe(III) case below.) Thus, this exchange stabilization lowers the calculated value for the axial ligand bond strength. Analogous calculations for axial ligand loss from the Fe(III)-porphyrin site give gas-phase axial ligand bond strengths of 8.1 kcal/mol (for the S = 1/2 → S = 3/2 conversion) and 17.8 kcal/mol (for ligand loss along the S = 1/2 surface) and an exchange stabilization energy of 9.7 kcal/mol. Thus, even after correcting the Fe(III) and Fe(II) axial ligand bond strengths for the different exchange stabilization energies (9.7 vs 6.2 kcal/mol, respectively), the axial ligand bond in the Fe(III) site is still stronger than that for the Fe(II) (8.1 vs 5.6 kcal/mol, respectively). Without exchange stabilization, the difference between the Fe(III) and Fe(II) bond strengths is even larger (17.8 vs 12.3 kcal/mol). The fact that the Fe(III)-S(Met) bond is stronger than Fe(II)-S(Met) is consistent with the higher degree of covalency, as determined above via the 1s2p RIXS data and simulations.
Figure 12.
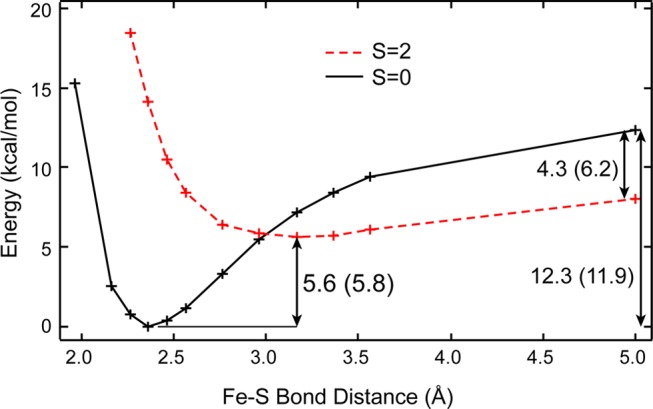
DFT calculated gas-phase potential energy surfaces of S(Met) binding to both Fe(II) S = 0 (black line and crosses) and S = 2 (red dashed line and crosses) spin-states. Values for the energetics are given in kcal/mol. Energetics are calculated from the ligand-off form either with the porphyrin and methionine in the same calculation or porphyrin and methionine in separate calculations (in parentheses). Values for Fe(III) S = 1/2 and S = 3/2 are given in the text.
As outlined in the Introduction, past considerations have concluded that, in cyt c, the Fe(II)-S(Met) bond is stronger than the Fe(III)-S(Met) bond. One argument for this is the shorter Fe(II)-S(Met) bond (2.29 Å) relative to Fe(III)-S(Met) (2.33 Å) bond.16 However, the bond lengths are not necessarily related to bond strengths, as these are affected differently by the ionic and covalent contributions to bonding.30,53 Furthermore, for considerations related to the decrease in E0 upon Fe–S(Met) bond loss,6,7 ligand competition8,9 and binding,10−12 and protein folding studies,10,13−15 it is essential to define and refer to the reference state (i.e., S(Met) bound vs either N(His), N(Lys), or H2O axial ligands). Importantly, from Table 3, the ΔΔG for axial ligand binding between Fe(III) and Fe(II) states for S(Met), N(His), and H2O axial ligands is 5.1, 8.8, and 8.1 kcal/mol, respectively, and is thus larger for the N(His) and H2O axial ligands. This difference results in a decrease in E0 upon loss of the S(Met) ligand and replacement with either a nitrogen or oxygen based ligand (estimated to be 160 mV from the ΔΔG for S(Met) vs N(His), Table 3). This difference in ΔΔG also leads to an apparent increase in S(Met) binding affinity to Fe(II) relative to Fe(III),10−12 as binding to the Fe(III) (but not Fe(II)) state also involves displacement of an axial H2O ligand. The calculated thermodynamics of ligand loss can be compared to experimental data obtained from the dissociation constants of AcMet and imidazole measured for N-acetylmicroperoxidase-8 (AcMP8, see Table 3).10 The ΔG0s of AcMet ligand loss from Fe(II) and Fe(III) AcMP8 are 3.6 and 0.6 kcal/mol, respectively. This would give an apparent ΔΔG of −3.0 kcal/mol, with AcMet binding stronger to Fe(II). However, correcting for water binding/displacement from Fe(III) and not Fe(II) using the calculated ΔΔG of 8.1 kcal/mol (Table 3) gives an adjusted ΔΔG of 5.1 kcal/mol. This compares well to the calculated value of 5.1 kcal/mol as given in Table 3. The same analysis can be applied to an imidazole axial ligand; this results in an adjusted ΔΔG of 8.3 kcal/mol, which compares well to the calculated value of 8.8 kcal/mol. The difference in the ΔΔG for S(Met) vs N(His) or H2O ligands can be understood through hard/soft acid/base concepts, where the harder nitrogen- and oxygen-based ligands bind more strongly to the Fe(III) than Fe(II) oxidation state and while the softer sulfur-based ligand still binds more strongly to Fe(III), it has a higher relative (to N and O based ligands) affinity for Fe(II).
Previous studies have defined the function of the axial S(Met) ligand in T1 Cu and CuA.2,4,5 The presence of the axial S(Met) bond lowers E0 due to the stronger Cu(II)-S(Met) bond relative to Cu(I). This difference in E0 is relative to the absence of axial ligand binding upon S(Met) ligand loss. A similar function is found here for cyt c, as the Fe(III)-S(Met) bond is indeed stronger than Fe(II); however, decreases in E0 are observed upon ligand loss in cyt c due to its replacement by an endogenous (N(His) or N(Lys)) or exogenous ligand (H2O). These ligands have larger ΔGs for Fe(III) vs Fe(II) binding and thus effectively lower E0 relative to the S(Met). Furthermore, the T1 Cu–S(Met) bond has been measured experimentally to be weak.5 Thus, the S(Met) bond would be subject to ligand loss due to entropic contributions at physiological temperature.4,5 This has provided insight into the “entatic/rack”54−57 nature of T1 Cu and CuA ET active sites. Similar behavior is found here for cyt c, as the axial ligand bond strengths for both Fe(II) and Fe(III) are weak (i.e., ∼5 kcal/mol) and on the order of the TΔS free energy of bond loss. Thus, analogous to T1 Cu, the protein matrix of cyt c provides the opposing free energy necessary to keep the axial S(Met) bond intact. The axial Fe–S(Met) bond in cyt c can therefore be considered under entatic control. The weaker Fe(II)-S(Met) bond as compared to the Fe(III)-S(Met) bond is also consistent with the observed axial ligand photolysis for Fe(II) but not Fe(III) cyt c. Differentiating bond strength contributions to the photochemistry and photophysics in cyt c is an aim of current studies.
Conclusion
This study has employed Fe 1s2p RIXS to investigate the electronic structure of ferrous and ferric cyt c. New insights were obtained by correlating cyt c to a bis-imidazole porphyrin model complex to experimentally define the differential orbital covalency of the iron site in the highly covalent porphyrin environment. They indicate an increased covalency for the Fe–S(Met) axial bond relative to Fe–N(His) as well as a higher degree of covalency for the ferric relative to the ferrous state. DFT calculations correlated to data further allowed for the evaluation of the relative axial ligand bond strengths for S(Met) and N(His) in both Fe(II) and Fe(III) redox states. Importantly, for cyt c, these calculations indicate that the Fe–N(His) bonds are stronger than the Fe–S(Met) bonds despite the latter being more covalent. Furthermore, the Fe(III)-S(Met) bond is stronger than the Fe(II)-S(Met) bond, which provides new insight into the redox and photophyscial properties of this protein. Finally, both (Met)S–Fe bonds are weak and an important role of the protein is in maintaining these bonds under physiological conditions.
Acknowledgments
T.K. acknowledges financial support by the German Research Foundation (DFG) grant KR3611/2-1. R.G.H. acknowledges a Gerhard Casper Stanford Graduate Fellowship and the Achievement Rewards for College Scientists Foundation (ARCS). M.L. acknowledges the Marcus and Amalia Wallenberg foundation and the Swedish Research Council. This research was supported by the National Institute of General Medical Sciences of the National Institutes of Health under award number R01GM040392 (E.I.S.), NSF grant CHE-1360046 (E.I.S.) and P41GM103393 (K.O.H). Use of the Stanford Synchrotron Radiation Lightsource, SLAC National Accelerator Laboratory, is supported by the U.S. Department of Energy, Office of Science, Office of Basic Energy Sciences under Contract No. DE-AC02-76SF00515. The SSRL Structural Molecular Biology Program is supported by the DOE Office of Biological and Environmental Research, and by the National Institutes of Health, National Institute of General Medical Sciences (including P41GM103393). Parts of this work was performed at the Linac Coherent Light Source (LCLS), SLAC National Accelerator Laboratory, which is supported by the U.S. Department of Energy, Office of Science, Office of Basic Energy Sciences under Contract No. DE-AC02-76SF00515. This research used resources of the Advanced Photon Source, a U.S. Department of Energy (DOE) Office of Science User Facility operated for the DOE Office of Science by Argonne National Laboratory under Contract No. DE-AC02-06CH11357. We acknowledge Ryan Wilson for the kind provision of computer power, and Matthew Kieber-Emmons for help in the purification and preparation of cyt c samples.
Supporting Information Available
Additional information to the molecular structures are given and detailed information on sample preparation for both FeTPP(ImH)2 and cyt c are presented. The experimental methods L-edge XAS, K-edge XAS and 1s2p RIXS are described in detail, as well as the theoretical methodology used regarding the charge transfer multiplet calculations, plus a detailed description of the calculations using DFT. The methodology part of the Results and Analysis section is presented here together with additional information on spectral comparisons for the ferric compounds. Further details on the ligand bond strength calculations are given together with detailed tables. This material is available free of charge via the Internet at http://pubs.acs.org.
The authors declare no competing financial interest.
Funding Statement
National Institutes of Health, United States
Supplementary Material
References
- Liu J.; Chakraborty S.; Hosseinzadeh P.; Yu Y.; Tian S.; Petrik I.; Bhagi A.; Lu Y. Chem. Rev. 2014, 114, 4366. [DOI] [PMC free article] [PubMed] [Google Scholar]
- Solomon E. I.; Szilagyi R. K.; DeBeer G. S.; Basumallick L. Chem. Rev. 2004, 104, 419. [DOI] [PubMed] [Google Scholar]
- Solomon E. I.; Hadt R. G. Coord. Chem. Rev. 2011, 255, 774. [Google Scholar]
- Tsai M.-L.; Hadt R. G.; Marshall N. M.; Wilson T. D.; Lu Y.; Solomon E. I. Proc. Natl. Acad. Sci. U. S. A. 2013, 110, 14658. [DOI] [PMC free article] [PubMed] [Google Scholar]
- Ghosh S.; Xie X.; Dey A.; Sun Y.; Scholes C. P.; I S. E. Proc. Natl. Acad. Sci. U. S. A. 2009, 106, 4969. [DOI] [PMC free article] [PubMed] [Google Scholar]
- Raphael A. L.; Gray H. B. Proteins: Struct., Funct., Bioinf. 1989, 6, 338. [DOI] [PubMed] [Google Scholar]
- Ye T.; Kaur R.; Senguen F. T.; Michel L. V.; Bren K. L.; Elliott S. J. J. Am. Chem. Soc. 2009, 130, 6682. [DOI] [PMC free article] [PubMed] [Google Scholar]
- Hantgan R. R.; Taniuchi H. J. Biol. Chem. 1978, 253, 5373. [PubMed] [Google Scholar]
- Schejter A.; Plotkin B. J. Biol. Chem. 1988, 255, 353. [PMC free article] [PubMed] [Google Scholar]
- Tezcan F. A.; Winkler J. R.; Gray H. B. J. Am. Chem. Soc. 1998, 120, 13383–13388. [Google Scholar]
- Vashi P. R.; Marques H. M. J. Inorg. Biochem. 2004, 98, 1471–1482. [DOI] [PubMed] [Google Scholar]
- Lushington G. H.; Cowley A. B.; Silchenko S.; Lukat-Rodgers G. S.; Rodgers K. R.; Benson D. R. Inorg. Chem. 2003, 42, 7550–7559. [DOI] [PubMed] [Google Scholar]
- Pascher T.; Chesick J. P.; Winkler J. R.; Gray H. B. Science 1996, 271, 1558–60. [DOI] [PubMed] [Google Scholar]
- Mines G. A.; Pascher T.; Lee S. C.; Winkler J. R.; Gray H. B. Chem. Biol. 1996, 3, 491–497. [DOI] [PubMed] [Google Scholar]
- Cohen D. S.; Pielak G. J. J. Am. Chem. Soc. 1995, 117, 1675–7. [Google Scholar]
- Cheng M.-C.; Rich A. M.; Armstrong R. S.; Ellis P. J.; Lay P. A. Inorg. Chem. 1999, 38, 5703. [Google Scholar]
- In the literature, there is a range of Fe-thioether bond length of multiple cyt c systems given. The resolution of the diffraction data is not sufficient to distinguish between Fe(II)- and Fe(III)-thioether bond lengths. EXAFS data have the precision, but the result depends on the number of shells that are taken into account. Single-shell EXAFS analysis results in more similar bond lengths, while multishell analysis finds a clear separation between them with Fe(II)-S being shorter.
- Liu X.; Kim C. N.; Yang J.; Jemmerson R.; Wang X. Cell 1996, 86, 147–157. [DOI] [PubMed] [Google Scholar]
- Kagan V. E.; et al. Nat. Chem. Biol. 2005, 1, 223–232. [DOI] [PubMed] [Google Scholar]
- Belikova N. A.; Jiang J.; Tyurina Y. Y.; Zhao Q.; Epperly M. W.; Greenberger J.; Kagan V. E. Int. J. Radiat. Oncol. Biol. Phys. 2007, 69, 176–186. [DOI] [PubMed] [Google Scholar]
- Kagan V. E.; Bayir H. A.; Belikova N. A.; Kapralov O.; Tyurina Y. Y.; Tyurin V. A.; Jiang J.; Stoyanovsky D. A.; Wipf P.; Kochanek P. M.; Greenberger J. S.; Pitt B.; Shvedova A. A.; Borisenko G. Free Radical Biol. Med. 2009, 46, 1439–1453. [DOI] [PMC free article] [PubMed] [Google Scholar]
- Wang W.; Ye X.; Demidov A. A.; Rosca F.; Sjodin T.; Cao W.; Sheeran M.; Champion P. M. J. Phys. Chem. B 2000, 104, 10789. [Google Scholar]
- Negrerie M.; Cianetti S.; Vos M. H.; Martin J.-L.; Kruglik S. G. J. Phys. Chem. B 2006, 110, 12766. [DOI] [PubMed] [Google Scholar]
- Zang C.; Stevens J. A.; Link J. J.; Guo L.; Wang L.; Zhong D. J. Am. Chem. Soc. 2009, 131, 2846. [DOI] [PubMed] [Google Scholar]
- Braem O.; Consani C.; Cannizzo A.; Chergui M. J. Phys. Chem. B 2011, 115, 13723. [DOI] [PubMed] [Google Scholar]
- Solomon E. I.; Hedman B.; Hodgson K. O.; Dey A.; Szilagyi R. K. Coord. Chem. Rev. 2005, 249, 97. [Google Scholar]
- Wasinger E. C.; de Groot F. M. F.; Hedman B.; Hodgson K. O.; Solomon E. I. J. Am. Chem. Soc. 2003, 125, 12894–12906. [DOI] [PubMed] [Google Scholar]
- Hocking R. K.; Wasinger E. C.; de Groot F. M. F.; Hodgson K. O.; Hedman B.; Solomon E. I. J. Am. Chem. Soc. 2006, 128, 10442–10451. [DOI] [PubMed] [Google Scholar]
- Hocking R. K.; Wasinger E. C.; Yan Y.-L.; deGroot F. M. F.; Walker F. A.; Hodgson K. O.; Hedman B.; Solomon E. I. J. Am. Chem. Soc. 2007, 129, 113–125. [DOI] [PMC free article] [PubMed] [Google Scholar]
- Hocking R. K.; DeBeer George S.; Raymond K. N.; Hodgson K. O.; Hedman B.; Solomon E. I. J. Am. Chem. Soc. 2010, 132, 4006–4015. [DOI] [PMC free article] [PubMed] [Google Scholar]
- Gel’mukhanov F.; Ögreen H. Phys. Rep. 1999, 312, 87–330. [Google Scholar]
- Kotani A.; Shin S. Rev. Mod. Phys. 2001, 73, 203–246. [Google Scholar]
- Glatzel P.; Bergmann U.; Yano J.; Visser H.; Robblee J. H.; Gu W.; de Groot F. M. F.; Christou G.; Pecoraro V. L.; Cramer S. P.; Yachandra V. K. J. Am. Chem. Soc. 2004, 126, 9946–9959. [DOI] [PMC free article] [PubMed] [Google Scholar]
- de Groot F. M. F.; Glatzel P.; Bergmann U.; van Aken P. A.; Barrea R. A.; Klemme S.; Hävecker M.; Knop-Gericke A.; Heijboer W. M.; Weckhuysen B. M. J. Phys. Chem. B 2005, 109, 20751–20762. [DOI] [PubMed] [Google Scholar]
- Glatzel P.; Bergmann U. Coord. Chem. Rev. 2005, 249, 65–95Synchrotron Radiation in Inorganic and Bioinorganic Chemistry. [Google Scholar]
- Leidel N.; Chernev P.; Havelius K. G. V.; Schwartz L.; Ott S.; Haumann M. J. Am. Chem. Soc. 2012, 134, 14142–14157. [DOI] [PubMed] [Google Scholar]
- Glatzel P.; Bergmann U.; Yano J.; Visser H.; Robblee J. H.; Gu W.; de Groot F. M. F.; Christou G.; Pecoraro V. L.; Cramer S. P.; Yachandra V. K. J. Am. Chem. Soc. 2004, 126, 9946–9959. [DOI] [PMC free article] [PubMed] [Google Scholar]
- Lundberg M.; Kroll T.; DeBeer S.; Bergmann U.; Wilson S. A.; Glatzel P.; Nordlund D.; Hedman B.; Hodgson K. O.; Solomon E. I. J. Am. Chem. Soc. 2013, 135, 17121–17134. [DOI] [PMC free article] [PubMed] [Google Scholar]
- Sokaras D.; Weng T.-C.; Nordlund D.; Alonso-Mori R.; Velikov P.; Wenger D.; Garachtchenko A.; George M.; Borzenets V.; Johnson B.; Rabedeau T.; Bergmann U. Rev. Sci. Instrum. 2013, 84, 053102. [DOI] [PMC free article] [PubMed] [Google Scholar]
- Gog T.; et al. Synchrotron Radiat. News 2009, 22, 12–21. [Google Scholar]
- Gog T.; Casa D. M.; Said A. H.; Upton M. H.; Kim J.; Kuzmenko I.; Huang X.; Khachatryan R. J. Synchrotron Radiat. 2013, 20, 74–79. [DOI] [PMC free article] [PubMed] [Google Scholar]
- Cowan R. D.The Theory of Atomic Structure and Spectra; University of California Press: Berkeley, 1981. [Google Scholar]
- Butler P. H.Point Group Symmetry: Applications, Methods and Tables; Plenum Press: New York, 1981. [Google Scholar]
- Thole B. T.; van der Laan G.; C.Fuggle J.; Sawatzky G. A.; Karnatak R. C.; Esteva J.-M. Phys. Rev. B: Condens. Matter Mater. Chem. 1985, 32, 5107–5118. [DOI] [PubMed] [Google Scholar]
- de Groot F. M. F.; Kotani A.. Core Level Spectroscopy of Solids; CRC Press: Boca Raton, FL, 2008. [Google Scholar]
- Frisch M. J.et al. Gaussian 09, Revision D.01; Gaussian, Inc.: Wallingford, CT, 2009.
- Westre T. E.; Kennepohl P.; DeWitt J. G.; Hedman B.; Hodgson K. O.; Solomon E. I. J. Am. Chem. Soc. 1997, 119, 6297–6314. [Google Scholar]
- Kroll T.; Kraus R.; Schönfelder R.; Aristov V. Y.; Molodtsova O. V.; Hoffmann P.; Knupfer M. J. Chem. Phys. 2012, 137, 054306. [DOI] [PubMed] [Google Scholar]
- Rovira C.; Carloni P.; Parrinello M. J. Phys. Chem. B 1999, 103, 7031–7035. [Google Scholar]
- Faraone-Mennella J.; Tezcan F. A.; Gray H. B.; Winkler J. R. Biochemistry 2006, 45, 10504–10511. [DOI] [PubMed] [Google Scholar]
- Wilson S. A.; Kroll T.; Decreau R. A.; Hocking R. K.; Lundberg M.; Hedman B.; Hodgson K. O.; Solomon E. I. J. Am. Chem. Soc. 2013, 135, 1124–1136. [DOI] [PMC free article] [PubMed] [Google Scholar]
- An equivalent explanation can be given in terms of the difference in electronegativity of the donor atoms in the axial residues.
- Gorelsky S. I.; Basumallick L.; Vura-Weis J.; Sarangi R.; Hodgson K. O.; Hedman B.; Fujisawa K.; Solomon E. I. Inorg. Chem. 2005, 44, 4947. [DOI] [PMC free article] [PubMed] [Google Scholar]
- Gray H. B.; Malmström B. G.; Williams R. J. P. J. Biol. Inorg. Chem. 2000, 5, 551. [DOI] [PubMed] [Google Scholar]
- Williams R. J. P. Eur. J. Biochem. 1995, 234, 363. [DOI] [PubMed] [Google Scholar]
- Malmström B. G. Eur. J. Biochem. 1994, 223, 711. [DOI] [PubMed] [Google Scholar]
- Winkler J. R.; Wittung-Stafshede P.; Leckner B. G. J.; Malmström; Gray H. B. Proc. Natl. Acad. Sci. U. S. A. 1997, 94, 4246–4249. [DOI] [PMC free article] [PubMed] [Google Scholar]
Associated Data
This section collects any data citations, data availability statements, or supplementary materials included in this article.


