

Abstract
Background
Evidence suggests that chronic misuse of alcohol may preferentially affect the integrity of frontal white matter tracts, which can impact executive functions important to achieve and maintain abstinence.
Methods
Global and regional white matter (WM) microstructure was assessed using diffusion magnetic resonance (MR) measures of fractional anisotropy (FA) for 31 abstinent alcoholics with an average of 25 years of abuse and approximately 5 years of sobriety and 20 nonalcoholic control participants. Data processing was conducted with FreeSurfer and FSL processing streams. Voxelwise processing of the FA data was carried out using TBSS (Tract-Based Spatial Statistics). Clusters of significance were created to provide a quantitative summary of highly significant regions within the voxel wise analysis.
Results
Widespread, bilateral reductions in FA were observed in abstinent alcoholics as compared to nonalcoholic control participants in multiple frontal, temporal, parietal, and cerebellar WM tracts. FA in the left inferior frontal gyrus was associated with drinking severity.
Conclusions
The present study found widespread reductions in WM integrity in a group of abstinent alcoholics compared to nonalcoholic control participants, with most pronounced effects in frontal and superior tracts. Decreased FA throughout the frontostriatal circuits that mediate inhibitory control may result in impulsive behavior and inability to maintain sobriety.
Keywords: brain, addiction, diffusion MR, white matter, alcoholism
INTRODUCTION
Chronic misuse of alcohol results in morphological damage to the brain, as revealed with postmortem analyses and in vivo neuroimaging techniques. Abundant evidence indicates that the cortical effects of alcohol are widespread (e.g., De la Monte, 1988). The vulnerability of the white matter (WM) to the effects of alcohol is well documented and has received considerable attention (e.g., Pfefferbaum, et al., 2009). Pathology-based studies have further demonstrated that reductions in overall brain volume in alcoholics may in fact be largely accounted for by reduction in WM volume (e.g., De la Monte, 1988; Harper & Kril, 1985) and the frontal lobes may be particularly susceptible (Oscar-Berman, 2000).
Postmortem reports of WM changes associated with chronic alcoholism have shown structural changes in callosal, supratentorial, and infratentorial regions (Lewohl, et al., 2000), as well as whole brain reductions in WM volume (De la Monte, 1988; Harper & Kril, 1985). Alcohol severity (maximum daily alcohol consumption) has also been related to WM loss, postmortem (Kril, Halliday, Svoboda, & Cartwright, 1997).
In vivo structural magnetic resonance (MR) imaging studies have reported greater reductions in WM volume in individuals with chronic alcoholism than expected for age (Chanraud, et al., 2007; Gazdzinski, et al., 2005). Diffusion MR has extended morphometric MR findings by assessing the translational movement of water in tissue and allowing for the examination of the WM microstructure. Fractional anisotropy (FA) is a summary measure of the prominence of diffusion directionality along a WM fiber tract. Because myelination results in an environment that is more restrictive for water diffusion, FA values are high in fibers or tracts with heavy myelination, such as the body of the corpus callosum, and are low in those that are less myelinated (Salat, et al., 2005). The relative contribution of specific axonal components (e.g., membrane, cytoskeleton, myelin) and architectural characteristics to tensor-based scalar measures of FA in WM tissue continues to be debated (see Jones et al., 2013).
Diffusion MR investigations of individuals with chronic alcoholism have long demonstrated microstructural disruption of the corpus callosum (anterior and posterior) (Pfefferbaum, et al., 2000), even when no macrostructural abnormalities (e.g., gross measurement of tissue area) were detected (Pfefferbaum & Sullivan, 2002). More recently, investigations of WM have shown widespread degradation of tissue, often with greatest changes noted in frontal and superior sites (Pfefferbaum, et al., 2009). Pfefferbaum and colleagues demonstrated that FA in six predefined transcallosal WM fiber bundles involving anterior (prefrontal, premotor) and posterior (parietal, temporal, and occipital) fiber tracts were significantly associated with alcoholism (Pfefferbaum, Rosenbloom, Fama, et al., 2010). Compromise to specific bundles was associated with deficits in balance, sustained attention, associative learning, and psychomotor function.
The mechanism for alcohol-related WM loss is not yet clear, but likely involves changes in myelination and axonal integrity (Harper & Matsumoto, 2005; Pfefferbaum & Sullivan, 2005). Hansen et al. (1991) found fewer glial cells in temporal and frontal cortices in dogs after exposure to alcohol, suggesting a reduced capacity for myelin generation. Rats exposed to alcohol have demonstrated significantly slowed corpus callosum growth in vivo (Pfefferbaum, Adalsteinsson, Sood, et al., 2006), as well as thinner corpus callosum (greater fiber density, higher percentage of small fibers, and myelin thinning), postmortem (He & Crews, 2008).
Heavy alcohol use is one of many cerebrovascular risk factors effecting brain structure and function. Hypertension, hypercholesteremia, diabetes mellitus, insulin resistance, and cigarette smoking are often co-morbid with alcoholism. Comorbid cigarette smoking occurs in approximately 60–80% of alcoholics (Romberger & Grant, 2004), with even higher rates among individuals seeking treatment for alcoholism (Room, 2004). Cigarette smoking is associated with brain abnormalities in alcoholic individuals (Brody, et al., 2004) and comorbid chronic cigarette smoking has been shown to modulate brain injury and neurocognition in alcoholics (Durazzo, et al., 2004).
Much of the existing literature on WM microstructure has examined specified regions of interest in alcoholics compared to non-alcoholics. Whole brain WM analyses allow measurement of tissue microstructure across the cerebrum, unrestricted by predefined anatomical landmarks or fiber bundles (Smith, et al., 2006). In the current study we used analytic procedures to empirically guide our region-based analyses of WM to determine the regional vulnerability of the brain to chronic alcohol abuse.
First, whole brain differences in FA across the entire WM using the Tract-Based Spatial Statistics (TBSS) skeleton were examined between alcoholic and nonalcoholic individuals on a voxel-by-voxel basis (with age as a covariate). Next, we used an atlas-based cluster approach to identify regions in which there was a significant association between group assignment and FA. Based on the available findings, we expected to find widespread abnormalities in FA in WM tissue among currently abstinent alcoholic individuals, particularly in the corpus collosum and in WM tracts underlying the frontal cortex. We were particularly interested in WM microstructure in the dorsolateral prefrontal cortex and the inferior frontal gyrus (IFG), because these areas have been implicated in processes related to self-control, decision-making, response inhibition, and reward sensitivity (Davidson & Irwin, 1999; Ravaja, et al., 2013). The importance of response inhibition and lateralization of reward-based decision making has been directly implicated in addictive behavior (see Goldstein & Volkow, 2011). Due to the cross-sectional design, we did not expect to provide direct evidence of a temporal relationship between alcohol exposure and reduced FA.
MATERIALS AND METHODS
Participants
High-resolution structural MR scans were obtained from a total of 51 participants in two groups: abstinent alcoholic participants (ALC; n=31) and nonalcoholic control participants (NC; n=20). This study employed a convenience sample; participants were recruited by way of flyers and newspaper advertisements. All procedures were approved by the Institutional Review Board of Human Studies Research at the VA Boston Healthcare System. All participants provided informed consent and were reimbursed for time and travel. All were free of any neurological disease/illness. Participants were excluded for drugs affecting the central nervous system, blackouts (NCs only), seizure disorder (NCs only), head injury, hospitalization in a psychiatric facility > 1 week, substance abuse/dependence other than alcohol, cannabis use in the preceding year, or any medications for/history of severe psychiatric disorders (e.g., schizophrenia, chronic intractable obsessive compulsive disorder, agoraphobia, current major depression). History of depression (not current) was allowed, as was nicotine (current or lifetime) and cannabis (lifetime).
The mean age of the ALC group was 51 years (Table 1). Based on available data, the number of smokers in each group was evenly distributed (ALCs 45% smokers; NCs 40% smokers; Table 1). The NC group was matched to the ALC group with regard to sex, age, education, and estimated intelligence. The 95% confidence interval of the mean difference for each demographic factor is presented in Table 1.
Table 1.
Abstinent alcoholics were matched to nonalcoholic participants for age, sex distribution, education, and estimated IQ. Estimated IQ was measured with the Wechsler Adult Intelligence Scale, Third Edition (WAIS-III) (Wechsler, 1997). Verbal intelligence was measured with the Wechsler Test of Adult Reading (WTAR) (Wechsler, 2001). Mean demographic data (standard deviation) are presented for each group. Levels of alcohol consumption are presented for Abstinent alcoholic (ALC) individuals and nonalcoholic control (NC) participants assessed using the Self-Administered Short Michigan Alcoholism Screening Test (SMAST) and the Lifetime Drinking History (LDH). The LDH is a retrospective, interview-based procedure used to identify patterns of alcohol use beginning with the onset of regular drinking and ending with the individual’s current drinking pattern. Importantly, most variables (“Average drinks per day” and “Maximum drinks per day”) represent drinking only phases (non-drinking phases are not captured), whereas “Total drinks” and “Total drinks weight adjusted” provide a lifetime burden of alcohol consumption. 95% confidence intervals of the mean difference between groups are also presented.
| Age | Gender | Veteran Status | Smoking Status* | Education | Estimated IQ (WAIS-III) | VIQ (ANART) | SMAST | Total Drinks | Total Drinks Weight Adjusted |
Average Drinks/Day | Maximum Drinks/Day | ||
|---|---|---|---|---|---|---|---|---|---|---|---|---|---|
| Abstinent Alcoholics | Mean | 51 | 20 Male 11 Female |
12 Veterans 19 Non-Veterans |
9 Nonsmokers 6 Smokers |
14.3 | 107 | 104 | 9.0 | 60,250 | 11,750 | 9.9 | 14.3 |
| n=31 | SD | 8.0 | 2.5 | 13.2 | 18.3 | 2.7 | 116,420 | 24,630 | 6.2 | 7.6 | |||
| Nonalcoholic Controls | Mean | 48 | 13 Male 7 Female |
9 Veterans 11 Non-Veterans |
12 Nonsmokers 10 Smokers |
15.7 | 109 | 111 | 0.20 | 1,193 | 646 | 3.8 | 5.3 |
| n=20 | SD | 8.3 | 5.1 | 7.4 | 11.4 | 0.62 | 1,795 | 1,144 | 3.5 | 5.2 | |||
| 95% Confidence Interval of the mean difference | −1.5 7.9 |
−3.5 .81 |
−8.2 5.1 |
−21.3 8.1 |
7.6 10.1 |
−16,056 134,169 |
−4,796 26,998 |
2.0 10.3 |
3.8 14.3 |
We studied abstinent ALC participants to examine FA in WM tissue in the absence of possible confounding influences of current alcohol use. ALC participants reported abstinence of at least one month prior to participating in the study, a history of ≥ 21 drinks per week for four years or longer, and met criteria for Alcohol Abuse or Dependence on the Diagnostic Interview Schedule (DIS-IV) (Robins, Marcus, Reich, Cunningham, & Gallagher, 1996) or the Self-Administered Short Michigan Alcoholism Screening Test (SMAST) (Selzer, Vinokur, & van Rooijen, 1975). The mean length of abstinence prior to enrollment was 5.6 years (SD=7.8 years) and the median was 21 years. A wide range of abstinence was targeted to examine WM integrity in community-dwelling recovered alcoholics at all stages of abstinence rather than only recently detoxified alcoholics, as common in previous reports.
On the Lifetime Drinking History (LDH) (Skinner & Sheu, 1982), ALCs reported a history of alcohol abuse that ranged in duration from 4 to 46 years, with a mean of 25 years (SD=9.4 years). The LDH yields an estimate of total lifetime exposure to alcohol using number of standard drinks consumed. ALCs reported an average lifetime total volume of alcohol exposure of 60,250 total drinks (SD=116,420 drinks) or 819,400 g (SD=1,583,312 g) absolute alcohol. ALCs reported a mean of 10 (SD=6.3) standard drinks per drinking day and a mean maximum of 14 (SD=7.6) standard drinks per drinking day.
Twenty-one ALCs met DSM-IV diagnostic criteria for Alcohol Dependence on the DIS-IV and 7 met criteria for Alcohol Abuse. The three participants who did not meet DIS-IV criteria self-identified as alcoholics, reported drinking histories consistent with alcoholism, and scored positively on the SMAST (scores > 7). The SMAST is a self-report measure to identify alcoholic dependency. Higher scores are associated with higher levels of alcohol consumption, dependency, tolerance, and maladaptive behaviors interfering with social/occupational functioning (0–1 = nonalcoholic profile, 2 = possible alcoholic profile, and ≥3 = alcoholic profile). ALCs reported scores ranging from 3 to 13 with a mean score of 9.0 (SD= 2.7). NC participants denied any significant history of alcohol or substance abuse and none met criteria for Alcohol Dependence or Abuse. This group of NC participants overall represents a “light drinking” control group (Table 1). Light drinking is defined as approximately one drink per day (Abel, Kruger, & Friedl, 1998).
Image Acquisition
Each participant received a whole-head high resolution diffusion MR scan on a Siemens 1.5 Tesla Avanto System. 60 diffusion weighted images were acquired: repetition time (TR) = 7200 ms, echo time (TE) = 77 ms, 60 slices total, acquisition matrix = 128 × 128, field of view (FOV) = 256 mm2, slice thickness = 2 mm (for 2 mm3 isotropic voxels) with 0 mm gap, with a diffusion-sensitizing gradient (b-value) = 700 s/mm2. 10 T2 weighted images were acquired with one image, a “low b” image (b-value=0 s/mm2) as an anatomical reference volume. Total acquisition time for the diffusion MR scan was 8 minutes 31 seconds. Acquisitions used a twice-refocused balanced echo to reduce eddy current distortions (Reese, Heid, Weisskoff, & Wedeen, 2003).
Each participant also received two whole-brain high-resolution isotropic T1-weighted magnetization-prepared rapid gradient-echo (MPRAGE) scans with a 12-channel head coil; these were collected and averaged for each participant to create a single image volume with high contrast-to-noise (T1= 1000 ms, TR = 2.73 sec, TE = 3.31 ms, flip angle = 7°, slice thickness = 1.3 mm, 128 slices, FOV = 256×256 mm). These scans have been empirically optimized for high contrast between gray and WM, as well as gray matter and cerebrospinal fluid (CSF) for optimal structural and surface segmentation. Total acquisition time for the T1 scans was 20 minutes. Imaging of participants from each group was distributed across time with no overrepresentation of a particular group at any time during imaging.
Image Analysis & Preprocessing
Diffusion data were processed using a multistep procedure involving the FreeSurfer image analysis suite (http://surfer.nmr.mgh.harvard.edu/) and FSL (http://fsl.fmrib.ox.ac.uk/fsl/fslwiki/) processing streams. Diffusion volumes were eddy-current and motion-corrected using FSL’s Eddy Correct tool. Data were examined for artifacts at the time of imaging. Motion and eddy-current induced distortions were corrected using the affine procedures as part of FSL eddy_correct (http://fsl.fmrib.ox.ac.uk/fsl/fsl-4.1.9/fdt/fdt_eddy.html). We note that this procedure does not correct for the encoding vectors, however, this is expected to have minimal impact on scalar indices such as FA. Residual eddy current along the phase-encode direction may also affect the geometry and data values, but no group bias is expected in this effect.
A T2-weighted low b structural volume, collected using identical sequence parameters as the directional volumes with no diffusion-weighting and in register with the final diffusion maps was used for all registration and motion correction using a 12-parameter affine mutual information procedure in FMRIB’s Linear Image Registration Tool (FLIRT) (Jenkinson & Smith, 2001). The diffusion MR (six components; three eigenvectors and three eigenvalues) was calculated for each voxel using a least-squares fit to the diffusion signal (Pierpaoli & Basser, 1996), and brain-extracted using FSLs Brain Extraction Tool, which served as a brain-mask for all other diffusion maps. FA was derived from the 3D maps of the three eigenvalues in the diffusion tensor (Pierpaoli & Basser, 1996).
Voxel wise processing of the FA data was carried out using TBSS (Smith, et al., 2006), distributed as part of the FSL package. All participants’ FA data were aligned into a common space using the nonlinear registration tool FNIRT, which uses a b-spline representation of the registration warp field, resulting in all images transformed into 1mm isotropic, MNI152 standard space. The mean FA image was created by averaging all participants’ aligned FA volumes and thinned to create a mean FA skeleton representing the centers of all fiber tracts common to the entire sample. The mean skeleton was thresholded to only display voxels with FA values greater than 0.2 to avoid inclusion of regions that could be composed of multiple tissue types or fiber orientations. Each subject’s aligned, common-space FA data were then projected onto this skeleton to create a 4D skeletonized volume; this was then fed into voxel wise group statistics. Data along the skeleton were smoothed utilizing an anatomical constraint to limit the smoothing to neighboring data within adjacent voxels along the skeleton. Statistical maps were dilated from the TBSS skeleton for visualization purposes. For voxel-based cluster analyses, FA values were derived from each participant’s native space volume.
Analysis
Group assignment (ALC or NC) was compared with FA across the entire WM TBSS skeleton on a voxel-by-voxel basis using randomize, a voxelwise cross-subject statistical tool available in the TBSS pipeline (Smith, et al., 2006). Age was used as a covariate in these analyses (see Salat, et al., 2005). Individual FA images were warped onto the TBSS skeleton (see Image Analysis & Preprocessing) for examining voxel- wise correlations between group assignment and FA. Permutation testing was conducted using the TBSS “randomize” tool, which is specifically designed for permutation testing with nonparametric values. The number of permutations was set at 5000. Significance threshold was set at p < .05, corrected for multiple comparisons across voxels using the threshold-free cluster-enhancement option.
Atlas-based Clusters
Thirty-two clusters were generated based on significance maps of the relationship between group assignment and FA to provide a quantitative summary of significant regions within the voxel wise analysis (Table 2). Clusters were defined as regions of the WM skeleton that contained at least 300 adjacent significant voxels from the group difference analysis. The selection of a minimum of 300 adjacent significant voxels was arbitrary. Clusters were regions in which there was a significant association between group assignment and FA that were already corrected for multiple comparisons.
Table 2.
Thirty-two clusters were generated, based on significance maps of the relationship between group assignment (ALC or NC) and FA. Clusters were defined as regions of the WM skeleton that contained at least 300 adjacent significant voxels from the group difference analysis.
| WM CLUSTER | Total Voxels | Cluster Location |
|---|---|---|
| 32 | 296 | Left superior frontal gyrus |
| 25 | 1748 | Right superior and middle frontal gyrus |
| 27 | 532 | Right middle frontal gyrus |
| 10 | 1641 | Right inferior frontal gyrus |
| 18 | 1049 | Left inferior frontal gyrus (with superior longitudinal faciculus) |
| 20 | 411 | Right anterior limb of internal capsule |
| 31 | 452 | Left genu of the internal capsule |
| 19 | 1035 | Right inferior frontal fasiculous |
| 8 | 829 | Right external capsule and anterior corona radiata |
| 7 | 7980 | Left internal and external capsule (under superior frontal gyrus) |
| 21 | 443 | Anterior-superior corona radiata |
| 4 | 1381 | Left precentral gyrus |
| 6 | 436 | Left superior parietal lobe |
| 1 | 670 | Right supramarginal gyrus and angular gyrus |
| 5 | 2331 | Left supramarginal gyrus |
| 24 | 422 | Right supramarginal gyrus and superior longitudinal faciculus |
| 11 | 1304 | Right precuneus (with posterior cingulate) |
| 9 | 606 | Left precuneus |
| 13 | 1213 | Right posterior corona radiata (with thalamic radiation) |
| 26 | 337 | Right posterior superior corona radiata |
| 2 | 1437 | Left medial temporal lobe (primarily fornix) |
| 3 | 301 | Left middle temporal gyrus |
| 17 | 452 | Left inferior/middle temporal gyrus |
| 14 | 301 | Right fusiform |
| 22 | 303 | Left fusiform |
| 29 | 403 | Left ventral lateral nuclei of the thalamus |
| 30 | 1098 | Left posterior thalamic radiation |
| 12 | 788 | Right pons (including corticospinal tract, cerebellar peduncle) |
| 15 | 506 | Left pons (including corticospinal tract, cerebellar peduncle) |
| 23 | 392 | Right superior cerebellar WM |
| 28 | 613 | Middle cerebellar peduncle (medial to clusters 15, 16) |
| 16 | 324 | Right cerebellar peduncle |
Anatomical labeling of the clusters was based on the combination of two WM atlases: the Johns Hopkins University (JHU) WM atlas (FSL package) and the T1-based WM parcellations (FreeSurfer processing stream). The JHU atlas labels refer to deeper subcortical WM tracts, whereas the FreeSurfer WM segmentations provide labeling of WM regions closer to the cortical surface. The cluster-segmented mean skeleton was deprojected from TBSS standard space to each participant’s native space, using the inverse transform applied during the nonlinear registration of all subjects to the target (TBSS preprocessing) (Leritz, et al., 2013) to confirm cross-subject registration and obtain native space values for visualization in plots (for ease of visualization). Mean FA values for each cluster were then extracted from each participant’s native space map. TBSS is limited in its use of a central skeleton (which represents the centers of all tracts common to the group), but decreases the risk of partial voxel contamination.
RESULTS
Whole Brain Analysis
Group differences in FA across all areas of WM tissue registered to the TBSS skeleton were examined and revealed widespread, bilateral reductions in FA in ALC participants relative to the NC participants. The most pronounced effects were seen in frontal and superior tracts (underlying cingulate, frontal gyrus, and precentral areas). As shown in Figure 1, these included bilateral reductions in FA in the superior frontal gyrus, the IFG, the internal and external capsule, corona radiata, supramarginal gyrus, precuneus (with posterior cingulate), middle temporal gyrus, and cerebellum. Higher FA in ALC participants relative to the NC participants was observed bilaterally in the pons and in the left fusiform (not shown).
Figure 1.
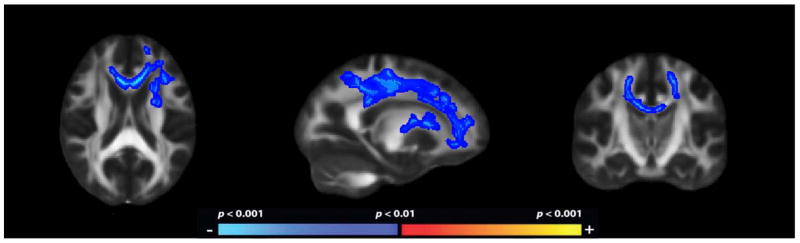
Fractional anistropy maps demonstrating decreased regional WM microstructure in ALC as compared to NC. The heat scale represents statistical p values as described in the figure color scale-bar. Reductions in FA in were bilateral and widespread throughout the cerebral WM.
Atlas-based Clusters
Thirty-two significant clusters from the whole-brain group comparison included frontal, temporal, parietal, and cerebellar WM tracts. The magnitude of the reduction in mean FA in ALC relative to NC ranged from .0146 to .0390 with a mean reduction across all clusters of .0186 and a median reduction of .0196. The mean effect size of the reduction in FA among the clusters was .497 and the median effect size was .503. Four representative clusters were selected based on size, location, and a priori hypotheses, and are presented in Figure 2. For each of these clusters, age-adjusted mean FA is plotted below (Figure 2).
Figure 2.

Thirty-two clusters were generated, based on significance maps of the relationship between group assignment (ALC or NC) and FA. Clusters were widespread and included frontal, temporal, parietal, and cerebellar WM tracts. Four representative clusters are shown. Bar graphs show mean age-adjusted FA values (residualized) for each group with standard error bars.
Exploratory Analyses
Effect of Gender on WM Microstructure
This sample included 33 men and 18 women. T-tests revealed that there was little effect of gender on FA in WM tissue within the clusters (ps > .05). In one cluster, mean FA was significantly lower in women (Left fusiform: mean FA men = .345; mean FA women = .317; p = .004), but did not survive the Bonferroni correction for multiple comparisons. Follow-up t-tests and equivalence tests were run within each group. In the ALC only, again one cluster showed mean FA significantly lower in women (Left fusiform: mean FA ALC men = .351; mean FA ALC women = .308; p = .001, which did survive the Bonferroni correction for multiple comparisons). Equivalence testing confirmed that male and female alcoholics were equivalent in all clusters (ps > .3), with the exception of the left fusiform (p < .001). This difference was not significant in the NC group (all clusters were equivalent, ps > .6), indicating that the difference was driven by the ALC group.
Inferior Frontal Gyrus
A number of exploratory, post-hoc analyses were conducted to examine WM microstructure adjacent to the IFG (Clusters 10 and 18) because these areas have been implicated in processes related to self-control, decision-making, response inhibition, and reward sensitivity. FA in the left IFG and the right IFG was significantly reduced in ALC as compared to NC (mean FA ALC left IFG = .439; mean FA NC left IFG = .466; mean FA ALC right IFG = .446; mean FA NC right IFG = .462; Table 2). Additionally, correlations between alcohol severity (6 variables of interest) and FA in the left and right IFG were examined across all participants (NC and ALC). FA in the IFG on the left was associated with severity of lifetime drinking, whereas FA in the right IFG showed only trends toward significance with severity of lifetime drinking. Specifically, SMAST score was negatively correlated with FA in the left IFG (p = .004; R2 = .158; r = −.398) and accounted 16% of the variance in FA in the left IFG. Years of abuse was negatively correlated with FA in the left IFG (p = .011; R2 = .124; r = −.352) and accounted for 12% of the variance in FA in the left IFG. FA in the left IFG also showed a negative trend with average drinks per drinking day (p = .061; R2 = .087; r = −.295). FA in the right IFG showed negative trends with SMAST score (p = .073; R2 = .064; r = −.253) and average drinks per drinking day (p = .061; R2 = .087; r = −.295).
In a final series of post hoc analyses we examined the effect of age on WM recovery. Median split was used to divide the ALC group into young (≤52 years) and old (> 52 years). Correlational analyses within the young and old ALC groups examining length of abstinence and FA in the left and right IFG were run. In the young ALC, length of abstinence was positively correlated with FA in the left IFG (r=.551, R2=.304, p=.027), indicating that in this cross-sectional sample, as length of abstinence increased, FA in the left IFG increased.
DISCUSSION
This study identified differences in WM associated with alcohol diagnosis by calculating group differences, first as function of WM tissue (FA) throughout the brain, followed by statistically guided, data-driven, region-by-region comparison. These analyses showed that ALC individuals have widespread, bilateral reductions in FA in WM tissue as compared to NCs.
Importantly, these effects demonstrate reduction in FA associated with alcohol diagnosis apart from the effects of age. Age-related global changes in mean FA values are typically of the magnitude of .03 (Salat, et al., 2005). In the current study, alcohol diagnosis was associated with regional reductions in FA of the magnitude of approximately .03 when age was entered as a covariate, indicating reductions beyond age-related effects. Effects were greatest in frontal and cerebellar clusters, consistent with preferential neuropathological effects of alcohol.
Regionally specific areas of significant difference between ALC and NC were examined. Clusters demonstrating a significant difference between the groups were widespread and included frontal, temporal, parietal, and cerebellar WM tracts. The regional distribution of differences suggests that the entire cerebrum is vulnerable to WM tissue degradation following chronic alcoholism, with most pronounced effects in the frontal and superior tracts (underlying cingulate, frontal gyrus, and precentral areas). These findings are consistent with previous WM investigations in humans (Chanraud, et al., 2007; De la Monte, 1988; Harper & Kril, 1985; Pfefferbaum, et al., 2009).
The current results suggest reduced FA in WM tracts that connect several cortical areas implicated in addiction (Makris, et al., 2008). The reward network encompasses mesocorticolimbic structures (e.g., dorsolateral-prefrontal, orbitofrontal, cingulate cortices, insula, amygdala, hippocampus, nucleus accumbens, and ventral diencephalon) and is associated with positive reinforcement (reward), memory, executive function, motivation, as well as self-control or inhibition (Goldstein & Volkow, 2011). Dysfunction of the reward network has been hypothesized to underlie the loss of control, poor choices, or disruption in inhibitory control central to alcohol and drug addiction (Goldstein & Volkow, 2011; Makris, et al., 2008; Volkow, Baler, & Goldstein, 2011). Disruption of this network in chronic alcoholism may represent failure of a ‘neural brake’ mechanism (Filevich, et al., 2012). In the case of alcoholism, higher order cognitive functions critical for behavioral control may be over-ridden or hijacked by the deregulated structures within the reward system.
Decreased FA throughout the frontostriatal circuits that mediate inhibitory control may result in impulsive behavior associated with alcoholism. As we and others have hypothesized, dysfunction in frontal systems may have behavioral consequences related to alcoholic relapse (Fortier, et al., 2008). Many of the cognitive and behavioral manifestations of frontal system dysfunction, such as over-learned behavioral patterns, difficulty in flexibly learning new patterns of behavior, and singular focus on reward-related cues/behaviors, may underlie and perpetuate alcoholics’ inability to maintain abstinence (Hyman, et al., 2006). This is specifically supported in the exploratory analyses in the present study suggesting a relationship between IFG FA and drinking severity.
ALCs demonstrated higher FA as compared to healthy NC participants in three of 32 clusters: left and right pons and left fusiform. Although not anticipated, the higher FA in bilateral pons in ALC may reflect compensatory regeneration of WM to support maintained abstinence. There is precedent for increased FA in neurologic conditions including alcohol use disorders (Cardenas, et al., 2013; Maksimovskiy, et al., 2013). The increase in FA is consistent with our prior findings of increased FA within the dorsolateral frontal-parietal region in a sample of younger Veteran alcoholics, hypothesized to serve a compensatory function (Maksimovskiy, et al., 2013). Importantly, we reported that the increase in FA was associated with a decrease in executive function (specifically, inhibition and switching speed).
Middleton and Strick (2001) demonstrated reciprocal connections between cerebellum and association cortices, suggesting anatomical connectivity supporting cerebellum’s role in higher cortical functions. Schmahmann and Pandya (1997) further described the feedforward limb of the cerebrocerebellar system directed largely through the corticopontine pathway connecting the cerebellum to prefrontal associative cortices. We have demonstrated distinct functional networks within the cerebellum using resting fMRI including cerebellar connectivity through the pons to the dorsolateral and medial prefrontal cortex and extensive inter-connectivity from the cerebellum to association cortex in frontal, temporal, parietal, and limbic system areas (Dobromyslin, et al., 2012). These data, among other neuroanatomical studies, show that the pons serves as a relay station in the feedforward loop of the cerebrocerebellar circuit, and it has been found to be adversely affected by alcohol abuse (Adams, 1959). Animal studies have demonstrated differential axonal regeneration of CNS neurons. It is possible that cholinergic neurons in the thalamus and the pons have a particular capacity for axonal regeneration (Van Leeuwen, et al., 1998). We hypothesize that given the sensitivity of the cerebellum and the pons to the adverse effects of alcohol, the increased FA in the ALC as compared to NC in the pons may represent neuroregeneration of WM due to its crucial role in the feedforward loop of the cerebrocerebellar circuit.
The associations between performance on cognitive tasks and regional WM microstructure in healthy younger and older adults has received much attention. In a comprehensive cross-sectional study, Bendlin demonstrated that age-related WM alterations underlie age-related declines in cognitive function (Bendlin, et al., 2010). Vascular health, which is affected by alcohol use, modifies age differences in WM microstructure and may drive the expansion of age-related WM damage from anterior to posterior regions (e.g., Salat, et al., 2005; Sullivan & Pfefferbaum, 2006). Hypertension may have the greatest impact on WM (Raz, et al., 2003). Effects of alcohol associated with FA in WM tissue in the current study are of similar magnitude to those associated with other vascular risk factors, such as hypertension (Salat, et al., 2012).
An intriguing finding is the apparent lateralization of the relationship between FA of WM tracts underlying the component structures of the IFG and indices of drinking severity. Although FA was significantly reduced in both left and right IFG (clusters 10 and 18) in alcoholics compared to control participants (see Table 2), it was the left IFG (cluster 18) that was more strongly associated with indices of drinking severity. This is interesting because structures of the dorsolateral prefrontal cortex, and in particular the IFG, have been implicated in processes related to self-control, decision-making, and reward sensitivity (Davidson & Irwin, 1999; Ravaja, et al., 2013). Specifically, there is the suggestion that approach-based decisions and withdrawal-based decisions may be lateralized to the left and right IFG, respectively. The importance of response inhibition and lateralization of reward-based decision making has been directly implicated in addictive behavior using functional neuroimaging paradigms (Goldstein & Volkow, 2011).
If correct, the current findings suggest that observed functional neuroimaging patterns of addiction may be accompanied by, or perhaps preceded by, degradation of the underlying structural systems related to reward based decision making and/or response inhibition at least with respect to WM microstructure. We further suggest our data on possible recovery of FA of the left IFG (increased FA) with maintained abstinence in young ALC support the idea that alcohol related reduction in FA may be reversible with abstinence, particularly when abstinence is achieved prior to the fifth decade. Regardless, the suggestion that the pattern of tissue damage associated with alcohol severity and tissue recovery may be lateralized, while the pattern of FA tissue integrity associated with alcohol diagnosis is not, raises the intriguing possibility that structural variations underlying the IFG that may predispose people to addiction may be genetically or congenitally determined, rather than a neurotoxic consequence of drinking itself. Converging data indicates that individuals at high risk for alcoholism may have a neurobiological vulnerability exemplified by behavior (impaired response inhibition), reduced neuronal efficiency, and reduced brain volumes in critical areas (which we and others hypothesize may critically involve the IFG) (e.g., Bechara, 2005; Silveri et al., 2011).
Gender was examined post-hoc within the clusters of significance. This sample included more men than women, but there were sufficient numbers for analysis. Overall, men and women showed equivalent mean FA values across the 31 of the 32 clusters. However, significantly lower FA values in the Left fusiform were observed in women (with a fairly strong effect size, r=.427). This effect was driven by the alcoholic group.
Limitations & Future Directions
First, this study is limited by its cross-sectional design. Data presented do not provide direct evidence of a temporal relationship between alcohol exposure and reduced FA. As a result the question remains regarding the etiology of the observed differences in FA in WM tissue. These differences may be attributable to premorbid vulnerability, to persisting neurotoxic effects of alcohol abuse, or to recovery of WM microstructure occurring during abstinence. Second, cigarette smoking status was collected retrospectively and was not available for all participants. Smoking is independently associated with brain abnormalities and may in fact exacerbate the effects of alcohol on brain structure, therefore not having complete data available for all participants is a limitation. Available data indicate similar rates of smokers and nonsmokers in experimental groups.
Future investigations should continue to quantify WM alterations related to alcohol and to relate brain changes to severity of alcoholism. WM microstructure should be related to measures of alcohol consumption across a variety of drinkers to investigate if quantity of alcohol consumed can predict brain changes. Recovery of WM tissue damage with maintained abstinence also warrants more attention in the literature.
Summary
These findings demonstrate widespread reduction in FA as a consequence of alcoholism in a sample of community dwelling abstinent alcoholics. The most pronounced effects were found in frontal and superior tracts. Decreased FA throughout the frontostriatal circuits that mediate inhibitory control may result in impulsive behavior, impairments in response inhibition, and inability to maintain sobriety.
Acknowledgments
This research was support by VA RR&D B9254-C, NIH NIAAA 14205, NIH AG08796, NIH NINR R01NR010827, NIH NIA K23AG034258, NINDS K23NS062148 and VA Merit Review Awards to Catherine Brawn Fortier and Regina McGlinchey.
References
- Adams A. Studies on the flat electroencephalogram in man. Electroencephalogr Clin Neurophysiol. 1959;11:35–41. doi: 10.1016/0013-4694(59)90005-7. [DOI] [PubMed] [Google Scholar]
- Abel EL, Kruger ML, Friedl J. How do physicians define “light,” “moderate,” and “heavy” drinking? Alcohol Clin Exp Res. 1998;22(5):979–984. doi: 10.1111/j.1530-0277.1998.tb03692.x. [DOI] [PubMed] [Google Scholar]
- Bendlin BB, Fitzgerald ME, Ries ML, Xu G, Kastman EK, Thiel BW, et al. White matter in aging and cognition: a cross-sectional study of microstructure in adults aged eighteen to eighty-three. Dev Neuropsychol. 2010;35(3):257–277. doi: 10.1080/87565641003696775. [DOI] [PMC free article] [PubMed] [Google Scholar]
- Brody AL, Mandelkern MA, Jarvik ME, Lee GS, Smith EC, Huang JC, et al. Differences between smokers and nonsmokers in regional gray matter volumes and densities. Biol Psychiatry. 2004;55(1):77–84. doi: 10.1016/s0006-3223(03)00610-3. [DOI] [PubMed] [Google Scholar]
- Chanraud S, Martelli C, Delain F, Kostogianni N, Douaud G, Aubin HJ, et al. Brain morphometry and cognitive performance in detoxified alcohol-dependents with preserved psychosocial functioning. Neuropsychopharmacology. 2007;32(2):429–438. doi: 10.1038/sj.npp.1301219. [DOI] [PubMed] [Google Scholar]
- Cardenas VA, Greenstein D, Fouche JP, Ferrett H, Cuzen N, Stein DJ, Fein G. Not lesser but Greater fractional anisotropy in adolescents with alcohol use disorders. Neuroimage Clin. 2013;2:804–809. doi: 10.1016/j.nicl.2013.06.002. [DOI] [PMC free article] [PubMed] [Google Scholar]
- Davidson RJ, Irwin W. The functional neuroanatomy of emotion and affective style. Trends Cogn Sci. 1999;3(1):11–21. doi: 10.1016/s1364-6613(98)01265-0. [DOI] [PubMed] [Google Scholar]
- De la Monte SM. Disproportionate atrophy of cerebral white matter in chronic alcoholics. Archives of Neurology. 1988;45:990–992. doi: 10.1001/archneur.1988.00520330076013. [DOI] [PubMed] [Google Scholar]
- Dobromyslin VI, Salat DH, Fortier CB, Leritz EC, Beckmann CF, Milberg WP, McGlinchey RE. Distinct Functional Networks Within the Cerebellum and their Relation to Cortical Systems Assessed With Independent Component Analysis. NeuroImage. 2012 doi: 10.1016/j.neuroimage.2012.01.139. [DOI] [PMC free article] [PubMed] [Google Scholar]
- Durazzo TC, Gazdzinski S, Banys P, Meyerhoff DJ. Cigarette smoking exacerbates chronic alcohol-induced brain damage: a preliminary metabolite imaging study. Alcohol Clin Exp Res. 2004;28(12):1849–1860. doi: 10.1097/01.alc.0000148112.92525.ac. [DOI] [PubMed] [Google Scholar]
- Filevich E, Kuhn S, Haggard P. Intentional inhibition in human action: the power of ‘no’. Neurosci Biobehav Rev. 2012;36(4):1107–1118. doi: 10.1016/j.neubiorev.2012.01.006. [DOI] [PubMed] [Google Scholar]
- Fortier CB, Leritz EC, Salat DH, Venne JR, Maksimovskiy AL, Williams V, et al. Reduced cortical thickness in abstinent alcoholics and association with alcoholic behavior. Alcohol Clin Exp Res. 2011;35(12):2193–2201. doi: 10.1111/j.1530-0277.2011.01576.x. [DOI] [PMC free article] [PubMed] [Google Scholar]
- Fortier CB, Steffen EM, Lafleche G, Venne JR, Disterhoft JF, McGlinchey RE. Delay discrimination and reversal eyeblink classical conditioning in abstinent chronic alcoholics. Neuropsychology. 2008;22(2):196–208. doi: 10.1037/0894-4105.22.2.196. [DOI] [PMC free article] [PubMed] [Google Scholar]
- Gazdzinski S, Durazzo TC, Studholme C, Song E, Banys P, Meyerhoff DJ. Quantitative brain MRI in alcohol dependence: preliminary evidence for effects of concurrent chronic cigarette smoking on regional brain volumes. Alcohol Clin Exp Res. 2005;29(8):1484–1495. doi: 10.1097/01.alc.0000175018.72488.61. [DOI] [PubMed] [Google Scholar]
- Goldstein RZ, Volkow ND. Dysfunction of the prefrontal cortex in addiction: neuroimaging findings and clinical implications. Nat Rev Neurosci. 2011;12(11):652–669. doi: 10.1038/nrn3119. [DOI] [PMC free article] [PubMed] [Google Scholar]
- Hansen LA, Natelson BH, Lemere C, Niemann W, De Teresa R, Regan TJ, et al. Alcohol-induced brain changes in dogs. Arch Neurol. 1991;48(9):939–942. doi: 10.1001/archneur.1991.00530210065025. [DOI] [PubMed] [Google Scholar]
- Harper C, Kril J. Brain atrophy in chronic alcoholic patients: A quantitative pathological study. Journal of Neurology, Neurosurgery, and Psychiatry. 1985;48:211–217. doi: 10.1136/jnnp.48.3.211. [DOI] [PMC free article] [PubMed] [Google Scholar]
- Harper C, Matsumoto I. Ethanol and brain damage. Curr Opin Pharmacol. 2005;5(1):73–78. doi: 10.1016/j.coph.2004.06.011. [DOI] [PubMed] [Google Scholar]
- He J, Crews FT. Increased MCP-1 and microglia in various regions of the human alcoholic brain. Experimental Neurology. 2008;210:349–358. doi: 10.1016/j.expneurol.2007.11.017. [DOI] [PMC free article] [PubMed] [Google Scholar]
- Hyman SE, Malenka RC, Nestler EJ. Neural mechanisms of addiction: the role of reward-related learning and memory. Annu Rev Neurosci. 2006;29:565–598. doi: 10.1146/annurev.neuro.29.051605.113009. [DOI] [PubMed] [Google Scholar]
- Jenkinson M, Smith S. A global optimization method for robust affine registration of brain images. Med Image Anal. 2001;5:143–156. doi: 10.1016/s1361-8415(01)00036-6. [DOI] [PubMed] [Google Scholar]
- Jones DK, Knösche TR, Turner R. White matter integrity, fiber count, and other fallacies: the do’s and don’ts of diffusion MRI. NeuroImage. 2013;73:239–254. doi: 10.1016/j.neuroimage.2012.06.081. [DOI] [PubMed] [Google Scholar]
- Kennedy KM, Raz N. Pattern of normal age-related regional differences in white matter microstructure is modified by vascular risk. Brain Res. 2009;1297:41–56. doi: 10.1016/j.brainres.2009.08.058. [DOI] [PMC free article] [PubMed] [Google Scholar]
- Kril JJ, Halliday GM, Svoboda MD, Cartwright H. The cerebral cortex is damaged in chronic alcoholics. Neuroscience. 1997;79:983–998. doi: 10.1016/s0306-4522(97)00083-3. [DOI] [PubMed] [Google Scholar]
- Leritz EC, Shepel J, Williams VJ, Lipsitz LA, McGlinchey RE, Milberg WP, et al. Associations between T(1) white matter lesion volume and regional white matter microstructure in aging. Hum Brain Mapp. 2013 doi: 10.1002/hbm.22236. [DOI] [PMC free article] [PubMed] [Google Scholar]
- Lewohl JM, Wang L, Miles MF, Zhang L, Dodd PR, Harris RA. Gene expression in human alcoholism: microarray analysis of frontal cortex. Alcohol Clin Exp Res. 2000;24(12):1873–1882. [PubMed] [Google Scholar]
- Makris N, Oscar-Berman M, Jaffin SK, Hodge SM, Kennedy DN, Caviness VS, et al. Decreased volume of the brain reward system in alcoholism. Biol Psychiatry. 2008;64(3):192–202. doi: 10.1016/j.biopsych.2008.01.018. [DOI] [PMC free article] [PubMed] [Google Scholar]
- Maksimovskiy AL, McGlinchey RE, Fortier CB, Salat D, Milberg WP, Oscar-Berman M. White Matter and Cognitive Changes in Veterans Diagnosed with Alcoholism and PTSD. J Alcoholism Drug Depend. 2013;2:144. doi: 10.4172/2329-6488.1000144. [DOI] [PMC free article] [PubMed] [Google Scholar]
- Middleton FA, Strick PL. Cerebellar projections to the prefrontal cortex of the primate. J Neurosci. 2001;21:700–712. doi: 10.1523/JNEUROSCI.21-02-00700.2001. [DOI] [PMC free article] [PubMed] [Google Scholar]
- Oscar-Berman M. Neuropsychological vulnerabilities in chronic alcoholism. In: Nororha A, Eckardt M, Warren K, editors. Review of NIAAA’s Neuroscience and Behavioral Research Portfolio. Bethesda, MD: National Institute on Alcohol Abuse and Alcoholism Research Monograph No. 34; 2000. pp. 437–471. [Google Scholar]
- Pfefferbaum A, Adalsteinsson E, Sood R, Mayer D, Bell R, McBride W, et al. Longitudinal brain magnetic resonance imaging study of the alcohol-preferring rat. Part II: effects of voluntary chronic alcohol consumption. Alcohol Clin Exp Res. 2006;30(7):1248–1261. doi: 10.1111/j.1530-0277.2006.00146.x. [DOI] [PubMed] [Google Scholar]
- Pfefferbaum A, Rosenbloom M, Rohlfing T, Sullivan EV. Degradation of association and projection white matter systems in alcoholism detected with quantitative fiber tracking. Biol Psychiatry. 2009;65(8):680–690. doi: 10.1016/j.biopsych.2008.10.039. [DOI] [PMC free article] [PubMed] [Google Scholar]
- Pfefferbaum A, Rosenbloom MJ, Fama R, Sassoon SA, Sullivan EV. Transcallosal white matter degradation detected with quantitative fiber tracking in alcoholic men and women: selective relations to dissociable functions. Alcohol Clin Exp Res. 2010;34(7):1201–1211. doi: 10.1111/j.1530-0277.2010.01197.x. [DOI] [PMC free article] [PubMed] [Google Scholar]
- Pfefferbaum A, Sullivan EV. Microstructural but not macrostructural disruption of white matter in women with chronic alcoholism. Neuroimage. 2002;15:708–718. doi: 10.1006/nimg.2001.1018. [DOI] [PubMed] [Google Scholar]
- Pfefferbaum A, Sullivan EV. Disruption of brain white matter microstructure by excessive intracellular and extracellular fluid in alcoholism: evidence from diffusion tensor imaging. Neuropsychopharmacology. 2005;30(2):423–432. doi: 10.1038/sj.npp.1300623. [DOI] [PubMed] [Google Scholar]
- Pfefferbaum A, Sullivan EV, Hedehus M, Adalsteinsson E, Lim KO, Moselesy M. In vivo detection and functional correlates of white matter microstructural disruption in chronic alcoholism. Alcoholism: Clinical and Experimental Research. 2000;24(8):1214–1221. [PubMed] [Google Scholar]
- Pierpaoli C, Basser PJ. Toward a quantitative assessment of diffusion anisotropy. Magnetic Resonance Medicine. 1996;36:893–906. doi: 10.1002/mrm.1910360612. [DOI] [PubMed] [Google Scholar]
- Ravaja N, Somervuori O, Salminen M. Predicting purchase decision: The role of hemispheric asymmetry over the frontal cortex. Journal of Neuroscience, Psychology, and Economics. 2013;6(1):1–13. [Google Scholar]
- Raz N, Rodrigue KM, Acker JD. Hypertension and the brain: vulnerability of the prefrontal regions and executive functions. Behav Neurosci. 2003;117(6):1169–1180. doi: 10.1037/0735-7044.117.6.1169. [DOI] [PubMed] [Google Scholar]
- Reese TG, Heid O, Weisskoff RM, Wedeen VJ. Reduction of eddy-current-induced distortion in diffusion MRI using a twice-refocused spin echo. Magn Reson Med. 2003;49(1):177–182. doi: 10.1002/mrm.10308. [DOI] [PubMed] [Google Scholar]
- Robins LN, Marcus L, Reich W, Cunningham R, Gallagher T. Diagnostic Interview Schedule, Version IV. St. Louis, MO: Department of Psychiatry, Washington University School of Medicine; 1996. [Google Scholar]
- Romberger DJ, Grant K. Alcohol consumption and smoking status: the role of smoking cessation. Biomed Pharmacother. 2004;58(2):77–83. doi: 10.1016/j.biopha.2003.12.002. [DOI] [PubMed] [Google Scholar]
- Room R. Smoking and drinking as complementary behaviours. Biomed Pharmacother. 2004;58(2):111–115. doi: 10.1016/j.biopha.2003.12.003. [DOI] [PubMed] [Google Scholar]
- Salat DH, Tuch DS, Greve DN, van der Kouwe AJ, Hevelone ND, Zaleta AK, et al. Age-related alterations in white matter microstructure measured by diffusion tensor imaging. Neurobiol Aging. 2005;26(8):1215–1227. doi: 10.1016/j.neurobiolaging.2004.09.017. [DOI] [PubMed] [Google Scholar]
- Salat DH, Williams VJ, Leritz EC, Schnyer DM, Rudolph JL, Lipsitz LA, et al. Inter-individual variation in blood pressure is associated with regional white matter integrity in generally healthy older adults. Neuroimage. 2012;59(1):181–192. doi: 10.1016/j.neuroimage.2011.07.033. [DOI] [PMC free article] [PubMed] [Google Scholar]
- Schmahmann JD, Pandya DN. The cerebrocerebellar system. Int Rev Neurobiol. 1997;41:31–60. doi: 10.1016/s0074-7742(08)60346-3. [DOI] [PubMed] [Google Scholar]
- Selzer ML, Vinokur A, van Rooijen L. A self-administered short Michigan Alcoholism Screening Test (SMAST) Journal of Studies on Alcohol. 1975;36(2):117–126. doi: 10.15288/jsa.1975.36.117. [DOI] [PubMed] [Google Scholar]
- Skinner HA, Sheu WJ. Reliability of alcohol use indices: The Lifetime Drinking History and the MAST. Journal of Studies on Alcohol. 1982;43:1157–1170. doi: 10.15288/jsa.1982.43.1157. [DOI] [PubMed] [Google Scholar]
- Smith SM, Jenkinson M, Johansen-Berg H, Rueckert D, Nichols TE, Mackay CE, et al. Tract-based spatial statistics: voxelwise analysis of multi-subject diffusion data. Neuroimage. 2006;31(4):1487–1505. doi: 10.1016/j.neuroimage.2006.02.024. [DOI] [PubMed] [Google Scholar]
- Sullivan EV, Deshmukh A, Desmond JE, Lim KO, Pfefferbaumm A. Regional cerebellar volume decline in normal aging, uncomplicated alcoholism, and Korsakoff’s Syndrome. Neuropsychology. 2000;14:341–352. doi: 10.1037//0894-4105.14.3.341. [DOI] [PubMed] [Google Scholar]
- Sullivan EV, Pfefferbaum A. Diffusion tensor imaging and aging. Neurosci Biobehav Rev. 2006;30(6):749–761. doi: 10.1016/j.neubiorev.2006.06.002. [DOI] [PubMed] [Google Scholar]
- Van Leeuwen FW, Salehi A, Giger RJ, Holtmaat AJ, Verhaagen J. Progress in Brain Research. Vol. 117. Elsevier; Amsterdam: 1998. Neuronal Degeneration and Regeneration: From Basic Mechanisms to Prospects for Therapy. [PubMed] [Google Scholar]
- Volkow ND, Baler RD, Goldstein RZ. Addiction: pulling at the neural threads of social behaviors. Neuron. 2011;69(4):599–602. doi: 10.1016/j.neuron.2011.01.027. [DOI] [PMC free article] [PubMed] [Google Scholar]
- Wechsler D. Manual for the Wechsler Adult Intelligence Scale-III. San Antonio, TX: Psychological Corporation; 1997. [Google Scholar]
- Wechsler D. Wechsler Test of Adult Reading. San Antonio, TX: Psychological Corporation; 2001. [Google Scholar]