

Abstract
Severe infection, including sepsis, is an increasing clinical problem that causes prolonged morbidity and substantial mortality. At present, antibiotics are essentially the only pharmacological treatment for sepsis. The incidence of resistance to antibiotics is increasing; therefore, it is critical to find new therapies for sepsis. Staphylococcus aureus is a major cause of septic mortality. Neutrophils play an important role in the defense against bacterial infections. We have shown that a diet with high levels of dietary saturated fatty acids decreases survival in septic mice, but the mechanisms behind this remain elusive. The aim of the present study was to investigate how the differences in dietary fat composition affect survival and bacterial load after experimental septic infection and neutrophil function in uninfected mice. We found that, after S. aureus infection, mice fed a polyunsaturated high-fat diet (HFD-P) for 8 weeks had increased survival and decreased bacterial load during sepsis compared with mice fed a saturated high-fat diet (HFD-S), similar to mice fed a low-fat diet (LFD). Uninfected mice fed HFD-P had a higher frequency of neutrophils in bone marrow than mice fed HFD-S. In addition, mice fed HFD-P had a higher frequency of neutrophils recruited to the site of inflammation in response to peritoneal injection of thioglycolate than mice fed HFD-S. Differences between the proportion of dietary protein and carbohydrate did not affect septic survival at all. In conclusion, polyunsaturated dietary fat increased both survival and efficiency of bacterial clearance during septic S. aureus infection. Moreover, this diet increased the frequency and chemotaxis of neutrophils, key components of the immune response to S. aureus infections.
INTRODUCTION
Sepsis is often a deadly disease, and survival frequently is associated with severe complications. Sepsis has been divided into sepsis, severe sepsis, and septic shock (1). The mortality rate for severe sepsis is 25 to 30% and for septic shock is 40 to 70% (2). The incidence of sepsis, especially the form caused by the Gram-positive bacterium Staphylococcus aureus, is increasing worldwide (3). The administration of antibiotics presently is one of the very few ways to pharmacologically treat septic patients (4). However, antibiotic resistance is increasing and is a great challenge to health care in general (5, 6). Treatment of S. aureus infections has been hampered by the occurrence of methicillin-resistant S. aureus (MRSA) strains, which are becoming increasingly resistant to multiple antibiotics. Sepsis has been considered a hyperinflammatory disease in which the early phase is dominated by proinflammatory cytokines, such as interleukin-1β (IL-1β), IL-6, and tumor necrosis factor alpha (TNF-α) (7). Therefore, a large effort has been put into finding an anti-inflammatory treatment for sepsis. However, numerous large-scale anti-inflammatory treatment trials have failed (8, 9). Because of these setbacks, a new explanatory model has been proposed with an initial hyperinflammatory state followed by a later hypoimmune state (2, 4, 9, 10). It is during the hypoimmune state that patients often die, and during that time it may be of value to stimulate immune function. A better understanding of the different stages of sepsis might lead to treatments of sepsis focused on modulating the host function, in addition to killing bacteria with antibiotics.
Neutrophils are the first immune cells that arrive at the site of inflammation (11). They have the capacity to engulf large numbers of bacteria but also can create tissue damage in the host if too active (12). Neutrophils are important for defense against S. aureus infections. They are attracted to sites of infection by proinflammatory cytokines, such as TNF-α, IL-1, and IL-6, as well as by chemokines binding to the chemokine receptor CXCR2 (13).
There are several studies indicating that the dietary fat composition substantially influences biological functions and health. Changes in the distribution between saturated and unsaturated dietary fatty acids especially seem to be of importance for cardiovascular and metabolic disease (14, 15). Dietary fats also may be of importance for the immune defense against infections. We have previously observed that mice fed a saturated high-fat diet (HFD-S) have decreased survival when subjected to septic S. aureus infection compared with mice fed a low-fat diet (LFD) (16). Moreover, mice fed HFD-S displayed increased bacterial load, suggesting that their immune system has an impaired capacity to prevent bacterial survival and replication compared with that of mice fed LFD (16). In the present study, we aimed to compare how polyunsaturated and saturated dietary fats affect survival and immune response in sepsis. We also investigated how dietary fats affect the frequency and function of neutrophils, key cells in the defense against sepsis and S. aureus infections.
MATERIALS AND METHODS
Experimental protocol.
The experimental design is shown in Fig. 1. Six-week-old male C57BL/6 mice were obtained from Harlan Netherlands B.V. (Horst, The Netherlands). The mice were housed at the animal facility at the Laboratory for Experimental Biomedicine, University of Gothenburg, Gothenburg, Sweden, under standard conditions of light and temperature. Water and food were provided ad libitum. The regional ethical committee at Gothenburg University approved the experiments before the studies started. Starting at the age of 7 weeks, the mice were fed LFD, HFD-S, or polyunsaturated high-fat diet (HFD-P) for 8 weeks. At 14 to 15 weeks of age, the mice were terminated for measurements of immune functions, using flow cytometry or microarray analysis, or intravenously (i.v.) inoculated with S. aureus. Infected mice were terminated on day 6 after i.v. inoculation for analysis of bacterial load or on day 17 at the end of survival experiments. Survival was monitored daily during survival and the bacterial load experiment.
FIG 1.

Experimental design. Seven-week-old mice were randomized into one of the different diet groups. After 8 weeks on the diets, in week 15, mice were i.v. inoculated with S. aureus, intraperitoneally (i.p.) injected with thioglycolate for peritoneal lavage, or terminated for collection of bone marrow and blood for flow cytometry analysis. Mice i.v. inoculated with S. aureus were either terminated after 6 days for bacterial load analysis or monitored continuously up to 17 days for survival analysis. Mice injected with thioglycolate were terminated after 4 h, and the peritoneal lavage fluid was analyzed. Experimental group abbreviations were the following: LFD, low-fat diet; HFD-S, saturated high-fat diet; HFD-P, polyunsaturated high fat diet; HP/C - HFD-S, high protein-to-carbohydrate ratio and saturated high-fat diet; LP/C - HFD-S, low protein-to-carbohydrate ratio and saturated high-fat diet; HP/C - HFD-P, high protein-to-carbohydrate ratio and polyunsaturated high-fat diet; and LP/C - HFD-P, low protein-to-carbohydrate ratio and polyunsaturated high-fat diet.
In a follow-up study, four other diets were used for 8 weeks. These diets were designed to investigate if the ratio between protein and carbohydrate influenced survival when fat source and quantity were kept constant. The new diets included HFD-S with a high protein-to-carbohydrate ratio (HP/C HFD-S; 30% protein, 10% carbohydrate), HFD-S with a low protein-to-carbohydrate ratio (LP/C HFD-S; 10% protein, 30% carbohydrate), HFD-P with a high protein-to-carbohydrate ratio (HP/C HFD-P; 30% protein, 10% carbohydrate), and HFD-P with a low protein-to-carbohydrate ratio (LP/C HFD-P; 10% protein, 30% carbohydrate). These diets were fed by following the same protocol as that for the previous diets. At 15 weeks of age, the mice were i.v. inoculated with S. aureus and survival was monitored daily until day 17 after inoculation, when the survival experiment was terminated.
Diets.
Mice were randomly divided into groups, which received one of the following diets: LFD (D12450B; 3.9 kcal/g, 10 kcal% fat, 20 kcal% protein, 70 kcal% carbohydrate; Research Diets, New Brunswick, NJ, USA), HFD-S (D12492; 5.2 kcal/g, 60 kcal% fat, 20 kcal% protein, 20 kcal% carbohydrate; Research Diets), and HFD-P (D09020505; same composition as HFD-S of fat, protein, and carbohydrate, but 69% of the lard was exchanged for menhaden oil; Research Diets). The diets were matched to have similar contents except for fat composition. The composition of the diets is shown in Table 1.
TABLE 1.
Energy density and composition of experimental diets: saturated and polyunsaturated diets
| Parametera | Value for each diet |
||
|---|---|---|---|
| LFD | HFD-S | HFD-P | |
| Energy density (kcal/g) | 3.9 | 5.2 | 5.2 |
| Macronutrients (% kcal) | |||
| Protein | 20 | 20 | 20 |
| Carbohydrate | 70 | 20 | 20 |
| Fat | 10 | 60 | 60 |
| Fat source (% of total fat) | |||
| Soybean oil | 55.6 | 9.3 | 9.3 |
| Lard | 44.4 | 90.7 | 27.8 |
| Menhaden oil | 63.0 | ||
| Fatty acids (% by wt of total fatty acids) | |||
| ∑ SFA | 22.7 | 32.0 | 28.7 |
| ∑ MUFA | 29.8 | 36.0 | 27.5 |
| ∑ PUFA | 47.5 | 32.0 | 43.9 |
| ∑ ω-3 total fat | 5.2 | 2.1 | 25.6 |
| ∑ ω-6 total fat | 42.4 | 29.9 | 16.2 |
| ω-6/ω-3 | 8.2 | 14.1 | 0.6 |
SFA, saturated fatty acids; MUFA, monounsaturated fatty acids; PUFA, polyunsaturated fatty acids; ω-3, omega 3 fatty acids; ω-6, fatty acids.
For the experiment investigating the effect of different protein and carbohydrate distributions, groups of mice were fed either 30 kcal% protein and 10 kcal% carbohydrate or 10 kcal% protein and 30 kcal% carbohydrate for 8 weeks. These two diets were combined with either 60 kcal% saturated dietary fat (HP/C HFD-S [D13091403] and LP/C HFD-S [D13091404]; Research Diet) or 60 kcal% polyunsaturated fat (HP/C HFD-P [D13091405] and LP/C HFD-P [D13091406]; Research Diet). The composition of these diets is shown in Table 2.
TABLE 2.
Energy density and composition of experimental diets: protein and carbohydrate diets
| Parametera | Value for each diet |
|||
|---|---|---|---|---|
| HP/C HFD-S | LP/C HFD-S | HP/C HFD-P | LP/C HFD-P | |
| Energy density (kcal/g) | 5.2 | 5.2 | 5.2 | 5.2 |
| Macronutrients (% kcal) | ||||
| Protein | 30 | 10 | 30 | 10 |
| Carbohydrate | 10 | 30 | 10 | 30 |
| Fat | 60 | 60 | 60 | 60 |
| Fat source (% of total fat) | ||||
| Soybean oil | 9.3 | 9.3 | 9.3 | 9.3 |
| Lard | 90.7 | 90.7 | 27.8 | 27.8 |
| Menhaden oil | 63.0 | 63.0 | ||
| Fatty acids (% by wt of total fatty acids) | ||||
| ∑ SFA | 32.0 | 32.0 | 28.7 | 28.7 |
| ∑ MUFA | 36.0 | 36.0 | 27.5 | 27.5 |
| ∑ PUFA | 32.0 | 32.0 | 43.9 | 43.9 |
| ∑ ω-3 total fat | 2.1 | 2.1 | 25.6 | 25.6 |
| ∑ ω-6 total fat | 29.9 | 29.9 | 16.2 | 16.2 |
| ω-6/ω-3 | 14.1 | 14.1 | 0.6 | 0.6 |
SFA, saturated fatty acids; MUFA, monounsaturated fatty acids; PUFA, polyunsaturated fatty acids; ω-3, omega 3 fatty acids; ω-6, fatty acids.
Bacterial inoculation, survival, and bacterial load.
Mice were infected i.v. in the tail vein with 0.2 ml S. aureus LS-1 solution containing 3.8 × 10⁷ to 4.5 × 10⁷ CFU, as previously described (16). For bacterial load determination, the mice were killed 6 days after i.v. inoculation, and both kidneys were harvested aseptically, homogenized, and diluted in phosphate-buffered saline (PBS) to the appropriate concentration. One hundred μl of each diluted sample then was dispensed onto horse-blood-agar plates that were incubated at 37°C for 24 h before the bacterial colonies were counted. In the survival experiment, the mice were monitored and examined for signs of severe sickness (motionless, isolation, piloerection, dehydration, and hypothermia) after i.v. inoculation. When a mouse showed three or more out of these five signs, the mouse was euthanized and considered dead in sepsis.
Body weight and body composition.
Body weight was monitored from the start of diets and every second week until inoculation. Fat and lean body mass were analyzed 3 days before inoculation by dual-energy X-ray absorptiometry (PIXImus2; Lunar GE Medical Systems, Madison, WI, USA). The mice were under inhalation anesthesia with isoflurane (Forene; Abbot Scandinavia, Solna, Sweden) during the measurement.
Flow cytometry. (i) Collection of bone marrow and blood.
Uninfected mice were anesthetized before the blood was collected transcardially into EDTA tubes prior to perfusion with saline at a pressure of 100 mm Hg for 10 min. Bone marrow cells were harvested from femur and tibia and stored in PBS. Both blood and bone marrow samples were kept on ice until preparation.
(ii) Collection of peritoneal lavage fluid.
Uninfected mice used for peritoneal lavage were injected with 1 ml of 4% brewer thioglycolate medium (SigmaAldrich, St. Louis, MO, USA) into the peritoneal cavity to induce local inflammation. Four hours after injection, the mice were anesthetized with isoflurane (Abbot Scandinavia) and killed by cervical dislocation. Five ml of cold PBS was injected into the peritoneal cavity, and an abdominal massage was performed for 1 min. The PBS was recollected and the process was repeated twice for a total peritoneal lavage fluid volume of 15 ml. The samples were kept on ice until preparation.
(iii) Preparation and staining.
The cell suspensions of bone marrow and peritoneal lavage fluid were centrifuged, and the supernatant was discarded. Pharm Lyse (BD Biosciences, Franklin Lakes, NJ, USA) was added to all samples and incubated for 6 min on ice to lyse the red blood cells. After washing, the samples were resuspended in PBS. The cell concentration was determined with an automated cell counter (Bio-Rad, Hercules, CA, USA), and 3 × 10⁵ cells from each sample were transferred to fluorescent-activated cell sorter (FACS) tubes. To avoid unspecific binding via Fc-receptor interactions, cells were incubated with Fc block (2.4G2; BD Bioscience, Franklin Lakes, NJ, USA) for 15 min at room temperature. Cells were labeled with the following antibodies: anti-mouse Ly6G-fluorescein isothiocyanate (FITC) (clone 1A8; BD Bioscience), anti-mouse marker CD115-allophycocyanin (APC) (clone AFS98; BioLegend, San Diego, CA, USA), anti-mouse CD117-phycoerythrin (PE) (clone 2B8; BioLegend), and 7-amino-actinomycin D (7AAD; BD Bioscience) for detection of live/dead cells. Cells were examined using a FACSCanto flow cytometer (BD Bioscience). Compensation was performed using Comp-Beads (BD Bioscience), and data analyses were performed using FACSDiva software (version 6.1.3; BD Bioscience). Analysis was started with a leukocyte gate and thereafter with a live gate using 7AAD. Neutrophils then were identified as Ly6G+ CD115− (17), precursor cells as CD117+ (18), and monocytes as CD115+ (19). Results from flow cytometry are presented as the frequency of living leukocytes. The gating strategy for bone marrow is shown in Fig. 4A, and the same strategy was applied for blood and peritoneal lavage fluid, except for CD117, which was not analyzed for blood and peritoneal lavage fluid.
FIG 4.

HFD-P increased the frequency of neutrophils in bone marrow and peritoneal lavage fluid. (A) Gating strategy for neutrophils, monocytes, and precursor cells in bone marrow from uninfected mice. The same strategy was used in blood except for precursor cells. SSC, side scatter; FSC, forward scatter. (B) Frequency of neutrophils in bone marrow from uninfected mice, n = 18 to 20 mice per group. (C) Frequency of neutrophils in blood from uninfected mice, n = 39 to 40 mice per group. (D) Frequency of monocytes in bone marrow from uninfected mice, n = 10 mice per group. (E) Frequency of neutrophils in peritoneal lavage fluid 4 h after thioglycolate injection from uninfected mice, n = 6 to 10 mice per group. Data in panels B, D, and E and in panel C were pooled from 2 and 3 experiments, respectively, of uninfected mice after 8 weeks on different diets and compared using two-way ANOVA, with experiment as a nuisance factor. Data are shown as estimated marginal means ± SEM (B, D, and E) and as geometrical means ± SEM (due to skewed distribution, analysis was done on log data and results back transformed) (C). **, P < 0.01; ***, P < 0.001.
Microarray analysis and data acquisition.
Bone marrow cells were harvested from femur and tibia by flushing the bones with RNAlater (Life Technologies). The samples were left in the refrigerator overnight, as recommended by the company, centrifuged, and kept frozen until the analysis. RNA was isolated using the RNeasy lipid tissue kit (Qiagen Nordic, Sollentuna, Sweden), and RNA quantity and quality were assessed by NanoDrop (Thermo Scientific, Gothenburg, Sweden) and Bioanalyzer (Agilent Technologies, Kista, Sweden) instruments, respectively. Two hundred ng high-quality RNA of each sample was prepared and hybridized to Affymetrix mouse gene 1.0 ST arrays according to Affymetrix's recommended protocol. Hybridization and analysis were performed according to the manufacturer's instructions at the SCIBLU Genomics core facility (Swegene Centre for Integrative Biology at Lund University, Lund, Sweden).
Statistical analysis.
Survival was illustrated with Kaplan-Meier curves and analyzed using a log-rank test. Bacterial load was analyzed using the nonparametric Kruskal-Wallis test followed by a Mann-Whitney test. Because the values for some of the samples were set to zero, nonparametric tests were used; therefore, no measure of the spread of data for bacterial load is presented. These data are presented as scatter plots with a line indicating the median. Body weight and body composition were analyzed using analysis of variance (ANOVA) followed by Tukey's post hoc test. When Levene's test revealed unequal variance, Dunnett's T3 post hoc test was used for comparisons of numeric data between the three experimental groups, and data were expressed as means ± standard errors of the means (SEM). For flow cytometry analysis, experiments were pooled from different experiments and experimental days, and two-way ANOVA, with experiment as a nuisance factor, was used. Logarithmic transformations were used when appropriate to ensure normal distribution of data. Data from flow cytometry analysis were expressed as estimated marginal means ± SEM for all graphs except for blood, where data were expressed as geometric means ± SEM. For microarray analysis, all raw intensity files (.CEL) were normalized and processed together using probe logarithmic intensity error (PLIER) with an iterative algorithm, and quintile normalization was chosen to estimate the expression signal. Differential gene expressions based on three different comparisons, i.e., HFD-P versus LFD, HFD-P versus HFD-S, and LFD versus HFD-S, were evaluated using a moderate Student's t test (20). The calculated P values were transformed into Q values by correcting for multiple testing using methods described by Benjamini et al. (21). Differences in n are due to laboratory errors or lack of sample material. All tests are two sided. P < 0.05 was considered significant. SPSS software (version 18.0.2 for Windows; IBM Corporation, Armonk, NY, USA) was used for statistical analysis.
Transcriptome data accession number.
All of the transcriptome data are available at the Gene Expression Omnibus (GEO) under accession number GSE58358.
RESULTS
Mice fed HFD-P had increased survival and decreased bacterial load compared with mice fed HFD-S.
Mice fed HFD-P or LFD for 8 weeks had an increased level of survival after i.v. inoculation with S. aureus compared to that of mice fed HFD-S (P < 0.001 and P = 0.02, respectively). There was no difference in survival between mice fed LFD and HFD-P (Fig. 2A). Bacterial load 6 days after i.v. inoculation mirrored the survival data, as mice fed HFD-S for 8 weeks had a 3.5-fold higher bacterial load than mice fed LFD (P = 0.03) and 5.7-fold higher bacterial load than mice fed HFD-P (P = 0.004). There was no difference in bacterial load between mice fed LFD and HFD-P (Fig. 2B).
FIG 2.

HFD-P increased survival and decreased bacterial load. (A) Survival after 8 weeks on different diets at 0 to 17 days after S. aureus i.v. inoculation. Data were analyzed by log-rank test, with n = 20 mice per group. (B) Bacterial load in kidneys after 8 weeks on diet and 6 days after S. aureus i.v. inoculation. Data were analyzed by Kruskal-Wallis test (global P = 0.02) followed by Mann-Whitney test, with n = 10 mice per group. Data are presented as scatter plots with the line indicating the median. *, P < 0.05; **, P < 0.01; ***, P < 0.001.
After 8 weeks on experimental diets, mice fed HFD-S had 57% higher body weight (P < 0.001) and 3-fold higher fat mass (P < 0.001) than mice fed LFD, while mice fed HFD-P had 26% higher body weight (P < 0.001) and 2-fold higher fat mass (P < 0.001) than mice fed LFD. Mice fed HFD-P had significantly lower body weight (P < 0.001) and lower fat mass (P < 0.001) than mice fed HFD-S. The lean mass did not differ between groups (Fig. 3A and B).
FIG 3.

HFD-P increased body weight and body composition but not as much as HFD-S. (A) Body weight in uninfected mice after 8 weeks of diet. One-way ANOVA with Dunnett's T3 post hoc test. Data are reported as means ± SEM, with n = 24 mice per group. (B) Lean mass and fat mass of uninfected mice after 8 weeks on diet, measured by dual-energy X-ray absorptiometry. Data were analyzed by one-way ANOVA with a Dunnett's post hoc test for lean mass and Tukey's test for fat mass. Data are reported as means ± SEM, with n = 24 mice per group. ***, P < 0.001.
Mice fed HFD-P had a higher frequency of neutrophils in bone marrow than mice fed HFD-S.
Neutrophils are the first cells migrating to a site of inflammation. To investigate the dietary effect on neutrophils, the frequency of neutrophils in bone marrow and blood from uninfected mice was analyzed using flow cytometry after 8 weeks of the respective diet. In bone marrow, mice fed HFD-P had 13% higher frequency of neutrophils (P < 0.001) than mice fed HFD-S and 8% higher frequency (P < 0.001) than mice fed LFD (Fig. 4B). In blood, mice fed HFD-P tended to have a 25% higher frequency of neutrophils than mice fed HFD-S (P = 0.056) and 37% higher frequency than mice fed LFD (P = 0.009). There was no difference in neutrophil frequency between mice fed LFD and HFD-S (Fig. 4C). Six days after i.v. inoculation of S. aureus, there was an 8-fold increase in the frequency of neutrophils in blood compared to that of uninfected mice. However, there was no difference in neutrophil frequency in blood between the different dietary groups (see Fig. S1 in the supplemental material). There were no differences in the frequency of monocytes in bone marrow in uninfected mice between the dietary groups (Fig. 4D).
To investigate if the dietary fat composition affects neutrophil recruitment, thioglycolate was injected into the peritoneal cavity in uninfected mice following exposure to different diets for 8 weeks. Peritoneal lavage fluid was collected after 4 h. In mice fed HFD-P there was a 117% higher frequency of neutrophils in peritoneal lavage fluid (P < 0.001), and in mice fed LFD there was a 93% higher frequency of neutrophils (P < 0.001) than in mice fed HFD-S. There was no difference between mice fed LFD and HFD-P (Fig. 4E).
To investigate if dietary fats can affect progenitor cells in general, bone marrow cells from uninfected mice were stained with the general precursor cell marker CD117. Mice fed HFD-P for 8 weeks had a 15% higher frequency of precursor cells in their bone marrow (P = 0.003) than mice fed HFD-S. There was no difference between mice fed HFD-P and LFD or HFD-S and LFD (Fig. 5).
FIG 5.
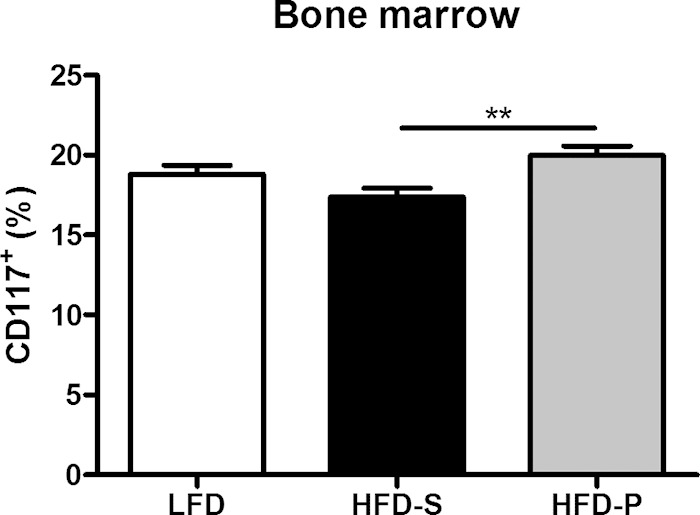
HFD-P increased the frequency of precursor cells in bone marrow. The frequency of precursor cells in bone marrow from uninfected mice was measured after 8 weeks on different diets in uninfected mice. Data were pooled from 2 different experiments and were analyzed using two-way ANOVA. Experiment was considered a nuisance factor. Data are shown as estimated marginal means ± SEM, with n = 10 mice per group. **, P < 0.01.
Genome-wide expression analysis revealed an upregulation of cathepsin D in mice fed HFD-P compared with mice fed HFD-S.
To examine the transcriptional responses in bone marrow from uninfected mice after 8 weeks on the different diets, microarray analyses were performed. Based on a statistical cutoff-adjusted P value of 0.05 from the three comparisons (HFD-P versus LFD, HFD-P versus HFD-S, and LFD versus HFD-S), 43, 38, and 7 transcripts, respectively, were identified as having differential gene expression (see Table S1 in the supplemental material for more details). To investigate the specific impact of HFD-P on the gene expression in bone marrow, the Venn diagram of the differently expressed genes for the three comparisons was constructed (see Fig. S2 in the supplemental material). The diagram showed 18 genes that are in common when HFD-P was compared with the other diets, indicating the specific impact of HFD-P on gene expression. Interestingly, one of the 18 genes encoded cathepsin D (ctsD), which is known to be associated with neutrophil apoptosis (22), and it was 31% upregulated in mice fed HFD-P compared with mice fed HFD-S (adjusted P of 0.002) and mice fed LFD (adjusted P of 0.003) (Fig. 6).
FIG 6.
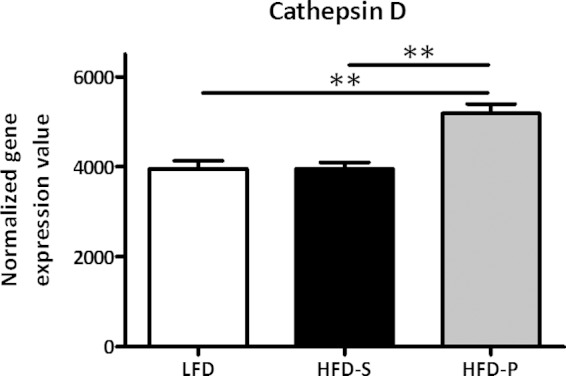
HFD-P increased cathepsin D gene expression in bone marrow. Expression level of cathepsin D, from microarray analysis in bone marrow, after 8 weeks of the different diets in uninfected mice. Data were evaluated using a moderate Student's t test and are shown as means ± SEM, with n = 4 per group. Two asterisks indicate an adjusted P of <0.01.
Protein/carbohydrate ratio did not affect survival.
To investigate if the ratio between protein and carbohydrates affects the survival in sepsis, diets with 60% fat, either mostly saturated or polyunsaturated, were combined with 30% protein and 10% carbohydrates (HP/C) or 10% protein and 30% carbohydrates (LP/C) and fed to mice for 8 weeks. There was no difference in survival after i.v. inoculation of S. aureus between mice fed saturated fatty acids combined with either of the two different proportions of protein and carbohydrates, HP/C HFD-S or LP/C HFD-S. Likewise, there was no difference between mice fed polyunsaturated fatty acids combined with either of the two different proportions of protein and carbohydrates, HP/C HFD-P or LP/C HFD-P (Fig. 7). However, the rate of survival was higher (hazard ratio, 0.17; P = 0.001) in mice fed polyunsaturated fatty acids than in those fed saturated fatty acids, in line with the results shown in Fig. 2A.
FIG 7.
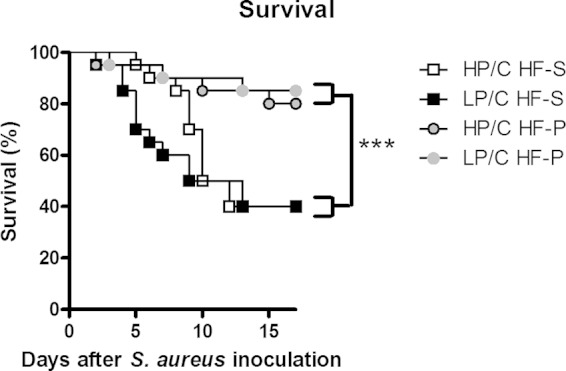
Protein or carbohydrate composition did not affect survival. Shown is survival after 8 weeks on different diets 0 to 17 days after S. aureus i.v. inoculation, with n = 20 mice per group. Cox regression was performed with fat source and protein proportion as factors, where polyunsaturated fatty acid diets had decreased risk compared with saturated fatty acid diet (hazard ratio, 0.17; P = 0.001), and the high-protein diet had no difference in risk from the high-carbohydrate diet (hazard ratio, 0.8; P = 0.6). ***, P < 0.001. Experimental groups included the following: HP/C HF-S, high protein-to-carbohydrate ratio and saturated high-fat diet; LP/C HF-S, low protein-to-carbohydrate ratio and saturated high-fat diet; HP/C HF-P, high protein-to-carbohydrate ratio and polyunsaturated high-fat diet; and LP/C HF-P, low protein-to-carbohydrate ratio and polyunsaturated high-fat diet.
DISCUSSION
In the present study, we investigated the effect of dietary fat composition on the immune response to S. aureus infection. Mice fed HFD-P had a higher level of survival than mice fed HFD-S and did not differ in survival compared with mice fed LFD. Consistent with this, mice fed HFD-P and LFD had lower bacterial loads in their kidneys than mice fed HFD-S, indicating that mice fed HFD-P or LFD have a better defense against S. aureus-induced sepsis. These findings confirm and extend our previous study showing impaired immune response in mice fed HFD-S compared with mice fed LFD (16). The present study implicates that high-fat diet per se is not necessarily deleterious, but rather that a high grade of saturation of the fat impairs the immune response.
Given that 8 weeks of exposure to HFD-S diet induces obesity, the impairment of the immune response to S. aureus could be caused directly by the diet or could be secondary to the obesity. Our earlier studies indicate that obesity per se affects the defense against S. aureus-induced sepsis, as ob/ob (obese) mice on LFD have a lower level of survival than wild-type mice (16). The present results, however, suggest that HFD-P can protect against infections independently of its effect on obesity. Although the HFD-P-fed mice were more obese than mice fed LFD, there was no difference in survival between HFD-P- and LFD-fed mice. Furthermore, there was no difference in lean mass between the three groups, indicating that this aspect of body composition does not mediate the effects of diet on defense against sepsis.
Neutrophils are of great importance for the immune response to bacterial infections, especially for defense against S. aureus (23, 24). By flow cytometry we analyzed neutrophils in bone marrow, blood, and peritoneal lavage fluid. These organs were chosen to show the production and function of neutrophils. Clinically, high frequencies of leukocytes in the blood, especially neutrophils, are regarded as a sign of an ongoing infection. However, the increased frequency of neutrophils in bone marrow and the numeric tendency in blood from uninfected mice fed HFD-P does not seem to be a symptom of inflammation, since inflammatory markers in serum did not differ between the groups (data not shown). Rather, the increase in neutrophils may reflect improved basal neutrophil efficiency or improved immune function in general in mice fed HFD-P. This in turn would increase the capacity to combat S. aureus infection. Hence, these findings suggest that it is possible to stimulate the capacity to fight infections (e.g., with HFD-P) without causing the deleterious effects associated with chronic inflammation, i.e., chronic immune activation in the absence of infection. Further, monocytes in bone marrow were not affected by the different diets, indicating that this is a specific effect on neutrophils by the diet and not on all innate immune cells. Six days after infection, the frequency of neutrophils found in blood had increased by 8-fold; however, there was no difference between the groups. These results show that all mice had the capacity to increase the frequency of circulating neutrophils, but this finding is difficult to interpret, since neutrophils are both produced and consumed during an infection.
To investigate if the migratory capacity of neutrophils also was affected by the diet, thioglycolate was injected into the peritoneal cavity. Indeed, the frequency of neutrophils in peritoneal lavage fluid from mice fed HFD-P and LFD was increased compared to that of mice fed HFD-S, indicating that neutrophils in these mice have an increased migratory capacity. This finding still was present when taking into account that the neutrophil frequency in bone marrow was increased in mice fed HFD-P compared to mice fed LFD or HFD-S (data not shown).
The increase in bone marrow neutrophils in mice fed HFD-P prompted us to investigate progenitor cells in this organ. HFD-P had a higher frequency of precursor cells than mice fed HFD-S. CD117 or c-Kit is the receptor for stem cell factor/steel factor and is an overall hematopoietic precursor cell marker (26). We speculate that mice fed HFD-P are more prepared to quickly mobilize a leukocyte defense in general to fight off bacteria thanks to the higher levels of hematopoietic precursor cells.
Cathepsin D is a lysosomal protein found in polymorphonuclear leukocytes, monocytes, and macrophages (27), and it is important in regulating apoptosis (22, 28). In the present study, mice fed HFD-P have higher levels of cathepsin D mRNA in bone marrow than mice fed HFD-S. Previous studies show that cathepsin D deficiency leads to impaired bacterial clearance (29, 30). This is in line with our results where mice fed HFD-P have higher cathepsin D expression and decreased bacterial load.
It has been suggested previously that the ratio between dietary protein and carbohydrates impacts the immune system (31–33). In the current study, the protein/carbohydrate ratio did not influence survival during sepsis. Instead, the proportions between saturated and polyunsaturated fat had a large impact, in line with results discussed above. Taken together, the results of the present study show that the distribution between saturated and polyunsaturated fatty acids exerts a robust effect on septic survival irrespective of large variations in protein and carbohydrate content of the diet.
In summary, mice fed HFD-P seem to have a larger capacity to combat S. aureus infection than mice fed HFD-S. The reason for this is unknown but may be related to the fact that the mice fed HFD-P had a higher frequency of neutrophils in bone marrow and blood prior to infection. Moreover, mice fed HFD-P had a higher frequency of neutrophils in peritoneal lavage fluid after thioglycolate-induced inflammation; thus, these mice seem to have more efficient chemotaxis than neutrophils from mice fed HFD-S.
Supplementary Material
ACKNOWLEDGMENTS
This work was supported by the Swedish Research Council (no. K2013-54X-09894-19-3) and European Framework Programme 7 funding (Full4Health; contract no. FP7-KBBE-2010-4-266408).
We acknowledge SCIBLU Genomics (Swegene Centre for Integrative Biology) at Lund University, Sweden, for microarray hybridizations.
We confirm that we have no conflicts of interests.
Footnotes
Supplemental material for this article may be found at http://dx.doi.org/10.1128/IAI.02349-14.
REFERENCES
- 1.Levy MM, Fink MP, Marshall JC, Abraham E, Angus D, Cook D, Cohen J, Opal SM, Vincent JL, Ramsay G. 2003. 2001 SCCM/ESICM/ACCP/ATS/SIS International Sepsis Definitions Conference. Crit Care Med 31:1250–1256. doi: 10.1097/01.CCM.0000050454.01978.3B. [DOI] [PubMed] [Google Scholar]
- 2.Russell JA. 2006. Management of sepsis. N Engl J Med 355:1699–1713. doi: 10.1056/NEJMra043632. [DOI] [PubMed] [Google Scholar]
- 3.Martin GS, Mannino DM, Eaton S, Moss M. 2003. The epidemiology of sepsis in the United States from 1979 through 2000. N Engl J Med 348:1546–1554. doi: 10.1056/NEJMoa022139. [DOI] [PubMed] [Google Scholar]
- 4.Kotsaki A, Giamarellos-Bourboulis EJ. 2012. Emerging drugs for the treatment of sepsis. Expert Opin Emerg Drugs 17:379–391. doi: 10.1517/14728214.2012.697151. [DOI] [PubMed] [Google Scholar]
- 5.Levy SB, Marshall B. 2004. Antibacterial resistance worldwide: causes, challenges and responses. Nat Med 10:S122–S129. doi: 10.1038/nm1145. [DOI] [PubMed] [Google Scholar]
- 6.WHO. 2012. The evolving threat of antimicrobial resistance–options of action. World Health Organization, Geneva, Switzerland. [Google Scholar]
- 7.Bone RC. 1992. Toward an epidemiology and natural history of SIRS (systemic inflammatory response syndrome). JAMA 268:3452–3455. [PubMed] [Google Scholar]
- 8.Remick DG. 2003. Cytokine therapeutics for the treatment of sepsis: why has nothing worked? Curr Pharm Des 9:75–82. doi: 10.2174/1381612033392567. [DOI] [PubMed] [Google Scholar]
- 9.Hotchkiss RS, Karl IE. 2003. The pathophysiology and treatment of sepsis. N Engl J Med 348:138–150. doi: 10.1056/NEJMra021333. [DOI] [PubMed] [Google Scholar]
- 10.Deitch EA. 1998. Animal models of sepsis and shock: a review and lessons learned. Shock 9:1–11. [DOI] [PubMed] [Google Scholar]
- 11.Day RB, Link DC. 2012. Regulation of neutrophil trafficking from the bone marrow. Cell Mol Life Sci 69:1415–1423. doi: 10.1007/s00018-011-0870-8. [DOI] [PMC free article] [PubMed] [Google Scholar]
- 12.Nathan C. 2006. Neutrophils and immunity: challenges and opportunities. Nat Rev Immunol 6:173–182. doi: 10.1038/nri1785. [DOI] [PubMed] [Google Scholar]
- 13.Miller LS, Cho JS. 2011. Immunity against Staphylococcus aureus cutaneous infections. Nat Rev Immunol 11:505–518. doi: 10.1038/nri3010. [DOI] [PMC free article] [PubMed] [Google Scholar]
- 14.Storlien LH, Jenkins AB, Chisholm DJ, Pascoe WS, Khouri S, Kraegen EW. 1991. Influence of dietary fat composition on development of insulin resistance in rats. Relationship to muscle triglyceride and omega-3 fatty acids in muscle phospholipid. Diabetes 40:280–289. [DOI] [PubMed] [Google Scholar]
- 15.Hu FB, Manson JE, Willett WC. 2001. Types of dietary fat and risk of coronary heart disease: a critical review. J Am Coll Nutr 20:5–19. doi: 10.1080/07315724.2001.10719008. [DOI] [PubMed] [Google Scholar]
- 16.Strandberg L, Verdrengh M, Enge M, Andersson N, Amu S, Onnheim K, Benrick A, Brisslert M, Bylund J, Bokarewa M, Nilsson S, Jansson JO. 2009. Mice chronically fed high-fat diet have increased mortality and disturbed immune response in sepsis. PLoS One 4:e7605. doi: 10.1371/journal.pone.0007605. [DOI] [PMC free article] [PubMed] [Google Scholar]
- 17.Kitagawa Y, Kikuchi S, Arita Y, Nishimura M, Mizuno K, Ogasawara H, Kawano T, Ochiai T, Otsuji E, Imai T. 2013. Inhibition of CCL20 increases mortality in models of mouse sepsis with intestinal apoptosis. Surgery 154:78–88. doi: 10.1016/j.surg.2013.02.012. [DOI] [PubMed] [Google Scholar]
- 18.Ikuta K, Weissman IL. 1992. Evidence that hematopoietic stem cells express mouse c-kit but do not depend on steel factor for their generation. Proc Natl Acad Sci U S A 89:1502–1506. doi: 10.1073/pnas.89.4.1502. [DOI] [PMC free article] [PubMed] [Google Scholar]
- 19.Breslin WL, Strohacker K, Carpenter KC, Haviland DL, McFarlin BK. 2013. Mouse blood monocytes: standardizing their identification and analysis using CD115. J Immunol Methods 390:1–8. doi: 10.1016/j.jim.2011.03.005. [DOI] [PubMed] [Google Scholar]
- 20.Smyth GK, Michaud J, Scott HS. 2005. Use of within-array replicate spots for assessing differential expression in microarray experiments. Bioinformatics 21:2067–2075. doi: 10.1093/bioinformatics/bti270. [DOI] [PubMed] [Google Scholar]
- 21.Benjamini Y, Drai D, Elmer G, Kafkafi N, Golani I. 2001. Controlling the false discovery rate in behavior genetics research. Behav Brain Res 125:279–284. doi: 10.1016/S0166-4328(01)00297-2. [DOI] [PubMed] [Google Scholar]
- 22.Conus S, Perozzo R, Reinheckel T, Peters C, Scapozza L, Yousefi S, Simon HU. 2008. Caspase-8 is activated by cathepsin D initiating neutrophil apoptosis during the resolution of inflammation. J Exp Med 205:685–698. doi: 10.1084/jem.20072152. [DOI] [PMC free article] [PubMed] [Google Scholar]
- 23.Phillipson M, Kubes P. 2011. The neutrophil in vascular inflammation. Nat Med 17:1381–1390. doi: 10.1038/nm.2514. [DOI] [PMC free article] [PubMed] [Google Scholar]
- 24.Rigby KM, DeLeo FR. 2012. Neutrophils in innate host defense against Staphylococcus aureus infections. Semin Immunopathol 34:237–259. doi: 10.1007/s00281-011-0295-3. [DOI] [PMC free article] [PubMed] [Google Scholar]
- 25.Reference deleted.
- 26.Kent D, Copley M, Benz C, Dykstra B, Bowie M, Eaves C. 2008. Regulation of hematopoietic stem cells by the steel factor/KIT signaling pathway. Clin Cancer Res 14:1926–1930. doi: 10.1158/1078-0432.CCR-07-5134. [DOI] [PubMed] [Google Scholar]
- 27.Levy J, Kolski GB, Douglas SD. 1989. Cathepsin D-like activity in neutrophils and monocytes. Infect Immun 57:1632–1634. [DOI] [PMC free article] [PubMed] [Google Scholar]
- 28.Roberg K, Kagedal K, Ollinger K. 2002. Microinjection of cathepsin D induces caspase-dependent apoptosis in fibroblasts. Am J Pathol 161:89–96. doi: 10.1016/S0002-9440(10)64160-0. [DOI] [PMC free article] [PubMed] [Google Scholar]
- 29.Bewley MA, Marriott HM, Tulone C, Francis SE, Mitchell TJ, Read RC, Chain B, Kroemer G, Whyte MK, Dockrell DH. 2011. A cardinal role for cathepsin D in co-ordinating the host-mediated apoptosis of macrophages and killing of pneumococci. PLoS Pathog 7:e1001262. doi: 10.1371/journal.ppat.1001262. [DOI] [PMC free article] [PubMed] [Google Scholar]
- 30.del Cerro-Vadillo E, Madrazo-Toca F, Carrasco-Marin E, Fernandez-Prieto L, Beck C, Leyva-Cobian F, Saftig P, Alvarez-Dominguez C. 2006. Cutting edge: a novel nonoxidative phagosomal mechanism exerted by cathepsin-D controls Listeria monocytogenes intracellular growth. J Immunol 176:1321–1325. doi: 10.4049/jimmunol.176.3.1321. [DOI] [PubMed] [Google Scholar]
- 31.Ogle CK, Ogle JD, Mao JX, Simon J, Noel JG, Li BG, Alexander JW. 1994. Effect of glutamine on phagocytosis and bacterial killing by normal and pediatric burn patient neutrophils. J Parenter Enteral Nutr 18:128–133. [DOI] [PubMed] [Google Scholar]
- 32.Wilmore DW, Shabert JK. 1998. Role of glutamine in immunologic responses. Nutrition 14:618–626. doi: 10.1016/S0899-9007(98)00009-4. [DOI] [PubMed] [Google Scholar]
- 33.Suzuki I, Matsumoto Y, Adjei AA, Asato L, Shinjo S, Yamamoto S. 1993. Effect of a glutamine-supplemented diet on response to methicillin-resistant Staphylococcus aureus infection in mice. J Nutr Sci Vitaminol 39:405–410. doi: 10.3177/jnsv.39.405. [DOI] [PubMed] [Google Scholar]
Associated Data
This section collects any data citations, data availability statements, or supplementary materials included in this article.