This study aimed to identify optimal cutoff points for six quality-of-life (QoL) scales and to quantify their added utility in the performance of four prognostic classifications in patients with hepatocellular carcinoma (HCC). Optimal cutoff values for QoL scales can be useful to identify HCC patients with very poor prognosis and thus improve design of clinical trials and treatment adjustment for these patients.
Keywords: Optimal cutoff point, Quality of life, Hepatocellular carcinoma, Prognostic classification
Abstract
Background.
Health-related quality of life (QoL) has been validated as a prognostic factor for cancer patients; however, to be used in routine practice, QoL scores must be dichotomized. Cutoff points are usually based on arbitrary percentile values. We aimed to identify optimal cutoff points for six QoL scales and to quantify their added utility in the performance of four prognostic classifications in patients with hepatocellular carcinoma (HCC).
Methods.
We reanalyzed data of 271 patients with advanced HCC recruited between July 2002 and October 2003 from 79 institutions in France in the CHOC trial, designed to assess the efficacy of long-acting octreotide. QoL was assessed with the European Organization for Research and Treatment of Cancer Quality of Life Questionnaire-Core 30 (QLQ-C30). The scores ranged from 0 to 100. Identification of optimal cutoff points was based on the method of Faraggi and Simon [Stat Med 1996;15:2203–2213]. Improvement in the performance of prognostic classifications was studied with Harrell’s C-index, the net reclassification improvement (NRI), and integrated discrimination improvement (IDI).
Results.
We found that optimal cutoff points were 50 for global health, 58.33 for physical functioning, 66.67 for role functioning, 66.67 for fatigue, 0 for dyspnea, and 33.33 for diarrhea. The addition of QoL and clinical factors improved the performance of all four prognostic classifications, with improvement in the range of 0.02–0.09 for the C-index, 0.24–0.78 for 3-month NRI, and 0.02–0.10 for IDI.
Conclusion.
These cutoff values for QoL scales can be useful to identify HCC patients with very poor prognosis and thus improve design of clinical trials and treatment adjustment for these patients.
Abstract
摘要
背景. 健康相关生活质量(QoL)已证实为癌症患者的预后因素之一;然而,当用于日常临床实践时,QoL 评分必须一分为二地来看。评分中的截点选择通常基于任意的百分比值。本研究旨在识别 6 个 QoL 量表的最佳截点并量化其在肝细胞癌(HCC)患者 4 个预后分组状态评分中的附加价值。
方法. 我们选择 2002 年 7 月∼ 2003 年 10 月 CHOC 试验中 79 所法国研究中心招募的 271 例晚期 HCC 患者数据进行重新分析,以评估长效奥曲肽的有效性。QoL 根据欧洲癌症研究和治疗组织生活质量调查问卷核心 30 项评分(QLQ-C30)。评分最低为 0 ,最高为 100 。根据 Faraggi 和 Simon 的方法(Stat Med 1996;15:2203-2213)确定最佳截点。利用 Harrell’s C指数、再分级净改善值(NRI)以及鉴别力综合改善值(IDI)分析预后分组状态评分。
结果. 我们发现,整体健康的最佳截点为 50,生理功能为 58.33,角色功能为 66.67,乏力为 66.67,呼吸困难为 0 ,腹泻为 33.33 。QoL 和临床因素的使用提高了全部 4 个预后分组状态评分,C 指数、 3 个月 NRI 以及 IDI 分别改善了 0.02 ∼ 0.09、0.24 ∼ 0.78以及 0.02 ∼ 0.10。
结论. 上述 QoL 量表截点有助于识别预后极差的 HCC 患者,因而进一步改善适合这些患者的临床试验设计,并调整治疗方案。The Oncologist 2015;20:62–71
Implications for Practice:
Since the addition of quality of life (QoL) scores improves the accuracy of overall survival estimation, our cutoff values facilitate incorporation of these QoL scores in clinical decision-making alone or in combination with other clinical and laboratory variables. For example, a fatigue score >66.67 or a physical functioning score <58.33 should be considered in the choice of treatment. These cutoff values could also facilitate screening of patients who require management of a particular aspect of their quality of life in addition to management of their cancer. Cutoffs can also be used as inclusion/exclusion criteria or as a stratification factor in randomized clinical trials to improve study design.
Introduction
Primary liver cancer is the sixth most common cancer and the third most fatal cancer in the world [1]. Hepatocellular carcinoma (HCC) accounts for 90% of all primary liver cancers, and only ∼30% [2] of newly diagnosed HCC patients are eligible for curative treatment (liver transplantation, liver resection, or radiofrequency ablation). Patients with intermediate HCC receive transcatheter arterial chemoembolization, whereas the standard of care for patients with advanced HCC is sorafenib.
Prognostic value of health-related quality of life (QoL) has already been validated for palliative HCC patients [3–5] and for other cancer types [6]. Quality of life is often assessed with a questionnaire comprising several items. The patient’ response to all items is converted to domain-specific scores that can be considered quantitative continuous variables.
It is well known that the use of continuous variables is statistically preferable to the use of categorized variables in prognostic studies [7]. To be used easily in routine staging, QoL measures must be subdivided into more discrete categories. Like other laboratory parameters included in HCC prognostic indices (e.g., albumin, bilirubin, α-fetoprotein), physicians usually based their decisions on a binary normal/abnormal assessment: to treat versus not to treat. Median, percentiles, or other arbitrary values have been selected as cutoffs for dichotomization into good or poor prognosis in the majority of studies [8]. Other commonly used methods are visual inspection of scatter plots [9, 10] and systematic search for the cut point associated with a minimum χ2 p value [9, 10]. These less rigorous methods of categorization resulted in marked heterogeneity of cut points in the medical literature. An example of this possible heterogeneity in cutoff points was illustrated in Altman’s prognostic study [11] in breast cancer, in which he found 19 different cut points for S-phase (phase of the cell cycle in which DNA replication occurs).
Dichotomization of QoL scales could also facilitate their use when defining eligibility criteria or stratification factors for studies of new treatments. Another way of using QoL scales would be to add them to existing prognostic systems for HCC patients: Cancer of the Liver Italian Program (CLIP) [12], Barcelona Clinic Liver Cancer (BCLC) [13], Groupe d’Etude et de Traitement du Carcinome Hépatocellulaire (GRETCH) [14], and Bonnetain and Barbare prognostic index (BoBar) [15]. The first three staging systems were originally developed for all HCC patients, and their limits for prognostic assessment in advanced HCC patients (corresponding to the BCLC class-C) have been underscored [16, 17]. Consequently, no consensus has been reached concerning the best prognostic system to be used for advanced HCC [17]. Adding QoL scales to existing prognostic indices could improve the physician’s management of the patient’s disease and could allow the patient’s perception of health to be taken into account to achieve stratified therapy. Because the above-listed prognostic systems were built with categorized variables, QoL scales need to be dichotomized before being included in these prognostic classifications. This simplified interpretation of QoL can be achieved only through loss of information because values close to the cutoff point but in opposite directions are treated as equally different as the minimum and maximum values of the continuous variable. Furthermore, a cutoff point equal to the median value (which is not necessarily the optimal cutoff point) is equivalent to losing one-third of the data, resulting in loss of statistical power [7].
To limit this loss of power, we propose the following strategies. First, determine the optimal cut points (if they exist) using the method described by Faraggi and Simon [18] for the six most statistically significant European Organization for Research and Treatment of Cancer (EORTC) Quality of Life Questionnaire-Core 30 (QLQ-C30) scales (when these scales were treated as continuous variables) for overall survival prediction in a population of patients with palliative HCC: global health, physical functioning, role functioning, fatigue, dyspnea and diarrhea [3]. The existence of an optimal cut point must be interpreted as a point that divides the data into two homogeneous groups with respect to overall survival [10]. We expected Faraggi and Simon’s method to be efficient because the authors, in their simulation, showed that their method was almost unbiased when the relative risk was <1.5 and provided an underestimation of only 5% when the relative risk was >1.5. This method also gave a satisfactory type I error under the null hypothesis and had good power for large relative risk, as expected for two different prognostic groups. To our knowledge, this methodology has never been used for cut-off determination in QoL studies.
The second strategy is to evaluate how these optimally selected QoL scales and other clinical factors could be used to improve the performance of prognostic systems.
Patients and Methods
Patients
This prognostic study was conducted in parallel with the CHOC trial. The CHOC trial included 271 patients with HCC in a palliative setting between July 2002 and October 2003 from 79 centers in France. The phase III CHOC trial was designed to demonstrate the efficacy of long-acting octreotide for the treatment of advanced hepatocellular carcinoma. The negative results of this trial have been published previously [19]. The protocol was reviewed and approved by the ethics review committee of Région Picardie, France (May 16, 2002). All patients provided written informed consent, and the study was conducted in accordance with the ethical guidelines of the Declaration of Helsinki. QoL data and associated patient characteristics are detailed in a previous publication [3].
Health-Related Quality-of-Life Tool
QoL was self-completed by the patient during the 2 weeks prior to randomization, using the European Organization for Research and Treatment of Cancer QLQ-C30 [3, 20]. Details for the QLQ-C30 scales and their scoring can be found in our previous publication [3]. The response for each scale of a particular dimension was transformed into a score between 0 and 100 [21].
The present study focused on six QLQ-C30 scales: global health, physical functioning, role functioning, fatigue, dyspnea, and diarrhea. These scales were the most significantly associated with overall survival using both univariate and multivariate Cox models [3]. For fatigue, dyspnea, and diarrhea, 100 was the worst score, whereas for global health, physical functioning, and role functioning, 100 was the best score.
Definition of the Prognostic Classification
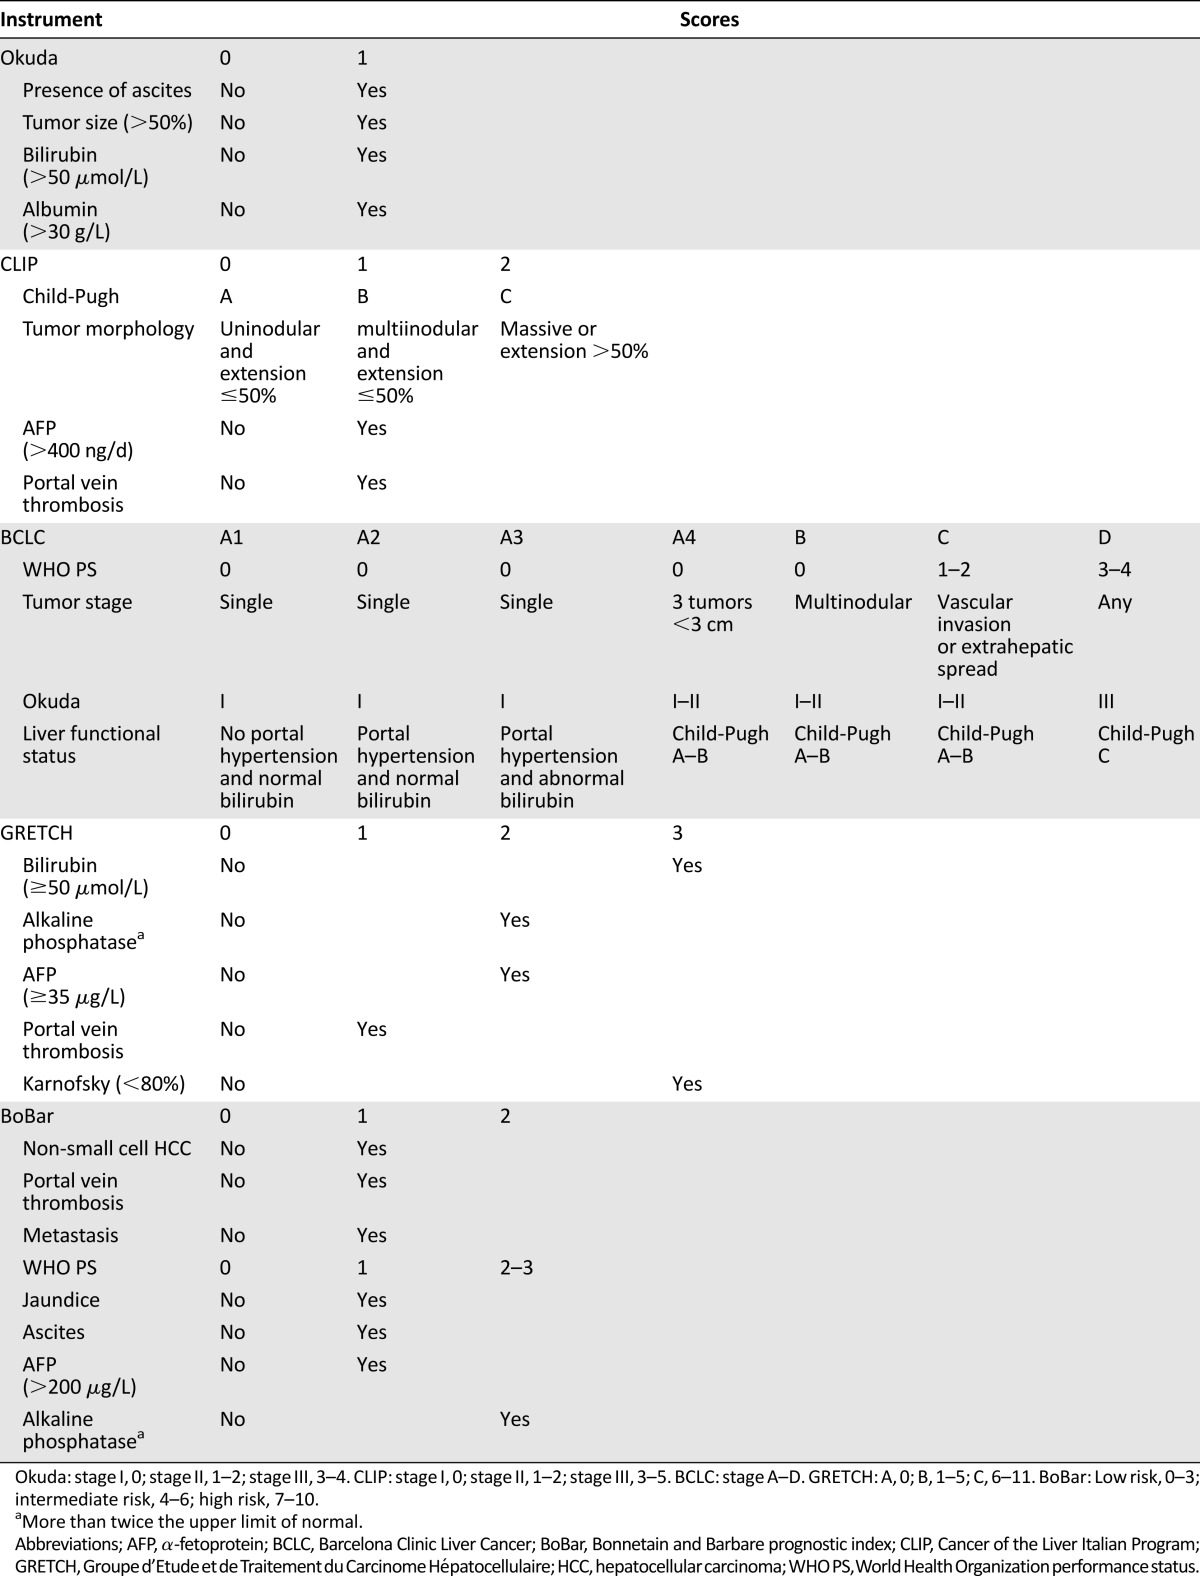
The four prognostic classifications used in the present study (CLIP, BCLC, GRETCH, and BoBar) are defined in Table 1.
Table 1.
Definition of prognostic classifications
Statistical Methods
Methods for descriptive statistics of our population were described in our previous publication [3]. Overall survival was defined as the time from randomization to death (regardless of the cause) or last follow-up (censored data).
All randomized patients with complete baseline QoL data were included in the statistical analysis and constituted a modified intention-to-treat population.
Before describing the methods used to determine cut points, the set of potential cut points for each QoL scale was selected as follows [9]. All possible values of the QoL scale were selected. Values of the QoL scale below and above its 20th and 80th percentiles, respectively, were removed to avoid a marked disequilibrium between the two groups. For each value θ of the QoL scale between the 20th and the 80th percentile, the shortest time at which 80% of the patients had died (T80[θ]) was determined. The θ/T80(θ) curve was plotted. The monotonicity of the curve was studied, and relevant cut points were selected by avoiding redundant cut points corresponding to a constant portion of the curve.
Faraggi and Simon’s method [18] is a twofold cross-validation consisting of partitioning the overall sample into learning and validation subsamples. An optimal cut point is determined for each subsample by using the minimum p value approach (the value associated with the maximal log-rank statistic or, equivalently, the minimum p value), and each patient was classified according to the cut point of the subsample to which the patient did not belong. The final cut point was the value (among all possible cut points) that minimized the p value in the overall sample, using a stratified log-rank test with subsample as the stratum. Stability of the cut points was studied with 500 bootstrap replications. The recommended cut point was the most frequent one across 500 bootstrap replications [22]. Confidence intervals (CIs) for cut points were based on percentiles of the distribution.
Once an optimal cut point was selected, the log-hazard ratio and its 95% CI were computed using the method described by Höllander et al. [23].
In view of the possible multicollinearity problem for global health reported by Van Steen et al. [24] and the difficulty of resolving this problem (in the case of prognostic value) to improve outcome, the other five dichotomized QoL scales and clinical and laboratory variables were selected for improvement of the prognostic classification using a multivariable Cox proportional hazards model with a backward elimination procedure (the prognostic classification was imposed in the model). Improvement of the performance of prognostic classifications was evaluated by Harrell’s C-index (C-index) [25], category-less net reclassification improvement (NRI) [26] and integrated discrimination improvement (IDI) [27]. The last two statistics were computed at 3, 6, and 12 months. As stated by Pencina et al. [26], NRI “quantifies the correctness of upward and downward reclassification or movement of predicted probabilities as a result of adding a new marker.” IDI quantifies the improvement in the sensitivity to predict mortality (without sacrificing specificity), whereas C-index evaluates the discriminative ability of a model and ranges from 0.5 (no discrimination) to 1 (perfect discrimination).
The construction of a modified prognostic index was based on linear transformation (the regression coefficients were divided by the smallest one), and patients were arbitrarily divided into three risk groups.
Survival curves were constructed using the Kaplan-Meier method [28].
All statistical analyses were carried out using the open-source R.2.12.0 software. IDI and NRI were computed using the survIDINRI library.
Results
Patient Characteristics
Baseline QoL scores for the six scales were available for 214 (79%) of the 271 patients. More information about patient characteristics is available in our previous study [3].
Cut-Point Definition
Role Functioning
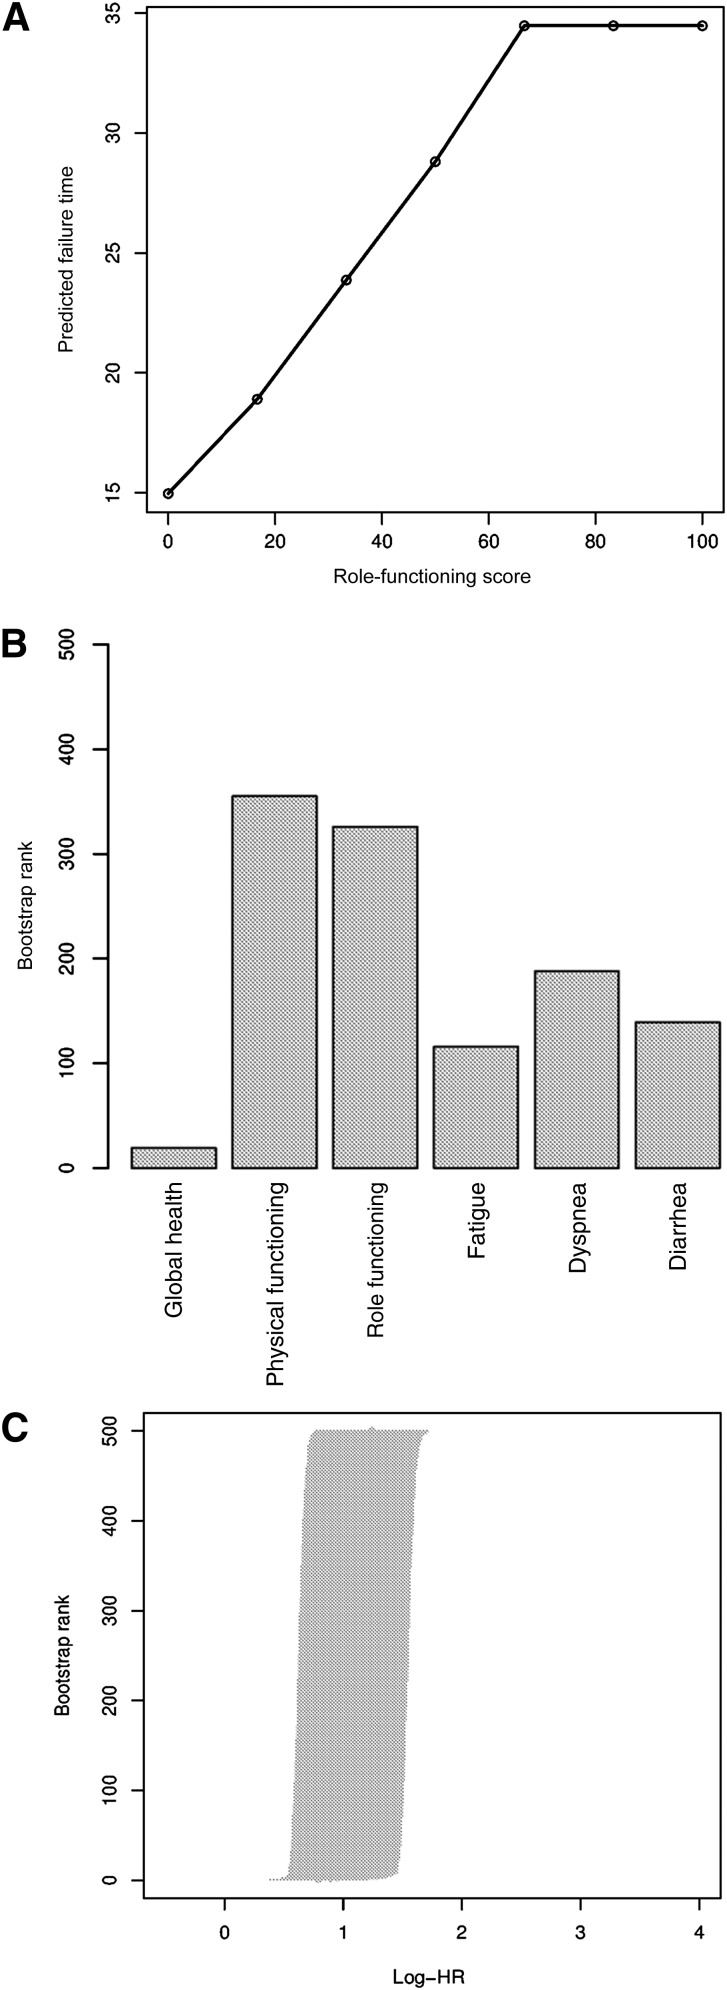
The median role-functioning score was 83 (range: 0–100). Figure 1A shows the Kaplan-Meier predictive failure time at which 80% of patients died as a function of the role-functioning scale. The choice of potential cut points was 50 and 66.67. Results of optimal cut points and the corresponding hazard ratios are summarized in Table 2. The most frequently selected cut point across 500 bootstrap replications (418 of 500) was 66.67 (95% CI: 50–66.67), and the rank of log-hazard ratios are shown in Figure 1C. The learning and validation subsamples found the same cut points 326 times out of 500 bootstrap replications, as shown in Figure 1B. The corresponding hazard ratio was 1.76 (95% CI: 1.31–2.36).
Figure 1.
Results of determination of optimal cut points for the Quality of Life Questionnaire-Core 30 (QLQ-C30) role functioning scale. (A): Scatter plot of predictive time to observe 20% of survivors as a function of role-functioning score. (B): Frequency with which the learning and validation samples found the same cutoff for the six quality-of-life scales (500 bootstrap replications). (C): The log-hazard ratio and 95% confidence interval ranks after 500 bootstrap replications for role-functioning score.
Abbreviation: HR, hazard ratio.
Table 2.
Results and frequency of optimal cut point determination

Results for cutoff determination for the other five QLQ-C30 scales are summarized in Table 2 and Figure 1B.
Revised Prognostic Classifications
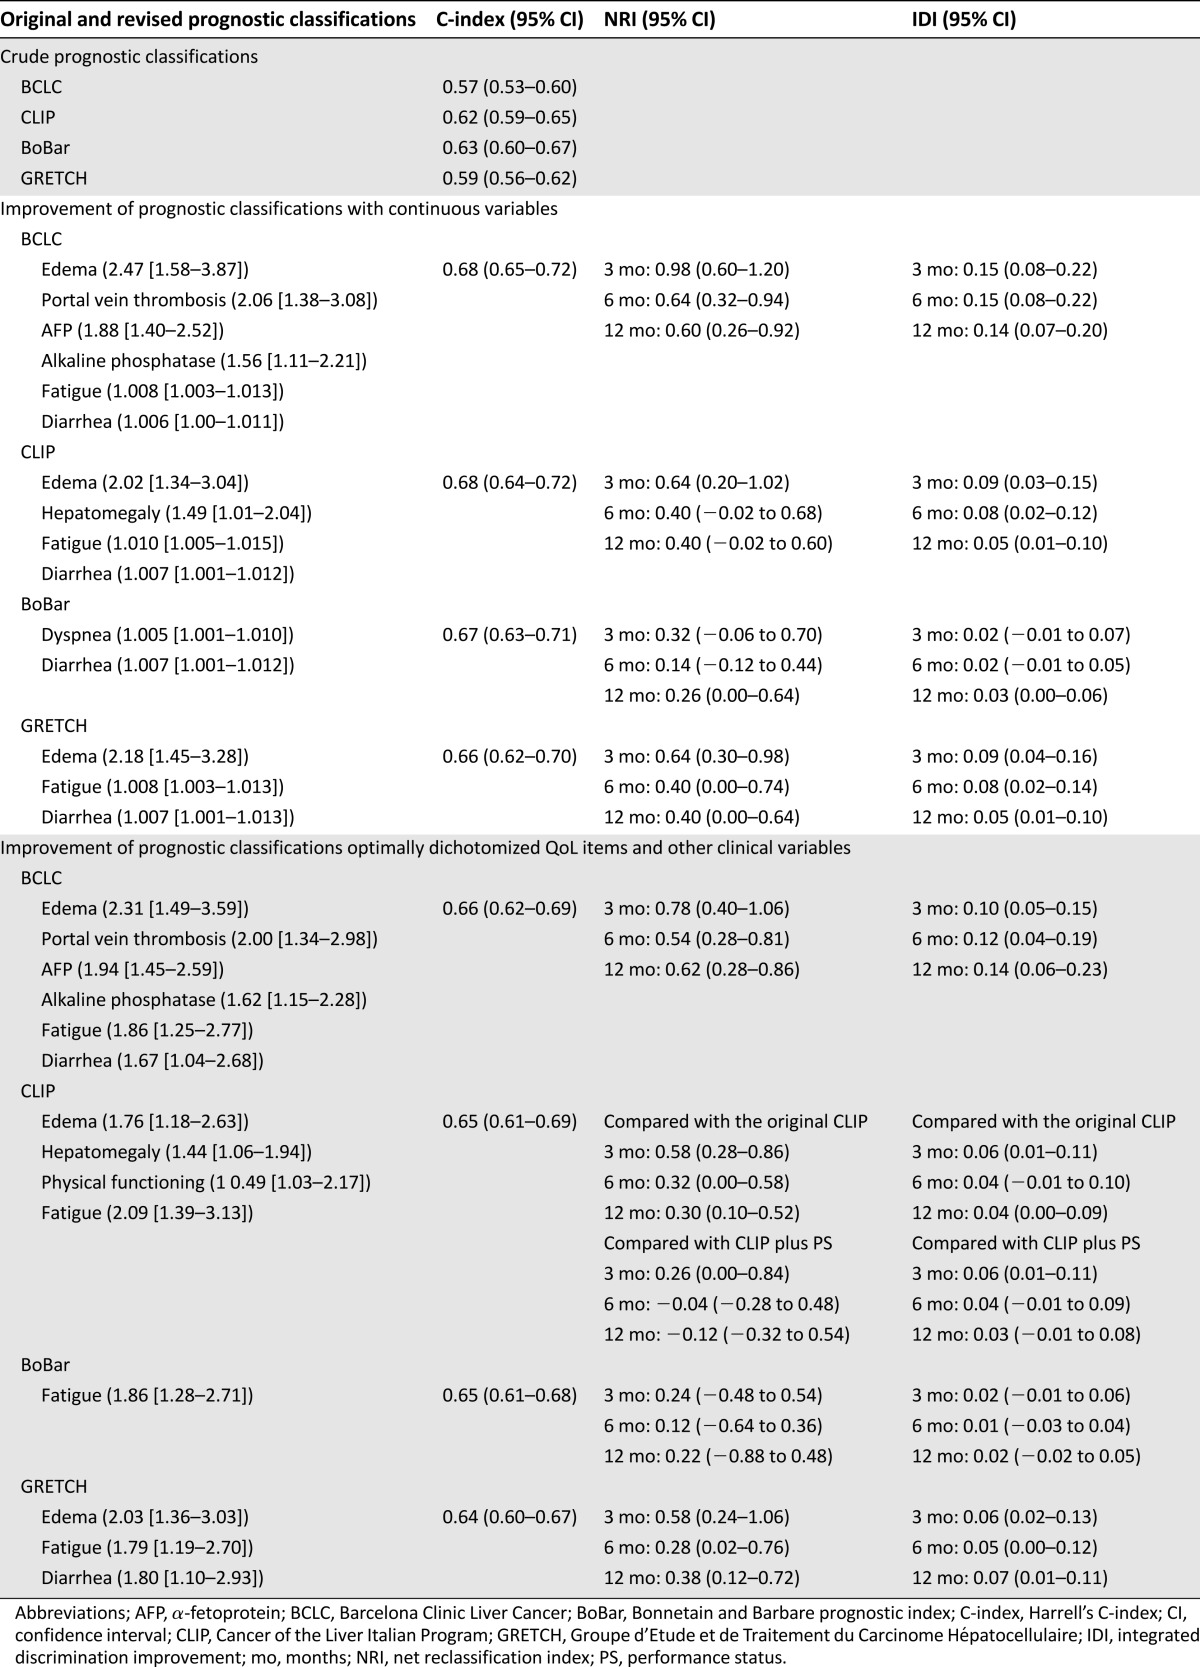
Performance of the various prognostic classifications is shown in Table 3.
Table 3.
Performance of the prognostic classifications with quality-of-life scales treated as continuous or dichotomized variables
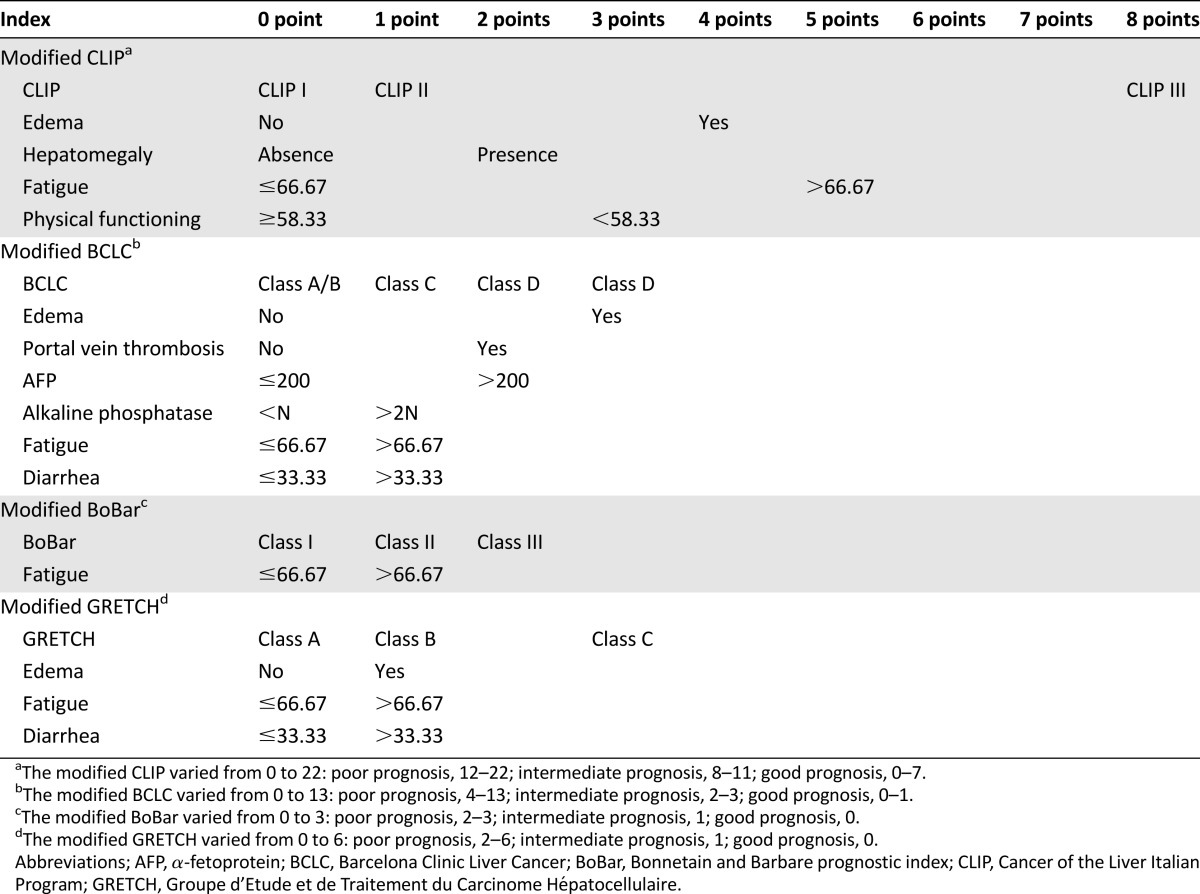
This section describes how the optimally dichotomized QoL scales and other clinical factors can be added to well-established prognostic systems. Modified prognostic indices are presented in Table 4.
Table 4.
Modified prognostic indices
BCLC
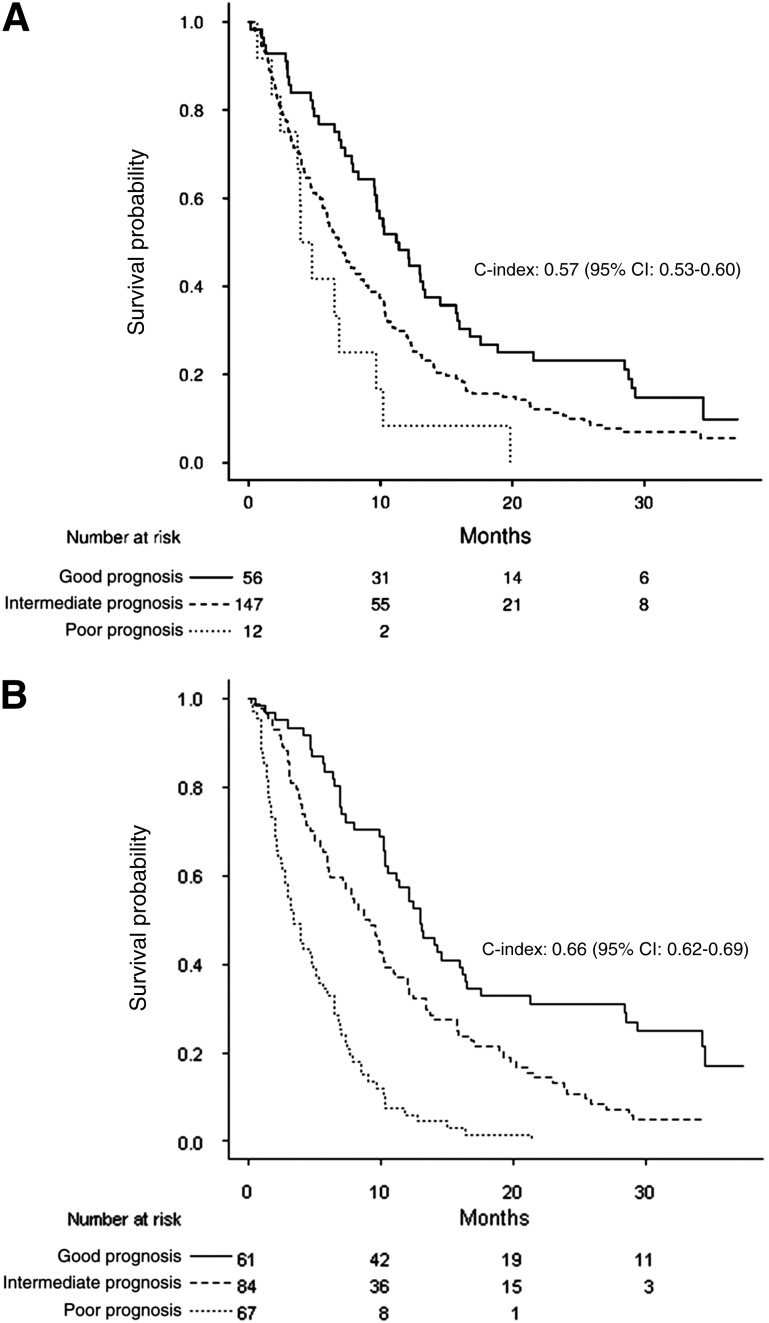
The C-index was 0.57 (95% CI: 0.53–0.60) for the BCLC score with four categories. Because categories A and B tended to have a similar survival rates in our palliative population, these two categories were pooled before analyzing the improvement of performance; after pooling, the C-index remained unchanged (0.57; 95% CI: 0.53–0.60). The modified BCLC score is defined in Table 4 with a 9% increase in C-index (from 0.57 to 0.66; 95% CI: 0.62–0.69); this gain in discrimination of the prognostic groups is illustrated in Figure 2A and 2B. The 3-month NRI and IDI were 0.78 (95% CI: 0.40–1.06) and 0.10 (95% CI: 0.05–0.15), respectively. Results for 6-month and 12-month NRI and IDI are summarized in Table 3.
Figure 2.
Overall survival (in months) for good, intermediate, and poor prognoses according to the original and modified Barcelona Clinic Liver Cancer (BCLC) prognostic systems. (A): Median survival was 11.20 (95% CI: 9.57–15.73), 6.87 (95% CI: 5.77–8.73), and 3.93 (95% CI: 3.70, maximum not available) for good, intermediate, and poor prognoses, respectively, according to the original BCLC index. (B): Median survival was 13.03 (95% CI: 10.50–16.47), 8.77 (95% CI: 6.20–11.10), and 3.4 (95% CI: 2.8–5.33) for good, intermediate, and poor prognoses, respectively, according to the modified BCLC prognostic system.
Abbreviations: C-index, concordance index; CI, confidence interval.
CLIP
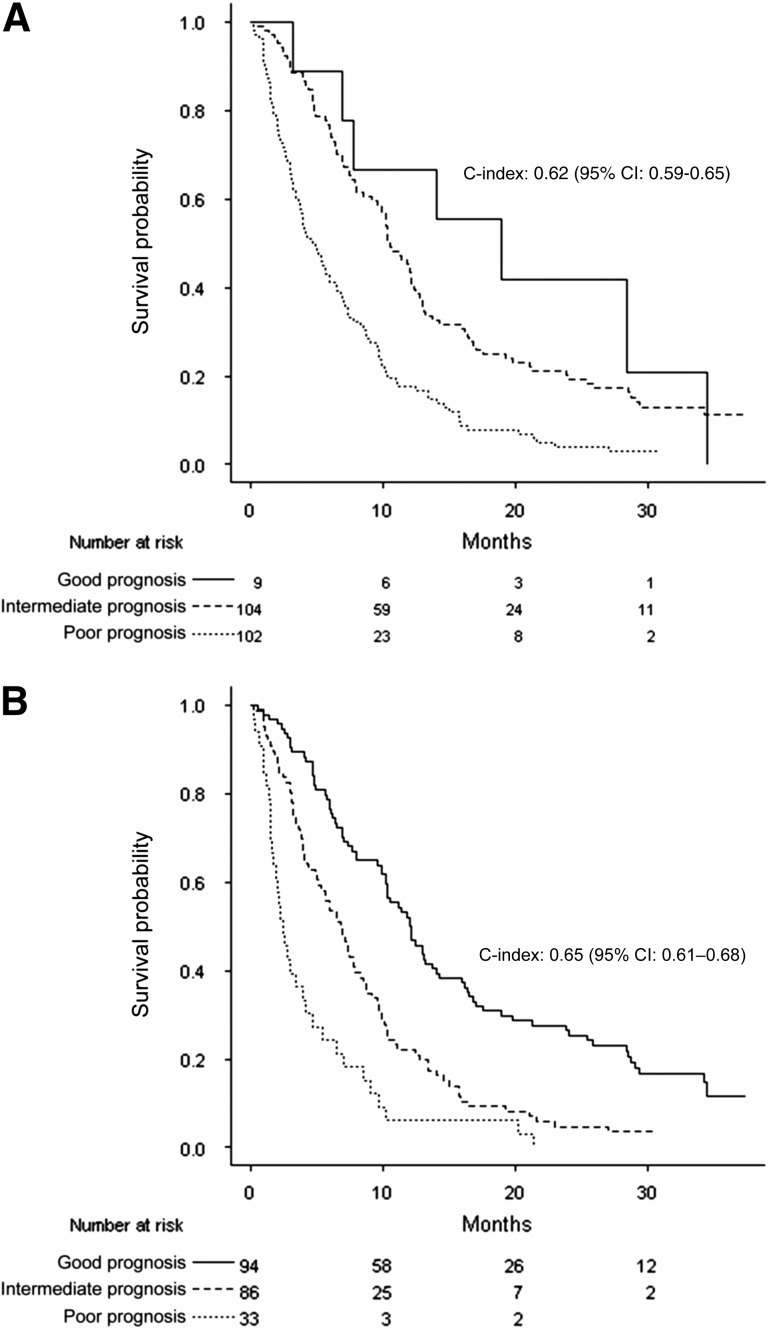
The new CLIP score integrating the optimally dichotomized QoL score is defined in Table 4, with a 3% gain for C-index (from 0.62 for original CLIP to 0.65; 95% CI: 0.61–0.69). The improvement in separation of prognostic groups was also assessed in terms of NRIs and IDIs (Table 3), as illustrated in Figure 3A and 3B.
Figure 3.
Overall survival (in months) for good, intermediate, and poor prognoses according to the original and modified Cancer of the Liver Italian Program (CLIP) prognostic indices. (A): Median survival was 18.90 (95% CI: 7.77, maximum not available), 10.53 (95% CI: 9.57–12.50), and 4.77 (95% CI: 3.70–6.50) for good, intermediate, and poor prognoses, respectively for the original CLIP index. (B): Median survival was 12.13 (95% CI: 10.30–16.40), 7.80 (95% CI: 5.63–1.30), and 3.93 (95% CI: 3.03–6.50) for good, intermediate, and poor prognoses, respectively, according to the modified CLIP index.
Abbreviations: C-index, concordance index; CI, confidence interval.
BoBar
The improvement of performance for the modified BoBar (Table 4) was limited in terms of C-index (2%), NRIs, and IDIs (Table 3), as illustrated by supplemental online Figure 1A and 1B.
GRETCH
An absolute 5% improvement of C-index (from 0.59 to 0.64; 95% CI: 0.60–0.67) was observed for the modified GRETCH (Table 4) prognostic system compared with GRETCH alone.
Survival curves for the original and modified GRETCH are shown in supplemental online Figure 2A and 2B.
Discussion
This study established cut points for the six most important QoL scales in terms of overall survival prognosis.
Patients could be divided into two homogeneous prognostic groups using cut points of 50 for global health, 66.67 for role functioning, 58.33 for physical functioning, 66.67 for fatigue, 0 for dyspnea, and 33.33 for diarrhea.
Although the extremely low cutoff value for dyspnea may be related to the low frequency of dyspnea symptoms, our results suggested that the presence of dyspnea has prognostic significance and should be closely monitored by the medical team; appropriate actions should be taken according to the severity of the dyspnea. This finding meant that any moderate or severe dyspnea should be managed appropriately in patients with advanced hepatocellular carcinoma, although dyspnea was not identified as a prognostic factor on multivariate Cox analysis, suggesting that the presence of dyspnea may be a consequence of a clinical or laboratory factor already present in the prognostic classification.
These cut points can be easily used to define eligibility criteria and stratification factors or as binary endpoints for future trials including palliative HCC patients.
The four prognostic systems most commonly used for HCC patients could be revised by using these optimally selected cut points for QoL scales. Almost all revised prognostic classifications clearly improved the accuracy of overall survival prediction and each classification (except BoBar) included two QoL scales. Moreover, the variables added to each prognostic classification after dichotomization of QoL scales were very similar to those added when QoL scales were treated as continuous variables. Furthermore, Harrell’s C-indices did not vary substantially for all the prognostic systems regardless of the type of QoL scale analysis (continuous vs. dichotomized) (Table 3); therefore, our proposed cut points can be considered optimal in terms of prognosis.
On average, IDI was significantly different from zero, indicating that inclusion of QoL scales in the prognostic classification was associated with a more marked improvement of the sensitivity to detect patients likely to die by a defined time point. IDI was uniformly good for the revised BCLC and CLIP staging systems (compared with the original BCLC and CLIP, respectively). On average, a >10% improvement was observed for the sensitivity to predict death for the new BCLC, regardless of the time point (3, 6, or 12 months), whereas the improvement in sensitivity was ∼5% for the new CLIP. IDI was significantly different from zero (95% CI did not include zero) at 3 months but not at 6 and 12 months for the revised CLIP (compared with CLIP plus World Health Organization performance status [WHO PS]). This result highlighted the fact that taking QoL scales into account could improve identification of patients likely to die within 3 months compared with the CLIP plus WHO PS. In other words, QoL scales assessed by the patient allow more accurate detection of the patient’s symptom burden than the WHO PS completed by the clinician. This result is concordant with the findings of Efficace et al. [29] regarding physicians’ underestimation of symptoms for patients with chronic myeloid leukemia. Quality-of-life scales could be selected as inclusion or exclusion criteria and as stratification factors. These staging systems including QoL scales allow the physician to take into account the patient’s perception of his or her disease.
The good performance of the revised BCLC was achieved after adding six new variables, confirming the limited prognostic value of BCLC alone for advanced HCC patients [15, 16].
We did not perform a sensitivity analysis because previous results [3] showed that imputing missing QoL scales did not significantly change the results of complete case analysis.
Recently, the European Association for the Study of the Liver (EASL) and EORTC group [16] stated that in cancer studies, QoL is the third most important endpoint in terms of strength of evidence after overall mortality and cause-specific mortality. QoL was then ranked above the well-known surrogate endpoints in oncology: progression-free survival, disease-free survival, time to treatment failure, and tumor response. These endpoints are defined with a binary event (presence vs. absence). A binary definition of QoL, as proposed in this study, could facilitate the definition of a recommended target value for a given QoL scale and its use by investigators as an endpoint for phase II and phase III trials.
The widely accepted European Organization for Research and Treatment of Cancer QLQ-C30 questionnaire, translated into several languages and used in numerous clinical trials in oncology, was used in this study; however, unfortunately, our study did not include the HCC18 module for HCC patients, and that constituted a limitation. It would have been preferable to identify the independent prognostic components of this module, to propose cut points for each component, and to include them in the revised prognostic systems. Although internal validity by bootstrapping was good, our revised prognostic indices need to be prospectively validated in independent cohorts of advanced HCC patients.
From a statistical point of view, Faraggi and Simon [18] showed through simulation that their cross-validation method controls the type I error, avoiding the frequently reported inflation of type I error in studies designed to detect an optimal cut point.
We believe our study addresses the need to refine the original BCLC class C [15, 16], corresponding to patients with advanced HCC, and that our revised BCLC, CLIP, GRETCH, and BoBar staging systems could be used for these patients.
Our work constitutes a step in the direction of the recommendations proposed by Gotay et al. [30] to determine the appropriate scales and cut points for stratification and eligibility determination. We expect that similar research will be performed in other types of cancer.
We believe that this dichotomization of QoL scales will facilitate integration of QoL scales in decision making for the treatment of patients with advanced HCC patients and use in future clinical trial planning.
Conclusion
The cutoff points for the six QoL scales could be used to evaluate the well-being of patients with advanced HCC before starting any treatment because most patients receive sorafenib, for which the most common adverse effects are diarrhea and fatigue. Patients with these two symptoms before treatment should be closely monitored. The cutoff points could also be used alone (or in revised prognostic classifications after prospective validation) in the design of clinical trials to define eligibility criteria or stratification factors.
See http://www.TheOncologist.com for supplemental material available online.
Supplementary Material
Acknowledgments
We thank the Fédération Française de Cancérologie Digestive for data supply. We also thank the Coordination de la Recherche Clinique et de l’Innovation, CHU Amiens, and Réseau des Investigateurs pour le Carcinome Hépatocéllulaire for funding (correction of English language). We thank the reviewer for useful comments. This abstract was presented at the European Society for Medical Oncology annual meeting 2012 in Vienna, Austria (abstract 1430P).
Footnotes
For Further Reading: Zhong-Zhe Lin, Chiun Hsu, Fu-Chang Hu et al. Factors Impacting Prognosis Prediction in BCLC Stage C and Child-Pugh Class A Hepatocellular Carcinoma Patients in Prospective Clinical Trials of Systemic Therapy. The Oncologist 2012;17:970–977.
Abstract:
Background. The purpose of this study was to determine the prognostic significance of clinical factors and staging systems for survival of hepatocellular carcinoma (HCC) patients who are candidates for therapeutic clinical trials.
Methods. From December 1990 to July 2005, 236 patients with unresectable HCC were enrolled into six published phase II trials assessing various therapeutic regimens. Of these, 156 chemotherapy-naïve patients with Child-Pugh class A and Barcelona Clinic Liver Cancer stage C disease were included in this analysis. Twenty-seven relevant clinical characteristics were analyzed to identify prognostic factors of survival. Beyond these prognosticators, the predictive ability of eight staging systems (the tumor–node–metastasis, Okuda, Cancer of the Liver Italian Program [CLIP], Chinese University Prognostic Index, Japanese Integrated Staging, Tokyo, National Taiwan University Risk Estimation, and Advanced Liver Cancer Prognostic System [ALCPS] score) were compared using the Akaike information criteria.
Results. The median overall survival time was 129 days (95% confidence interval, 111–147 days). Significant predictors of a shorter overall survival time were an Eastern Cooperative Oncology Group performance status score ≥2, the presence of symptoms, ascites, an aspartate transaminase level more than two times the upper limit of normal, and regional lymph node involvement. The ALCPS and CLIP scores were superior to the other systems for predicting survival.
Conclusions. The prognosis of patients with advanced HCC who are candidates for therapeutic clinical trials is affected by several factors related to the patient, liver function, and the tumor. The ALCPS and CLIP scores appear to be superior to the other systems for predicting survival.
Author Contributions
Conception/Design: Momar Diouf, Franck Bonnetain, Xavier Paoletti, Thomas Filleron
Provision of study material or patients: Jean-Claude Barbare, Olivier Bouché, Laetitia Dahan
Collection and/or assembly of data: Jean-Claude Barbare, Olivier Bouché, Laetitia Dahan
Data analysis and interpretation: Momar Diouf, Franck Bonnetain, Xavier Paoletti, Thomas Filleron
Manuscript writing: Momar Diouf, Franck Bonnetain, Thomas Filleron
Final approval of manuscript: Momar Diouf, Franck Bonnetain, Jean-Claude Barbare, Olivier Bouché, Laetitia Dahan, Xavier Paoletti, Thomas Filleron
Disclosures
Jean-Claude Barbare: Bayer Pharma (C/A); Olivier Bouché: Bayer (H). The other authors indicated no financial relationships.
(C/A) Consulting/advisory relationship; (RF) Research funding; (E) Employment; (ET) Expert testimony; (H) Honoraria received; (OI) Ownership interests; (IP) Intellectual property rights/inventor/patent holder; (SAB) Scientific advisory board
References
- 1.Jemal A, Center MM, DeSantis C, et al. Global patterns of cancer incidence and mortality rates and trends. Cancer Epidemiol Biomarkers Prev. 2010;19:1893–1907. doi: 10.1158/1055-9965.EPI-10-0437. [DOI] [PubMed] [Google Scholar]
- 2.Llovet JM, Burroughs A, Bruix J. Hepatocellular carcinoma. Lancet. 2003;362:1907–1917. doi: 10.1016/S0140-6736(03)14964-1. [DOI] [PubMed] [Google Scholar]
- 3.Diouf M, Filleron T, Barbare JC, et al. The added value of quality of life (QoL) for prognosis of overall survival in patients with palliative hepatocellular carcinoma. J Hepatol. 2013;58:509–521. doi: 10.1016/j.jhep.2012.11.019. [DOI] [PubMed] [Google Scholar]
- 4.Bonnetain F, Paoletti X, Collette S, et al. Quality of life as a prognostic factor of overall survival in patients with advanced hepatocellular carcinoma: Results from two French clinical trials. Qual Life Res. 2008;17:831–843. doi: 10.1007/s11136-008-9365-y. [DOI] [PubMed] [Google Scholar]
- 5.Yeo W, Mo FKF, Koh J, et al. Quality of life is predictive of survival in patients with unresectable hepatocellular carcinoma. Ann Oncol. 2006;17:1083–1089. doi: 10.1093/annonc/mdl065. [DOI] [PubMed] [Google Scholar]
- 6.Quinten C, Coens C, Mauer M, et al. Baseline quality of life as a prognostic indicator of survival: A meta-analysis of individual patient data from EORTC clinical trials. Lancet Oncol. 2009;10:865–871. doi: 10.1016/S1470-2045(09)70200-1. [DOI] [PubMed] [Google Scholar]
- 7.Royston P, Altman DG, Sauerbrei W. Dichotomizing continuous predictors in multiple regression: A bad idea. Stat Med. 2006;25:127–141. doi: 10.1002/sim.2331. [DOI] [PubMed] [Google Scholar]
- 8.Roychowdhury DF, Hayden A, Liepa AM. Health-related quality-of-life parameters as independent prognostic factors in advanced or metastatic bladder cancer. J Clin Oncol. 2003;21:673–678. doi: 10.1200/JCO.2003.04.166. [DOI] [PubMed] [Google Scholar]
- 9.Mazumdar M, Glassman JR. Categorizing a prognostic variable: Review of methods, code for easy implementation and applications to decision-making about cancer treatments. Stat Med. 2000;19:113–132. doi: 10.1002/(sici)1097-0258(20000115)19:1<113::aid-sim245>3.0.co;2-o. [DOI] [PubMed] [Google Scholar]
- 10. Williams BA Mandrekar JN, Mandrekar SJ et al. Finding optimal cutpoints for continuous covariates with binary and time-to-event outcomes. Technical Report Series #79. Rochester, MN: Mayo Clinic, 2006., Available at http://www.mayo.edu/research/documents/biostat-79pdf/doc-10027230. [Google Scholar]
- 11.Altman DG, Lausen B, Sauerbrei W, et al. Dangers of using “optimal” cutpoints in the evaluation of prognostic factors. J Natl Cancer Inst. 1994;86:829–835. doi: 10.1093/jnci/86.11.829. [DOI] [PubMed] [Google Scholar]
- 12.A new prognostic system for hepatocellular carcinoma: A retrospective study of 435 patients: The Cancer of the Liver Italian Program (CLIP) investigators. Hepatology. 1998;28:751–755. doi: 10.1002/hep.510280322. [DOI] [PubMed] [Google Scholar]
- 13.Llovet JM, Brú C, Bruix J. Prognosis of hepatocellular carcinoma: The BCLC staging classification. Semin Liver Dis. 1999;19:329–338. doi: 10.1055/s-2007-1007122. [DOI] [PubMed] [Google Scholar]
- 14.Chevret S, Trinchet JC, Mathieu D, et al. A new prognostic classification for predicting survival in patients with hepatocellular carcinoma. Groupe d’Etude et de Traitement du Carcinome Hépatocellulaire. J Hepatol. 1999;31:133–141. doi: 10.1016/s0168-8278(99)80173-1. [DOI] [PubMed] [Google Scholar]
- 15.Tournoux-Facon C, Paoletti X, Barbare JC, et al. Development and validation of a new prognostic score of death for patients with hepatocellular carcinoma in palliative setting. J Hepatol. 2011;54:108–114. doi: 10.1016/j.jhep.2010.06.015. [DOI] [PubMed] [Google Scholar]
- 16.European Association For The Study Of The Liver. European Organisation For Research And Treatment Of Cancer EASL-EORTC clinical practice guidelines: Management of hepatocellular carcinoma. J Hepatol. 2012;56:908–943. doi: 10.1016/j.jhep.2011.12.001. [DOI] [PubMed] [Google Scholar]
- 17.Huitzil-Melendez FD, Capanu M, O’Reilly EM, et al. Advanced hepatocellular carcinoma: Which staging systems best predict prognosis? J Clin Oncol. 2010;28:2889–2895. doi: 10.1200/JCO.2009.25.9895. [DOI] [PMC free article] [PubMed] [Google Scholar]
- 18.Faraggi D, Simon R. A simulation study of cross-validation for selecting an optimal cutpoint in univariate survival analysis. Stat Med. 1996;15:2203–2213. doi: 10.1002/(SICI)1097-0258(19961030)15:20<2203::AID-SIM357>3.0.CO;2-G. [DOI] [PubMed] [Google Scholar]
- 19.Barbare JC, Bouché O, Bonnetain F, et al. Treatment of advanced hepatocellular carcinoma with long-acting octreotide: A phase III multicentre, randomised, double blind placebo-controlled study. Eur J Cancer. 2009;45:1788–1797. doi: 10.1016/j.ejca.2009.02.018. [DOI] [PubMed] [Google Scholar]
- 20.Aaronson NK, Ahmedzai S, Bergman B, et al. The European Organization for Research and Treatment of Cancer QLQ-C30. A quality-of-life instrument for use in international clinical trials in oncology. J Natl Cancer Inst. 1993;85:365–376. doi: 10.1093/jnci/85.5.365. [DOI] [PubMed] [Google Scholar]
- 21.Fayers PM, Aaronson NK, Bjordal K, et al. The EORTC QLQ-C30 Scoring Manual. 3rd ed. Brussels, Belgium: European Organization for Research and Treatment of Cancer; 2001. [Google Scholar]
- 22.Vinh-Hung V, Verkooijen HM, Fioretta G, et al. Lymph node ratio as an alternative to pN staging in node-positive breast cancer. J Clin Oncol. 2009;27:1062–1068. doi: 10.1200/JCO.2008.18.6965. [DOI] [PubMed] [Google Scholar]
- 23.Holländer N, Sauerbrei W, Schumacher M. Confidence intervals for the effect of a prognostic factor after selection of an ‘optimal’ cutpoint. Stat Med. 2004;23:1701–1713. doi: 10.1002/sim.1611. [DOI] [PubMed] [Google Scholar]
- 24.Van Steen K, Curran D, Kramer J, et al. Multicollinearity in prognostic factor analyses using the EORTC QLQ-C30: Identification and impact on model selection. Stat Med. 2002;21:3865–3884. doi: 10.1002/sim.1358. [DOI] [PubMed] [Google Scholar]
- 25.Harrell FE, Jr, Lee KL, Mark DB. Multivariable prognostic models: Issues in developing models, evaluating assumptions and adequacy, and measuring and reducing errors. Stat Med. 1996;15:361–387. doi: 10.1002/(SICI)1097-0258(19960229)15:4<361::AID-SIM168>3.0.CO;2-4. [DOI] [PubMed] [Google Scholar]
- 26.Pencina MJ, D’Agostino RB, Sr, Steyerberg EW. Extensions of net reclassification improvement calculations to measure usefulness of new biomarkers. Stat Med. 2011;30:11–21. doi: 10.1002/sim.4085. [DOI] [PMC free article] [PubMed] [Google Scholar]
- 27.Pencina MJ, D’Agostino RB, Sr, D’Agostino RB, Jr, et al. Evaluating the added predictive ability of a new marker: From area under the ROC curve to reclassification and beyond. Stat Med. 2008;27:157–172; discussion 207–212. doi: 10.1002/sim.2929. [DOI] [PubMed] [Google Scholar]
- 28.Kaplan EL, Meier P. Nonparametric estimation from incomplete observations. J Am Stat Assoc. 1958;53:457–481. [Google Scholar]
- 29.Efficace F, Rosti G, Aaronson N, et al. Patient- versus physician-reporting of symptoms and health status in chronic myeloid leukemia. Haematologica. 2014;99:788–793. doi: 10.3324/haematol.2013.093724. [DOI] [PMC free article] [PubMed] [Google Scholar]
- 30.Gotay CC, Kawamoto CT, Bottomley A, et al. The prognostic significance of patient-reported outcomes in cancer clinical trials. J Clin Oncol. 2008;26:1355–1363. doi: 10.1200/JCO.2007.13.3439. [DOI] [PubMed] [Google Scholar]
Associated Data
This section collects any data citations, data availability statements, or supplementary materials included in this article.


