

Abstract
Summary: For practical and robust de novo identification of genomic fusions and breakpoints from targeted paired-end DNA sequencing data, we developed Fusion And Chromosomal Translocation Enumeration and Recovery Algorithm (FACTERA). Our method has minimal external dependencies, works directly on a preexisting Binary Alignment/Map file and produces easily interpretable output. We demonstrate FACTERA’s ability to rapidly identify breakpoint-resolution fusion events with high sensitivity and specificity in patients with non-small cell lung cancer, including novel rearrangements. We anticipate that FACTERA will be broadly applicable to the discovery and analysis of clinically relevant fusions from both targeted and genome-wide sequencing datasets.
Availability and implementation: http://factera.stanford.edu.
Contact: arasha@stanford.edu or diehn@stanford.edu
Supplementary information: Supplementary data are available at Bioinformatics online.
1 INTRODUCTION
DNA rearrangements resulting in gene fusions represent a major class of somatically acquired structural variation in human malignancies. Notable examples include the highly recurrent association of the Philadelphia chromosome in chronic myelogenous leukemia (Nowell and Hungerford, 1960) and t(14;18)(q32;q21) translocations in follicular lymphomas (Tsujimoto et al., 1984). More recently, recurrent fusions involving ALK, ROS1, RET or NTRK1 were identified in non-small cell lung cancer (NSCLC) (Bergethon et al., 2012; Govindan et al., 2012; Imielinski et al., 2012; Kwak et al., 2010; Vaishnavi et al., 2013) and TMPRSS2-ERG in prostate cancer (Tomlins et al., 2005). Many structural rearrangements are oncogenic driver mutations and are increasingly therapeutically targetable (Bergethon et al., 2012; Druker et al., 1996; Kwak et al., 2010). Owing to their unique junctional sequences, fusions can also serve as exquisitely sensitive biomarkers of tumor burden in cell-free DNA, which is continuously shed into diverse body fluids (Leary et al., 2010; McBride et al., 2010; Newman et al., 2014).
Advances in targeted high-throughput sequencing have enabled interrogation of virtually any genomic region at low cost, facilitating large-scale analysis of genetic variation. Recently, we designed a 125 kb targeted sequencing panel for ultrasensitive assessment of circulating tumor DNA (ctDNA) in NSCLC (Newman et al., 2014). To capture fusions, we included intronic regions from genes known to participate in NSCLC rearrangements (e.g. ALK, ROS1) and developed a novel framework for fusion and breakpoint detection.
Here, we describe and benchmark FACTERA, a new software tool for the discovery of genomic rearrangements, including translocations, inversions and deletions. Because previous methods for fusion discovery perform well in simulated data but tend to overestimate breakpoints in real tumor genomes (Schroder et al., 2014), FACTERA was designed to detect fusion genes with high specificity without compromising sensitivity. Using data from NSCLC tumors and cell lines, we show that FACTERA compares favorably to previous approaches, achieves high sensitivity and specificity, and precisely and efficiently characterizes fusion genes and breakpoints in targeted sequencing data.
2 METHODS
The FACTERA method is schematically depicted in Figure 1. As input, FACTERA requires (i) a Binary Alignment/Map (BAM) file of paired-end reads mapped by an alignment tool capable of ‘soft clipping’, such as Burrows-Wheeler Aligner (BWA) (Li and Durbin, 2009), (ii) genomic coordinates (in Browser Extensible Data [BED] format) used to control the resolution of fusion discovery via the locations of genes, exons or other genomic units and (iii) a 2BIT reference genome to enable fast sequence retrieval (e.g. UCSC hg19.2 bit).
Fig. 1.
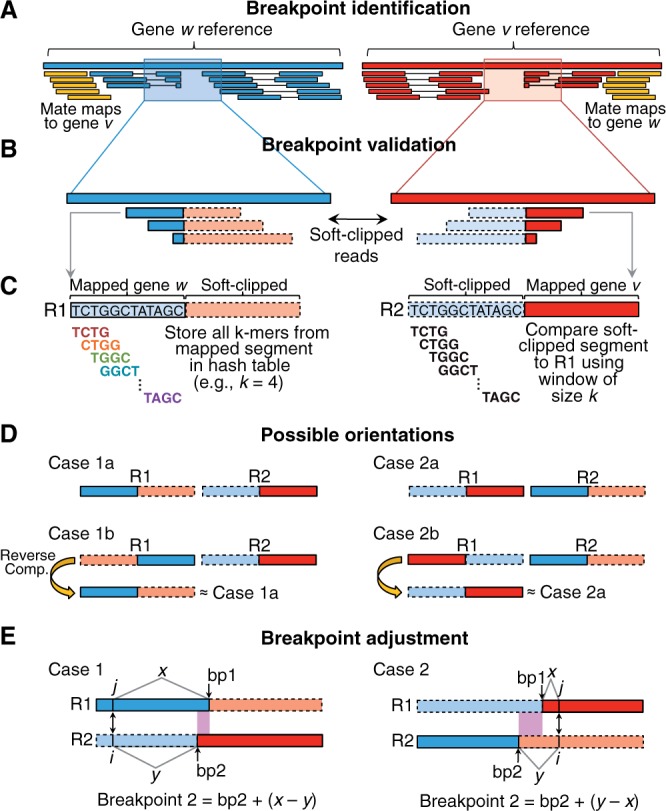
FACTERA analytical pipeline for breakpoint mapping. (A–E) Major steps used to precisely identify genomic breakpoints are anecdotally illustrated using two hypothetical genes, w and v
FACTERA can identify fusions between any pair of genomic regions provided as input coordinates (above), though for simplicity, we describe the algorithm in the context of gene–gene fusions below. Input BAM files are processed in three key phases: identification of discordant read clusters, detection of breakpoints at nucleotide resolution and in silico validation of candidate fusions.
In phase one, improperly paired (or ‘discordant’) reads discovered after mapping of paired-end sequencing of individual DNA fragments, are used to locate genomic regions R (e.g. genes w and v in Fig. 1) involved in potential fusions (yellow reads in Fig. 1A). Such reads either map to different chromosomes or are separated by an unexpectedly large insert size (i.e. total fragment length). In our example, the closest exon of each discordant read is used to cluster discordant reads into distinct gene–gene groups. For every group, a genomic region Ri is defined for each gene by taking the minimum of all 3′ coordinates in the cluster (exons and discordant reads) and the maximum of all 5′ coordinates in the same. Genomic regions linked by at least two unique discordant read pairs (by default) are used to prioritize the search for breakpoints in the next phase.
The clipped boundaries of truncated (or ‘soft-clipped’) reads represent potential fusion breakpoints (Fig. 1B). To assess candidate breakpoints, FACTERA selects the n candidates with greatest read support in each region Ri (n = 5, by default) and analyzes all pairwise combinations of these candidates between genes. For each breakpoint combination, FACTERA compares representative soft-clipped reads, R1 and R2 (Fig. 1C), selected such that (i) each has a cut-point closest to the middle of a full length read, and (ii) the soft-clipped segment of R2 exceeds 15 bases (by default, to reduce non-specific alignments). If R1 and R2 derive from a fusion sequence, then the mapped portion of R1 should match the soft-clipped portion of R2 and vice versa. This is assessed using fast k-mer indexing and comparison (Fig. 1C). Specifically, the mapped region of R1 is parsed into all possible subsequences of length k (i.e. k-mers) using a sliding window (k = 10, by default). Each k-mer is stored in a hash table, along with its lowest sequence index in R1. Next, the soft-clipped sequence of R2 is iteratively parsed into subsequences of length k, and the hash table is interrogated for matches. If a minimum matching threshold is achieved [=max(k, 0.5 × the minimum length of the 2 compared subsequences)], then the reads are considered concordant and indicative of a candidate fusion.
Four orientations of R1 and R2 are possible (Fig. 1D). However, only cases 1a and 2a shown in Figure 1D can generate valid fusions, as their reads have soft-clipped sequences facing opposite directions. Thus, before k-mer comparison (Fig. 1C), the reverse complement of R1 is taken for cases 1b and 2b, respectively, converting them into cases 1a and 2a. Separately, in some cases short sequences surrounding breakpoints are either similar or identical (i.e. microhomologous sequences), hindering unambiguous breakpoint determination using the approach described above. Let iterators i and j denote the first matching sequence positions between the non-clipped and soft-clipped segments of R1 and R2, respectively. To reconcile sequence overlap, FACTERA arbitrarily adjusts the breakpoint in R2 (i.e. bp2 in Fig. 1E) to match R1 (i.e. bp1 in Fig. 1E) using the sequence offset determined by differences in distance between bp2 and i and bp1 and j (Fig. 1E).
Finally, to verify candidate fusions following read comparison and breakpoint adjustment, FACTERA aligns all soft-clipped and unmapped reads against each candidate fusion sequence (±500 bp padding around the breakpoint) using BLASTN. Reads that map with at least 95% identity and exceeding 90% of the input read length (by default) are retained, and reads that span or flank the breakpoint are enumerated. Output redundancy is eliminated by removing fusion sequences within a 20 nt interval of any fusion sequence with greater read support and with the same sequence orientation (to avoid removing reciprocal fusions). By default, all fusions with at least five breakpoint-spanning reads are reported; however, we note that FACTERA produced the same output described in Results when only one soft-clipped read from each breakpoint was required.
In addition to the basic algorithm, several heuristics were implemented to improve performance. First, to increase specificity, k-mer comparison is used to assess similarity between the soft-clipped portion of R1 and mapped portion of R2 in addition to the opposite scenario shown in Figure 1C. The same matching threshold described above is required for further consideration of a candidate fusion. Moreover, if breakpoint adjustment is applied initially (Fig. 1E), an equal but opposite breakpoint offset is required for the reciprocal comparison in order for the candidate fusion to proceed. Second, to suppress errors, a consensus sequence is derived from soft-clipped segments that share the same putative breakpoint (e.g. Fig. 1C), and this ‘corrected’ sequence is used for read comparison. Third, if breakpoint adjustment is required for R2, the subsequence in R2 between both original breakpoints (i.e. bp1 and bp2 in Fig. 1E) is compared with the corresponding sequence in the reference genome. If the two sequences are identical, the breakpoint adjustment is performed to R2 (i.e. gene 2). Otherwise, an equal but opposite breakpoint adjustment is performed to R1 (i.e. gene 1), while no adjustment is made for R2. This subroutine reduces the impact of alignment errors on breakpoint adjustment. For further details, including implementation and output, see Supplementary Notes.
3 RESULTS
To evaluate FACTERA’s performance, we applied our 125 kb sequencing panel to eight NSCLC tumor genomes, consisting of six patients and two cell lines (NCI-H3122, HCC78), all harboring a known rearrangement in ALK or ROS1 as confirmed by FISH (Bergethon et al., 2012; McDermott et al., 2008; Newman et al., 2014). FACTERA identified 16 inter-gene fusions with a median of two fusions per sample, confirming all known ALK and ROS1 fusions while precisely characterizing unknown partner genes, breakpoints and reciprocal events (Supplementary Table S1). For example, FACTERA detected a balanced SLC34A2-ROS1 translocation in HCC78, whereas in patient 9 (P9), it identified a reciprocal EML4-ALK intrachromosomal fusion (inversion) along with two novel ROS1 fusion partners (MKX, FYN). Both novel ROS1 fusion events, along with three additional fusions in three samples, were validated by qPCR (Supplementary Fig. S1). Moreover, in every examined instance, predicted breakpoints were experimentally verified (n = 3; Supplementary Fig. S2). Notably, while our capture panel was designed to target ALK and ROS1 without knowledge of their partners, FACTERA readily identified both known (EML4, KIF5B, SLC34A2 and CD74) and novel translocation partners for these genes.
Next, we assessed FACTERA’s sensitivity and specificity. Because all 14 fusions involving ALK or ROS1 were either experimentally confirmed or represent a reciprocal partner of a validated fusion, we considered all such events true positives. Previous whole-genome sequencing studies reported a mean of 10–100 structural rearrangements per NSCLC tumor (Govindan et al., 2012; Imielinski et al., 2012), indicating that less than one fusion should be expected within our 125 kb capture panel by random chance. The ALK and ROS1 fusions are, therefore, likely to comprise most, if not all, of the detectable structural rearrangements within our eight sequencing samples, suggesting a high sensitivity. Because the remaining candidate fusions (KRTAP5-5/KRTAP5-7) identified by FACTERA map to repetitive genomic regions, they arguably represent false positives arising from misalignment. These candidates were readily eliminated using the UCSC RepeatMasker track, resulting in 100% specificity without affecting true positives (Supplementary Methods). If this step was omitted, FACTERA achieved a specificity of 88% (14 of 16 fusions).
Using the same datasets, we then compared FACTERA results with five previous fusion detection methods (Table 1, Supplementary Table S2) (Chen et al., 2009; Hart et al., 2013; Rausch et al., 2012; Schroder et al., 2014; Wang et al., 2011). Only Socrates and DELLY achieved a sensitivity of 100% relative to FACTERA; however, both reported many more candidate fusions (Table 1). As such, we examined their outputs for concordant predictions, reasoning that any such events might represent true fusions. From > 1400 candidates compared, only 15 fusions were found in common between them, of which 14 were also identified by FACTERA (Supplementary Table S3).
Table 1.
Benchmarking results for breakpoint detection
| Method | Median fusions | Sensitivity (%) | Specificity (%) | Runtime (min)a |
|---|---|---|---|---|
| FACTERA | 2 | 100.00 | 87.50 | 1.5 |
| DELLY | 181 | 100.00 | 0.98 | 15.0 |
| Socratesb | 190 | 100.00 | 0.72 | 2.1 |
| SoftSearch | 730 | 21.43 | 0.03 | 20.4 |
| CREST | 10 | 37.50 | 5.66 | 19.0 |
| BreakDancerc | 996 | n/a | n/a | 0.9 |
Note: Benchmarking performance for six fusion detection methods applied to eight NSCLC samples (for all data, see Supplementary Table 2; also see Supplementary Methods).
aMean.
bSpecificity is 3.7% if candidate fusions with <100 bp between breakpoints are removed.
cWhile BreakDancer was not designed to precisely resolve junctional sequences, it did identify the correct gene partners for all true-positive fusions.
Because the remaining candidates were unique to each method, we assessed whether they could be false positives. We evaluated HCC78 genomic DNA by PCR for putative fusions called by either DELLY or Socrates, but not both (Supplementary Fig. S3, Supplementary Table S4). Consistent with our concordance analysis, none of these fusion candidates could be detected, suggesting they arose from library preparation or sequencing-related artifacts. In contrast, primers targeting SLC34A2-ROS1 (a fusion identified by all three methods) yielded the correct product (Supplementary Fig. S3).
Finally, a 715 bp fusion within EIF3E (patient P7) was predicted by both DELLY and Socrates, but missed by FACTERA. While FACTERA was originally used to detect intergene fusions, when reapplied to detect inter- and intragenetic events (Section 2), the same fusion was identified along with all 14 fusions previously detected, with zero false positives (Supplementary Table S2).
4 CONCLUSIONS
The low specificity of previous methods highlights the need for novel and more accurate DNA fusion detection approaches. We have shown that FACTERA is a highly sensitive and specific method for the detection of fusion genes and breakpoints in targeted sequencing data. Moreover, FACTERA can be applied to any BAM file with paired-end and soft-clipped reads, including data from whole genome shotgun sequencing (see Supplementary Notes). Although originally implemented for fusion detection in ctDNA applications, we plan to continue developing FACTERA to facilitate broader usage, including adding support for CPU parallelization, untemplated DNA segments (e.g. N-D-N regions in V(D)J rearrangements of the immunoglobulin heavy chain locus) and single-read datasets.
Funding: This work was supported by the Stanford Cancer Institute Genomics Initiative (A.A.A., M.D.); the Doris Duke Charitable Foundation (A.A.A., M.D.); the US Department of Defense (LCRP Promising Clinician Research Award to M.D., A.A.A.; W81XWH-12-1-0498 to A.M.N.); the US National Institutes of Health Director’s New Innovator Award Program (1-DP2-CA186569 to M.D.); the Damon Runyon Cancer Research Foundation (A.A.A.); the Lymphoma Research Foundation (A.A.A.); the Gabrielle's Angel Foundation (A.A.A.); the Radiological Society of North America (RR1221 to S.V.B.); and the Thomas & Stacey Siebel Foundation (A.M.N.).
Conflict of interest: none declared.
Supplementary Material
REFERENCES
- Bergethon K, et al. ROS1 rearrangements define a unique molecular class of lung cancers. J. Clin. Oncol. 2012;30:863–870. doi: 10.1200/JCO.2011.35.6345. [DOI] [PMC free article] [PubMed] [Google Scholar]
- Chen K, et al. BreakDancer: an algorithm for high-resolution mapping of genomic structural variation. Nat. Methods. 2009;6:677–681. doi: 10.1038/nmeth.1363. [DOI] [PMC free article] [PubMed] [Google Scholar]
- Druker BJ, et al. Effects of a selective inhibitor of the Abl tyrosine kinase on the growth of Bcr-Abl positive cells. Nat. Med. 1996;2:561–566. doi: 10.1038/nm0596-561. [DOI] [PubMed] [Google Scholar]
- Govindan R, et al. Genomic landscape of non-small cell lung cancer in smokers and never-smokers. Cell. 2012;150:1121–1134. doi: 10.1016/j.cell.2012.08.024. [DOI] [PMC free article] [PubMed] [Google Scholar]
- Hart SN, et al. SoftSearch: integration of multiple sequence features to identify breakpoints of structural variations. PLoS One. 2013;8:e83356. doi: 10.1371/journal.pone.0083356. [DOI] [PMC free article] [PubMed] [Google Scholar]
- Imielinski M, et al. Mapping the hallmarks of lung adenocarcinoma with massively parallel sequencing. Cell. 2012;150:1107–1120. doi: 10.1016/j.cell.2012.08.029. [DOI] [PMC free article] [PubMed] [Google Scholar]
- Kwak EL, et al. Anaplastic lymphoma kinase inhibition in non-small-cell lung cancer. N. Engl. J. Med. 2010;363:1693–1703. doi: 10.1056/NEJMoa1006448. [DOI] [PMC free article] [PubMed] [Google Scholar]
- Leary RJ, et al. Development of personalized tumor biomarkers using massively parallel sequencing. Sci. Transl. Med. 2010;2:20ra14. doi: 10.1126/scitranslmed.3000702. [DOI] [PMC free article] [PubMed] [Google Scholar]
- Li H, Durbin R. Fast and accurate short read alignment with Burrows-Wheeler transform. Bioinformatics. 2009;25:1754–1760. doi: 10.1093/bioinformatics/btp324. [DOI] [PMC free article] [PubMed] [Google Scholar]
- McBride DJ, et al. Use of cancer-specific genomic rearrangements to quantify disease burden in plasma from patients with solid tumors. Genes Chromosomes Cancer. 2010;49:1062–1069. doi: 10.1002/gcc.20815. [DOI] [PMC free article] [PubMed] [Google Scholar]
- McDermott U, et al. Genomic alterations of anaplastic lymphoma kinase may sensitize tumors to anaplastic lymphoma kinase inhibitors. Cancer Res. 2008;68:3389–3395. doi: 10.1158/0008-5472.CAN-07-6186. [DOI] [PubMed] [Google Scholar]
- Newman AM, et al. An ultrasensitive method for quantitating circulating tumor DNA with broad patient coverage. Nat. Med. 2014;20:548–554. doi: 10.1038/nm.3519. [DOI] [PMC free article] [PubMed] [Google Scholar]
- Nowell PC, Hungerford DA. A minute chromosome in human chronic granulocytic leukemia. Science. 1960;142:1497. doi: 10.1126/science.144.3623.1229. [DOI] [PubMed] [Google Scholar]
- Rausch T, et al. DELLY: structural variant discovery by integrated paired-end and split-read analysis. Bioinformatics. 2012;28:i333–i339. doi: 10.1093/bioinformatics/bts378. [DOI] [PMC free article] [PubMed] [Google Scholar]
- Schroder J, et al. Socrates: identification of genomic rearrangements in tumour genomes by re-aligning soft clipped reads. Bioinformatics. 2014;30:1064–1072. doi: 10.1093/bioinformatics/btt767. [DOI] [PMC free article] [PubMed] [Google Scholar]
- Tomlins SA, et al. Recurrent fusion of TMPRSS2 and ETS transcription factor genes in prostate cancer. Science. 2005;310:644–648. doi: 10.1126/science.1117679. [DOI] [PubMed] [Google Scholar]
- Tsujimoto Y, et al. Cloning of the chromosome breakpoint of neoplastic B cells with the t(14;18) chromosome translocation. Science. 1984;226:1097–1099. doi: 10.1126/science.6093263. [DOI] [PubMed] [Google Scholar]
- Vaishnavi A, et al. Oncogenic and drug-sensitive NTRK1 rearrangements in lung cancer. Nat. Med. 2013;19:1469–1472. doi: 10.1038/nm.3352. [DOI] [PMC free article] [PubMed] [Google Scholar]
- Wang J, et al. CREST maps somatic structural variation in cancer genomes with base-pair resolution. Nat. Methods. 2011;8:652–654. doi: 10.1038/nmeth.1628. [DOI] [PMC free article] [PubMed] [Google Scholar]
Associated Data
This section collects any data citations, data availability statements, or supplementary materials included in this article.