

Abstract
Objective:
To investigate the utility of bone-marrow-derived mononuclear cells (BMNCs) and insulin like growth factor-1 (IGF-1) in articular cartilage repair.
Design:
An osteochondral defect of 3 mm diameter and 5 mm depth was created in patellar groove of the left knee joint in each of 36 New Zealand White rabbits. The defect was filled with RPMI-1640 medium in group A (control), autologous BMNCs in group B, and autologous BMNCs plus IGF-1 in group C (n = 12). Healing of the defect was assessed by gross, scanning electron microscopic, radiographic, and histological examinations up to 90 days.
Results:
Gross and scanning electron microscopic examination of the healing site revealed superior gross morphology and surface architecture of the healing tissue in the animals of group C as compared to other groups. Radiographically on day 90, the defect area was not distinguishable from the surrounding area in group C, but a small circular defect area was still evident in groups A and B. The regenerated tissue was mostly hyaline in group C and fibrocartilage in groups A and B. The cells were well organized and showed better deposition of proteoglycans in groups C and B than in group A.
Conclusions:
It was concluded that implantation of bone-marrow-derived nucleated cells may facilitate the healing of osteochondral defects; however, the combination of BMNCs and IGF-1 induces faster and histologically better healing than the BMNCs alone.
Keywords: articular cartilage, bone-marrow-derived mononuclear cells, rabbits, insulin like growth factor-1
Introduction
Cartilage has limited capacity for regeneration, and when a lesion is limited to the articular cartilage only and does not extend to the underlying bone, it fails to heal spontaneously,1-3 leading to the development of osteoarthritis, lameness, and permanent disability. Osteochondral defects though may heal spontaneously, and the repaired tissue is not a true hyaline cartilage but a fibrocartilage, which is weaker in structure and mechanical competence.3 Attempts have been made to find a suitable treatment for such injuries, but no treatment has yet resulted in the restoration of hyaline cartilage and subchondral bone to a normal state.4-6
Implantation of autologous chondrocytes to repair articular cartilage injury has yielded promising results.7,8 However, this procedure has several potential disadvantages, such as loss of chondrogenic phenotype of expanded chondrocytes,9-11 nonavailability of adequate healthy donor tissue, small number of isolated chondrocytes, and invasive surgical methods.12,13
Mesenchymal stem cells (MSCs) are an attractive alternative cell source not only for patients with focal cartilage lesion but also for those with osteoarthritis.14-16 Transplantation of cultured MSCs in articular cartilage defects has resulted in qualitatively better healing than that by chondrocyte implantation.17 However, culture expansion of MSCs involves technical expertise and sophisticated laboratory logistics, which may not be available in many hospital settings.
Autologous bone marrow cells may be a cheap and practical alternative to transplantation of culture-expanded stem cells. This approach may preclude the need of culture expansion, and the potential complications of cell rejection and graft-versus-host disease and blood-borne disease transfer are avoided.18
Insulin like growth factor-1 (IGF-1) plays a critical role in skeletal development.19 The IGF-1 molecules regulate normal cell growth and development and induce the chondrogenic potential of bone-marrow-derived MSCs by stimulating proliferation, regulating apoptosis, and inducing expression of chondrogenic markers.20
There is scarcity of information on the use of autologous uncultured bone-marrow-derived mononuclear cells (BMNCs) with IGF-1 for in vivo regeneration of articular cartilage in animals. Therefore, the present study was designed to investigate the utility of BMNCs and IGF-1 in the repair of osteochondral defect in rabbits.
Materials and Methods
Thirty-six New Zealand white rabbits (10-12 months old) of either sex, weighing 1.5 to 2 kg, were used. The animals were maintained under uniform conditions and provided with standard diet and water ad libitum. The study was approved by the Institute Animal Ethics Committee. The experimental animals were divided randomly into three groups, A, B, and C. All the animals were kept off feed for 4 hours before the start of the experiments.
Isolation of Bone Marrow Mononuclear Cells
Bone marrow was aspirated from the iliac crest using an 18 gauge biopsy needle from the animals of groups B and C, under general anesthesia induced by intramuscular xylazine (Xylazine 2%, Indian Immunologicals, Hyderabad, India) and ketamine (Ketamin 5%, Themis Chemicals Ltd., Hyderabad, India).21 Mono-nucleated cells were isolated from the bone marrow aspirate by the density gradient method.22 In brief, 5 mL bone marrow, 2.5 mL from each iliac crest, was aspirated under negative pressure in a 10 mL disposable syringe containing 500 IU of heparin. Bone marrow aspirate was transferred into a 15 mL centrifuge tube and diluted with 10 mL of RPMI-1640 medium. The aspirate was mixed well with the medium using a pipette. The diluted aspirate was divided equally into two fractions, and each fraction was gently layered over 3 mL of density gradient medium (Lymphocyte separation media, 1.077 g/mL, M.P. Biochemical, Mumbai, India) in centrifuge tubes. The tubes were centrifuged at 447g for 30 minutes. Translucent ring containing mononuclear cells was aspirated using a pipette and washed twice in HBSS (Hangs Balanced Salt Solution; Himedia Pvt. Ltd., Mumbai, India) at 112g for 10 minutes, and the cell pellet was resuspended in 60 µL RPMI-1640. Viability of BMNCs was tested by trypan blue dye exclusion. Cell viability testing revealed that 98% of the cells were viable. The cell number was assessed by counting the cells using a hemocytometer under light microscope. The procedure was performed just before implantation of the cells in the osteochondral defect.
Creation of Osteochondral Defect and Implantation of Cells
The left knee joint was used for the experiment in all the animals. The skin over and around the left knee joint was shaved, scrubbed with cetrimide solution, and painted with povidone iodine. Under xylazine-ketamine anesthesia, a medial parapatellar skin incision was made at the joint. Soft tissue was dissected to expose the joint capsule and the capsule was incised. Patella was dislocated laterally and the knee was flexed to 90° to expose the patellar groove of the femur. With the help of a hand-held trephine having a diameter of 3 mm, an osteochondral defect of 5 mm depth was created in the middle of the patellar groove (Fig. 1). Excessive bleeding from the defect site was blotted with sterile gauze. In group A, 60 µL RPMI-1640 medium was implanted at the base of the defect using a fine tip pipette. In group B, 2.96 ± 0.18 × 10⁶ cells suspended in 60 µL RPMI-1640 were transplanted in the defect in the same manner as in group A, and in group C, in addition to the cells (2.96 ± 0.18 × 10⁶ cells in 60 µL RPMI-1640 medium), 30 µL IGF-1 (1 ng/µL; Human Recombinant, IGF-1; Sigma, Mumbai, India) was also implanted. The patella was immediately repositioned and the capsule was repaired with 5-0 PGA suture, and skin incision was closed using nylon suture. The animals were shifted to individual cages and allowed free access to feed and water in their cages. All the animals were given sulphadiazine-trimethoprim 50 mg/kg body weight for 5 days and meloxicam 0.3 mg/kg body weight for 3 days. Dressing of suture line was done using 5% povidone iodine, until healing was complete.
Figure 1.
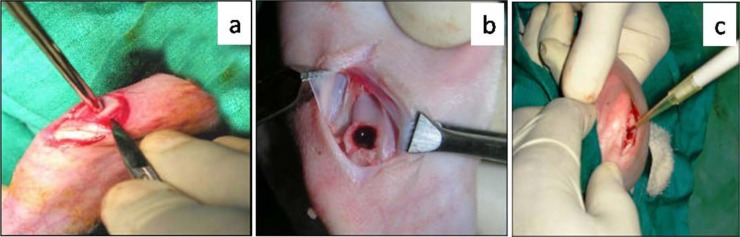
Preparation of cartilage defect model. (a) Creation of osteochondral defect with trephine, (b) Defect on trochlear groove and the removed osteochondral piece, (c) Implantation of bone-marrow-derived mononuclear cells and growth factor into the defect.
Observations
Gross Observations
Four animals from each group were sacrificed by overdose of thiopentone on the 30th, 60th, and 90th posttreatment days. The joint was opened and cartilage repair was grossly evaluated using a score system (Table 1). The overall repair was assessed at each interval by calculating the total score and graded as Grade I (normal) if total score was above 14, Grade II (near normal) if total score was 10 to 14, Grade III (abnormal) if score was 5 to 9, and Grade IV (severely abnormal) if score was 0 to 4.
Table 1.
Scoring System Used for Gross Assessment and Quantification of Cartilage Repair in Rabbits.
| Score Allotted to Different Attributes |
|||||
|---|---|---|---|---|---|
| Assessment Criteria | 0 | 1 | 2 | 3 | 4 |
| Filling of the defect | Less than 25% repair of the defect depth | 25% repair of the defect depth | 50% repair of the defect depth | 75% repair of the defect depth | In level with surrounding cartilage |
| Appearance of the defect area | Total degeneration of defect | Several, small, or few but large fissures on surface | Small, scattered, fissures or craves on surface | Fibrillated and rough surface | Intact smooth and glistening surface |
| Coloration of the defect area | Reddish appearance and whitish ring | Yellowish opaque appearance and whitish ring | Whitish opaque appearance | Transparent appearance with whitish ring | Transparent appearance |
| Congestion of the defect area | Severe congestion | Moderate congestion | Mild congestion | Slight congestion | No congestion |
Scanning Electron Microscopy
Scanning electron microscopic examination was done on one randomly selected test femoral condyle collected on the 90th day to observe surface morphology. The condyle was preserved in 2.5% glutaraldehyde buffer immediately and then trimmed around the defect to obtain the central defect area along with surrounding healthy cartilage. The trimmed pieces were washed with distilled water and then dehydrated through a graded series of 30%, 50%, 70%, 90%, and 100% ethanol for 20 minutes each. The dehydrated specimens were dried twice in 100% hexamethyldisilazane (HMDS) for 30 minutes each23 and then mounted on aluminum stubs using adhesive silicon tape and coated with a thin film of gold on a Jeol ion sputter (Model JFC 1100) at 7 to 10 mA and 1 to 2 kV for 5 minutes. The specimens were observed under scanning electron microscope (Jeol ISM 840 model) for their surface morphology.
Radiography
Radiographs of the test joints were made in lateral and anteroposterior views in flexed and extended positions after the surgery and subsequently on the 30th, 60th, and 90th postoperative days. The factors used for X-ray exposure were 50 kVp and 8 mAs at 75 cm FFD. Radiographs were interpreted for evidence of healing of osteochondral defect.
Histopathology
Three animals from each group were used for histopathological examination on the 30th, 60th, and 90th days. The distal femoral condyle including osteochondral defect was collected, fixed in 10% neutral buffer formalin, and decalcified in 10% formic acid (Gooding and Steward’s fluid) for 10 days. Pieces of the femoral condyles measuring 6 × 6 × 6 mm3 were cut including healthy tissue around the repair area, and paraffin blocks were made. Thereafter, 4 to 5 µm thick sagittal sections of the paraffin-embedded tissue were cut and stained with hemotoxylin and eosin.24 For histological assessment, the stained sections were screened under light microscope, and healing was scored blindly using a grading scale adopted from the International Cartilage Repair Society visual histological assessment scale25 (Table 2).
Table 2.
Ten Histological Parameters Selected for Quantification of Healing as per International Cartilage Repair Society II Scoring System (Mainil-Varlet et al25) with Slight Modification.
| Score for Different Attributes of the Parameters |
||||
|---|---|---|---|---|
| Parameters | 3 | 2 | 1 | 0 |
| Tissue morphology | Hyaline cartilage | Mostly hyaline | Mixed hyaline/fibrocartilage | Fibrous tissue and vessels |
| Matrix staining (metachromasia) | — | Normal intensity | Reduced intensity | No staining |
| Cell distribution | — | Columnar | Columnar and clusters | Clusters and disorganized |
| Surface architecture | — | Smooth (>3/4) | Moderate (>1/2-3/4) | Severely irregular (<1/4) |
| Integration with subjacent bone | — | Full basal integration | Partial basal integration | No basal integration |
| Formation of tidemark | — | Single tidemark | Irregular tidemark | No visible tidemark |
| Subchondral bone abnormalities | — | Normal | Mild disruption/fibrosis | Severe disruption/fibrosis |
| Abnormal calcification | — | Absent | Mild to moderate | Severe |
| Vascularization in repair tissue | — | Absent | Few vessels | Many vessels |
| Mid/deep zone assessment | — | Proteoglycans without collagen | Proteoglycans with collagen | No proteoglycans, but collagen |
Overall histological healing score in each group was calculated by summation of the scores at each interval. Groupwise pooled score was obtained by summation of the score of each parameter at all the intervals.
Histochemistry
Few sections from all the sets were stained with safranin-O and visualized under polarized light microscope to record the presence of proteoglycan in the regenerated tissue.24 Duplicate sections were also stained with Masson’s trichrome for quantification of collagen.
Statistical Analysis
The data were analyzed using Kruskal–Wallis test for nonparametric data using SAS 9.2.
Results
Gross Observations
The joint cavity, synovial membrane, and quantity of the synovial fluid appeared to be grossly normal in all the treatment groups. On day 30, postoperatively, the osteochondral defect was filled up to 50% to 75% of its depth in the animals of groups A and B and up to 75% of their depth or more in group C. The healing cartilage appeared to have large fissures or craves in the animals of group A and fibrillated rough surface in group B but fibrillated rough to smooth glistering surface in the animals of group C. The color of the healing tissue was reddish white to yellow opaque in group A, mostly reddish with whitish ring appearance in group B, and from whitish opaque to transparent ring in group C. By the 90th day, the defect was filled completely in 50% animals of group A, 75% animals of group B, and 100% animals of group C. The regenerated tissue showed small, scattered fissures or craves in group A and rough to smooth glistering surface in groups B and C, with the highest score in group C (Table 3). The color of the tissue surface appeared mostly white opaque in group A, white opaque to white transparent in group B, and white transparent to clear transparent in group C, with the higher score in group C as compared to groups A and B (Table 3). There was no congestion in group C but slight to minimal in groups A and B (Fig. 2).
Table 3.
Mean ± Standard Deviation of Score for Different Parameters of Gross Observation and Overall Healing Grade of Osteochondral Defects Treated with RPMI Medium (Group A), Bone Marrow Mononuclear Cells (Group B), and Bone Marrow Mononuclear Cells Along with Insulin Like Growth Factor-1 (Group C).
| Gross Observation Score |
|||||||
|---|---|---|---|---|---|---|---|
| Group | Days | FD | MA | MCL | MCN | Overall | Grade |
| A | 30 | 2.50 ± 0.58 | 1.25 ± 0.50 | 0.50 ± 1.00 | 2.00 ± 1.63 | 6.25 ± 1.26 | III |
| B | 30 | 2.75 ± 0.50 | 3.25 ± 1.50 | 0.50 ± 0.00 | 2.75 ± 0.96 | 8.75 ± 0.50 | III |
| C | 30 | 3.50 ± 0.58 | 3.75 ± 0.50 | 1.25 ± 0.50 | 3.00 ± 1.55 | 11.50 ± 1.29 | II |
| A | 60 | 2.50 ± 1.00 | 2.00 ± 0.81 | 1.25 ± 0.96 | 3.00 ± 1.15 | 8.75 ± 0.96 | III |
| B | 60 | 2.75 ± 0.50 | 3.00 ± 0.00 | 3.00 ± 0.00 | 2.25 ± 1.26 | 11.00 ± 1.41 | II |
| C | 60 | 4.00 ± 0.00 | 3.50 ± 1.00 | 3.00 ± 0.82 | 3.75 ± 0.50 | 14.25 ± 0.96 | I |
| A | 90 | 3.50 ± 0.58 | 1.75 ± 0.50 | 2.00 ± 1.15 | 3.50 ± 1.00 | 10.75 ± 0.96 | II |
| B | 90 | 3.75 ± 0.50 | 3.00 ± 0.82 | 2.75 ± 0.50 | 3.00 ± 1.41 | 12.50 ± 1.29 | II |
| C | 90 | 4.00 ± 0.00 | 3.75 ± 0.50 | 3.25 ± 0.96 | 4.00 ± 0.00 | 15.00 ± 0.82 | I |
FD = filling of defect; MA = macroscopic appearance in relation to surface; MCL = macroscopic appearance in coloration; MCN = macroscopic appearance in relation to congestion of the repaired area.
Figure 2.
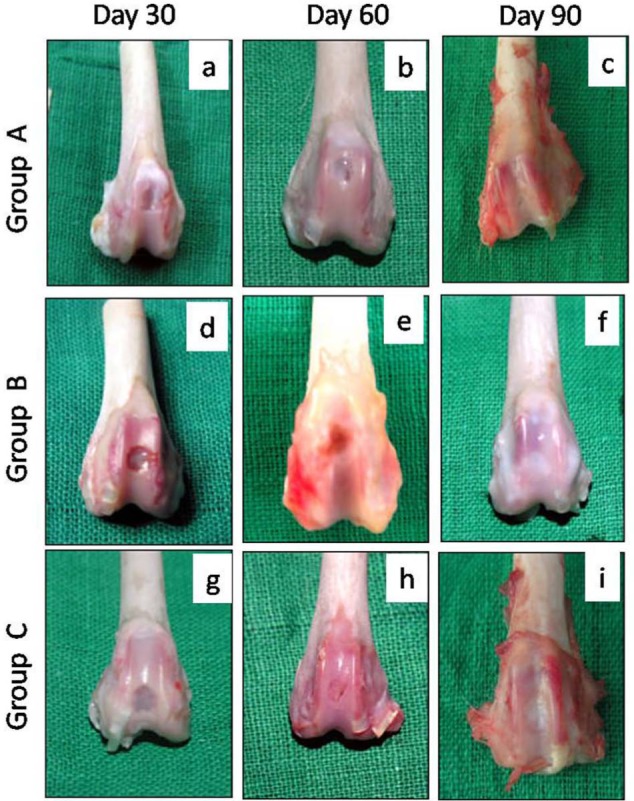
Gross appearance of the osteochondral defects in trochlear groove of left femur in New Zealand White rabbits at different time intervals. Gross appearance showed better healing in group C followed by groups B and A in terms of filling, color, congestion, and surface appearance. Group A (control), group B (bone marrow mononuclear cells), group C (bone marrow mononuclear cells + insulin like growth factor-1).
The overall mean score on day 30 suggested grade III or abnormal healing in groups A and B and grade II, that is, near normal healing in the animals of group C. The overall healing on day 60 was categorized as grade III in group A, grade II in the animals of group B, and grade I in group C. On day 90, the overall mean score suggested grade II healing in groups A and B and grade I in group C (Table 3).
Scanning Electron Microscopy
In group A at lower magnification, the central regenerated and peripheral normal tissue appeared distinct. The regenerated tissue showed some integration with the normal tissue with irregular, elevated margins and presence of superficial split at the interface. The central area of the defect site showed large fissure (Fig. 3a). At higher magnification, the regenerated and normal tissue appeared as two distinct zones. The regenerated area showed mostly uneven contour along with few mounds, ridges, and spherules (Fig. 3g).
Figure 3.

Scanning electron microscopic appearance of articular cartilage of left femoral trochlear groove on day 90 in New Zealand White rabbits. Group A (control), group B (bone marrow mononuclear cells), group C (bone marrow mononuclear cells + insulin like growth factor-1).
In group B at lower magnification, the central regenerated and peripheral normal tissue appeared distinct. The regenerated tissue was integrated with the normal tissue with flat margins and superficial split at the interface. The central surface area of the regenerated tissue showed large oblique fissure (Fig. 3b). At higher magnification, the regenerated and normal tissue appeared as two distinct zones and micropattern showed mostly mounds arranged in row (Fig. 3h).
In group C at lower magnification, the central regenerated and peripheral normal tissue appeared indistinct. The regenerated tissue was well integrated with the normal tissue with flat even margins. The central surface area of the regenerated tissue showed flat uniform contour with rare processes without fissure (Fig. 3c). At higher magnification, the regenerated and normal tissue appeared as two obscurely distinct zones and micropattern showed large numbers of mounds and few moated mounds (Fig. 3i).
Radiographic Observations
Anteroposterior view of radiographs, made immediately after surgery, showed circular radiolucent area of 3.5 to 4.0 mm diameter at the site of osteochondral defects in all the animals (Fig. 4a, e, and i). On day 30, the defect appeared as a circular radiolucent area of about 3.0 to 3.5 mm diameter bounded by a hazy ring in group A and more hazier ring in group B. In group C, the margin of the circular ring was not distinct and whole area appeared hazier with trabecular pattern of radiodense line and its diameter was smaller as compared to group B or A (Figs. 4 and 5b, f, and j).
Figure 4.
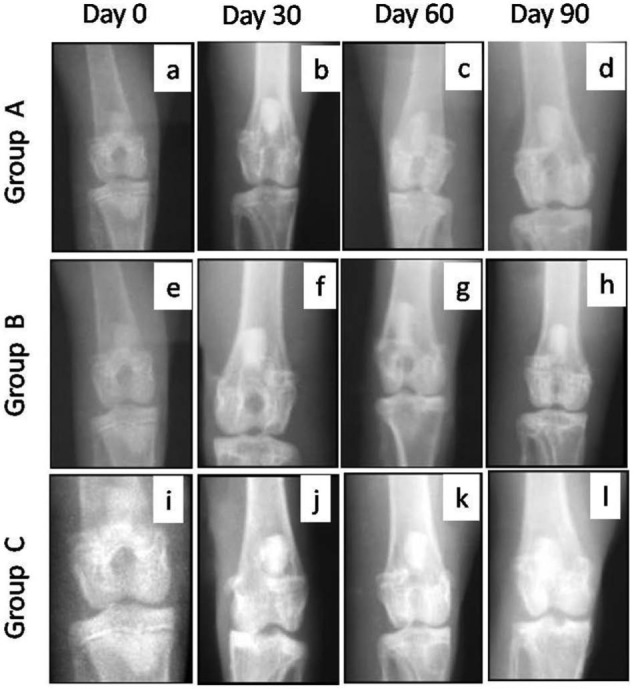
Anteroposterior radiographic views of osteochondral defects in trochlear groove of left femur in New Zealand White rabbits at different intervals. The radiographs showed better repair of subchondral defect in group C followed by groups B and A in terms of decrease in the diameter of defect size. Group A (control), group B (bone marrow mononuclear cells), and group C (bone marrow mononuclear cells + insulin like growth factor-1).
Figure 5.
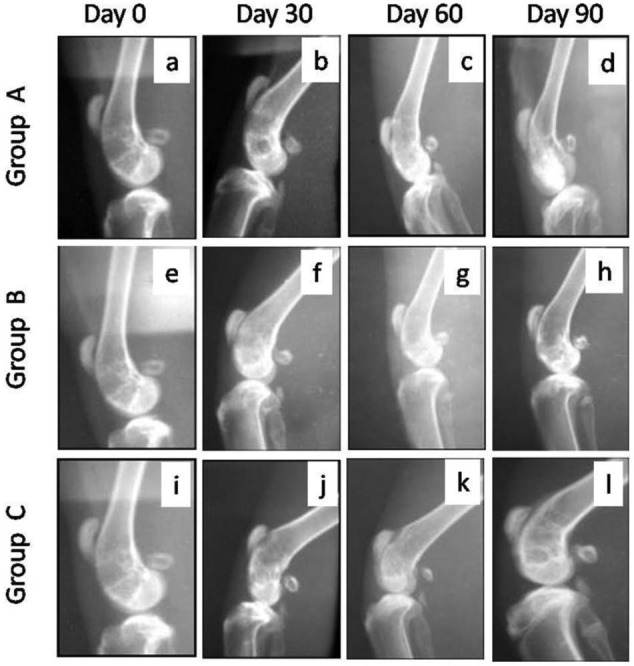
Lateral radiographic views of osteochondral defects in trochlear groove of left femur in New Zealand White rabbits at different time intervals. The radiographs showed better repair in group C followed by groups B and A in terms of formation of subchondral bone at the defect site. Group A (control), group B (bone marrow mononuclear cells), group C (bone marrow mononuclear cells + insulin like growth factor-1).
On day 60 in group A, the defect area appeared more radiodense but its diameter did not decrease as compared to day 30. In group B, the decrease in diameter of the circular ring was apparent and the defect appeared completely filled with radiodense tissue up to the level of the surface. In group C, a marked decrease in the diameter of the circular ring was seen and the defect appeared completely filled with more prominent trabecular pattern of radiodense lines as compared to groups A and B (Figs. 4 and 5c, g, and k).
By day 90, the defect area decreased further and a small circular area was evident in groups A and B. However, in group C, the circular area of defect was not distinct from the surrounding area and was filled with prominent trabecular pattern (Figs. 4 and 5d, h, and l).
Histopathology and Histochemistry
On day 30, mixed hyaline to fibrocartilage was present in the repaired area in two animals of group A and fibrous tissue with blood vessels in one animal. In group B, the regenerated tissue mostly contained mixed hyaline/fibrocartilage, whereas in group C the repaired tissue was mostly hyaline cartilage in two animals and mixed hyaline/fibrocartilage in one animal. The cell arrangement in the repaired tissues was irregular and disorganized in all the groups (Fig. 6a, d, and g). The tidemark was not visible in any of the groups. In group C, the regenerated tissue did not show any abnormal calcification, whereas one animal each in groups A and B showed calcification.
Figure 6.

Photomicrographs of sagittal sections of the osteochondral defect of left femur in New Zealand White rabbits processed for histological evaluation. The overall histological score for 10 parameters was better in group C followed by groups B and A. Group A (control), group B (bone marrow mononuclear cells), group C (bone marrow mononuclear cells + insulin like growth factor-1) (hematoxylin and eosin stain, 100×).
On day 60, the regenerated tissue contained fibrocartilage in all the animals of group A and one animal of group B, whereas it was mostly hyaline in two animals of group B and all the animals of group C. The regenerated tissue in all the animals of group C and two animals of group B showed full integration with subjacent bone, but in the animals of group A it showed only partial integration with the subjacent bone. Irregular tidemark was seen only in the animals of group C (Fig. 7h). Vascularity was not discernible in the animals of groups B and C, but some vascularity was seen in the repaired tissue in group A. The overall histological scores suggested the best healing in group C followed by groups B and A (Table 4).
Figure 7.

Photomicrographs of sagittal sections processed from the osteochondral defect in left femur of New Zealand White rabbits. The stained sections showed progressively milder degree of blue color (collagen fiber) with time intervals, an indication of better repair in group C followed by groups B and A. Group A (control), group B (bone marrow mononuclear cells), group C (bone marrow mononuclear cells + insulin like growth factor-1) (Masson’s trichrome stain, 200×).
Table 4.
Scores (Mean ± Standard Deviation) of Various Histological Parameters and Overall Histological Score of Healing Osteochondral Defects Treated with RPMI Medium (Group A), Bone Marrow Mononuclear Cells (Group B), and Bone Marrow Mononuclear Cells Along with Insulin Like Growth Factor-1 (Group C).
| Histological Parameters |
||||||||||||
|---|---|---|---|---|---|---|---|---|---|---|---|---|
| Group | Days | MPH | MT | CD | SF | INB | TDM | SBA | AC | VRT | MJA | Overall |
| A | 30 | 0.67 ± 0.58 | 1.00 ± 0.00 | 0.00 ± 0.00 | 0.67 ± 0.58 | 1.00 ± 0.00 | 0.00 ± 0.00a | 1.00 ± 0.00 | 1.33 ± 1.15 | 0.33 ± 0.58 | 0.33 ± 0.58 | 6.33 ± 1.15 |
| B | 30 | 1.00 ± 0.00 | 1.00 ± 0.00 | 0.00 ± 0.00 | 1.33 ± 0.58 | 0.67 ± 0.58 | 0.33 ± 0.58b | 1.00 ± 1.00 | 2.00 ± 0.00 | 1.33 ± 0.58 | 1.00 ± 0.00 | 9.67 ± 1.53 |
| C | 30 | 1.67 ± 0.58 | 1.00 ± 0.00 | 0.00 ± 0.00 | 2.00 ± 0.00 | 1.00 ± 0.27 | 0.00 ± 0.00a | 1.00 ± 0.00 | 2.00 ± 0.00 | 1.67 ± 0.58 | 1.33 ± 0.58 | 11.67 ± 1.15 |
| A | 60 | 1.00 ± 0.00 | 1.00 ± 0.00 | 0.00 ± 0.00 | 1.33 ± 0.58 | 1.00 ± 0.00 | 0.00 ± 0.00a | 1.00 ± 0.00 | 2.00 ± 0.00 | 1.00 ± 0.00 | 1.00 ± 0.00 | 9.33 ± 0.58 |
| B | 60 | 1.33 ± 0.58 | 1.00 ± 0.00 | 0.33 ± 0.58 | 1.33 ± 0.58 | 1.67 ± 0.58 | 0.00 ± 0.00a | 1.33 ± 0.58 | 2.00 ± 0.00 | 2.00 ± 0.00 | 1.00 ± 0.00 | 12.00 ± 1.73 |
| C | 60 | 2.00 ± 0.00 | 1.67 ± 0.58 | 0.33 ± 0.58 | 1.00 ± 0.02 | 1.67 ± 0.58 | 1.33 ± 0.15e | 2.00 ± 0.00 | 2.00 ± 0.00 | 2.00 ± 0.00 | 1.33 ± 0.58 | 15.33 ± 2.52 |
| A | 90 | 1.33 ± 0.58 | 1.00 ± 0.00 | 0.00 ± 0.00 | 1.33 ± 1.15 | 1.33 ± 0.58 | 0.00 ± 0.00a | 0.67 ± 0.58 | 2.00 ± 0.00 | 1.33 ± 1.15 | 1.00 ± 0.34 | 10.00 ± 1.73 |
| B | 90 | 1.33 ± 0.58 | 1.00 ± 0.00 | 0.67 ± 0.58 | 1.67 ± 0.58 | 1.33 ± 0.58 | 0.67 ± 0.58c | 1.33 ± 0.58 | 2.00 ± 0.00 | 1.33 ± 0.58 | 1.33 ± 0.58 | 12.67 ± 2.08 |
| C | 90 | 2.67 ± 0.58 | 1.67 ± 0.58 | 1.00 ± 0.00 | 2.00 ± 0.00 | 1.67 ± 0.58 | 1.67 ± 0.58f | 2.00 ± 0.00 | 2.00 ± 0.00 | 2.00 ± 0.00 | 1.67 ± 0.58 | 18.33 ± 1.15 |
Values with different superscripts differ significantly between the groups; Uppercase alphabets (P ≤ 0.01); lowercase alphabets (P ≤ 0.05).
MPH = tissue morphology; MT = matrix staining (metachromasia); CD = cell distribution; SF = surface architecture; INB = integration with subjacent bone; TDM = tidemark; SBA = subchondral bone abnormalities; AC = abnormal calcification; VRT = vascularization in repair tissue; MJA = mid/deep zone assessment.
On day 90, the regenerated tissue was fibrocartilage in two animals and mixed fibrocartilage in one animal each of groups A and B, whereas it was hyaline in group C. The cells were organized in clusters and columns in all the animals of group C and one animal of group B, but they were still disorganized in two animals of group B and all the animals of group A. The regenerated tissue showed complete integration with subchondral bone in two animals of group C, but only one animal each of groups A and B. Single tidemark was present in two animals of group C, irregulartidemark was present in one animal of group C and two animals of group B, but no visible tidemark was present in the animals of group A. In group C, the subchondral bone was normal and fully integrated at the osteochondral junction, but it showed severe disruption in all the animals of group A and one animal of group B and mild disruption in the remaining two animals of group B. In groups A and B, the repaired tissues still had few blood vessels (two animals each), whereas vascularity was absent in the animals of groups C (Fig. 6c, f, and i). Masson’s trichrome stained sections showed more collagen was still present on days 90 and 60 in groups A and B, respectively, but it was only up to day 30 in the animals of group C (Fig. 7). Safranin-O staining suggested near normal architecture and more proteoglycan deposition in the regenerated cartilage in group C as compared to that of groups A and B (Fig. 8). On day 90, the overall mean histological score of healing cartilage was maximum in group C followed by groups B and A (Table 4; Fig. 9).
Figure 8.

Photomicrographs of sagittal sections from the osteochondral defect in left femur of New Zealand White rabbits. The section in group C was much closer to normal (N) cartilage than other groups in terms of proteoglycan staining (orange/brick red) and arrangement of chondrocytes. Group A (control), group B (bone marrow mononuclear cells), group C (bone marrow mononuclear cells + insulin like growth factor-1 IGF-1) (Safranin-O stain, 400×).
Figure 9.

Mean ± standard deviation of overall histological score of healing osteochondral defeats treated with RPMI medium (group A), Bone marrow mononuclear cells (group B) and bone marrow mononuclear cells along with insulin like growth factor-1 (group C).
The mean histological scores for tissue morphology, matrix staining, cell distribution, integration of regenerated tissue with subchondral bone, tidemark formation, subchondral bone abnormalities, and mid/deep zone assessment pooled for three intervals were significantly higher (P < 0.05) in group C than in groups A and B (Table 5; Fig 10). Though the scores were higher in group B, the differences between groups A and B were not significant. The vascularity in repaired tissue showed significantly (P < 0.05) higher score in groups C and B than group A. Although the score was higher in group C, it did not differ significantly from that in group B.
Table 5.
Mean ± Standard Deviation of Histological Scores for Three Intervals for Healing Osteochondral Defects Treated with RPMI Medium (Group A), Bone Marrow Mononuclear Cells (Group B) and Bone Marrow Mononuclear Cells Along with Insulin Like Growth Factor-1 (Group C).
| Histological Parameters | |||||||||||
|---|---|---|---|---|---|---|---|---|---|---|---|
| Groups | MPH | MT | CD | SF | INB | TDM | SBA | AC | VRT | MJA | Overall |
| A | 1.00 ± 0.50A | 1.00 ± 0.00a | 0.00 ± 0.00a | 1.11 ± 0.78 | 1.11 ± 0.33a | 0.00 ± 0.00A | 0.89 ± 0.33A | 1.78 ± 0.67 | 0.89 ± 0.78A | 0.78 ± 0.44a | 8.56 ± 2.00A |
| B | 1.22 ± 0.44A | 1.00 ± 0.00a | 0.33 ± 0.50ab | 1.44 ± 0.53 | 1.22 ± 0.67a | 0.33 ± 0.50A | 1.22 ± 0.67A | 2.00 ± 0.00 | 1.56 ± 0.53B | 1.11 ± 0.33ab | 11.44 ± 2.07B |
| C | 2.11 ± 0.60B | 1.40 ± 0.53b | 0.54 ± 0.53b | 1.67 ± 0.50 | 1.44 ± 0.43b | 1.00 ± 0.00B | 1.67 ± 0.50B | 2.00 ± 0.00 | 1.89 ± 0.33B | 1.14 ± 0.53b | 15.11 ± 3.26C |
Values with different superscripts differs significantly between the groups; Uppercase alphabets (P ≤ 0.01); lowercase alphabets (P ≤ 0.05).
MPH = tissue morphology; MT = matrix staining (metachromasia); CD = cell distribution; SF = surface architecture; INB = integration with subjacent bone; TDM = tidemark; SBA = subchondral bone abnormalities; AC = abnormal calcification; VRT = vascularization in repair tissue; MJA = mid/deep zone assessment.
Figure 10.

Mean ± standard deviation of histological scores for three intervals for healing osteochondral defects treated with RPMI medium (group A), bone marrow mononuclear cells (group B), and bone marrow mononuclear cells along with insulin like growth factor-1 (group C).
Discussion
The objective of the study was to evaluate whether BMNCs can stimulate cartilage repair and whether combined use of BMNCs and IGF-1 has any advantage over BMNCs alone for in vivo cartilage repair. An osteochondral defect of 3 mm diameter and 5 mm depth was created in the trochlear groove of the femur. Defects of similar size have been used earlier for cartilage repair studies.26 The defect was created on a non-weight-bearing area of the trochlear groove of the femur to minimize stress at the defect site as high stress has been reported to induce fibrous tissue formation and inhibited chondrogenesis.27
In the present study, direct implantation of cells in the defect without scaffold was chosen on the basis of the hypothesis that formation of fibrin clot matrix at osteochondral defect may act as a better and natural scaffold for implanted BMNCs. The hypothesis was based on the findings of a recent study that reported that the cartilage repair of the control group was superior to that of the gel group.28
Gross healing of cartilage was faster in group B compared to group A. These findings were in agreement with the observations of earlier studies that reported similar grade of healing after use of cultured bone marrow mesenchymal cells to repair the articular defect in rabbit.17 The transplanted mononuclear cells contained T cells, B cells, and macrophages in addition to MSCs. On stimulation, these cells might secret some cytokines such as TGF-β, which may have beneficial effects on cartilage regeneration. The better healing in group C as compared to groups A and B could be because of the effect of IGF-1 on the implanted cells and the healing tissue. IGF-1 has been reported to modulate MSC chondrogenesis by stimulating proliferation, regulating cell apoptosis, and inducing expression of chondrocyte markers. IGF-1 has been reported to have potent chondroinductive actions.20
Scanning electron microscopy results supported the findings of gross observation. The presence of split on the surface of regenerated tissue, which was not evident on gross observation, could be because of the exposure of the sample to dehydration in alcohol and critical point drying with HMDS. Better surface architecture and better integration of healing tissue with surrounding tissue suggested better healing in BMNCs plus IGF-1 treated defects as compared to BMNCs treated and untreated defects.
Plain radiography cannot be of diagnostic value in articular cartilage healing, but in the case of osteochondral defect it was used to assess the healing of subchondral bone and to have some clue about the overall healing of the defect. Few radiographic signs of healing observed in group A could be attributable to influx of bone marrow cells from the base of the osteochondral defect.29 Better healing in group B as compared to group A could be because of the implantation of BMNCs that contained MSCs and other progenitor cells. MSCs have both osteogenic and chondrogenic potential when tested in in vivo or in vitro systems.30-32 Local environment is an important factor for the differentiation of MSCs into chondrocytes or osteoblasts.33 In the deep layer of defects, MSCs might have differentiated into osteoblasts and thus subchondral bone was well remodeled. In group C, the size of the defects decreased faster than the other groups, and the defect site appeared more radiodense as compared to other groups at all the intervals. IGF-1 upregulates Type I collagen, Runx2, and alkaline phosphatase gene expression in hMSCs, indicative of early osteogenic differentiation.34 The utility of IGF-1 in cartilage repair has been documented.35 In the present study, IGF-1 was used along with BMNCs, which might have helped speedy recovery in the animals of group C.36
Histologically, the quality of the regenerated tissue was always superior in group C as compared to groups B and A, and in group B as compared to group A. Better tissue morphology, surface architecture, and tidemark formation in group B as compared to group A could be attributable to exogenous application of BMNCs and possibly MSCs present in the transplanted cells.14 Another possible reason for better healing in group B as compared to group A could be the interaction of implanted BMNCs with normal as well as injured chondrocytes at osteochondral junction and in synovial fluid, as chondrocytes might have been liberated in synovial fluid at the time of creation of osteochondral defect. The injured chondrocytes may liberate different cytokines that could promote better proliferation as well as differentiation of stem cell and progenitor cell fraction of BMNCs toward chondrogenic lineage. In an in vitro study,37 it was proved that MSCs differentiate rapidly into chondrocytes when grown in co-cultures containing chondrocytes as compared to when grown alone. Further improved histological appearance observed in group C as compared to groups A and B could be attributable to the use of IGF-1 in combination with BMNCs. Exposure of bone-marrow-derived stem cells to IGF-1 improved chondrogenic differentiation of human- and mouse-derived BM-MSCs in culture.38 Early formation of subchondral bone in group C might have created low oxygen gradient at the defect site, which could be responsible for favorable conditions for MSCs and other precursor cells’ differentiation in chondrocytes.39-41
It was concluded that implantation of BMNCs may facilitate the healing of osteochondral defects in rabbits. However, the combination of BMNCs and IGF-1 induces faster and histologically better healing than that induced by BMNCs alone.
Footnotes
Acknowledgment and Funding: The author(s) received no financial support for the research, authorship, and/or publication of this article.
Declaration of Conflicting Interests: The author(s) declared no conflict of interests with respect to the research, authorship, and/or publication of this article.
Ethical Approval: The study was approved by the Institute Animal Ethics Committee.
References
- 1. Kim HKW, Moran ME, Salter RB. The potential for regeneration of articular cartilage in defects created by chondral shaving and subchondral abration: an experimental investigation in rabbits. J Bone Joint Surg Am. 1991;73:1301-15. [PubMed] [Google Scholar]
- 2. Hunziker EB, Rosenberg LC. Repair of partial-thickness defects in articular cartilage: cell recruitment from the synovial membrane. J Bone Joint Surg Am. 1996;78:721-33. [DOI] [PubMed] [Google Scholar]
- 3. Hunziker EB. Biological repair of articular cartilage. Clin Orthop Relat Res. 1999;367(Suppl):S135-46. [PubMed] [Google Scholar]
- 4. Messner K, Gillquist J. Cartilage repair: a critical review. Acta Orthop Scand. 1998;67:523-29. [DOI] [PubMed] [Google Scholar]
- 5. Sohier J, Hamann D, Koenders M, Cucchiarini M, Madry H, van-Blitterswijk C, et al. Tailored release of TGF-beta1 from porous scaffolds for cartilage tissue engineering. Int J Pharm. 2007;332:80-9. [DOI] [PubMed] [Google Scholar]
- 6. Madry H, Orth P, Kaul G, Zurakowski D, Menger MD, Kohn D, et al. Acceleration of articular cartilage repair by combined gene transfer of human insulin-like growth factor I and fibroblast growth factor-2 in vivo. Arch Orthop Trauma Surg. 2010;130:1311-22. [DOI] [PubMed] [Google Scholar]
- 7. Kamarul T, Selvaratnam L, Masjuddin T, Ab-Rahim S, Ng C, Chan KY, et al. Autologous chondrocyte transplantation in the repair of full-thickness focal cartilage damage in rabbits. J Orthop Surg (Hong Kong). 2008;16:230-6. [DOI] [PubMed] [Google Scholar]
- 8. Yu FY, Lu SB, Huang LH, Xu WJ, Peng J, Zhao B, et al. Mechanisms of autologous chondrocytes mass transplantation in the repair of cartilage defects of rabbits’ knee. Zhongguo Gu Shang. 2010;3:683-7. [PubMed] [Google Scholar]
- 9. Darling EM, Athanasiou KA. Rapid phenotypic changes in passaged articular chondrocyte subpopulations. J Orthop Res. 2005;23:425-32. [DOI] [PubMed] [Google Scholar]
- 10. Goessler UR, Bugert P, Bieback K, Baisch A, Sadick H, Verse T, et al. Expression of collagen and fiber-associated proteins in human septal cartilage during in vitro dedifferentiation. Int J Mol Med. 2004;14:1015-22. [PubMed] [Google Scholar]
- 11. Goessler UR, Bieback K, Bugert P, Naim R, Schafer C, Sadick H, et al. Human chondrocytes differentially express matrix modulators during in vitro expansion for tissue engineering. Int J Mol Med. 2005;16:509-15. [PubMed] [Google Scholar]
- 12. Haddo O, Mahroof S, Higgs D, David L, Pringle J, Bayliss M, et al. The use of chondrogide membrane in autologous chondrocyte implantation. Knee. 2004;11:51-5. [DOI] [PubMed] [Google Scholar]
- 13. Kreuz PC, Steinwachs M, Erggelet C, Krause SJ, Ossendorf C, Maier D, et al. Classification of graft hypertrophy after autologous chondrocyte implantation of full-thickness chondral defects in the knee. Osteoarthritis Cartilage. 2007;15:1339-47. [DOI] [PubMed] [Google Scholar]
- 14. Murphy JM, Fink DJ, Hunziker EB, Barry FP. Stem cell therapy in a caprine model of osteoarthritis. Arthritis Rheum. 2003;489:3464-74. [DOI] [PubMed] [Google Scholar]
- 15. Ichinose S, Yamagata K, Sekiya I, Muneta T, Tagami M. Detailed examination of cartilage formation and endochondral ossification using human mesenchymal stem cells. Clin Exp Pharmacol Physiol. 2005;32:561-70. [DOI] [PubMed] [Google Scholar]
- 16. Noth U, Steinert AF, Tuan RS. Technology insight: adult mesenchymal stem cells for osteoarthritis therapy. Nat Clin Pract Rheumatol. 2008;4:371-80. [DOI] [PubMed] [Google Scholar]
- 17. Yan H, Yu C. Repair of full-thickness cartilage defects with cells of different origin in a rabbit model. Arthroscopy. 2007;23:178-87. [DOI] [PubMed] [Google Scholar]
- 18. Cox CS, Jr, Baumgartner JE, Harting MT, Worth LL, Walker PA, Shah SK, et al. Autologous bone marrow mononuclear cell therapy for severe traumatic brain injury in children. Neurosurgery. 2011;68:588-600. [DOI] [PubMed] [Google Scholar]
- 19. Spagnoli A, Rosenfeld RG. The mechanisms by which growth hormone brings about growth. The relative contributions of growth hormone and insulin-like growth factors. Endocrinol Metab Clin North Am. 1996;25:615-31. [DOI] [PubMed] [Google Scholar]
- 20. Longobardi L, O’Rear L, Aakula S, Johnstone B, Shimer K, Chytil A, et al. Effect of IGF-1 in the chondrogenesis of bone marrow mesenchymal stem cells in the presence or absence of TGF-beta signaling. J Bone Miner Res. 2006;21(4):626-36. [DOI] [PubMed] [Google Scholar]
- 21. Amarpal, Kinjavdekar P, Aithal HP, Pawde AM, Singh J, Udehiya R. Evaluation of xylazine, acepromazine and medetomidine with ketamine for general anaesthesia in rabbits. Scand J Lab Anim Sci. 2010;37:223-9. [Google Scholar]
- 22. Butler M. Growth and maintenance of cells in culture. In: Animal cell culture and technology. 2nd ed. London: Garland Science; 2004. p. 55. [Google Scholar]
- 23. Sasazaki Y, Shore R, Seedhom BB. Deformation and failure of cartilage in the tensile mode. J Anat. 2006;208:681-94. [DOI] [PMC free article] [PubMed] [Google Scholar]
- 24. Rosenberg L. Chemical basis for the histological use of safranin O in the study of articular cartilage. J Bone Joint Surg Am. 1971;53:69-82. [PubMed] [Google Scholar]
- 25. Mainil-Varlet P, Van Damme B, Nesic D, Knutsen G, Kandel R, Roberts S. A new histology scoring system for the assessment of the quality of human cartilage repair: ICRS II. Am J Sports Med. 2010;38:880-90. [DOI] [PubMed] [Google Scholar]
- 26. Wang WM, Hu YY. Effect of marrow stromal cells derived chondrocytes on repair of full-thickness defects of rabbit articular cartilage. Zhongguo Xiu Fu Chong Jian Wai Ke Za Zhi. 2004;18:58-62. [PubMed] [Google Scholar]
- 27. Kelly DJ, Prendergast PJ. Mechano-regulation of stem cell differentiation and tissue regeneration in osteochondral defects. J Biomech. 2005;38:1413-22. [DOI] [PubMed] [Google Scholar]
- 28. Chang F, Ishii T, Yanai T, Mishima H, Akaogi H, Ogawa T, et al. Repair of large full-thickness articular cartilage defects by transplantation of autologous uncultured bone-marrow-derived mononuclear cells. J Orthop Res. 2008;26:18-26. [DOI] [PubMed] [Google Scholar]
- 29. Schmidt MB, Chen EH, Lynch SE. A review of the effects of insulin-like growth factor and platelet derived growth factor on in vivo cartilage healing and repair. Osteoarthritis Cartilage. 2006;14:403-12. [DOI] [PubMed] [Google Scholar]
- 30. Goshima J, Goldberg VM, Caplan AI. The osteogenic potential of culture-expanded rat marrow mesenchymal cells assayed in vivo in calcium phosphate ceramic blocks. Clin Orthop Relat Res. 1991;262:298-311. [PubMed] [Google Scholar]
- 31. Haynesworth SE, Goshima J, Goldberg VM, Caplan AL. Characterization of cells with osteogenic potential from human marrow. Bone. 1992;13:81-8. [DOI] [PubMed] [Google Scholar]
- 32. Ende N, Lu S, Mack R, Ponzio NM. The feasibility of using blood bank-stored (4 degrees C) cord blood, unmatched for HLA, for marrow transplantation. Am J Clin Pathol. 1999;111:773-81. [DOI] [PubMed] [Google Scholar]
- 33. Erices A, Conget P, Minguell JJ. Mesenchymal progenitor cells in human umbilical cord blood. Br J Haematol. 2000;109:235-42. [DOI] [PubMed] [Google Scholar]
- 34. Koch H, Jadlowiec JA, Campbell PG. Insulin-like growth factor-I induces early osteoblast gene expression in human mesenchymal stem cells. Stem Cells Dev. 2005;14(6):621-31. [DOI] [PubMed] [Google Scholar]
- 35. Holland TA, Bodde EW, Cuijpers VM, Baggett LS, Tabata Y, Mikos AG, et al. Degradable hydrogel scaffolds for in vivo delivery of single and dual growth factors in cartilage repair. Osteoarthritis Cartilage. 2007;15:187-97. [DOI] [PubMed] [Google Scholar]
- 36. Tuncel M, Halici M, Canoz O, Yildirim Turk C, Oner M, Ozturk F, et al. Role of insulin like growth factor-I in repair response in immature cartilage. Knee. 2005;12:113-9. [DOI] [PubMed] [Google Scholar]
- 37. Lettry V, Hosoya K, Takagi S, Okumura M. Coculture of equine mesenchymal stem cells and mature equine articular chondrocytes results in improved chondrogenic differentiation of the stem cells. Jpn J Vet Res. 2010;58:5-15. [PubMed] [Google Scholar]
- 38. Longobardi L, Granero-Moltó F, O’Rear L, Myers TJ, Li T, Kregor PJ, et al. Subcellular localization of IRS-1 in IGF-1-mediated chondrogenic proliferation, differentiation and hypertrophy of bone marrow mesenchymal stem cells. Growth Factors. 2009;27(5):309-20. [DOI] [PubMed] [Google Scholar]
- 39. Wang F, Li Z, Tamama K, Sen CK, Guan J. Fabrication and characterization of prosurvival growth factor releasing, anisotropic scaffolds for enhanced mesenchymal stem cell survival/growth and orientation. Biomacromolecules. 2009;10:2609-18. [DOI] [PubMed] [Google Scholar]
- 40. Markway BD, Tan GK, Brooke G, Hudson JE, Cooper-White JJ, Doran MR. Enhanced chondrogenic differentiation of human bone marrow-derived mesenchymal stem cells in low oxygen environment micropellet cultures. Cell Transplant. 2010;19:29-42. [DOI] [PubMed] [Google Scholar]
- 41. Müller J, Benz K, Ahlers M, Gaissmaier C, Mollenhauer J. Hypoxic conditions during expansion culture prime human mesenchymal stromal precursor cells for chondrogenic differentiation in three-dimensional cultures. Cell Transplant. 2011;20(10):1589-602. [DOI] [PubMed] [Google Scholar]