Abstract
The mechanical index (MI) attempts to quantify the likelihood that exposure to diagnostic ultrasound will produce an adverse biological effect by a nonthermal mechanism. The current formulation of the MI implicitly assumes that the acoustic field is generated using the short pulse durations appropriate to B-mode imaging. However, acoustic radiation force impulse (ARFI) imaging employs high-intensity pulses up to several hundred acoustic periods long. The effect of increased pulse durations on the thresholds for inertial cavitation was studied computationally in water, urine, blood, cardiac and skeletal muscle, brain, kidney, liver and skin. The results show that while the effect of pulse duration on cavitation thresholds in the three liquids can be considerable, reducing them by, e.g., 6% – 24% at 1 MHz, the effect in tissue is minor. More importantly, the frequency dependence of the MI appears to be unnecessarily conservative, i.e., that the magnitude of the exponent on frequency could be increased to 0.75. Comparison of these theoretical results with experimental measurements suggests that some tissues do not contain the pre-existing, optimally sized bubbles assumed for the MI. This means that in these tissues the MI is not necessarily a strong predictor of the probability for an adverse biological effect.
Keywords: Acoustic Radiation Force Imaging, ARFI, bioeffects, cavitation threshold, inertial cavitation, mechanical index, MI
INTRODUCTION
The concept of ensuring ultrasound safety by onscreen display of indices related to the probability of inducing biological effects by known physical mechanisms is now well accepted by the medical community. However, this was not always the case. When diagnostic ultrasound imaging was first introduced, little information was available on the acoustic fields produced by clinical machines, and in any case, few users were sufficiently well trained to evaluate such information even had it been obtainable. Then on May 28, 1976, President Gerald Ford signed an act of the United States (US) Congress, the “Medical Device Amendments of 1976” to the “Federal Food, Drug and Cosmetic Act” (1938), which required that new medical devices offered for sale in the United States be substantially equivalent in safety and effectiveness to devices marketed for the same applications before that date (Nyborg 2003). Manufacturers provided various data to the Food and Drug Administration (FDA), including values for output power and intensities measured in water, as well as estimates of intensities expected in an average patient; safety was assessed by determining that these values were no greater than, or “substantially equivalent” to, those for “pre-Amendment devices”, i.e., diagnostic equipment in clinical use prior to May 28, 1976. By the late 1980s, it had become apparent to many users that the quality of diagnostic information could be improved by increasing acoustic outputs beyond the levels approved under the existing regulations. This supplied the impetus for the joint development of the so-called “output display standard” (ODS) by the American Institute of Ultrasound in Medicine (AIUM) and the National Electrical Manufacturers Association (NEMA) for the display of safety information on diagnostic ultrasound equipment (AIUM/NEMA 1992). After the ODS had been reviewed and widely accepted by the user community as being superior to the then-current application-specific regulatory framework, the FDA revamped its guidance for marketing of diagnostic ultrasound equipment in the United States (US FDA 1993; 1997). Note – Much more extensive information on the development of the ODS is available (e.g., Abbott 1999; Nyborg 2000; 2001).
Following implementation of the Medical Device Amendments, diagnostic ultrasound machines were classified as being either “track 1” for those having very low output levels or “track 3” for those with higher outputs (“track 2” was an interim procedure and is no longer used). The original track-3 guidelines were determined based on the highest output levels in use as of May 28, 1976, and for which no bioeffects had been reported. The upper bounds on the outputs permitted under track 3 were application-specific in that they differed depending on the medical specialty (e.g., cardiology, obstetrics, etc.) for which they were intended to be used. These limits were not based on scientific evidence related to specific bioeffects due to ultrasound (Fowlkes et al. 2008). In 1993, the guidelines for track-3 devices were modified with the implementation of two new safety indices, the thermal index (TI) and the mechanical index (MI) (AIUM/NEMA 1992; US FDA 1993; 1997). The equivalent international standards, “Particular requirements for the basic safety and essential performance of ultrasonic medical diagnostic and monitoring equipment” (IEC 2007) and its subsidiary “Test methods for the determination of thermal and mechanical indices related to medical diagnostic ultrasonic fields” (IEC 2010), were developed by the International Electrotechnical Commission (IEC).
The MI and TI were derived through an effort to relate output guidelines to potential bioeffects. However, the upper limits for acoustic output (Ispta, MI) were also tied to the pre- existing limits, rather than to scientific evidence of bioeffects (Fowlkes et al. 2008). Since 1993, acoustic output levels have increased within the context of the newer guidelines (Martin 2010). Concurrently, new imaging technologies have been developed that employ unique beam sequences that often approach the upper bounds of current limits, including harmonic imaging modes (Kollman 2007), and acoustic radiation force-based elasticity imaging modes (Mendelson et al. 2009; Palmeri et al. 2011).
When the MI and TI were first implemented, consideration was given to the question of whether upper limits on acoustic output should be retained by the FDA, or if outputs should be determined via risk-benefit analysis based on the ALARA (as low as reasonably achievable) principle (O’Brien et al. 2002). In 2008, the AIUM issued a consensus report on potential bioeffects of diagnostic ultrasound (Fowlkes et al. 2008). In this report, it was recommended that the FDA be encouraged to develop an open, scientifically valid process for assessing the benefits and risks of removing or modifying upward the current regulatory limits. It is widely recognized that many imaging modes may benefit from transient increases in both thermal and non-thermal parameters, particularly in cases where tissue overlying the beam focus is highly attenuating. For example, in tissue harmonic imaging (THI), the production of harmonics is proportional to the square of the pressure at the fundamental frequency of the transmit wave (Christopher 1997), and increased MIs would lead to increases in the depth of penetration. The desirability of increased output is especially true for Acoustic Radiation Force Impulse (ARFI) imaging modes for which the depth of penetration may be limited to only 6 – 8 cm at the upper limit on the MI, 1.9 (Park et al. 2013; Cosgrove et al. 2013). This situation has provoked renewed interest in raising the acoustic outputs for diagnostic ultrasound machines.
Although it has been the subject of study for many years, the precise relationship between the acoustic output parameters used to formulate the safety indices (e.g., acoustic pressure, frequency, pulse duration and repetition frequency, intensity) and biological effects is still not completely understood. The AIUM periodically reviews the status of this research and publishes its conclusions (Abramowicz et al. 2008; Church et al. 2008; Miller et al 2008; O’Brien et al. 2008; Stratmeyer et al. 2008). More recent reviews are also available (ter Haar 2012). This study was undertaken as part of an ongoing effort to assess the ability of the MI to quantify the probability of harm to the patient from exposure to the relatively long pulses necessary for ARFI imaging, a modality that was only just beginning to be explored when the ODS was developed. In this paper, the effect of pulse duration on inertial cavitation thresholds are determined computationally using the same methods and assumptions as in the original work of Apfel and Holland (1991), insofar as this is possible. However, there are two significant differences between the methods used previously and those employed in this study. Fist, as noted above, the pulse duration is increased from a single acoustic period to 100 periods or more. Second, the list of materials surrounding the bubble is now expanded to include three, rather than two, biologically relevant fluids, and six solid tissues. The inclusion of modeling of inertial cavitation in solid tissues is a significant advance over the work of Apfel and Holland (1991), but it must be pointed out that the necessary model was not developed for more than a decade after that publication.
Two important assumptions made by Apfel and Holland (1991) are retained. First, the bubble is driven by a single acoustic pulse. Second, bubbles having a range of sizes will be present in situ when the tissue is exposed to an acoustic field. Since this second assumption leads to the lowest thresholds, prudence dictates that it be made even though there is little if any evidence from imaging or other techniques to support it. Four criteria for the threshold for inertial cavitation are investigated: the maximum collapse temperature in the bubble equals 5000 K, and three additional criteria, as discussed below. These are used to compute “effective” values of the MI, termed MIEth. The theoretical thresholds are then compared to experimental thresholds that have become available since 1991, as are the theoretical MIEth’s and the experimental values of MIEth determined from them. Implications of these results for the MI are discussed.
MATERIALS AND METHODS
The Mechanical Index
The MI is defined as the estimated peak rarefactional pressure in vivo, pr, divided by the square root of the center frequency, fc, of the acoustic beam. The expression is based on an analytical solution obtained by Apfel and Holland (1991) for the radial motion of pre-existing air bubbles in water and blood exposed to a wave having a pulse duration of a single acoustic period. Apfel and Holland determined the approximate acoustic pressure amplitude required to cause an optimally sized bubble (i.e., the bubble size having the lowest threshold) to undergo inertial cavitation, i.e., a large expansion followed by a rapid, violent collapse. Such a collapse can radiate damaging shock waves and cause the gas within the bubble to attain a very high temperature, thereby producing large numbers of highly reactive free radicals. In their theoretical development of the MI, the criterion used by Apfel and Holland (1991) to define the threshold for onset of inertial cavitation was that the bubble’s internal temperature must reach 5000 K; this is also used as one of four threshold criteria studied for this report.
In its current form, the MI uses only two of the many parameters that characterize an acoustic field: the peak rarefactional pressure and the center frequency. Further, the results upon which it is based are valid only for liquids. This work investigates the effects of pulse durations much longer than the 14-period maximum reported earlier (Church 2005), and it also models several tissues using values for elasticity (or more precisely, the shear modulus) and viscosity determined experimentally rather than estimating these values as was done previously (Church and Yang 2006).
Equation for Bubbles in Liquid
The general approach used here for determining the response of a bubble suspended in an unbounded, infinite liquid exposed to an acoustic field has been described in detail previously (Cramer 1980; Church 1989). The Gilmore-Akulichev formulation for bubble dynamics is:
| (1) |
where R, is the bubble radius, C is the calculated speed of sound in the liquid, H is the enthalpy of the liquid, and t is time; the single and double overdots indicate first and second derivatives with respect to time. The liquid is modeled using a Tait equation of state following the method of Lastman and Wentzell (1981). It is perhaps worth noting that although eqn. (1) is formally valid only to first order in the Mach number, the use of the enthalpy (defined as ) effectively includes most of the effect produced by second order terms (Prosperetti and Lezzi 1986), making the equation more accurate than would otherwise be expected.
Equation for Bubbles in Tissue
The acoustic response of bubbles in tissues was determined using the model of Yang and Church (2005), a Keller-Miksis-like equation assuming a gas bubble in an infinite linear Voigt viscoelastic solid:
| (2) |
where ρ is the density of the surrounding tissue,
| (3) |
σ is the surface tension, p0 is the hydrostatic pressure, PA is acoustic pressure amplitude at infinity, g(t) gives the shape of the driving pressure wave, G is the shear modulus (or rigidity), μ is the shear viscosity, and the subscript 0 indicates the initial value of a parameter.
Computational Approach
The general approach used here is similar to that employed by Apfel and Holland (1991) during the development of the MI. Thresholds for inertial cavitation are determined by numerical solution of Eqns (1) and (2). Among the more significant assumptions made for these computations are: (1) a single spherical bubble containing air is initially at rest (i.e., dR/dt = 0), (2) The gas is treated as ideal with the value of the polytropic exponent assumed to be either 1.0 or 1.4 for isothermal and adiabatic motion, respectively, (3) there is no exchange of gas or vapor with the surrounding material, and (4) the bubble radius is small compared to the acoustic wavelength. It is also worth noting that first-order corrections for liquid compressibility are included in the governing equations, a desirable feature considering the high acoustic pressure amplitudes necessary (Prosperetti and Lezzi 1986) for some combinations of the parameters of interest. A fourth-order Runge–Kutta technique is used to solve the initial value problem.
A few comments on these assumptions are in order. First, a single, isolated bubble is assumed for simplicity as well as for consistency with the modeling of Apfel and Holland (1991). In addition, these computations are intended to model conditions in tissues not known to contain undissolved gas, so the a priori presence of two or more bubbles in close proximity would be inconsistent with the fundamental nature of the problem of interest here. Second, the gas in the bubble is assumed to be ideal and sufficiently well-modeled by the polytropic assumption. This is equivalent to assuming that the pressure and temperature within the bubble are uniform and consequently that thermal dissipation is modeled poorly. Calculating the internal pressure and temperature numerically to achieve more accurate results could be done (Prosperetti et al 1988), but the time needed to obtain the several million sets of thresholds summarized in this work would have been excessive. Further, for one of the threshold criteria used in this work (Cmax = 1C0, see below) both extremes of the exponent are employed. The assumption of adiabatic behavior means that there is no transfer of heat between the interior of the bubble and the surrounding material, resulting in the highest internal temperatures, while the isothermal condition assumes instantaneous transfer of heat across the bubble wall, i.e., the rate of heat flux is infinite, resulting in a constant temperature inside the bubble. While the global thresholds shown here for the adiabatic condition would have been somewhat reduced had thermal damping been included, they would have been greater than the results obtained for the isothermal case. Thus the general thrust of the results would not have changed significantly. Finally, the damping due to viscosity is more important than either the thermal or acoustic mechanisms for results in tissue (Prosperetti 1977; Matsumoto et al 2005; Kreider et al 2011) for the smallest bubble radii that will form the basis for a new expression for the MI proposed below. Third, mass transfer between the interior and exterior of the bubble is neglected. Including either or both is possible (Church 1989; Matsumoto et al 2005; Kreider et al 2011), but with the exception of the cases for water and urine at longer pulse durations, the effects would be small because in tissue, lipids and proteins predominate in the surroundings, greatly reducing the accommodation coefficient from the value in pure water (Puente and Bonetto 2005; Fuster et al 2010). Fourth, assuming that the bubble radius is small compared to the wavelength is implemented by assuming that the acoustic pressure on the bubble wall is uniform. This common assumption provides a great simplification in the computations while introducing minimal error in the results.
The method used to determine the threshold for inertial cavitation, Pt, is essentially the same as that used by Apfel and Holland (1991). For a given acoustic frequency and for a specific threshold criterion, the minimal pressure amplitude required to satisfy that criterion is determined for each equilibrium radius in the range studied. Next, the global value for Pt, is then taken from the threshold for the bubble requiring the least acoustic pressure to satisfy the given threshold criterion. In addition, that bubble is described as being of optimal size. This procedure is repeated for each frequency, pulse duration, material, and threshold criterion studied.
In the work reported here, the acoustic frequency ranges from 0.5 to 10.0 MHz, and the pulse duration, PD, is varied over the range 1 – 100 acoustic periods in all cases and up to 1000 periods in selected cases (although it should be noted that 100 periods was sufficient for the present purposes for all cases reported here). The range of equilibrium bubble radii (R0) studied is 0.1–10.0 μm. Four criteria for the threshold acoustic pressure (Pt) are used: Rmax = 2R0 [a commonly used criterion first suggested by Flynn (1975)], Tmax = 5000 K (the criterion used for the MI) and Cmax,a = 1C0, all assuming adiabatic pulsations (i.e., there is no heat flow across the bubble interface), and Cmax,i = 1C0 assuming that the gas within the bubble behaves isothermally (i.e., the temperature within the bubble remains constant at its initial value, 37 °C.
The values for the physical parameters characterizing the materials surrounding the bubbles are given in Table 1. The values for tissue rigidity and viscosity at MHz frequencies were determined by Madsen et al. (1983), Yang and Church (2006) and Macé et al (2011). The values for density and surface tension are averages of values taken from various sources and are, therefore, somewhat debatable. However, variations in their values produce only minor changes in the results presented here. The ambient pressure and speed of sound are assumed to be 101.3 kPa and 1500 m s−1, respectively.
Table 1.
Material Properties.
| Material | Density (kg/m3) | Surface Tension (mN/m) | Viscosity (mPa-s) | Rigidity (MPa) |
|---|---|---|---|---|
| Water* | 1000 | 68.0 | 1.0 | 0.000 |
| Urine | 1022 | 60.0 | 0.84 | 0.000 |
| Blood | 1050 | 56.0 | 5.0 | 0.000 |
| Brain | 1050 | 56.0 | 9.0 | 0.012 |
| Heart | 1080 | 56.0 | 16.0 | 0.124 |
| Kidney | 1100 | 56.0 | 5.0 | 0.180 |
| Liver | 1100 | 56.0 | 9.0 | 0.040 |
| Muscle | 1100 | 56.0 | 7.0 | 0.450 |
| Skin | 1070 | 56.0 | 130.0 | 4.000 |
Values for water are for a temperature of 20 °C; all other materials are for 37 °C.
RESULTS AND DISCUSSION
Threshold as a Function of Bubble Radius
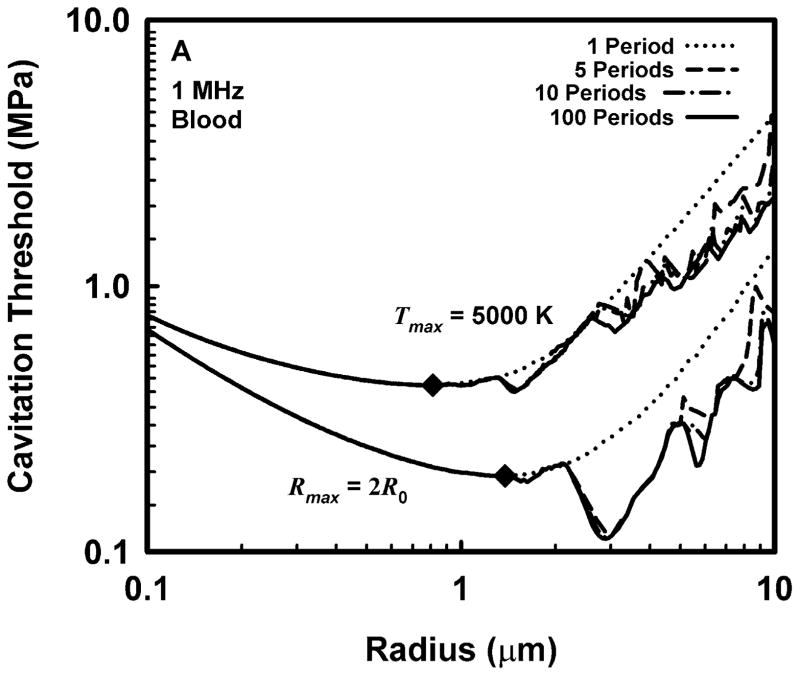
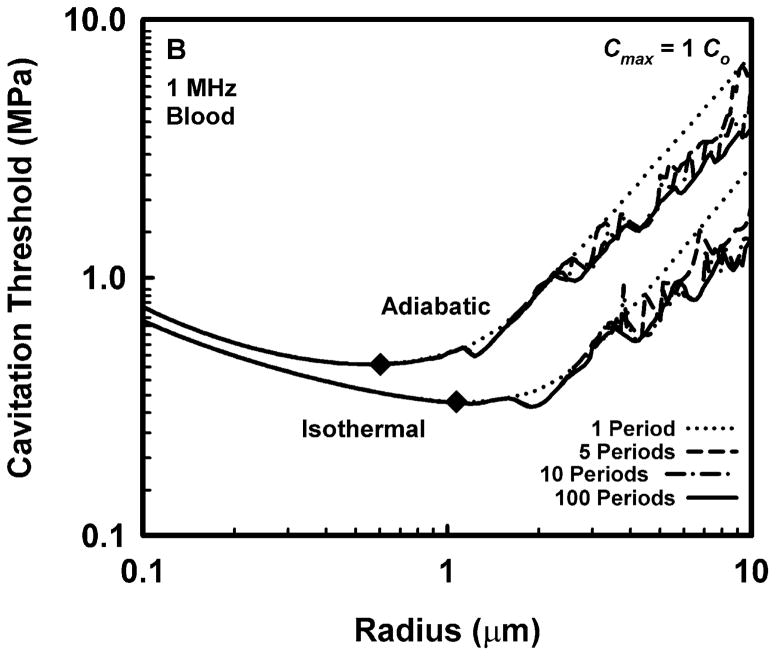
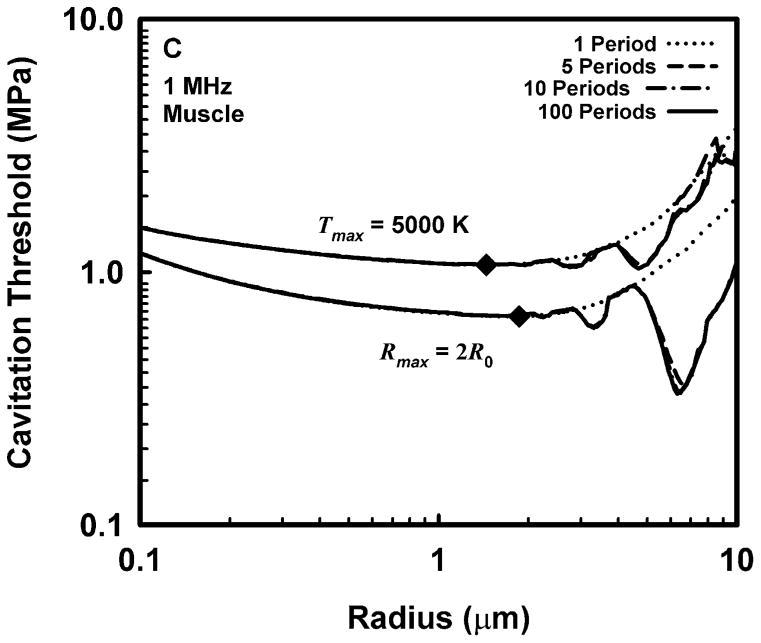
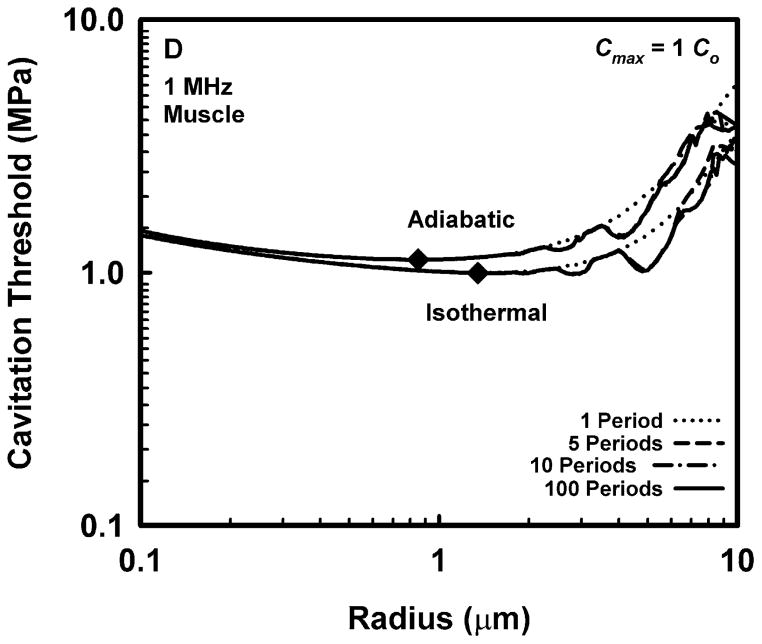
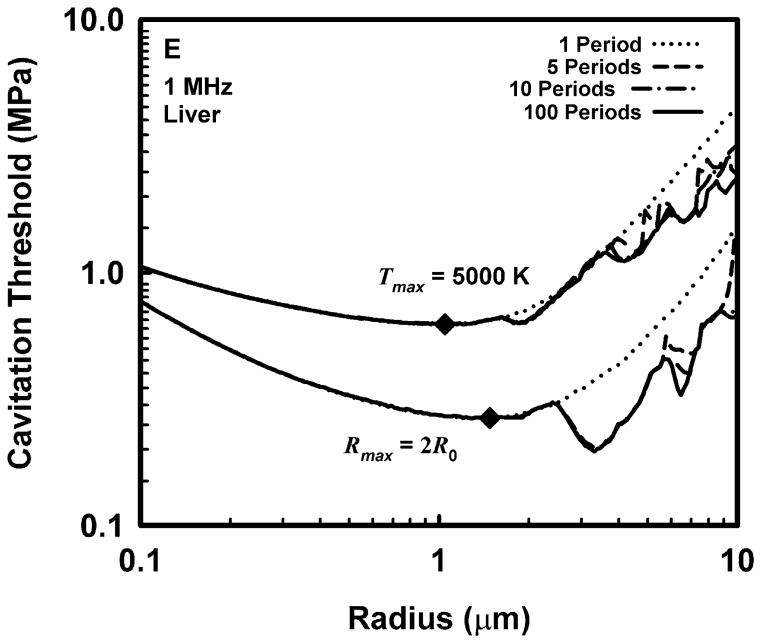
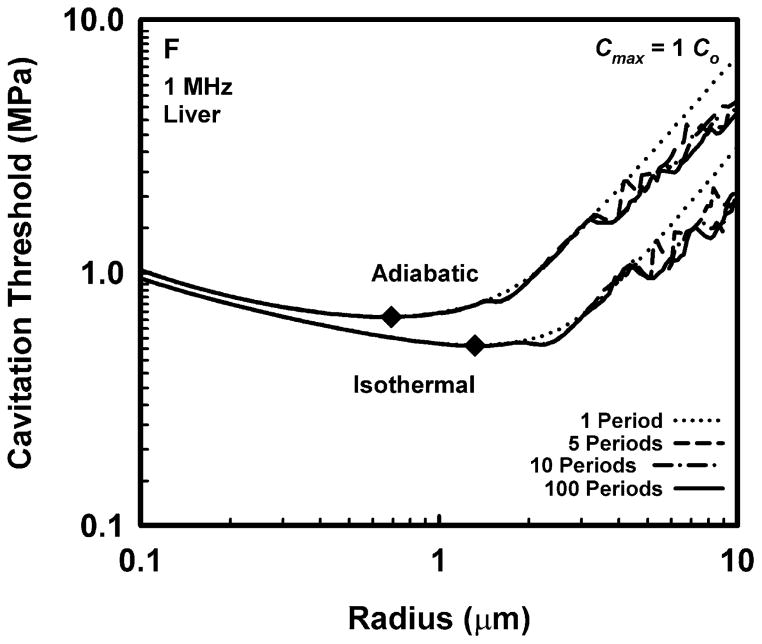
Representative results for cavitation threshold as a function of equilibrium bubble radius are given in Fig. 1 for air bubbles in blood (A, B), skeletal muscle (C, D) and liver (E, F) at an acoustic frequency of 1.0 MHz. Results for threshold criteria Rmax = 2R0 and Tmax = 5000 K are shown in plots A, C and E, while those for Cmax,a = 1C0 and Cmax,i = 1C0 are in plots B, D and F. Several observations common to many of the data sets are exemplified in the figures. For example, the effect of increasing pulse duration is to reduce the threshold for most, although not all, bubbles near to, or larger than, the optimally sized bubble (indicated by a filled diamond) determined for a pulse duration of 1 period. For a given pulse duration, bubble radius, and surrounding material, the threshold pressure for Tmax = 5000 K is always greater than that for Rmax = 2R0, and the threshold for Cmax,a = 1C0 is always greater than that for Cmax,i = 1C0. The thresholds for all criteria increase with the viscosity of the surrounding material under equivalent exposure conditions. There are often several distinct local minima for bubbles larger than the optimal size, although they may lie above 10 μm for stiffer materials and thus may not appear in the figures. In contrast, small bubbles usually exhibit few, and often no, resonance minima. These minima are the result of driven resonance responses (Flynn and Church 1988).
Figure 1.
Thresholds for inertial cavitation of air bubbles in blood (A, B), skeletal muscle (C, D) and liver (E, F) at 1 MHz for threshold criteria of Rmax = 2R0 and Tmax = 5000 K (A, C, E) and Cmax,a = 1C0 and Cmax,i = 1C0 (B, D, F); the numbers in the legends indicate pulse durations, the diamonds indicate the optimally sized bubble radii at 1 period.
Threshold as a Function of Acoustic Frequency
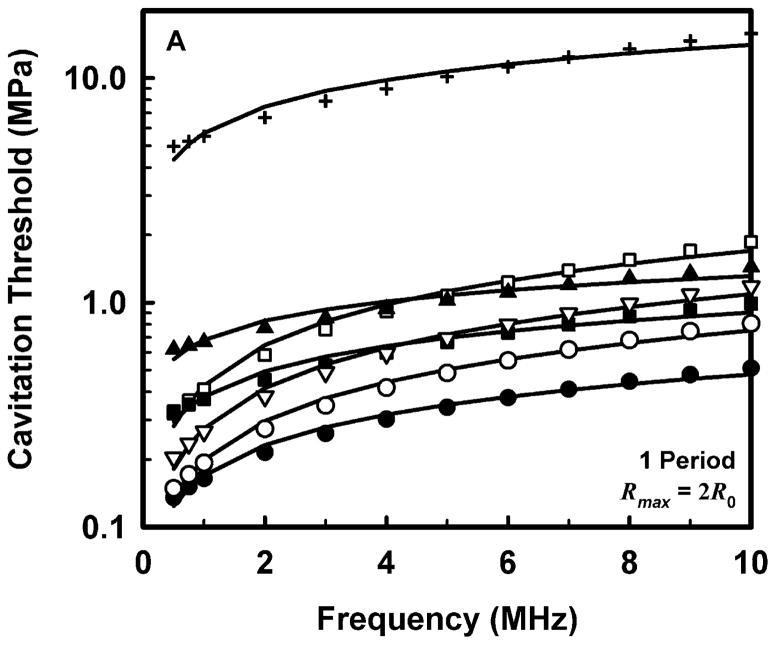
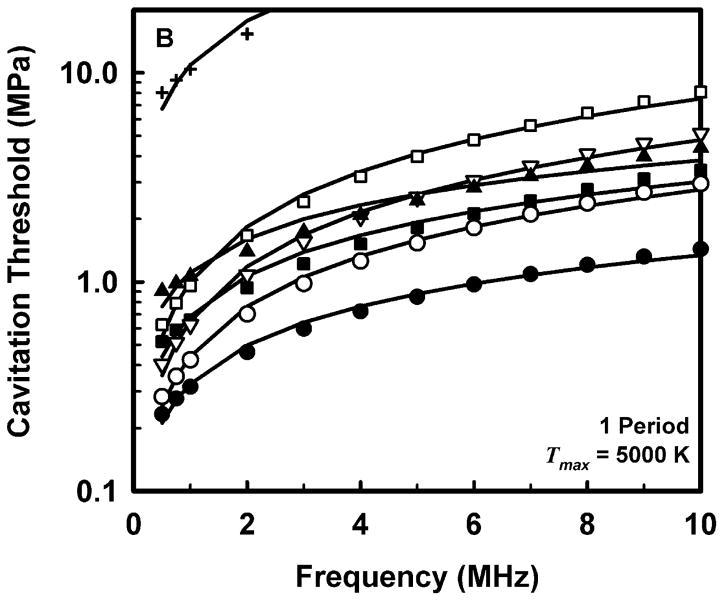
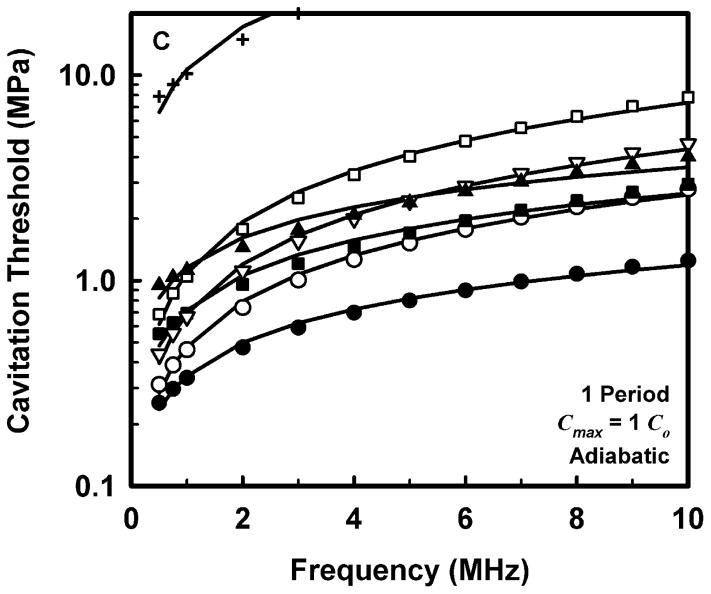
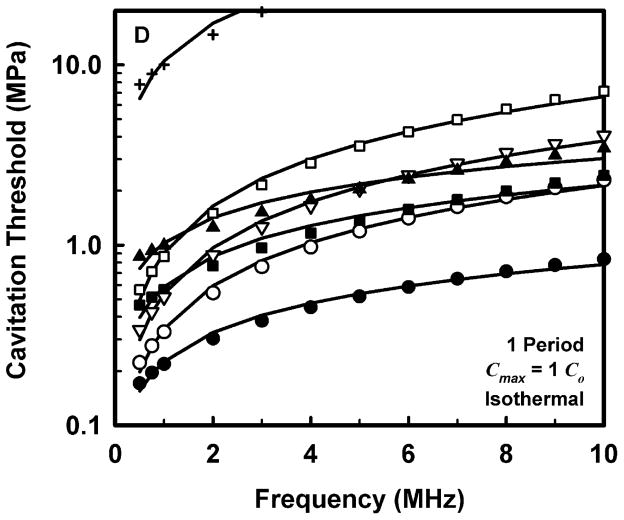
The computed threshold data for each combination of pulse duration and each material were fit to three equations, a power law with an intercept: Pt = A + Bfcn, a power law with no intercept: Pt = Bfcn, and a straight line: Pt = A + Bfc. The second form (Pt = Bfcn) is equivalent to that assumed for the MI (AIUM/NEMA 1992; IEC 2007). The second and third equations are special cases of the first and are studied to determine whether the intercept or the exponent is more important in determining the best fit to the data. The best fits were determined by minimizing the rms error. For all data sets, the power law with an intercept gave the best fit, an unsurprising result since that equation includes three fitting parameters while the others have only two apiece. Somewhat unexpectedly, the straight line fit better than the power law without an intercept in 88% of the cases studied, suggesting that both the exponent and the intercept are important parameters. Nevertheless, the values of the correlation coefficients for the simple power-law fits with A = 0 were quite good, 0.952 < r2 < 1.000, although those for the straight line and the power law with an intercept were even better, 0.992 < r2 < 1.000 and 0.999 < r2 < 1.000, respectively. Since results directly relevant to the MI are of interest here, Fig. 2 illustrates the fits of the computed cavitation thresholds to the power law without an intercept, Pt = Bfcn, for each of the four threshold criteria at a pulse duration of 1 period; the threshold data are designated by symbols. The values for these fits are given in Table 2.
Figure 2.
Thresholds for inertial cavitation of optimally sized air bubbles in water (●), blood (○), heart (□), kidney (■), liver (▽), skeletal muscle (▲), and skin (+), for threshold criteria of Rmax = 2R0 (A), Tmax = 5000 K (B), Cmax,a = 1C0 (C) and Cmax,i = 1C0 (D). Curves are the best fits of Pt = Bfcn to the numerical data (points).
Table 2.
Parameters for Best Fits of Threshold to Frequency for a Pulse Duration of 1 Period.
| Material | Adiabatic
|
Isothermal
|
||||||
|---|---|---|---|---|---|---|---|---|
|
Rmax = 2R0
|
Tmax = 5000 K
|
Cmax,a = 1 Co
|
Cmax,i = 1 Co
|
|||||
| B (MPa) | n (non) | B (MPa) | n (non) | B (MPa) | n (non) | B (MPa) | n (non) | |
| Water | 0.17 | 0.45 | 0.32 | 0.62 | 0.34 | 0.54 | 0.22 | 0.54 |
| Urine | 0.15 | 0.48 | 0.28 | 0.66 | 0.31 | 0.57 | 0.20 | 0.58 |
| Blood | 0.20 | 0.58 | 0.44 | 0.80 | 0.48 | 0.74 | 0.34 | 0.80 |
| Brain | 0.25 | 0.64 | 0.62 | 0.90 | 0.66 | 0.83 | 0.50 | 0.88 |
| Heart | 0.43 | 0.60 | 1.00 | 0.88 | 1.09 | 0.83 | 0.90 | 0.87 |
| Kidney | 0.38 | 0.37 | 0.69 | 0.64 | 0.72 | 0.57 | 0.59 | 0.56 |
| Liver | 0.28 | 0.60 | 0.65 | 0.87 | 0.69 | 0.80 | 0.54 | 0.85 |
| Muscle | 0.68 | 0.28 | 1.11 | 0.54 | 1.16 | 0.49 | 1.03 | 0.47 |
Comparison of the data in Table 2 for the three adiabatic threshold criteria shows that the values of the coefficients for either the temperature or adiabatic collapse-speed criterion are approximately twice those for the radial expansion criterion, i.e., Rmax = 2R0, meaning that it takes a more violent collapse to achieve those endpoints. The coefficients for the isothermal collapse-speed criterion fall below those for the temperature and collapse-speed criteria by 0.1 – 0.4 MPa.
The values shown in Table 2 for the exponent n, for the temperature and adiabatic collapse-speed criteria are also larger than those for the radial criterion, although the magnitudes of the differences are not as great as for the coefficients. The exponents for the two collapse-speed criteria are quite similar, with means and standard deviations of 0.67 ± 0.13 and 0.68 ± 0.16 for the adiabatic and isothermal thresholds, respectively. Interestingly, the coefficients for the temperature criterion are somewhat smaller than those for the adiabatic collapse-speed criterion, but the corresponding exponents are usually somewhat larger, indicating that the thresholds for the temperature criterion increase faster with frequency than do the thresholds for any other criterion. This result holds for all pulse durations. Significantly, the exponents determined for each material using any of the three more violent threshold criteria, Tmax, Cmax,a, or Cmax,i, are larger than the value assumed for the MI, 0.5, suggesting that the index may unnecessarily restrict output levels at higher frequencies.
Threshold as a Function of Acoustic Pulse Duration
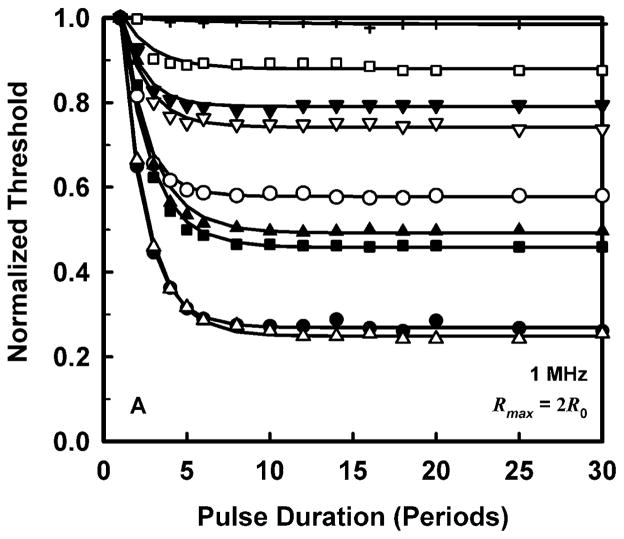
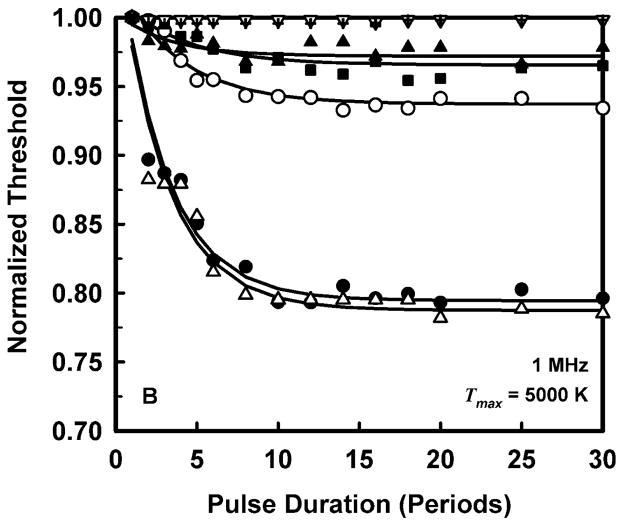
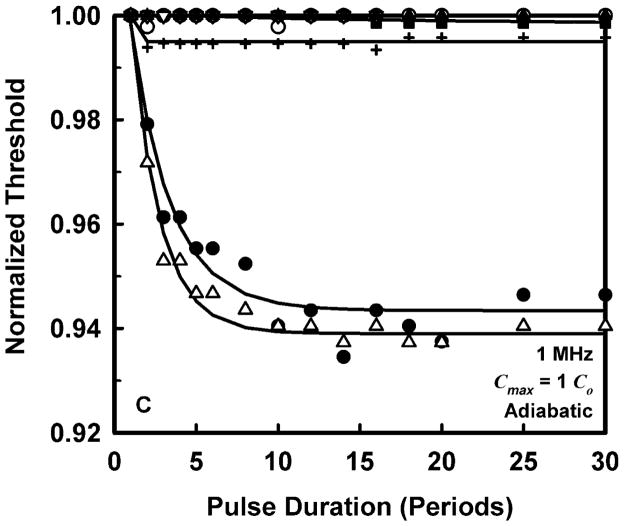
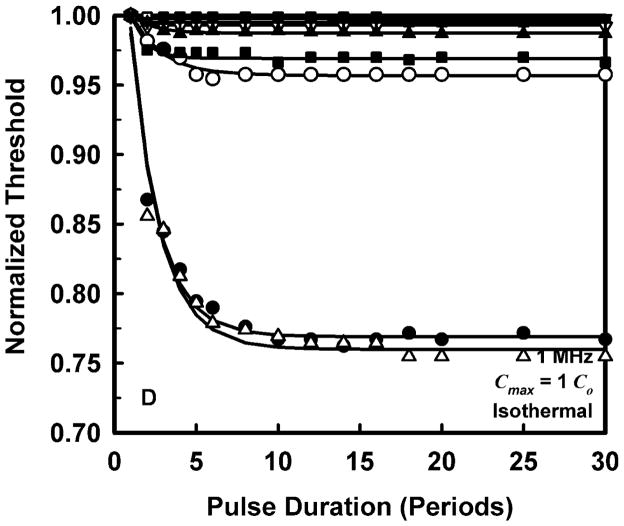
To allow a simpler analysis of pulse duration as well as provide more manageable results, it is convenient to normalize the threshold at each pulse duration to the value for a duration of 1 period. The results for normalized threshold Pt,n, at 1 MHz are shown in Fig. 3 for the four threshold criteria. The data are indicated by the symbols, and the curves are the best fits to Pt,n = A + Bexp(PD). This choice for the equation produces fits that are somewhat better than several alternatives also investigated, e.g., Pt,n = A + B(PD)n, although there is often little difference among them. A more compelling reason for choosing an exponential fit is that while other equations continue to decline as pulse duration increases, the data do not.
Figure 3.
Normalized thresholds for inertial cavitation at 1 MHz in water (●), urine (△), blood (○), brain (▼), heart (□), kidney (■), liver (▽), skeletal muscle (▲), and skin (+), as a function of pulse duration for threshold criteria of Rmax = 2R0 (A), Tmax = 5000 K (B), Cmax,a = 1C0 (C) and Cmax,i = 1C0 (D). Curves are the best fits of Pt = A + Bexp(PD) to the data (points).
The plots in Fig. 3 show that the effect of pulse duration is substantial for only two cases. The first case is for the least violent threshold criterion, Rmax = 2R0, and includes all materials except skin. In this case, increasing pulse duration can produce a decrease in threshold by 12% – 70% at 1 MHz. The second case includes only materials having the lowest values of viscosity, i.e., water and urine. For these liquids, the threshold for inertial cavitation may decrease by 6% – 24% at 1 MHz. The small magnitude of the effect of pulse duration in tissues contrasts sharply with both current and previous results for liquids (Church 2005). However, regardless of the magnitude of the reduction in threshold, the effect of pulse duration reaches its limit within 15 to 20 acoustic periods in all of the materials investigated for this report. To incorporate the effect of pulse duration into a single equation for the cavitation threshold for ARFI pulses, the normalized thresholds at a duration of 100 periods are fit to an equation of the form, Pt,n(100) = Bfcn; the fits would be essentially the same for any duration beyond 20 periods. The values of the fitting parameters for best fits to the normalized data are given in Table 3.
Table 3.
Parameters for Best Fits of Normalized Threshold for a Pulse Duration of 100 Periods.
| Material | Adiabatic
|
Isothermal | ||||||
|---|---|---|---|---|---|---|---|---|
|
Rmax = 2R0
|
Tmax = 5000 K
|
Cmax,a = 1 Co
|
Cmax,i = 1 Co
|
|||||
| B (non) | n (non) | B (non) | n (non) | B (non) | n (non) | B (non) | n (non) | |
| Water | 0.27 | 0.23 | 0.81 | 0.07 | 0.94 | 0.01 | 0.78 | 0.05 |
| Urine | 0.26 | 0.20 | 0.80 | 0.06 | 0.94 | 0.00 | 0.77 | 0.05 |
| Blood | 0.57 | 0.28 | 0.95 | 0.03 | 1.00 | 0.00 | 0.95 | 0.03 |
| Brain | 0.76 | 0.16 | 1.00 | 0.00 | 1.00 | 0.00 | 0.99 | 0.00 |
| Heart | 0.82 | 0.11 | 1.00 | 0.00 | 1.00 | 0.00 | 0.99 | 0.00 |
| Kidney | 0.47 | 0.34 | 0.97 | 0.01 | 1.00 | 0.00 | 0.97 | 0.01 |
| Liver | 0.72 | 0.17 | 1.00 | 0.00 | 1.00 | 0.00 | 0.99 | 0.01 |
| Muscle | 0.51 | 0.31 | 0.98 | 0.01 | 1.00 | 0.00 | 0.98 | 0.01 |
| Skin | 0.94 | 0.03 | 1.00 | 0.00 | 1.00 | 0.00 | 1.00 | 0.00 |
The Final Formulation
Because the data for threshold as a function of frequency and the normalized threshold as a function of pulse duration are both well fit by the same equation, it is convenient to combine the two sets of fits into a single result. The parameters for the final equation, Pt,tis = Bfcn, are given in Table 4 for each tissue.
Table 4.
Parameters for Best Fits of Threshold for a Pulse Duration of 100 Periods.
| Material | Adiabatic
|
Isothermal | ||||||
|---|---|---|---|---|---|---|---|---|
|
Rmax = 2R0
|
Tmax = 5000 K
|
Cmax,a = 1 Co
|
Cmax,i = 1 Co
|
|||||
| B (MPa) | n (non) | B (MPa) | n (non) | B (MPa) | n (non) | B (MPa) | n (non) | |
| Water | 0.05 | 0.68 | 0.26 | 0.69 | 0.32 | 0.55 | 0.17 | 0.59 |
| Urine | 0.04 | 0.63 | 0.25 | 0.66 | 0.30 | 0.53 | 0.16 | 0.56 |
| Blood | 0.11 | 0.86 | 0.42 | 0.82 | 0.47 | 0.74 | 0.33 | 0.82 |
| Brain | 0.19 | 0.80 | 0.62 | 0.90 | 0.66 | 0.83 | 0.50 | 0.89 |
| Heart | 0.35 | 0.71 | 1.00 | 0.88 | 1.09 | 0.83 | 0.90 | 0.87 |
| Kidney | 0.18 | 0.72 | 0.66 | 0.66 | 0.72 | 0.57 | 0.57 | 0.58 |
| Liver | 0.20 | 0.77 | 0.65 | 0.87 | 0.69 | 0.80 | 0.53 | 0.85 |
Average values for the fitting parameters shown in Table 4 are given in Table 5 for three categories: 1) all of the materials studied, labeled “All Materials”, 2) all of the biological tissues studied, i.e., all of the materials studied with the exception of water and urine, labeled “All Tissues”, and 3) all of the biological tissues studied with the exception of skin, labeled “Soft Tissues”. Also shown in Table 5 are values for the fitting parameters for pulse durations of 1 – 10 periods. Notice that the values for the exponent on frequency are greater than the 0.5 assumed for the MI for a pulse duration of 100 periods in all cases, ranging from 0.67 – 0.78. The values for the temperature criterion are the largest at approximately 0.75. The only values for the exponent that are in the range of 0.5 are those for the shortest pulse durations and the least violent threshold criterion, Rmax = 2R0, which actually start slightly below 0.5 but quickly increase to levels similar to those found for the other threshold criteria. These results support the possibility that the frequency response of the MI may be safely modified for certain selected imaging modes requiring longer pulse durations and greater outputs, e.g., ARFI imaging.
Table 5.
Average Parameters for Best Fits of Threshold for Pulse Durations of 1 to 100 Periods.
| Material | Adiabatic
|
Isothermal | ||||||
|---|---|---|---|---|---|---|---|---|
|
Rmax = 2R0
|
Tmax = 5000 K
|
Cmax,a = 1 Co
|
Cmax,i = 1 Co
|
|||||
| B (MPa) | n (non) | B (MPa) | n (non) | B (MPa) | n (non) | B (MPa) | n (non) | |
| All Materials | ||||||||
| 1 Period | 0.91 | 0.48 | 1.78 | 0.73 | 1.79 | 0.67 | 1.65 | 0.69 |
| 3 Periods | 0.81 | 0.59 | 1.77 | 0.74 | 1.79 | 0.67 | 1.64 | 0.70 |
| 5 Periods | 0.77 | 0.66 | 1.77 | 0.74 | 1.79 | 0.67 | 1.63 | 0.70 |
| 8 Periods | 0.76 | 0.69 | 1.76 | 0.74 | 1.78 | 0.67 | 1.63 | 0.70 |
| 10 Periods | 0.76 | 0.69 | 1.76 | 0.75 | 1.78 | 0.67 | 1.63 | 0.70 |
| 100 Periods | 0.76 | 0.69 | 1.76 | 0.75 | 1.78 | 0.67 | 1.63 | 0.70 |
| All Tissue | ||||||||
| 1 Period | 1.13 | 0.50 | 2.20 | 0.76 | 2.21 | 0.71 | 2.06 | 0.73 |
| 3 Periods | 1.02 | 0.62 | 2.20 | 0.76 | 2.20 | 0.71 | 2.05 | 0.74 |
| 5 Periods | 0.97 | 0.68 | 2.20 | 0.76 | 2.20 | 0.71 | 2.05 | 0.74 |
| 8 Periods | 0.96 | 0.69 | 2.19 | 0.77 | 2.20 | 0.71 | 2.05 | 0.74 |
| 10 Periods | 0.96 | 0.70 | 2.19 | 0.77 | 2.20 | 0.71 | 2.05 | 0.74 |
| 100 Periods | 0.96 | 0.70 | 2.19 | 0.77 | 2.20 | 0.71 | 2.05 | 0.74 |
| Soft Tissue | ||||||||
| 1 Period | 0.37 | 0.51 | 0.75 | 0.77 | 0.80 | 0.71 | 0.65 | 0.74 |
| 3 Periods | 0.27 | 0.66 | 0.74 | 0.77 | 0.80 | 0.71 | 0.64 | 0.75 |
| 5 Periods | 0.24 | 0.72 | 0.74 | 0.78 | 0.80 | 0.71 | 0.64 | 0.75 |
| 8 Periods | 0.23 | 0.74 | 0.74 | 0.78 | 0.80 | 0.71 | 0.64 | 0.75 |
| 10 Periods | 0.23 | 0.74 | 0.74 | 0.78 | 0.80 | 0.71 | 0.64 | 0.75 |
| 100 Periods | 0.23 | 0.74 | 0.74 | 0.78 | 0.80 | 0.71 | 0.64 | 0.75 |
Potential Changes to the MI
Before suggesting an alternative value for the exponent on frequency, it is first helpful to recall that the value currently used for the MI was obtained from the average of the two exponents on the threshold pressure (the original threshold data were fit to an equation of the form Pta = Afc, Apfel and Holland, 1991). The two values of a were 2.1 and 1.67, for water and blood, respectively, which average to 1.94. If the results of Apfel and Holland (1991) were written in the form used in the analysis presented here, the exponent would be 0.52. For comparison, the average of the values for water and blood given in Table 2 for the temperature criterion is 0.71. It is worth noting here that Bader and Holland (2013) have recently proposed a “cavitation index” to “gauge the likelihood of subharmonic emissions due to stable cavitation activity nucleated from” ultrasound contrast agents. Their ICAV would have the same form as the MI but with an exponent a = 1.0.
If the value of the exponent on frequency used in the MI is to be changed, it will be necessary to choose one among several alternatives given in Table 5. For example, it might be reasonable to choose a value a little less than the lowest value, 0.67, so the new exponent could be taken as 0.65. This might also be the result of limiting the choices to results for all tissues or only soft tissues, whose minima are 0.71. However, it is also reasonable to suggest that an average value should be considered. The averages for the three cases, all materials, all tissues, and all soft tissues, are 0.70 ± 0.03, 0.73 ± 0.03, 0.74 ± 0.03, respectively. This approach leads to a slighter greater value for the new exponent, 0.70.
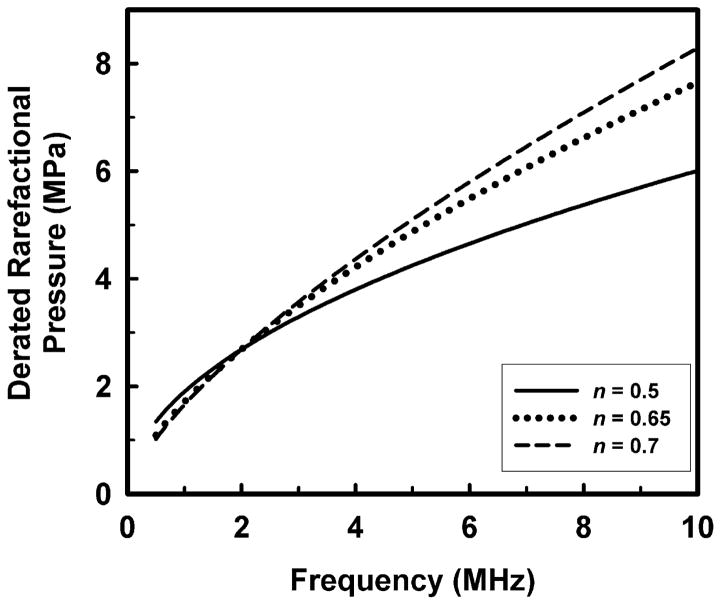
A note of caution is in order here. Before any change to the current approach is implemented, it must be remembered that the maximum recommended MI for devices approved by the FDA under its Track 3 guidelines is 1.9, and that the acoustic working frequency of the 1976 comparison device was 2.0 MHz (Nyborg 2000). This corresponds to a maximal derated rarefactional pressure amplitude of 2.69 MPa. If the exponent on frequency were raised to either 0.65 or 0.70 as suggested above, then the FDA guideline for maximal MI might also have to be lowered in order to satisfy the requirement of the 1976 FDA Medical Device Amendments, in these cases from 1.9 to 1.71 or 1.65, or decreases of 10% or 13.2%, respectively. This means that while the highest derated rarefactional pressure permitted by the FDA would increase for frequencies greater than 2.0 MHz, it would decrease for lower frequencies. This is illustrated by the plot in Fig. 4.
Figure 4.
The potential effect on the maximal permitted derated rarefactional pressure of increasing the exponent on frequency assumed for the MI from 0.50 to either 0.65 or 0.70.
Comparisons to Experimental Results
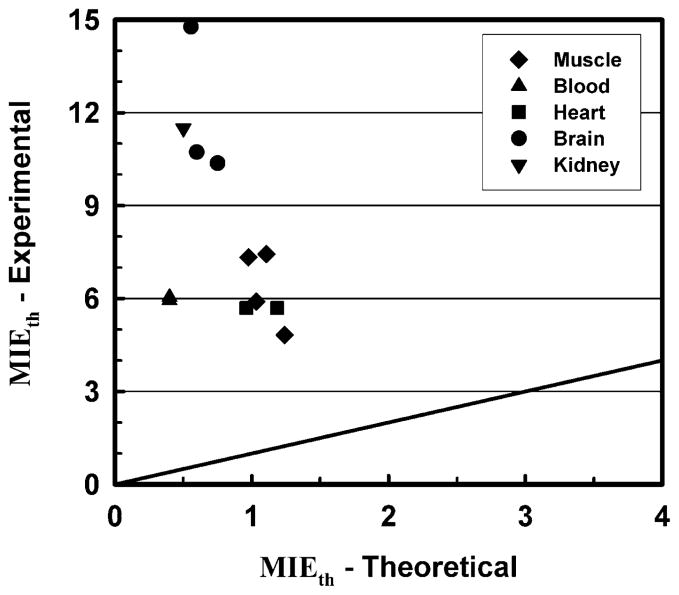
It is instructive to compare the theoretical predictions resulting from the present work to experimental data for cavitation thresholds in vivo that appear in the literature. First, it must be stressed that there are relatively few sources for such data, and even fewer that were the result of experiments conducted in tissues for which the necessary data for calculations of the mechanical responses in the lower MHz frequency range are also available. In fact, meaningful comparisons are possible for only five tissues: blood, brain, kidney, cardiac (i.e., smooth) muscle and skeletal (i.e., striated) muscle. A summary of the experimental data is provided in the left-hand columns of Table 6. Entries for the effective value of the MI at threshold, MIEth, are the ratios of the rarefactional pressure derated using data provided in the respective reports to the square root of the center frequency (Miller et al. 2010; Wang et al. 2009). The theoretical data on the right-hand side of Table 6 show results for the frequencies and pulse durations nearest the corresponding experimental values. The threshold criterion is the same as that used for the MI appearing onscreen, Tmax = 5000 K, with the exception that no derating is applied to the calculated rarefactional pressures to obtain values for MIEth. Comparison of either the peak rarefactional pressures or the MIs at threshold shows the differences between the experimental and theoretical values to be unexpectedly large. A plot illustrating these rather dramatic results is given in Fig. 5.
Table 6.
Comparisons of Experimental and Theoretical Thresholds for Inertial Cavitation.
| Experiment
|
Theory
|
||||||
|---|---|---|---|---|---|---|---|
| Frequency (MHz) | Pulse Duration (Periods) | Number of Pulses (non) | Derated PRP (MPa) | MIEth (non) | Frequency (MHz) | Derated PRP (MPa) | MIEth (non) |
| Skeletal Muscle | |||||||
| 0.56a) | 558000 | 1 | 3.6 | 4.8 | 0.5 | 0.87 | 1.24 |
| 0.66b) | 2 | 1 – 2 | 6.0 | 7.4 | 0.75 | 0.96 | 1.11 |
| 1.00a) | 1000000 | 1 | 5.9 | 5.9 | 1.0 | 1.03 | 1.03 |
| 1.68a) | 1680000 | 1 | 9.5 | 7.3 | 2.0 | 1.38 | 0.98 |
| Blood | |||||||
| 1.13c) | 500 | 60 | 6.4 | 6.0 | 1.0 | 0.40 | 0.40 |
| 1.17d) | 500 | 120 | 6.4 | 5.9 | 1.0 | 0.40 | 0.40 |
| Cardiac Muscle | |||||||
| 1.5e) | 30 | 1 | 7.0 | 5.7 | 1.0 | 0.96 | 0.96 |
| 1.5e) | 3000 | 1 | 7.0 | 5.7 | 2.0 | 1.68 | 1.19 |
| Brain | |||||||
| 0.66f) | 2 | 1 – 2 | 12.0 | 14.8 | 0.75 | 0.48 | 0.56 |
| 0.94g) | 940 | 1 | 10.4 | 10.4 | 1.0 | 0.60 | 0.60 |
| 1.72g) | 1720 | 1 | 13.6 | 10.4 | 2.0 | 1.06 | 1.19 |
| Kidney | |||||||
| 0.17h) | 10 | 12000 | 4.7 | 11.5 | 0.5 | 0.35 | 0.50 |
PRP = peak rarefactional pressure; MIEth = the effective value of the mechanical index at threshold (see text for details); Sources for experimental results:
Figure 5.
Values of the effective mechanical index, MIE, calculated for experimental and theoretical thresholds for inertial cavitation. The diagonal line shows where the points would fall if the results were equal.
The results of the comparisons suggest that there is a substantial mismatch between the mechanical responses of actual tissues exposed to diagnostic ultrasound and the mathematical modeling used to understand those responses. Fundamental to the theoretical approach used to derive the MI and to extend it to solid tissues is the assumption that there are pre-existing bubbles of optimal size in biological tissues. Because it leads to the lowest threshold and therefore the largest margin of safety in clinical examinations, this was a prudent assumption when the MI was developed. However, the results in Table 6 lead to the conclusion that optimally sized bubbles do not exist in tissue, or at least not in the tissues listed in the table.
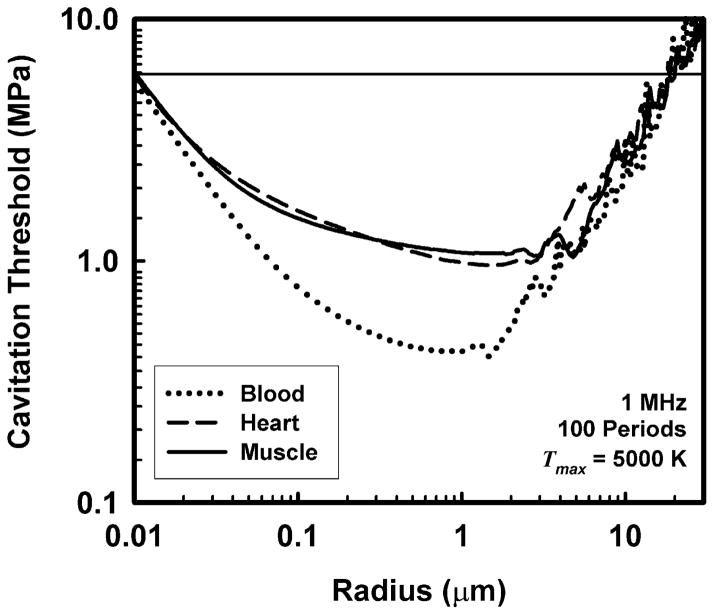
Still, this does not necessarily mean that there are no pre-existing stabilized bubbles in tissues. Consider the calculations for cavitation threshold shown in Fig. 6. These data were produced merely by extending the range of initial bubble radii to both smaller and larger values than those given in Fig. 1. Since the thresholds increase in either case, pre-existing bubbles may be either larger or smaller than those of optimal size. For the cases shown in Fig. 6, the bubble radii would be either less than about 0.01 μm (10 nm) or greater than about 20 μm. Since bubbles having radii of 20 μm or more, if present, would be easily visible onscreen during most diagnostic examinations, and because there are no known mechanisms for the creation and long-term stabilization of bubbles of this size in vivo, it seems unlikely that they are present in tissue to any great extent. This leads to the conclusion that nm-size bubbles may be present in tissues in vivo. Significantly, Maxwell et al. (2013) concluded that pre-existing bubbles having radii on the order of a few nanometers may have been responsible for their measured values of cavitation thresholds in tissue-mimicking materials and ex vivo canine blood, kidney and adipose tissue.
Figure 6.
An extended version of the thresholds for inertial cavitation of air bubbles in skeletal muscle, blood and cardiac muscle at 1 MHz for a threshold criterion of Tmax = 5000 K. The horizontal line at 5.9 MPa is the rarefactional pressure threshold for skeletal muscle, the lowest experimental value shown in Table 6 for these tissues.
The existence of very small stabilized bubbles has been the subject of numerous studies, and several plausible mechanisms have been proposed for their creation (Harvey et al. 1944; Church 2002; Krasovitski et al. 2011) and stabilization (Akulichev 1966; Fox and Herzfeld 1954; Harvey et al. 1944; Sirotyuk 1970; Yount 1979). Significantly, Yount et al. (1984) showed that the distribution of cavitation nuclei in water and gelatin consisted of objects whose “radii are on the order of 1 μm or less and can be three orders of magnitude smaller. The number density decreases exponentially with increasing radius.” Apparently such nuclei are created by simple physicochemical processes that may occur anywhere. The experimental results in Table 6 and analysis in Fig. 6 combine to suggest two distinct possibilities. The first hypothesis is that the same processes that create cavitation nuclei in non-living materials are also active in vivo, but natural physiological processes remove most of those nuclei while leaving some of the smallest unaffected. The second possibility is that some other process creates very small nuclei but only when an acoustic field is present. It is difficult to distinguish between these two hypotheses, and of course it is also possible that both occur in the body.
Additional information on the presence and nature of cavitation nuclei in vivo may be obtained by comparing the theoretical results obtained in this work with the measurements of threshold intensities for lesion formation in feline brain (Fry et al. 1970; Dunn and Fry 1971; Dunn et al. 1975). They showed that the threshold intensity increased by as much as two orders of magnitude as the pulse duration decreased from 1 s to 200 μs for exposures at 1 – 9 MHz (Dunn et al. 1975). This is in stark contrast to the theoretical results for any of the soft tissues studied in this report which demonstrate that pulse duration has little effect on the thresholds for pre-existing bubbles, and that even this small effect occurs within the first 15 to 20 acoustic periods. These findings are consistent with the work of Miller et al. (2011) who found no difference in the threshold for inertial cavitation in canine myocardium exposed to 1-MHz ultrasound for 20 or 2000 μs. Resolving the apparent discrepancy between these two sets of results is a subject of continuing study.
Due to the importance of understanding the mechanism for initiating cavitation in tissue, the following observations are presented. First, the intensities given by Dunn et al. (1975) were obtained by linear extrapolation from measurements made at low intensities and so do not account for the effects of nonlinear propagation which reduce actual focal intensities below linear estimates (Christopher and Carstensen 1996; Duck 2002). Consequently the acoustic pressures calculated from the data of Dunn et al. (1975) are likely greater than the actual in situ values. Second, the results are not inconsistent with the hypothesis that a small number of very small stabilized bubbles may exist in blood and occasionally be carried into the focal zone of a high-power transducer where they nucleate cavitation bubbles. Third, some process may create very small nuclei in the tissue itself when an acoustic field of sufficient amplitude and duration is present. Indeed, nonlinear heating of tissue in the focal region (Christopher and Carstensen 1996) would greatly enhance the process of spontaneous nucleation (Church 2002). This kind of boiling cavitation, which is observed in tissues exposed to high-intensity focused ultrasound (HIFU), can occur within 30 ms or less (Canney et al 2010; Khokhlova et al 2011). It would be difficult to distinguish between the latter two possibilities.
The foregoing results and discussion lead to the following conclusions. First, experimental results demonstrate that optimally sized bubbles do not exist in mammalian tissues, at least not in the cases reviewed here. This suggests that the mathematical expression currently used for the MI is not the best possible form for those tissues. Second, if the concept of the optimally sized nucleus is retained, then the theoretical results presented above show that a more generally correct form for the MI would be pr.3/fcn, where n ~ 0.75. It is worth noting that previous theoretical studies assuming optimally sized nuclei also suggested that a larger value for n provided improved fits to theoretical results (Šponer 1990 1991; Church 2005). In addition, Hynynen (1991) found that the threshold for inertial cavitation in canine skeletal muscle increased linearly with frequency. Unfortunately, too little information on the experimental threshold for inertial cavitation in other tissues is available to know whether this pattern is consistent across a range of tissues or applies only to striated muscle. Thus, the connection between the MI and the probability for induction of an adverse biological effect is not as clear as was originally thought. In any case, while the precise form of the MI may not be pr.3/√fc, for the tissues studied here, the MI remains useful in the clinic because it makes the important prediction that cavitation thresholds increase with frequency. A suggestion for improving the MI is under study and will be presented in the future.
Acknowledgments
This work was supported in part by NIH grants R21EB013763 (CCC, CL) and R01EB002132 and R01CA142824 (KN).
Footnotes
Note – A more limited version of this work, presented at the IEEE Ultrasound Symposium held in Dresden, Germany, in October, 2012, contains additional plots of results for combinations of parameters and endpoints not shown explicitly here (Church et al. 2012).
Publisher's Disclaimer: This is a PDF file of an unedited manuscript that has been accepted for publication. As a service to our customers we are providing this early version of the manuscript. The manuscript will undergo copyediting, typesetting, and review of the resulting proof before it is published in its final citable form. Please note that during the production process errors may be discovered which could affect the content, and all legal disclaimers that apply to the journal pertain.
References
- Abbott JG. Rationale and derivation of MI and TI: a review. Ultrasound Med Biol. 1999;25:431–441. doi: 10.1016/s0301-5629(98)00172-0. [DOI] [PubMed] [Google Scholar]
- Abramowicz JS, Barnett SB, Duck FA, Edmonds PD, Hynynen KH, Ziskin MC. Fetal thermal effects of diagnostic ultrasound. J Ultrasound Med. 2008;27:541–559. doi: 10.7863/jum.2008.27.4.541. [DOI] [PubMed] [Google Scholar]
- AIUM/NEMA. Standard for Real-Time Display of Thermal and Mechanical Acoustic Output Indices on Diagnostic Ultrasound Equipment. Laurel, MD: American Institute of Ultrasound in Medicine; Rosalyn, MD: National Electrical Manufacturers Association; 1992. [Google Scholar]
- Akulichev VA. Hydration of ions and the cavitation resistance of water. Sov Phys Acoust. 1966;12:144–149. [Google Scholar]
- Allen GD. The determination of the bile salts in urine by means of the surface tension method. J Biol Chem. 1915;22:505–524. [Google Scholar]
- Apfel RE, Holland CK. Gauging the likelihood of cavitation from short-pulse, low-duty cycle diagnostic ultrasound. Ultrasound Med Biol. 1991;17:179–185. doi: 10.1016/0301-5629(91)90125-g. [DOI] [PubMed] [Google Scholar]
- Bader KB, Holland CK. Gauging the likelihood of stable cavitation from ultrasound contrast agents. Phys Med Biol. 2013;58:127–144. doi: 10.1088/0031-9155/58/1/127. [DOI] [PMC free article] [PubMed] [Google Scholar]
- Canney MS, Khokhlova VA, Bessonova OV, Bailey MR, Crum LA. Shock-induced heating and millisecond boiling in gels and tissue due to high intensity focused ultrasound. Ultrasound Med Biol. 2010;36:250–267. doi: 10.1016/j.ultrasmedbio.2009.09.010. [DOI] [PMC free article] [PubMed] [Google Scholar]
- Christopher T. Finite Amplitude Distortion-Based Inhomogeneous Pulse Echo Ultrasonic Imaging. IEEE Trans Ultrason Ferroelec Freq Control. 1997;44:125–139. doi: 10.1109/58.585208. [DOI] [PubMed] [Google Scholar]
- Christopher T, Carstensen EL. Finite amplitude distortion and its relationship to linear derating formulae for diagnostic ultrasound systems. Ultrasound Med Biol. 1996;22:1103–1116. doi: 10.1016/s0301-5629(96)00099-3. [DOI] [PubMed] [Google Scholar]
- Church CC. A theoretical study of cavitation generated by an extracorporeal shock wave lithotripter. J Acoust Soc Am. 1989;86:215–227. doi: 10.1121/1.398328. [DOI] [PubMed] [Google Scholar]
- Church CC. Spontaneous, homogeneous nucleation, inertial cavitation and the safety of diagnostic ultrasound. Ultrasound Med Biol. 2002;28:1349–1364. doi: 10.1016/s0301-5629(02)00579-3. [DOI] [PubMed] [Google Scholar]
- Church CC. Frequency, pulse length and the mechanical index. Acoust Res Lett Online. 2005;6:162–168. [Google Scholar]
- Church CC, Carstensen EL, Nyborg WL, Carson PL, Frizzell LA, Bailey MR. The risk of exposure to diagnostic ultrasound in postnatal subjects: nonthermal mechanisms. J Ultrasound Med. 2008;27:565–592. doi: 10.7863/jum.2008.27.4.565. [DOI] [PubMed] [Google Scholar]
- Church CC, Labuda C, Nightingale K. Should the mechanical index be revised for ARFI imaging?. Proceedings of the IEEE International Ultrasonics Symposium; Dresden, Germany. 2012; pp. 17–20. [DOI] [PMC free article] [PubMed] [Google Scholar]
- Church CC, Yang X. A Theoretical Study of Gas Bubble Dynamics in Tissue. In: Atchley AA, Sparrow VM, Keolian RM, editors. Innovations in Nonlinear Acoustics: 17th International Symposium on Nonlinear Acoustics; Melville, NY: American Institute of Physics; 2006. pp. 217–224. [Google Scholar]
- Cosgrove D, Piscaglia F, Bamber J, Bojunga J, Correas J-M, Gilja OH, Klauser AS, Sporea I, Calliada F, Cantisani V, D’Onofrio M, Drakonaki EE, Fink M, Friedrich-Rust M, Fromageau J, Havre RF, Jenssen C, Ohlinger R, Sãftoiu A, Schaefer F, Dietrich CF. EFSUMB Guidelines and Recommendations on the Clinical Use of Ultrasound Elastography. Part 2: Clinical Applications. Ultraschall Med. 2013;34:238–53. doi: 10.1055/s-0033-1335375. [DOI] [PubMed] [Google Scholar]
- Cramer E. The dynamics and Acoustic Emission of Bubbles Driven by a Sound Field. In: Lauterborn W, editor. Cavitation and Inhomogeneities in Underwater Acoustics. New York, NY: Springer; 1980. pp. 54–63. [Google Scholar]
- Donnan WD, Donnan FG. The surface tension of urine in health and disease. Brit Med J. 1905;2(2347):1636–1641. doi: 10.1136/bmj.2.2347.1636. [DOI] [PMC free article] [PubMed] [Google Scholar]
- Duck FA. Nonlinear acoustics in diagnostic ultrasound. Ultrasound Med Biol. 2002;28:1–18. doi: 10.1016/s0301-5629(01)00463-x. [DOI] [PubMed] [Google Scholar]
- Dunn F, Fry FJ. Ultrasonic Threshold Dosages for the Mammalian Central Nervous System. IEEE Trans Biomed Eng. 1971;18:253–256. doi: 10.1109/tbme.1971.4502847. [DOI] [PubMed] [Google Scholar]
- Dunn F, Lohnes JE, Fry FJ. Frequency dependence of threshold ultrasonic dosages for irreversible structural changes in mammalian brain. J Acoust Soc Am. 1975;58:512–514. doi: 10.1121/1.380666. [DOI] [PubMed] [Google Scholar]
- Federal Food, Drug, and Cosmetic Act, Pub L No. 75–717, 52 Stat 1040 (June 25, 1938).
- Flynn HG. Cavitation dynamics. II. Free pulsations and models for cavitation bubbles. J Acoust Soc Am. 1975;58:1160–1170. [Google Scholar]
- Flynn HG, Church CC. Transient pulsations of small gas bubbles in water. J Acoust Soc Am. 1988;84:985–998. doi: 10.1121/1.397253. [DOI] [PubMed] [Google Scholar]
- Fowlkes JB, Abramowicz JS, Church CC, Holland C, Miller DL, O’Brien WD, Sanghvi N, Stratmeyer ME, Zachary JF. American Institute of Ultrasound in Medicine Consensus Report on Potential Bioeffects of Diagnostic Ultrasound: Executive Summary. J Ultrasound Med. 2008;27:503–515. doi: 10.7863/jum.2008.27.4.503. [DOI] [PubMed] [Google Scholar]
- Fox FE, Herzfeld KF. Gas bubbles with organic skin as cavitation nuclei. J Acoust Soc Am. 1954;26:984–989. [Google Scholar]
- Fry FJ, Kossoff G, Eggleton RC, Dunn F. Threshold ultrasonic dosages for structural changes in the mammalian brain. J Acoust Soc Am. 1970;48:1413–1417. doi: 10.1121/1.1912301. [DOI] [PubMed] [Google Scholar]
- Fuster D, Hauke G, Dopazo C. Influence of the accommodation coefficient on nonlinear bubble oscillations. J Acoust Soc Am. 2010;128:5–10. doi: 10.1121/1.3436520. [DOI] [PubMed] [Google Scholar]
- Gateau K, Aubry J-F, Chauvet D, Boch a-L, Fink M, Tanter M. In vivo bubble nucleation probability in sheep brain tissue. Phys Med Biol. 2011a;56:7001–7015. doi: 10.1088/0031-9155/56/22/001. [DOI] [PubMed] [Google Scholar]
- Gateau K, Aubry J-F, Pernot M, Fink M, Tanter M. Combined passive detection and ultrafast active imaging of cavitation events induced by short pulses of high-intensity ultrasound. IEEE Trans Ultrason Ferroelec Freq Control. 2011b;58:517–532. doi: 10.1109/TUFFC.2011.1836. [DOI] [PMC free article] [PubMed] [Google Scholar]
- Harvey EN, Barnes DK, McElroy WD, Whiteley AH, Pease DC, Cooper KW. Bubble formation in animals. J Cell Comp Physiol. 1944;24:1–22. [Google Scholar]
- Hwang JH, Brayman AA, Reidy MA, Matula TJ, Kimmey MB, Crum LA. Vascular effects induced by combined 1-MHz ultrasound and microbubble contrast agent treatments in vivo. Ultrasound Med Biol. 2005;31:553–564. doi: 10.1016/j.ultrasmedbio.2004.12.014. [DOI] [PubMed] [Google Scholar]
- Hwang JH, Tu J, Brayman AA, Matula TJ, Crum LA. Correlation between inertial cavitation dose and endothelial cell damage in vivo. Ultrasound Med Biol. 2006;32:1611–1619. doi: 10.1016/j.ultrasmedbio.2006.07.016. [DOI] [PubMed] [Google Scholar]
- Hynynen K. The threshold for thermally significant cavitation in dog’s thigh muscle in vivo. Ultrasound Med Biol. 1991;17:157–169. doi: 10.1016/0301-5629(91)90123-e. [DOI] [PubMed] [Google Scholar]
- IEC. Medical Electrical Equipment–Part 2: Particular requirements for the basic safety and essential performance of ultrasonic medical diagnostic and monitoring equipment. 2. Geneva: International Electrotechnical Commission; 2007. IEC Publication 60601–2–37. [Google Scholar]
- IEC. Ultrasonics - Field characterization - Test methods for the determination of thermal and mechanical indices related to medical diagnostic ultrasonic fields. 2.0. Geneva: International Electrotechnical Commission; 2010. IEC Publication 62359. [Google Scholar]
- Inman BA, Etienne W, Rubin R, Owusu RA, Oliveira TR, Rodriques DB, Maccarini PF, Stauffer PR, Mashal A, Dewhirst MW. The impact of temperature and urinary constituents on urine viscosity and its relevance to bladder hyperthermia treatment. Int J Hyperthermia. 2013;29:206–210. doi: 10.3109/02656736.2013.775355. [DOI] [PubMed] [Google Scholar]
- Khokhlova TD, Canney MS, Khokhlova VA, Sapozhnikov OA, Crum LA, Bailey MR. Controlled tissue emulsification produced by high intensity focused ultrasound shock waves and millisecond boiling. J Acoust Soc Am. 2011;130:3498–3510. doi: 10.1121/1.3626152. [DOI] [PMC free article] [PubMed] [Google Scholar]
- Kollmann C. New sonographic techniques for harmonic imaging--underlying physical principles. Eur J Radiol. 2007;64:164–172. doi: 10.1016/j.ejrad.2007.07.024. [DOI] [PubMed] [Google Scholar]
- Krasovitski B, Frenkel V, Shoham S, Kimmel E. Intramembrane cavitation as a unifying mechanism for ultrasound-induced bioeffects. Proc Natl Acad Sci. 2011;108:3258–3263. doi: 10.1073/pnas.1015771108. [DOI] [PMC free article] [PubMed] [Google Scholar]
- Kreider W, Maxwell AD, Cunitz BW, Wang Y-N, Hsi R, Lee FC, Sorensen MD, Harper J, Khokhlova V, Connors BA, Evan AP, Bailey MR. A preliminary assessment of the potential for kidney injury by burst wave lithotripsy (abstract). 14th International Symposium on Therapeutic Ultrasound (ISTU’14); Las Vegas, NV. 2014; p. 136. [Google Scholar]
- Kreider W, Crum LA, Bailey MR, Sapozhnikov OA. A reduced-order, single-bubble cavitation model with applications to therapeutic ultrasound. J Acoust Soc Am. 2011;130:3511–3530. doi: 10.1121/1.3626158. [DOI] [PMC free article] [PubMed] [Google Scholar]
- Lastman GJ, Wentzel RA. Comparison of five models of spherical bubble response in an inviscid compressible liquid. J Acoust Soc Am. 1981;69:638–642. [Google Scholar]
- Macé E, Cohen I, Montaldo G, Miles R, Fink M, Tanter M. In vivo mapping of brain elasticity in small animals using shear wave imaging. IEEE Trans Ultrason Ferroelec Freq Control. 2011;30:550–558. doi: 10.1109/TMI.2010.2079940. [DOI] [PubMed] [Google Scholar]
- Madsen EL, Sathoff HJ, Zagzebski HJ. Ultrasonic shear wave properties of soft tissues and tissue-like materials. J Acoust Soc Amer. 1983;74:1346–1355. doi: 10.1121/1.390158. [DOI] [PubMed] [Google Scholar]
- Martin K. The acoustic safety of new ultrasound technologies. Ultrasound. 2010;18:110–118. [Google Scholar]
- Matsumoto Y, Allen JS, Yoshizawa S, Ikeda T, Kaneko Y. Medical ultrasound with microbubbles. Exp Therm Fluid Sci. 2005;29:255–265. [Google Scholar]
- Maxwell AD, Cain CA, Hall TL, Fowlkes JB, Xu Z. Probability of cavitation for single ultrasound pulses applied to tissues and tissue-mimicking materials. Ultrasound Med Biol. 2013;39:449–465. doi: 10.1016/j.ultrasmedbio.2012.09.004. [DOI] [PMC free article] [PubMed] [Google Scholar]
- Medical Device Amendments of 1976, Pub L No. 94–295, 90 Stat 539 (May 28, 1976).
- Mendelson EB, Chen J-F, Karstaedt P. Assessing tissue stiffness may boost breast imaging specificity. Diagnostic Imaging. 2009:15–17. [Google Scholar]
- Miller DL, Averkiou MA, Brayman AA, Everbach EC, Holland CK, Wible JH, Wu J. Bioeffects considerations for diagnostic ultrasound: contrast agents. J Ultrasound Med. 2008;27:611–632. doi: 10.7863/jum.2008.27.4.611. [DOI] [PubMed] [Google Scholar]
- Miller DL, Dou C, Lucchesi BR. Are ECG Premature Complexes Induced by Ultrasonic Cavitation Electro-Physiological Responses to Irreversible Cardiomyocyte Injury? Ultrasound Med Biol. 2011;37:312–320. doi: 10.1016/j.ultrasmedbio.2010.11.012. [DOI] [PMC free article] [PubMed] [Google Scholar]
- Miller DL, Dou C, Wiggins RC. Contrast-enhanced diagnostic ultrasound causes renal tissue damage in a porcine model. J Ultrasound Med. 2010;29:1391–1401. doi: 10.7863/jum.2010.29.10.1391. [DOI] [PMC free article] [PubMed] [Google Scholar]
- Nyborg WL. Biological effects of ultrasound: development of safety guidelines. Part I: personal histories. Ultrasound Med Biol. 2000;26:911–964. doi: 10.1016/s0301-5629(00)00243-x. [DOI] [PubMed] [Google Scholar]
- Nyborg WL. Biological effects of ultrasound: development of safety guidelines. Part II: general review. Ultrasound Med Biol. 2001;27:301–333. doi: 10.1016/s0301-5629(00)00333-1. [DOI] [PubMed] [Google Scholar]
- Nyborg WL. History of the American Institute of Ultrasound in Medicine’s efforts to keep ultrasound safe. J Ultrasound Med. 2003;22:1293–1300. doi: 10.7863/jum.2003.22.12.1293. [DOI] [PubMed] [Google Scholar]
- O’Brien WD, Abbott JG, Stratmeyer ME, Harris GR, Schafer ME, Siddiqi TA, Merritt CRB, Duck FA, Bendick PJ. Acoustic output upper limits proposition: should upper limits be retained? J Ultrasound Med. 2002;21:1335–1341. doi: 10.7863/jum.2002.21.12.1335. [DOI] [PubMed] [Google Scholar]
- O’Brien WD, Deng CX, Harris GR, Herman BA, Merritt CR, Sanghvi N, Zachary JF. The risk of exposure to diagnostic ultrasound in postnatal subjects: thermal effects. J Ultrasound Med. 2008;27:517–535. doi: 10.7863/jum.2008.27.4.517. [DOI] [PMC free article] [PubMed] [Google Scholar]
- Palmeri ML, Wang MH, Rouze NC, Abdelmalek MF, Guy CD, Moser B, Diehl AM, Nightingale KR. Noninvasive evaluation of hepatic fibrosis using acoustic radiation force-based shear stiffness in patients with nonalcoholic fatty liver disease. J Hepatol. 2011;55:666–672. doi: 10.1016/j.jhep.2010.12.019. [DOI] [PMC free article] [PubMed] [Google Scholar]
- Park H, Park JY, Kim DY, Ahn SH, Chon CY, Han K-H, Kim SU. Characterization of focal liver masses using acoustic radiation force impulse elastography. World J Gastroent. 2013;19:219–26. doi: 10.3748/wjg.v19.i2.219. [DOI] [PMC free article] [PubMed] [Google Scholar]
- Prosperetti A. Thermal effects and damping mechanisms in the forced radial oscillations of gas bubbles in liquids. J Acoust Soc Amer. 1977;61:17–27. [Google Scholar]
- Prosperetti A, Lezzi A. Bubble dynamics in a compressible liquid. Part 1. First-order theory. J Fluid Mech. 1986;168:457–478. [Google Scholar]
- Puente GF, Bonetto FJ. Proposed method to estimate the liquid-vapor accommodation coefficient based on experimental sonoluminescence data. Phys Rev E. 2005;71:056309-1–056309-5. doi: 10.1103/PhysRevE.71.056309. [DOI] [PubMed] [Google Scholar]
- Sirotyuk MG. Stabilisation of gas bubbles in water. Sov Phys Acoust. 1970;16:237–240. [Google Scholar]
- Šponer J. Dependence of the cavitation threshold on the ultrasonic frequency. Czech J Phys. 1990;40:1123–1132. [Google Scholar]
- Šponer J. Theoretical estimation of the cavitation threshold for very short pulses of ultrasound. Ultrasonics. 1991;29:376–380. [Google Scholar]
- Stratmeyer ME, Greenleaf JF, Dalecki D, Salvesen KA. Fetal ultrasound: mechanical effects. J Ultrasound Med. 2008;27:597–605. doi: 10.7863/jum.2008.27.4.597. [DOI] [PubMed] [Google Scholar]
- ter Haar G. The Safe Use of Ultrasound in Medical Diagnosis. 3. London: The British Institute of Radiology; 2012. [Google Scholar]
- Andersen A, editor. US FDA. Revised 510(k) Guidance for Diagnostic Ultrasound for 1993: Communication from F. Rockville, MD: Center for Devices and Radiological Health, US Food and Drug Administration; 1993. [Google Scholar]
- US FDA. Information for Manufacturers Seeking Marketing Clearance of Diagnostic Ultrasound Systems and Transducers. Rockville, MD: Center for Devices and Radiological Health, US Food and Drug Administration; 1997. [Google Scholar]
- Vykhodtseva N, Hynynen K, Damianou C. Pulsed emission effects of high intensity ultrasound exposure with subharmonic emission in rabbit brain in vivo. Ultrasound Med Biol. 1995;21:969–979. doi: 10.1016/0301-5629(95)00038-s. [DOI] [PubMed] [Google Scholar]
- Wang MH, Palmeri ML, Guy CD, Yang L, Hedlund LW, Diehl AM, Nightingale KR. In vivo quantification of liver stiffness in a rat model of hepatic fibrosis with acoustic radiation force. Ultrasound Med Biol. 2009;35:1709–1721. doi: 10.1016/j.ultrasmedbio.2009.04.019. [DOI] [PMC free article] [PubMed] [Google Scholar]
- Yang X, Church CC. A model for the dynamics of gas bubbles in soft tissue. J Acoust Soc Am. 2005;118:3595–3606. doi: 10.1121/1.2118307. [DOI] [PubMed] [Google Scholar]
- Yang X, Church CC. A Simple Viscoelastic Model for Soft Tissues in the Frequency Range 6–20 MHz. IEEE Trans Ultrason Ferroelec Freq Control. 2006;53:1404–1411. doi: 10.1109/tuffc.2006.1665097. [DOI] [PubMed] [Google Scholar]
- Yount DE. Skins of varying permeability: A stabilization mechanism for gas cavitation nuclei. J Acoust Soc Am. 1979;65:1429–1439. [Google Scholar]
- Yount DE, Gillary EW, Hoffman DC. A microscopic investigation of bubble formation nuclei. J Acoust Soc Am. 1984;76:1511–1521. [Google Scholar]


