

Abstract
The mammalian taste system is responsible for sensing and responding to the five basic taste qualities, sweet, sour, bitter, salty and umami. Previously, we showed that each taste is detected by dedicated taste receptor cells (TRCs) on the tongue and palate epithelium1. To understand how TRCs transmit information to higher neural centers, we examined the tuning properties of large ensembles of neurons in the first neural station of the gustatory system. Here, we generated and characterized a collection of transgenic mice expressing a genetically encoded calcium indicator2 in central and peripheral neurons, and used a gradient refractive index microendoscope3 combined with high-resolution two photon microscopy to image taste responses from ganglion neurons buried deep at the base of the brain. Our results reveal fine selectivity in the taste preference of ganglion neurons, they demonstrate a strong match between TRCs in the tongue and the principal neural afferents relaying taste information to the brain, and expose the highly specific transfer of taste information between taste cells and the central nervous system.
In mammals, taste receptor cells are assembled into taste buds that are distributed in different papillae in the tongue epithelium. Taste buds are innervated by afferent fibers that transmit information to the primary taste cortex through synapses in the brainstem and thalamus4. In the simplest model of taste coding at the periphery, each quality, encoded by a unique population of TRCs expressing specific receptors (e.g. sweet cells, bitter cells, etc.), would connect to a matching set of ganglion neurons. Notably, although TRCs are tuned to highly preferred taste qualities5–8, the nature of their functional “handshake” with the nervous system has been a matter of significant debate1,4,9.
We reasoned this fundamental question could now be resolved by directly examining the tuning properties of taste ganglion neurons. We focused on the geniculate ganglion (GG) as its neurons innervate all taste buds in the front of the tongue and palate1,10, and set out to use two-photon calcium imaging to monitor tastant-evoked neural activity in vivo. This strategy, however, required solution of two technical challenges: first, the ganglion is located in a bony capsule under the brain, some 4 mm from the surface, far beyond the reach of conventional microscopy. Second, GG-neurons would have to be loaded with sensors of neuronal activity that can report function with good temporal, spatial, and dynamic range. To solve the first challenge, we implemented the use of two-photon micro-endoscopy, where a gradient refractive index (GRIN) lens is used as an optical extension device3. The GCaMP family of genetically-encoded calcium sensors are an attractive tool to solve the challenge of indicator loading2, yet there were no suitable mouse lines or drivers appropriate for targeting GG-neurons. Therefore, we generated a collection of 40 mouse lines harboring GCaMP32 driven by Thy1 (Fig. 1a), a neuronal promoter highly sensitive to position effects11, and screened for those that express the sensor in most geniculate ganglion neurons (Fig. 1b). Line 1 had essentially complete labeling of GG-neurons (Fig. 1c), and stimulation of the ganglia ex vivo produced reliable calcium-dependent fluorescence changes (Fig. 1d). To take advantage of the more recent versions of GCaMP12,13, we subsequently developed a viral infection approach that efficiently labels GG-neurons via retrograde transfer of the virus from their terminal fields in the nucleus of the solitary tract (see Methods for details).
Figure 1. Thy1-GCaMP3 transgenic mice express functional GCaMP3 in taste ganglion cells.

a, Structure of the Thy1.2 -GCaMP3 construct11. b, Whole-mount confocal images of geniculate ganglion from 8 transgenic lines shows GCaMP3 expression in varying subsets of neurons. c, Line 1, used in our studies, expresses GCaMP3 in nearly all neurons (>90%, n = 6); compare Nissl-staining (red) versus GCaMP3 fluorescence (green). d, Ex vivo calcium imaging of a geniculate from Line 1 illustrating strong GCaMP3 responses to a test depolarizing solution (KCl, 500 mM); over 75% of imaged neurons responded with ΔF/F greater than 100% (n = 25 cells, mean ± quartile). Scalebars in b–c, 100 μm.
To visualize GG-neurons in live mice, we exposed a small ventral window into the ganglion (Fig. 2a), and carefully positioned a GRIN lens (1 mm diameter × 3.8 mm length) directly onto the tissue (Fig. 2b). This 2-photon imaging configuration allowed unencumbered access to the entire ganglion, and enabled the investigation of the GG at sufficient numerical aperture (~0.45 NA) so as to detect GCaMP-dependent fluorescence changes (Fig. 2c–d).
Figure 2. In vivo two-photon microendoscopy of the geniculate ganglion.

a, Diagram illustrating optical access to the geniculate ganglion. A 1-mm GRIN microendoscope3 was guided into the surgical opening, and imaged using two-photon microscopy. b, Brightfield image through the microendoscope (left), showing individual GCaMP-labeled neurons (right). c, Images of a ganglion with 25 GCaMP3 labeled neurons responding to sweet (acesulfame K, 30 mM), bitter (quinine, 5 mM), sour (citric acid, 50 mM) and NaCl (60 mM). Fluorescence amplitudes were pseudocolored according to ΔF/F (scale at right). d, Traces from six separate neurons (numbered in c) illustrating the time course of amplitude changes in GCaMP3 signals after sour stimulation. Horizontal bars mark the time and duration of the stimulus (inter-stimulus interval was 8s). Scale bars in a, 4 mm, b, 200 μm and 50 μm.
We assessed the responses of GG-neurons to tastants using a range of stimulus paradigms that included the five basic taste qualities at concentrations that evoke strong behavioral and nerve responses8 (Extended Data Fig. 1). For most recordings the tongue was exposed to a 6.5 s pre-stimulus application of artificial saliva (AS), a 2 s exposure to a test tastant, and a 6.5 s AS post-stimulus wash. Each session included a minimum of four trials per tastant, and a neuron was classified as a responder if it exhibited statistically significant responses in at least 50% of the trials (see Methods and Extended Data Table 1 for details).
In the tongue, sweet and umami taste are mediated by a small family of 3 GPCRs that combine to form two heteromeric receptors, T1R1+3 for umami8,14,15 and T1R2+3 for sweet8,14. Bitters are detected by a family of approximately three dozen GPCRs, the T2Rs16, and sour and sodium taste are sensed by ion channel receptors5,6. Given a palette of five different tastes, and all possible neuronal tuning combinations, there are a total of 31 potential neuronal classes: for example, five of these would be tuned to single taste qualities (one for each of the five basic tastes), ten doubly tuned, ten responding to three, five to four and a single class tuned to all five tastes. How is taste represented in the ganglion?
We focused on a standard set of stimuli representing the five basic qualities: sweet responding neurons were identified using sucrose, bitter with either quinine or cycloheximide, salt by stimulating with NaCl, sour with citric acid, and umami with monopotassium glutamate (MPG) plus inosine monophosphate (IMP). Tastant stimulation of the tongue elicited strong calcium transients in subsets of ganglion neurons (Fig. 2c–d). The responses were robust, reliable (Extended Data Fig. 2), and specific (Fig. 3, Extended Data Fig. 3). For example, salt responses showed the expected blockage by amiloride5 (Fig. 3c, Extended Data Fig. 3e), bitter responses were blocked by allyl isothiocyanate (AITC)17 (Fig. 3d, Extended Data Fig. 3f), sweet/umami responses were abolished in knockouts of the T1R3 receptor subunit8 (Fig. 3e), and acid responses displayed the appropriate sensitivity to PKD2L1-cell silencing17 (see Extended Data Fig. 4). We examined the reproducibility of the taste-evoked responses by measuring variability across trials and, on average, cells responded in at least 75% of the trials (Extended Data Fig. 2). We analyzed nearly 1000 neurons exhibiting tastant-evoked activity: 443 of these were derived from 15 thy1-GCaMP3 mice and 432 from 14 AAV-GCaMP6 animals (see Extended Data Table 1); we also included approximately 50 cells each from AAV-GCaMP3 and AAV-GCaMP5 pilot experiments. Our data demonstrate that the vast majority of the responding neurons are strongly activated by only one taste quality, and thus exhibit highly preferred and narrowly tuned tastant selectivity (Figs. 3 and 4). Furthermore, the representation of the various taste classes within the ganglion appears random, with no obvious topography or clustering (Extended Data Fig. 5).
Figure 3. Selective responses of geniculate ganglion neurons.

a, Responses of ten ganglion neurons to the five basic taste qualities. Black traces mark average ΔF/F from four individual trials per tastant (gray traces); horizontal bars mark the time and duration of the stimulus. b, Individual ganglion neurons exhibit strong taste preferences. The graph shows a rank-ordered plot of calcium transient amplitudes for 152 sour-responsive neurons. For each cell, the mean sour response amplitudes (red) and the mean amplitude of its next-strongest tastant response (grey) are shown; minor dots indicate individual trial amplitudes. The vast majority of these sour cells are strongly tuned to sour taste versus any other taste quality. c–d, Responses are highly selective. The ENaC inhibitor amiloride5 blocks NaCl responses (c), while the bitter-TRC inactivator AITC17 abolishes bitter responses (d); individual traces (gray) and average traces (black) are shown for two representative ganglion neurons before (−) and after (+) pharmacological application of the blockers to the tongue. e, Mice lacking T1R3 lack ganglion responses to sweet and umami stimuli. Black bars denote control animals (n = 8), and red bars T1R3 knockouts (n = 9).
Figure 4. Representation of taste in the primary sensory ganglia.

a, Response profile of 904 ganglion neurons from 37 mice according to taste preference; singly-tuned cells (black; see panel b for breakdown), bitter-sour cells (gray), and broadly-tuned cells (light gray; see Extended Data Table 2). Importantly, the bitter-sour class actually reflects the activity of T2R-expressing (bitter) TRCs (see text for details)We note that acid responses from bitter cells are not readily visible in whole-nerve recordings6,17, likely reflecting sensitivity differences between single-cell imaging and “bulk” extracellular recordings. b–c, Distribution of ganglion neurons according to tastant selectivity.
The finding that most ganglion neurons are tuned to single taste qualities substantiates a simple match between TRCs and ganglion neurons, with information from the tongue propagated primarily along labeled-lines. This is inconsistent with models proposing a general across-fiber model of coding6, or that receptor TRCs first signal their information to broadly tuned presynaptic cells, which would then activate ganglion neurons9,18. We find no evidence or support for either of these models as they would require that the majority of ganglion neurons respond across multiple taste qualities.
A key prediction of our findings is the expectation that responses to taste mixes should largely reflect the sum of the responses to the individual tastants (i.e. as dedicated lines operating independently of each other). Therefore, we tested the representation of binary mixes relative to the responses to the individual components. We chose 3 pair sets including sweet, bitter, sour and salt taste and examined their responses. Our results (Extended Data Fig. 6) demonstrate that taste mixes indeed behave like the simple addition of the responses to the individual tastants.
This study also illustrates and uncovers three additional aspects to the representation of taste in the first neural station. First, it revealed that although there are 26 possible combinations of “multi-tuned” responses, only small numbers of bona-fide doubly-tuned neurons are found at over 1%. Second, half of the apparently multi-tuned ganglion neurons belong to just one class, namely bitter-sour. And third, umami-responding neurons are divided between umami-alone and umami-sweet responders.
How do these “multi-tuned” ganglions neurons arise? Are they the result of signaling from two or more classes of TRCs converging into a single target neuron? Or are they in fact receiving input from just one TRC type, but appear multi-tuned due to the nature of the stimulus? Indeed, it has long been known that some tastants, although single molecular species, may activate more than one class of TRCs. This is well exemplified by saccharin which powerfully activates sweet TRCs at low concentrations, but begins to activate bitter TRCs at high (thought to be the basis for the bitter aftertaste of saccharin); another recently reported example is the activation of bitter cells by potassium salts (KCl) at high concentration17. Thus, we wondered whether the activation of “bitter-sour” ganglion neurons by acid, by far the largest class of apparently multi-tuned neurons (Fig. 4c), may also reflect tastant cross-talk, for instance a subset of T2R receptors in bitter cells being sensitive to low pH, as it has been observed for a number of GPCRs19.
We reasoned that by using a combination of genetic manipulations and pharmacology it should be possible to explain the origin of these responses. For example, if bitter-sour cells receive convergent input from T2R- and PKD2L1-cells, then ablating or silencing the PKD2L1-expressing sour taste receptor cells should eliminate the bitter-sour doubly tuned class (i.e. by eliminating their sour responses). In contrast, if these neurons reflect bitter cells which are sensitive to acidic stimuli, such genetic manipulation should have no impact on the activity or numbers of bitter-sour responding ganglion neurons. We imaged animals where we silenced synaptic transmission from PKD2L1-expressing cells by genetically targeting tetanus toxin17 (PKD2L1-tetanus). As expected the sour-alone neuronal responses were abolished, but importantly, the bitter-sour class was preserved (Extended Data Fig. 4). These results demonstrate that bitter-sour ganglion neurons do not receive input from sour-sensing TRCs, and strongly argue that the “bitter-sour” neurons are actually the result of T2R-expressing bitter TRCs being sensitive to acid stimuli. If true, then blocking bitter taste responses should now eliminate the “bitter-sour” class. As predicted, Extended Data Figure 4 shows this to be the case, further demonstrating that the vast majority of all ganglion neurons indeed receive input from single classes of TRCs.
A surprise that emerged from this study was the finding that there were very few umami ganglion neurons, with many also activated by sweet tastants (Fig. 4). Sweet and umami taste receptors are formed by the combination of 3 GPCRs from the same gene family8,14,15. Interestingly, unlike humans, who can readily distinguish between sweet and umami tastes, rodents exhibit considerable behavioral cross-generalization between these two appetitive taste qualities20, even though they still represent sweet and umami in two distinct but closely apposed cortical fields21. We suggest that this results in part from convergence of sweet and umami inputs into common ganglion neurons, perhaps as a consequence of their shared origin, and receptor repertoire. Future studies examining the fate, tuning and connectivity of individual TRCs throughout their life cycle should help resolve this question.
The capacity to examine the activity of large ensembles of neurons with single-cell selectivity, even in a tissue buried deep in the head, has afforded a comprehensive examination of the behavior of gustatory neurons in coding responses to the basic taste qualities with exquisite resolution. The development of this imaging preparation has addressed a long-standing question in the taste field, namely the direct demonstration of labeled lines between TRCs and the brain. Importantly, it should also provide a powerful experimental platform to identify molecular markers defining each class of taste ganglion neurons, help dissect the nature of their handshake with the tongue and the brainstem, and explore the constancy of taste perception in light of the remarkably rapid turnover of TRCs22.
Finally, we note that ganglion neurons not only convey taste quality, but also valence. In this regard, it would be of interest to determine if some of the neurons may be dedicated to carry attractive and aversive signals (i.e. valence) rather than tastant “identity” and thereby delineate the circuit that mediates immediate taste ingestion or rejection responses, independent of conscious perception and the cortex23.
Methods
Transgenic animals and mouse strains
All procedures were carried out in accordance with the US National Institutes of Health (NIH) guidelines for the care and use of laboratory animals, and were approved by the Columbia University, Janelia Farm Research Campus, or National Institute of Dental and Craniofacial Research Animal Care and Use Committees. Reported data were obtained from mice ranging from 2–12 months of age and from both genders; randomization and blinding methods were not used. To generate Thy1-GCaMP3 mice, cDNA encoding GCaMP3 was cloned into the XhoI site of a standard Thy1 vector11. More than 40 lines were generated by pronuclear injection with about 25 expressing significant GCaMP3 in subsets of neurons in the cranial ganglia and/or brain (Fig. 1). Calcium-imaging experiments reported here used Line 1, which robustly expresses GCaMP3 in all geniculate ganglion neurons. All other mouse strains have been described previously8,17. Sample sizes were chosen to allow robust statistical analysis of data.
Confocal imaging of isolated geniculate ganglia
Mice were perfused and geniculate ganglia were exposed by removing the brain and bone dorsal to the ganglia as described previously24. The greater superficial petrosal and facial nerves were cut, and the ganglia were extracted by blunt dissection. In order to quantify the number of Thy1-GCaMP3-positive neurons per ganglia, fluorescent Nissl staining (NeuroTrace 530/615, Molecular Probes) was used to label neurons, and the ratio of Nissl-positive to GCaMP3-positive neurons determined; greater than 90% of all neurons are labeled by Thy1-GCaMP3 (n=6 ganglia). Ganglia were mounted in Vecta-shield mounting medium and imaged with a Zeiss 510 confocal microscope (Zeiss ×10, 0.45 NA microscope objective). For control KCl stimulations, dissected ganglia were submersed in imaging buffer (Hank’s Buffered Salt Solution with Ca2+ and 10 mM HEPES). Suture thread was used to mount the ganglia onto a coverslip within a custom imaging chamber. A depolarizing solution (potassium chloride, 500 mM) was applied to cells between washes with imaging buffer.
Nerve Recordings
Recording procedures and analysis were carried out as described previously8,15.
Viral delivery of GCaMP sensors
An alternative strategy to express GCaMP in geniculate ganglion neurons involved injection of AAV-constructs in the terminal field of taste responsive neurons in the brainstem. Mice were anesthetized with ketamine and xylazine (100 mg/kg and 10 mg/kg, intraperitoneal), with subsequent booster doses to maintain depth of anesthesia. Body temperature was controlled using a closed-loop heating system. A small craniotomy (<1 mm diameter) centered approx. 6.5 mm dorsal to bregma and 1.25 mm from the midline was performed. AAV virus carrying GCaMP constructs (AAV9-hSyn-GCaMP3, AAV1-hSyn-GCaMP6s and AAV9-hSyn-GCaMP5G; Penn Vector Core) was delivered to the brain at three locations along the rostrocaudal axis: 1.25 mm/−4.0 mm (lateral coordinate relative to bregma/inferior coordinate relative to the dura), and −6.3 mm/−6.5 mm/−6.7 mm (anterior coordinates relative to bregma); approximately 200 nL was delivered per injection. After incision closure and recovery from surgery, mice were housed in their home cages for at least 2 weeks prior to imaging.
Surgical Preparation for in vivo imaging
A metal bar was affixed to the dorsal cranium of an anesthetized mouse (see above) with cyanoacrylate as described previously25. The mouse was positioned in a supine position, and its head rigidly secured using the metal bar. A tracheotomy was performed to maintain a clear airway during tastant delivery to the oral cavity15. The surgical strategy used to image the geniculate ganglion in vivo was as previously described for rat26.
In vivo microendoscopy
A singlet microendoscope probe25 (1-mm diameter, 0.42 pitch, 700 μm working distance in water) was used to access the deep tissue. To mount the probe stably over the imaging area, melted agarose (1.5 – 2.0% low melting point agarose) was applied to the exposed cavity. The microendoscope probe was carefully positioned over the geniculate ganglia with forceps, using a stereoscope for visual guidance. The probe was held mechanically with forceps until secured by the hardened agarose. A conventional two-photon microscope (Prairie Technologies) using a Ti:Sapphire laser tuned to 920 nm was used for fluorescence excitation. A long-working distance objective (Olympus ×20, 0.4 NA) was used to couple light into the microendoscope. Images were typically acquired at 2–4 Hz (10–30 μs pixel dwell time) over a ~175–350 μm field of view, unless otherwise noted. We did not utilize multiple optical planes to avoid double-counting of cells.
Tastant Delivery
Lingual stimulation and recording procedures were performed as previously described8,15. Tastants were delivered (5–12.5 mL/min) using a feeding tube positioned approximately 8 mm inside the oral cavity, dorsal to the tongue. Tastants dissolved in artificial saliva were delivered in serial order, interspersed with pure artificial saliva. Recordings were performed during epochs of continuous irrigation; we did not detect calcium activity in response to artificial saliva application, nor did ganglion neurons exhibit mechanical responses. The concentrations of tastants used were: acesulfame K (30 mM), sucrose (300 mM), cycloheximide (100–1000 μM), quinine (5 mM), sodium chloride (60 mM), citric acid (50 mM), monopotassium glutamate + inosine monophosphate (50 mM, 1 mM). Pharmacological compounds were delivered as previously described5,17: amiloride (0.010 mM, 8 mL delivered over 1 minute), and allyl isothiocyanate (AITC, 3 mM, 40 mL delivered over 5 minutes followed by artificial saliva rinse for 1 minute).
Calcium Imaging Data Analysis
Image processing
Two-photon images were first motion-corrected by using cross-correlation-based image alignment27 (Turboreg, ImageJ plugin). Responding neurons were identified with a semi-automated script that uses independent components analysis to examine the spatial and temporal skewness of pixels within active cells28. After cell segmentation, all putative responding-cell were verified by visually examining the raw imaging data. Cells not detected by ICA analysis were manually segmented. For some cellular regions of interest, there was spatial overlap with a neighboring cell; if minor, they were manually segmented, otherwise they were discarded from further analysis.
Scoring of tastant-responsive cells
We used two independent methods to identify tastant-evoked transients in ganglion cells. First, we visually scored cells, by directly observing the aligned image data displayed as a relative fluorescence movie, as well as the putative cells’ fluorescence time series. As a control, we used an automated technique to identify transients in the same cells that were visually classified. The data shown in the manuscript used the manual method, although both were largely interchangeable (manual:automatic: sweet cells 105:95; bitter cells 168:170; sour cells 152:152; salt cells 204:204; umami 32:26). Because bona fide calcium transients may significantly bias the estimates of location by mean and of dispersion by standard deviation, we used robust statistical measures: the median and Qn estimator29 (median absolute deviation also provides similar results). The Qn estimator was calculated for each trial to quantify baseline fluorescence levels. The distribution of Qn estimator values was used to estimate the typical relative fluorescence background levels of multiphoton microendoscopy in the geniculate ganglion to be 0.04 ± 0.01. We visually examined the raw images in outlier trials where background levels exceeded 10% ΔF/F (2.5 times Qn). Such trials typically contained inaccurate image registration and were excluded from further analysis. We assumed transients to be outliers of an underlying normal distribution of calcium levels during a cell’s resting state. Thus, transients were operationally defined as continuous time intervals where the fluorescence intensities significantly deviate from baseline levels (e.g. modified Z-score > 2) for at least one fluorescence decay constant (e.g. 650 ms for GCaMP3). In both manual and automated cases, we defined transients as tastant-evoked if their onsets occurred between the start of tastant delivery and the two seconds after the end of tastant delivery. Transient onsets varied across animals and are believed to be due to factors associated with tastant arrival: placement of the tube within the oral cavity, tastant flow rate, and location of taste receptor cells relative to the flow. Cells were classified as tastant-responsive if they responded in at least 50% of presentations for a given tastant. Lastly, these cells were grouped by their responses to the five basic qualities (any of 31 potential categories, see Text). Any category in which the number of contained cells was less than 1% of the total population was excluded from analysis (Fig. 4).
Extended Data
Extended Data Figure 1. Thy1-GCaMP3 mice show normal physiological responses to tastants.

a, Representative nerve recording traces from control and Thy1-GCaMP3 animals in response to various tastants (see Methods for details). b, Quantification of neural responses show that Thy1-GCaMP3 mice (n=4) are indistinguishable from wildtype mice (n = 3; Student’s t-test, NaCl: P = 0.85, Bitter: P = 0.46, Sour: P = 0.94, Sweet: P = 0.69, Umami: P = 0.77). Recordings were normalized to responses to KCl (500 mM). Horizontal bars below the traces mark the time and duration of the stimulus.
Extended Data Figure 2. Reproducibility of tastant-evoked responses in geniculate ganglion neurons.

a, Representative images of calcium-evoked GCaMP3 activity in response to sweet (left) and bitter (right) stimulation. Four relative fluorescence images are shown from separate trials. In each trial, the identical cell populations were activated. b, We tested 105 sweet responding cells and 168 bitter responding cells for their reproducibility in our automated scoring algorithm for four trials. The histograms show the number of times the cells responds all four times, three out of four, two out of four, and one out of four. c, Sample traces of four representative neurons challenged with 50 trials of the same tastant over a time window of 10 minutes. Note the high reliability in the activation of the neurons. This experiment also illustrates the desensitization of bitter neurons (bottom traces) over time. Horizontal bars below the traces mark the time and duration of the stimulus.
Extended Data Figure 3. Quantification of taste ganglion responses.

a–d, Rank-ordered plot of calcium transient amplitudes for various singly-tuned ganglion neurons (see text and Figure 3). For each cell, the mean response amplitudes for preferred stimulus (red) and the mean amplitude of its “next-strongest” tastant response (grey) are shown; minor dots indicate individual trial amplitudes. e, Quantification of mean response amplitudes in singly-tuned salt ganglion neurons before and after amiloride treatment (10 μM, n = 23 cells; paired t-test, P < 0.001). f, Quantification of mean response amplitudes in singly-tuned bitter cells before and after AITC treatment17 (3 mM, n = 63 cells; paired t-test, P < 0.001).
Extended Data Figure 4. Bitter-sour ganglion cells receive taste information from bitter T2R-expressing cells.
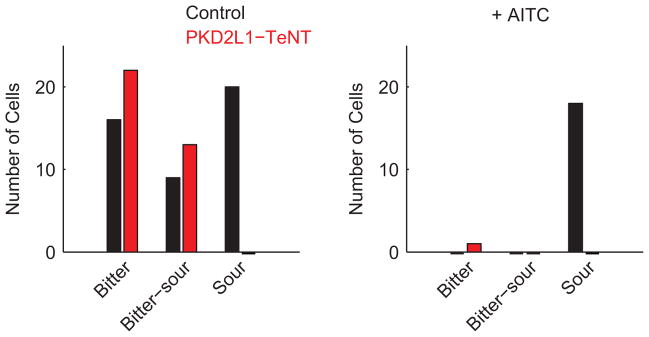
Distribution of bitter, sour, and bitter-sour ganglion cells in a sample of control animals (n = 4) and in animals expressing tetanus toxin in PKD2L1-expressing TRCs (PKD2L1-TeNT; n = 3). As expected, no cells responsive to citric acid (50 mM) are detected in PKD2L1-TeNT mice17. However, “bitter-sour” cells are unaffected (see Figure 4), suggesting that activation of T2R-expressing TRCs mediates these acidic responses. As predicted, subsequent application of the bitter TRC inactivator AITC17 abolishes bitter responses of the bitter ganglion neurons, as well as the bitter and sour responses in the bitter-sour cells. Note that the solid bars showing less than 1 cell are used to illustrate the lack of responding cells.
Extended Data Figure 5. Representation of taste quality does not cluster within the geniculate ganglion.

a, Two-photon endoscopic image (left) of a geniculate ganglion expressing GCaMP3. Highlighted are the locations of the facial (VII) and greater superficial petrosal (GSP) cranial nerves (left panel). The right panel shows approximately 50 neurons color-coded according to their taste preference in this field. Sour: yellow, sweet: magenta, NaCl: green, bitter: cyan. Scalebar, 200 μm. b, Representative fields of the geniculate ganglion from 6 different animals. The random distribution of neurons representing the various taste qualities is independent of sensor, or method of sensor delivery/expression (AAV-GCaMP6 or Thy1-GCamP3; Color scheme same as for a).
Extended Data Figure 6. Representation of taste mixtures.

a, Imaging fields of three representative geniculate ganglia illustrating the ensembles of neurons recruited by two different single taste stimuli presented separately (left panels) versus the ensemble of neurons activated by a mixture of the two compounds presented together (right panels). See text for details; as expected there are no mixture-specific responders, and very few cells responded to each tastant in the mix: only 3 out of 113 cells examined with bitter+sweet responded to both tastants, 5 out of 301 cells examined with sour+salty responded to both, and zero of 39 examined with salty+sweet responded to both tastants. We note that sour stimuli are known to suppress sweet responses30, but such suppression is sweet-cell autonomous and not due to interactions between sweet and sour TRCs (data not shown). b, To quantitatively examine the impact of taste mixes on the responses of individual ganglion neurons, we analyzed their response amplitudes in the presence of the single tastant versus the binary mix. Shown are plots of response amplitudes of a representative set of bitter, sweet, salty and sour geniculate neurons stimulated with their selective tastant (x axis) versus their response amplitude when in the presence of an additional tastant (as indicated in the y-axis; shown are average F/F over 4 trials). 95% confidence interval was determined using a ratio t-test: Bitter+Sweet/Bitter 0.73–0.91; Sweet+Bitter/Sweet 1.15–1.34; NaCl+Sour/NaCl 0.74–1.00; Sour+NaCl/Salt 0.95–1.16.
Extended Data Table 1.
Shown are the total number of responding neurons in each of the 14 AAV-GCaMP6s and 15 Thy1-GCaMP3 mice.
| AAV-GCaMP6s
| |||||
|---|---|---|---|---|---|
| Animal | Responding Cells | Animal | Responding Cells | Animal | Responding Cells |
| 1 | 70 | 2 | 57 | 3 | 51 |
| 4 | 28 | 5 | 25 | 6 | 25 |
| 7 | 24 | 8 | 21 | 9 | 19 |
| 10 | 17 | 11 | 12 | 12 | 10 |
| 13 | 10 | 14 | 9 | ||
| Thy1-GCaMP3
| |||||
|---|---|---|---|---|---|
| Animal | Responding Cells | Animal | Responding Cells | Animal | Responding Cells |
| 1 | 91 | 2 | 66 | 3 | 31 |
| 4 | 30 | 5 | 26 | 6 | 26 |
| 7 | 24 | 8 | 24 | 9 | 22 |
| 10 | 21 | 11 | 21 | 12 | 18 |
| 13 | 15 | 14 | 8 | 15 | 8 |
Extended Data Table 2.
The table shows the distribution of 971 taste ganglion neurons according to their responses to each of the five basic taste qualities. All the data showing responses in at least 1% of the total population (above horizontal line) are included in Figure 4 (those below 1% were found on the average in less that 1 in 4 animals). Note that bitter-sour tuned neurons reflect the activation of T2R-expressing TRCs (see text and Methods for details).
| Response profile | Number of Cells |
|---|---|
| NaCl | 204 |
| Bitter | 168 |
| Sour | 152 |
| Sweet | 105 |
| Umami | 32 |
| Bitter - sour | 125 |
| Sweet - umami | 32 |
| Sweet - NaCl | 32 |
| Sweet - sour | 17 |
| Sweet - bitter | 14 |
| Bitter - NaCl | 12 |
| NaCl - sour | 11 |
|
| |
| NaCl - umami | 8 |
| Sweet - bitter - sour | 8 |
| Bitter - NaCl - sour | 7 |
| Sweet - NaCl - umami | 6 |
| Bitter - sour - umami | 6 |
| Sweet - sour - umami | 5 |
| Sweet - bitter - sour - umami | 5 |
| Bitter - umami | 4 |
| Sweet - bitter - umami | 3 |
| Sweet - NaCl - sour | 3 |
| Bitter - NaCl - sour - umami | 3 |
| NaCl - sour - umami | 2 |
| Sweet - bitter - NaCl | 2 |
| Sweet - bitter - NaCl - sour | 2 |
| Sweet - NaCl - sour - umami | 2 |
| Bitter - NaCl - umami | 1 |
Acknowledgments
We thank the National Institute of Dental and Craniofacial Research (NIDCR) transgenic-core and C. Guo at Janelia Farms for help in generating the Thy1-GCaMP3 mouse lines, B. Shields for histology support, and Y. Oka and M. Butnaru for nerve recording and pharmacological advice. We also thank members of the Zuker lab for helpful comments. This research was supported in part by the intramural research program of NIDCR(N.J.P.R.). C.S.Z. is an investigator of the Howard Hughes Medical Institute and a Senior Fellow at Janelia Farms.
Footnotes
Author Contributions
R.P.J.B. designed the study, carried out the imaging experiments, analyzed data, and wrote the paper; S.G.S. developed viral gene delivery to ganglion neurons and characterized the transgenic lines; J.C. characterized the transgenic lines, carried out initial imaging experiments, and analyzed data; D.Y. collected and analyzed data; M.J.S. provided critical microendoscopy expertise; N.J.P.R. and C.S.Z. designed the study, analyzed data and wrote the paper.
References
- 1.Yarmolinsky DA, Zuker CS, Ryba NJP. Common sense about taste: from mammals to insects. Cell. 2009;139:234–244. doi: 10.1016/j.cell.2009.10.001. [DOI] [PMC free article] [PubMed] [Google Scholar]
- 2.Tian L, et al. Imaging neural activity in worms, flies and mice with improved GCaMP calcium indicators. Nature methods. 2009;6:875–881. doi: 10.1038/nmeth.1398. [DOI] [PMC free article] [PubMed] [Google Scholar]
- 3.Jung JC, Mehta AD, Aksay E, Stepnoski R, Schnitzer MJ. In vivo mammalian brain imaging using one- and two-photon fluorescence microendoscopy. Journal of neurophysiology. 2004;92:3121–3133. doi: 10.1152/jn.00234.2004. [DOI] [PMC free article] [PubMed] [Google Scholar]
- 4.Simon SA, de Araujo IE, Gutierrez R, Nicolelis MA. The neural mechanisms of gustation: a distributed processing code. Nature reviews Neuroscience. 2006;7:890–901. doi: 10.1038/nrn2006. [DOI] [PubMed] [Google Scholar]
- 5.Chandrashekar J, et al. The cells and peripheral representation of sodium taste in mice. Nature. 2010;464:297–301. doi: 10.1038/nature08783. [DOI] [PMC free article] [PubMed] [Google Scholar]
- 6.Huang AL, et al. The cells and logic for mammalian sour taste detection. Nature. 2006;442:934–938. doi: 10.1038/nature05084. [DOI] [PMC free article] [PubMed] [Google Scholar]
- 7.Mueller KL, et al. The receptors and coding logic for bitter taste. Nature. 2005;434:225–229. doi: 10.1038/nature03352. [DOI] [PubMed] [Google Scholar]
- 8.Zhao GQ, et al. The receptors for mammalian sweet and umami taste. Cell. 2003;115:255–266. doi: 10.1016/s0092-8674(03)00844-4. [DOI] [PubMed] [Google Scholar]
- 9.Chaudhari N, Roper SD. The cell biology of taste. The Journal of cell biology. 2010;190:285–296. doi: 10.1083/jcb.201003144. [DOI] [PMC free article] [PubMed] [Google Scholar]
- 10.Frank M, Pfaffmann C. Taste nerve fibers: a random distribution of sensitivities to four tastes. Science. 1969;164:1183–1185. doi: 10.1126/science.164.3884.1183. [DOI] [PubMed] [Google Scholar]
- 11.Feng G, et al. Imaging neuronal subsets in transgenic mice expressing multiple spectral variants of GFP. Neuron. 2000;28:41–51. doi: 10.1016/s0896-6273(00)00084-2. [DOI] [PubMed] [Google Scholar]
- 12.Akerboom J, et al. Optimization of a GCaMP calcium indicator for neural activity imaging. The Journal of neuroscience : the official journal of the Society for Neuroscience. 2012;32:13819–13840. doi: 10.1523/JNEUROSCI.2601-12.2012. [DOI] [PMC free article] [PubMed] [Google Scholar]
- 13.Chen TW, et al. Ultrasensitive fluorescent proteins for imaging neuronal activity. Nature. 2013;499:295–300. doi: 10.1038/nature12354. [DOI] [PMC free article] [PubMed] [Google Scholar]
- 14.Li X, et al. Human receptors for sweet and umami taste. Proceedings of the National Academy of Sciences of the United States of America. 2002;99:4692–4696. doi: 10.1073/pnas.072090199. [DOI] [PMC free article] [PubMed] [Google Scholar]
- 15.Nelson G, et al. An amino-acid taste receptor. Nature. 2002;416:199–202. doi: 10.1038/nature726. [DOI] [PubMed] [Google Scholar]
- 16.Adler E, et al. A novel family of mammalian taste receptors. Cell. 2000;100:693–702. doi: 10.1016/s0092-8674(00)80705-9. [DOI] [PubMed] [Google Scholar]
- 17.Oka Y, Butnaru M, von Buchholtz L, Ryba NJP, Zuker CS. High salt recruits aversive taste pathways. Nature. 2013;494:472–475. doi: 10.1038/nature11905. [DOI] [PMC free article] [PubMed] [Google Scholar]
- 18.Tomchik SM, Berg S, Kim JW, Chaudhari N, Roper SD. Breadth of tuning and taste coding in mammalian taste buds. The Journal of neuroscience : the official journal of the Society for Neuroscience. 2007;27:10840–10848. doi: 10.1523/JNEUROSCI.1863-07.2007. [DOI] [PMC free article] [PubMed] [Google Scholar]
- 19.Ghanouni P, et al. The effect of pH on beta(2) adrenoceptor function. Evidence for protonation-dependent activation. The Journal of biological chemistry. 2000;275:3121–3127. doi: 10.1074/jbc.275.5.3121. [DOI] [PubMed] [Google Scholar]
- 20.Heyer BR, Taylor-Burds CC, Tran LH, Delay ER. Monosodium glutamate and sweet taste: generalization of conditioned taste aversion between glutamate and sweet stimuli in rats. Chemical senses. 2003;28:631–641. doi: 10.1093/chemse/bjg056. [DOI] [PubMed] [Google Scholar]
- 21.Chen X, Gabitto M, Peng Y, Ryba NJP, Zuker CS. A gustotopic map of taste qualities in the mammalian brain. Science. 2011;333:1262–1266. doi: 10.1126/science.1204076. [DOI] [PMC free article] [PubMed] [Google Scholar]
- 22.Beidler LM, Smallman RL. Renewal of cells within taste buds. The Journal of cell biology. 1965;27:263–272. doi: 10.1083/jcb.27.2.263. [DOI] [PMC free article] [PubMed] [Google Scholar]
- 23.Grill HJ, Norgren R. The taste reactivity test. II. Mimetic responses to gustatory stimuli in chronic thalamic and chronic decerebrate rats. Brain research. 1978;143:281–297. doi: 10.1016/0006-8993(78)90569-3. [DOI] [PubMed] [Google Scholar]
- 24.Zaidi FN, Whitehead MC. Discrete innervation of murine taste buds by peripheral taste neurons. The Journal of neuroscience : the official journal of the Society for Neuroscience. 2006;26:8243–8253. doi: 10.1523/JNEUROSCI.5142-05.2006. [DOI] [PMC free article] [PubMed] [Google Scholar]
- 25.Barretto RP, et al. Time-lapse imaging of disease progression in deep brain areas using fluorescence microendoscopy. Nature medicine. 2011;17:223–228. doi: 10.1038/nm.2292. [DOI] [PMC free article] [PubMed] [Google Scholar]
- 26.Sollars SI, Hill DL. In vivo recordings from rat geniculate ganglia: taste response properties of individual greater superficial petrosal and chorda tympani neurones. The Journal of physiology. 2005;564:877–893. doi: 10.1113/jphysiol.2005.083741. [DOI] [PMC free article] [PubMed] [Google Scholar]
- 27.Thevenaz P, Ruttimann UE, Unser M. A pyramid approach to subpixel registration based on intensity. IEEE transactions on image processing : a publication of the IEEE Signal Processing Society. 1998;7:27–41. doi: 10.1109/83.650848. [DOI] [PubMed] [Google Scholar]
- 28.Mukamel EA, Nimmerjahn A, Schnitzer MJ. Automated analysis of cellular signals from large-scale calcium imaging data. Neuron. 2009;63:747–760. doi: 10.1016/j.neuron.2009.08.009. [DOI] [PMC free article] [PubMed] [Google Scholar]
- 29.Rousseeuw PJ, Croux C. Alternatives to the Median Absolute Deviation. J Am Stat Assoc. 1993;88:1273–1283. doi: 10.2307/2291267. [DOI] [Google Scholar]
- 30.Hyman AM, Frank ME. Effects of binary taste stimuli on the neural activity of the hamster chorda tympani. The Journal of general physiology. 1980;76:125–142. doi: 10.1085/jgp.76.2.125. [DOI] [PMC free article] [PubMed] [Google Scholar]