

Abstract
Background & Aims
Acute hyperglycemia delays gastric emptying in patients with diabetes. However, it is not clear whether improved control of glycemia affects gastric emptying in these patients. We investigated whether overnight and short-term (6 months) improvements in control of glycemia affect gastric emptying.
Methods
We studied 30 patients with poorly controlled type 2 diabetes (levels of glycated hemoglobin >9%). We measured gastric emptying using the [13C]-spirulina platensis breath test on the patients’ first visit (visit 1), after overnight administration of insulin or saline, 1 week later (visit 2), and 6 months after intensive therapy for diabetes. We also measured fasting and post-prandial plasma levels of C-peptide, GLP1, and amylin, as well as autonomic functions.
Results
At visit 1, gastric emptying was normal in 10 patients, delayed in 14, and accelerated in 6; 6 patients had gastrointestinal symptoms; vagal dysfunction was associated with delayed gastric emptying (P<.05). Higher fasting blood levels of glucose were associated with shorter half-times of gastric emptying (thalf) at visits 1 (r= −0.46, P=.01) and 2 (r= −0.43, P=.02). Although blood levels of glucose were lower after administration of insulin (132±7 mg/dl) than saline (211±15 mg/dl; P=0.0002), gastric emptying thalf was not lower after administration of insulin, compared with saline. After 6 months of intensive therapy, levels of glycated hemoglobin decreased from 10.6%±0.3% to 9%±0.4% (P=.0003), but gastric emptying thalf did not change (92±8 min before, 92±7 min after). Gastric emptying did not correlate with plasma levels of GLP1 and amylin.
Conclusions
Two-thirds of patients with poorly-controlled type 2 diabetes have mostly asymptomatic yet abnormal gastric emptying. Higher fasting blood levels of glucose are associated with faster gastric emptying. Overnight and sustained (6 months) improvements in glycemic control do not affect gastric emptying.
Keywords: gastroparesis, autonomic, diabetes mellitus, glucose, DM
Introduction
Diabetes mellitus (DM) is associated with abnormal (i.e., delayed or rapid) GE, which is frequently asymptomatic1 and may affect control of glycemia.2,3 While most studies have focused on gastroparesis in type 1 DM, type 2 DM is also associated with GE disturbances.[4] The risk factors for delayed GE in DM are partly understood; autonomic neuropathy, enteropathy, and hyperglycemia are the most frequently implicated mechanisms.4–6 Acute hyperglycemia (i.e., a blood glucose concentration of 16–20 mmol/l) delayed GE in type 1 DM compared to euglycemia.7 Moreover, even acute “physiological glycemia” (blood glucose concentration of 8 mmol/l versus 4 mmol/l) delayed GE in type 1 DM.8 While similar assessments have not been performed in type 2 DM, a cross-sectional study observed that the emptying of liquids and the duration of the lag phase, but not overall emptying, for solids were related to the blood glucose concentration in type 2 DM.9
The relationship between long term control of glycemia, as measured by glycosylated hemoglobin (HbA1c), and GE in DM is also unclear. In cross-sectional epidemiological studies, increased HbA1c levels were a risk factor for GI symptoms in a cohort of patients with predominantly type 2 DM.10 However, in another study, HbA1c levels were not significantly different among 3 groups of patients with DM i.e. no GI symptoms, GI symptoms and delayed GE, GI symptoms and normal GE.11 In longitudinal studies, intensive control of glycemia reduced the incidence of microvascular (retinopathy and nephropathy) and neuropathic complications in type 1 and type 2 DM.12 However, the effects of improving control of glycemia on GE in DM are essentially unknown. In the only study to assess the question, improved control of glycemia did not improve GE 1 week later in 10 patients with type 2 DM.13 The Adelaide group assessed the natural history of GE disturbances in DM. Beginning with a cohort of 86 patients, 20 patients, of which 16 had type 1 DM, were reassessed 12 years later and 13 patients (12 had type 1 DM) were reassessed approximately 25 years after the first study.14, 15 Despite a reduction in HbA1c, which was statistically significant at the earlier follow-up point (i.e., 8.4±2.3% at baseline, 7.6±1.3% at 12 years median), GE was stable over time when assessed for the entire group. Hence, the impact of improving control of glycemia on GE in type 2 DM is incompletely understood.
Therefore, we evaluated GE on 3 occasions, i.e. at baseline, after overnight insulin or saline administration, and after short-term (6 months) modification of glycemic therapy to optimize control of glycemia in 30 patients with poorly-controlled type 2 DM. Our hypotheses were that improved control of glycemia will improve GE acutely and in the short term. This study was limited to patients with type 2 DM because we sought to reduce heterogeneity in this cohort. Moreover, because on average, patients with type 1 DM are more likely to have peripheral and autonomic neuropathy,16 we reasoned that improved glucose control would be more likely to improve GE in patients with type 2 DM.
Methods
Study Design
This was a single center study, approved by the Mayo Clinic Institutional Review Board, to evaluate whether improving control of glycemia affected GE in 30 patients with poorly-controlled type 2 DM. The acute intervention comprised balanced single-blind (patient only) randomization [1:1] to overnight insulin or saline infusions. Thereafter, the management of DM was modified as deemed appropriate as part of their clinical management generally by endocrinologists for the next 6 months. GE was evaluated at baseline, after the acute intervention 1 week thereafter, and at 6 months. GI symptoms and autonomic functions were assessed at baseline and at 6 months. Plasma hormone concentrations were evaluated concurrently during GE studies at baseline and after the acute intervention.
Participants
Eligible participants were all patients aged 18 years and older with poorly controlled type 2 DM (HbA1c>9%) in whom the management of DM was scheduled to be modified as part of clinical practice. Exclusion criteria included severe nausea or vomiting prior to study activities, serum creatinine >1.5 mg/dl, current or anticipated use of medications most likely to affect GI motility (e.g., opiates, metoclopramide, erythromycin, exenatide, or pramlintide) or control of glycemia (e.g., steroids), serious systemic illness (e.g., cardiovascular or pulmonary disorder, psychiatric illness, ongoing systemic cancer) or any prior gastric, intestinal, or colonic resection, consideration of major surgery (e.g. pancreas or kidney transplantation, dialysis, bariatric surgery) within the next 6 months, documented serial non-compliance with management, and allergies to eggs, wheat, or milk.
Assessment of GE by 13C-octanoate Breath Test
All 3 breath tests were performed in the morning after an overnight fast. GE was evaluated by an established validated 13C-Spirulina platensis breath test. Briefly, S. platensis is a protein-rich, blue-green algae, which is sold as a dietary supplement in the United States.17, 18 The 13C content of Spirulina is increased to 99% by growing it in a closed hydroponics chamber charged with pure 13C-source. The 13C-labeled S. platensis is incorporated into the egg mix and can only be released from the algal cells after the egg mix is emptied from the stomach, the cells are digested, and the 13C-labeled substrates (algal protein, fat, and carbohydrate) are absorbed and metabolized. The test meal contains 27 g freeze dried egg mix, 6 saltine crackers, and 180 mL of water with a caloric content of 223 kcal (19.2 g carbohydrates, 12 g protein, and 10.9 g fat.)
Breath samples were collected at baseline (i.e., before the meal) and at 15, 30, 45, 60, 90, 120, 150, 180, and 240 minutes after the meal in glass screwcap Exetainer® tubes (Labco Limited, High Wycombe, U.K.) using a straw to blow into the bottom of the tube to displace contained air. After re-capping the tubes, the 13CO2 breath content was determined in a centralized laboratory (AB Diagnostics, Brentwood, TN) by Gas Isotope Ratio Mass Spectrometry. The 13C enrichment was expressed as the delta per mL difference between the 13CO2/12CO2 ratio of the sample and the standard. To calculate the quantity of 13C appearing in breath per unit time, delta over baseline was used where: 0.0112372 is the isotopic abundance of the limestone standard, Pee Dee Belemnite, and CO2 production was corrected for age, sex, height and weight using the algorithms of Schofield et al., as described by Klein.19 The [13C] breath excretion values (kPCD units) was analyzed in all samples. These units were used to estimate GE thalf using validated models derived from studies in which GE was simultaneously assessed by the 13C-Spirulina platensis breath test and scintigraphy.20, 21 For this meal, the 10th–90th percentile range for GE thalf in healthy subjects is 50–97 minutes.20
Symptom Questionnaires
GI symptoms were evaluated by the validated upper gastrointestinal symptom severity index (PAGI-SYM) at baseline and 6 month visits.22 Patients were asked to rate the severity of 20 upper gastrointestinal symptoms over the preceding 2 weeks.
Autonomic Functions
Cardiovagal and adrenergic functions were evaluated by standardized methods during visits 1 and 3.23 Cardiovagal functions were evaluated by heart-rate responses to deep breathing (HRDB) and the Valsalva maneuver. HRDB was the heart-rate range with the subject supine and breathing at 6 breaths per minute. For the Valsalva maneuver, the subject was rested and recumbent and was asked to maintain a column of mercury at 40 mmHg for 15 seconds. The Valsalva ratio is the ratio of maximal-to-minimal heart rate.24 Vagal functions were scored by the results of HRDB and Valsalva maneuver. Adrenergic function was evaluated by blood pressure (BP) and heart-rate responses, monitored continuously (Finapres monitor; Ohmeda, Englewood, Colorado), to a Valsalva maneuver. The results of the autonomic battery of tests were corrected for confounding effects of age and gender using established norms. The Composite Autonomic Severity Score (CASS) consists of two subscores: cardiovagal (CASS-vag; 0–3); and adrenergic (CASS-adr; 0–3).25 The total score and subset scores provide an evaluation of the severity and distribution of autonomic failure.
Blood Glucose and Plasma Hormone Concentrations
Blood samples were collected before and at 15, 30, 60, 120, 180, and 240 minutes during GE studies at all 3 visits. Plasma samples were placed in ice, centrifuged at 40° C, separated and stored at −70° C until assay. Plasma glucose concentrations were measured during all 3 GE studies. Because GLP-1, amylin, and insulin-associated hypoglycemia can delay gastric emptying, 26–28 plasma concentrations of C-peptide, amylin, glucagon-like peptide 1 (GLP-1), were measured during the first and second GE studies. Plasma glucose was measured on the Cobas c311 analyzer (Roche Diagnostics, Indianapolis, IN 46250) utilizing a hexokinase reagent. Insulin C-peptide was measured by a 2-site immunenzymatic sandwich assay on the Cobas e411 analyzer (Roche Diagnostics, Indianapolis, IN 46250). Glucagon-like peptide-1 (active) was measured by a quantitative two-site enzyme immunoassay from Linco Research, Inc. (St. Charles, MO 63304). Dipeptidyl peptidase 4 inhibitor (30 μl, Linco Research, St. Louis, MO) was added to these tubes. The total human amylin ELISA (Millipore EZHAT-51K) is a monoclonal antibody-based sandwich immunoassay for determining total amylin levels in human plasma.
Statistical Analysis
Analysis of covariance was used to compare post-treatment (i.e., acute intervention with insulin vs. saline, Visit 2) values for GE thalf; the baseline thalf was included as a covariate.
Paired t tests were used to compare baseline and 6 month HbA1c and GE thalf. The postprandial increments in plasma hormone concentrations (e.g. first 30 minutes) were compared to zero using a paired t-test or signed rank test, as warranted.
Relationships among GE thalf, glycemic measures (HbA1c and fasting glucose concentration), and plasma hormone concentrations were evaluated by Spearman correlation coefficients. The effect of insulin (versus saline) on hormonal responses during GE tests was evaluated by a repeated measures analysis of covariance (the corresponding mean hormone level from the baseline study was included as the covariate).
Changes in CASS (Baseline vs. Visit 3) were assessed using Bowker’s test for symmetry. The association of GE (fast, slow, overall abnormal) with CASS scores was assessed using contingency table analyses.
All results are presented as Mean (SEM).
Post Hoc Sample Size Assessment
In this cohort, the residual between subject standard deviation at study 2 in the ANCOVA model was 29.5 minutes. With 15 subjects per group, there was approximately 80% power to detect differences between groups in GE thalf values of 32 minutes. The observed within subject SD (baseline vs. post 6 months) was 36 minutes. After excluding 1 subject from the 6 month analysis as discussed later, the remaining 29 subjects provided approximately 80% power to detect a difference of ≥19.5 minutes between baseline and 6 months values for thalf using a paired t-test.
Results
Participants, Study Conduct, and Completion
One hundred and twenty three patients with poorly controlled DM2 and an HbA1c >9% were assessed for eligibility. Of these, 47 patients were not eligible to participate, 44 patients were eligible but declined to participate, and 2 patients were eligible but were not approached due to language barriers. Hence, 30 patients (17 females, age 55 [2] y, BMI 34 [1] kg/m2) were enrolled in the study and all completed the entire study (Table 1).
Table 1.
Demographics and other Baseline Features
| Overall | Placebo (Saline) | Insulin | |
|---|---|---|---|
|
| |||
| No of patients | 30 | 15 | 15 |
|
| |||
| Females | 17 | 8 | 9 |
|
| |||
| Age, yr | 55.2 ± 1.8 | 52.6 ± 2.2 | 57.8 ± 2.8 |
|
| |||
| BMI, kg/m2 | 33.8 ± 1.1 | 35.8 ± 1.8 | 32.0 ± 1.1 |
|
| |||
| Duration of DM (y) | 11 ± 1 | 9 ± 1 | 12 ± 2 |
|
| |||
| HbA1c (%) baseline | 10.55 ± 0.26 | 11.01 ± 0.43 | 10.09 ± 0.26 |
|
| |||
| HbA1c (%) 6 month follow up | 8.92 ± 0.37 | 9.06 ± 0.63 | 8.79 ± 0.40 |
|
| |||
| Fasting blood glucose (mg/dl)* | 222 ± 11 | 236 ± 13 | 209 ± 17 |
|
| |||
| Diabetic retinopathy (N) | 7 | 3 | 4 |
|
| |||
| Nephropathy (N) | 13 | 7 | 6 |
|
| |||
| Moderate or severe vagal or adrenergic dysfunction (N) | 11 | 5 | 6 |
|
| |||
| Baseline gastric emptying | |||
| Normal | 10 | 5 | 5 |
| Delayed | 14 | 7 | 7 |
| Rapid | 6 | 3 | 3 |
Abbreviations: BMI, body mass index; DM, diabetes mellitus; HbA1c, glycosylated hemoglobin; N, number of subjects.a
Just prior to baseline gastric emptying study
At baseline, patients had DM for 11 (1) years and the HbA1c was 10.6 [0.3]%; 4 were not taking any medications for DM, 13 patients were on oral hypoglycemic agents alone, 7 were on insulin alone, 6 were being treated with insulin and oral agents. Thirteen patients had nephropathy, 7 had retinopathy, and 4 had both.
Relationship Between Blood Glucose and GE
At baseline, 10 patients had normal, 14 had delayed, and 6 had accelerated GE. Vagal dysfunction was associated (p<0.05) with delayed GE. Fasting blood glucose concentrations just prior to the GE study were inversely correlated with GE thalf for the baseline (r= −0.46, p=0.01) and post insulin/saline visits (r=−0.43, p=0.02) i.e. higher concentrations were associated with shorter GE thalf (Figure 1). However, fasting blood glucose concentration was not associated with GE thalf at the 6 month visit (r=0.04, p=0.85). Likewise, the mean blood glucose concentration for the entire GE study was inversely correlated with GE thalf for the baseline (r= −0.51, p=0.004) and post insulin/saline visits (r= −0.36, p=0.05) i.e. higher concentrations were associated with shorter GE thalf. However, blood glucose concentration was not associated with GE thalf at the 6 month visit (r= −0.18, p=0.38).
Figure 1. Relationship between fasting plasma glucose concentrations and gastric emptying thalf.
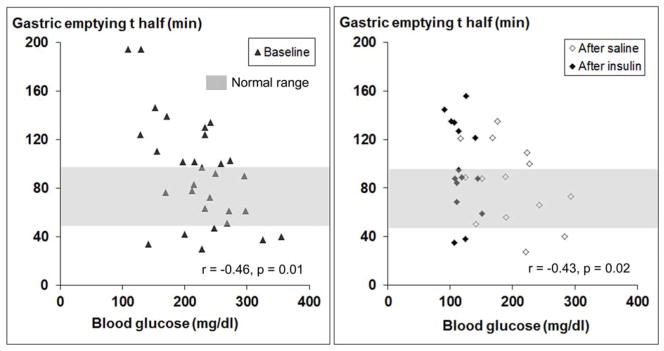
Fourteen patients had delayed (i.e., thalf > 97 minutes) and 6 had rapid (i.e., thalf < 50 minutes) gastric emptying at baseline. Gastric emptying thalf was inversely correlated with fasting plasma glucose concentrations during baseline (r = −0.46, p = 0.01) and post insulin/saline visits (r = −0.43, p = 0.02).
Effects of Overnight Insulin or Saline Infusion on GE
Blood glucose concentrations before saline (325 [23] mg/dl) and insulin infusions (275 [20] mg/dl) commenced were not significantly different (p=0.11). The blood glucose concentration was lower (p=0.0002) after overnight insulin (132±7 mg/dl) than saline (211±15 mg/dl) infusion (Supplementary Figure 1). However, GE thalf was not significantly different after insulin (91±11 minutes before, 97±10 minutes after) or saline (93±12 minutes before and 81±8 minutes after) infusions (Figure 2). The change in GE was inversely correlated (r=−0.45, p=0.01) with the change in fasting blood glucose concentrations between first and second studies. This indicates that a greater reduction in fasting blood glucose concentration between visits 1 and 2 was associated with a smaller change in GE thalf.
Figure 2. Effects of insulin (left panel) and saline (right panel) on gastric emptying thalf.
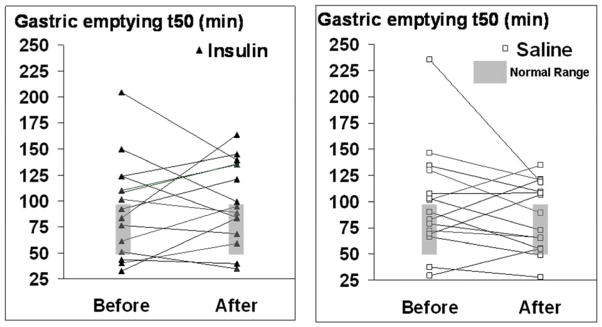
Before infusion, 14 patients (7 insulin, 7 saline) had delayed and 5 (3 insulin, 2 saline) had rapid gastric emptying. While the average gastric emptying thalf was lower after infusions, gastric emptying was still delayed in 10 of these 14 patients and also delayed in 3 patients with normal gastric emptying at baseline.
Among 14 patients with delayed GE at baseline, blood glucose declined from 194±14 mg/dl before to 160±16 mg/dl (p=0.03) after overnight infusion of saline or insulin. Among these patients, we also noted that fasting blood glucose concentrations just prior to GE assessments were inversely correlated with GE thalf for the baseline study (r=−0.56, p=0.04) (i.e., higher blood glucose concentrations were associated with shorter thalf). Moreover, the change in GE was inversely correlated (−r=0.69, p=0.007) with the change in fasting blood glucose concentrations between the first and second studies (i.e. a larger reduction in fasting blood glucose concentrations was associated with a smaller reduction in GE thalf) (Supplementary Figure 1, right panel).
Effects of Intensive Therapy for 6 months on Control of glycemia and on GE
Changes to diabetes regimen during the 6-month intensive therapy period included lifestyle change only (2 patients), initiation or modification of oral medication only (12 patients), of insulin only (12 patients), initiation of insulin and modification of oral medication (3 patients), and initiation of exenatide (1 patient) (Table 2, Figure 3). Since exenatide delays GE, this patient was not included in the analysis. In the remaining 29 patients, HbA1c concentrations declined (p=0.0003) from 10.6±0.3% before to 9±0.4% at 6 months after modifying therapy. The reduction in HbA1c was greatest among patients in whom insulin and oral therapy were modified and least in patients who underwent lifestyle modification only. Despite this improvement in HbA1c, overall GE was not significantly different after 6 months of intensive therapy (Figure 4) and the relationship between changes in HbA1c and changes in GE were not significant (r=−0.13, p=0.5). Likewise, the correlation between differences in GE and fasting blood glucose concentrations between first and third studies was not significant (r=0.17, p=0.40).
Table 2.
Effects of 6 month Treatment on Control of Glycemia and Gastric Emptying
| Modification | N | HbA1c before (%) | HbA1c after (%) | BMI before | BMI after | GE before thalf (min) | GE after thalf (min) |
|---|---|---|---|---|---|---|---|
| Lifestyle change only | 2 | 10.8 ± 0.2 | 10.5 ± 2 | 33.9 ± 2.9 | 34.1 ± 2.4 | 100 ± 24 | 108 ± 72 |
| Start or modify oral medication | 12 | 10.2 ± 0.4 | 9.1 ± 0.7 | 32 ± 1.7 | 32.3 ± 1.8 | 81 ± 16 | 77 ± 12 |
| Start or modify insulin | 12 | 10.4 ± 0.4 | 8.7 ±0.5 | 34.9 ± 1.7 | 35.5 ± 2.0 | 104 ± 11 | 99 ± 8 |
| Start insulin + modify oral medication | 3 | 12.6 ± 1.0 | 9.1 ± 1.0 | 37.2 ± 5.0 | 39.2 ± 4.8 | 87 ± 13 | 97 ± 12 |
| Start GLP-1 | 1 | 9 | 6.9 | 33.1 | 32.4 | 73 | 97 |
| Overall a | 30 | 10.6 ± 0.3 | 9 ± 0.4 b | 33.8 ± 1.1 | 34.4 ± 1.2 | 92 ± 8 | 92 ± 7 |
Abbreviations: BMI, body mass index; GE, gastric emptying; HbA1c, glycosylated hemoglobin; N, number
Results do not include 1 patient started on GLP-1
p = 0.0003
Figure 3. Effect of intensive therapy on glycosylated hemoglobin (HbA1c [%]).

Observe more pronounced decline in patients treated with insulin (right panel) than oral hypoglycemic therapy or lifestyle modification (left panel).
Figure 4. Effect of intensive therapy on gastric emptying thalf.

The overall effects of intensive control of glycemia on gastric emptying were not significant.
The relationship between HbA1c and GE thalf was also considered separately in patients in delayed and normal GE at visit 1. Among patients with delayed GE at the first visit, HbA1c declined from 10.2±0.3% to 8.9±0.4% (p=0.03) at 6 months. The fasting blood glucose before the GE study was 194±14 mg/dl at baseline and 190±21 mg/dl at 6 months. GE thalf declined (p=0.19) from 128±9 min at baseline to 113±10 min at 6 months. Among patients with normal GE at baseline, HbA1c declined from 10.8±0.4% to 9.1±0.6% (p=0.003) and GE thalf increased (p=0.09) from 59±5 min at baseline to 69±8 min at 6 months; the fasting blood glucose before beginning the GE study was 247±15 mg/dl at baseline and 205±23 mg/dl at 6 months. Hence, after intensive therapy, GE thalf declined, albeit not significantly, in patients with delayed GE but increased in patients with normal GE thalf at baseline. Baseline GE was borderline associated (p=0.05) with the change in thalf from baseline to 6 months.
GE thalf values were significantly correlated between first and second visits (r=0.54, p=0.002) and between first and third visits (r=0.63, p=0.0003). However, among patients with delayed GE at baseline, correlations between GE (thalf) values for first versus second visits (r=0.002, p=0.99) and for first versus third visits (r=0.24, p=0.40) were not significant. Among patients who received saline, the difference between the first and second GE values was not related to the average of both studies, i.e. the Bland Altman test was negative (Supplementary Figure 3).
Effects of Intensive Therapy on Autonomic Dysfunction
At baseline, 14 patients had vagal dysfunction, which ranged from mild (n=8), moderate (n=6), or severe (n=4). Eight patients had adrenergic dysfunction, which was mild (n=6) or moderate (n=2). Compared to baseline, vagal functions were unchanged in 20, improved by one grade in 4 and worsened by 1 grade in 5 patients at 6 months after intensive therapy; one patient had frequent extra systoles precluding a reliable assessment at the 6 month visit. Of these 9 patients with improvement or deterioration, 8 had no or mild dysfunction and 1 had moderately severe vagal dysfunction at baseline. Likewise, adrenergic functions were unchanged in 20 patients. Adrenergic functions improved in 5 patients who had mild (n=4) or moderate (n=1) dysfunction at baseline. Adrenergic functions worsened in 2 patients who had no dysfunction at baseline. In the remaining 3 patients, the 6 month assessment was not performed (1 patient) or was incomplete because high intraocular pressure or retinopathy precluded assessment of the Valsalva maneuver (2 patients).
Relationship between Gastric Emptying and Plasma Hormone Concentrations
Fasting and peak plasma C-peptide concentrations were ≥200 pmol/L (pM) in 29 and all 30 patients respectively, suggesting relatively preserved endogenous insulin reserve. Plasma concentrations of GLP-1, amylin, and C-peptide increased after the GE breath test meal (Supplementary Table 1) and these concentrations differed amongst postprandial time points i.e. plasma C-peptide (p<0.0001), amylin (p<0.0001), and GLP-1 (p=0.06). During the second GE study, mean postprandial concentrations and the temporal profile were not different between insulin and saline groups. During the first and second GE studies, postprandial increments in plasma concentrations of GLP-1 and amylin were not correlated with GE (data not shown). There was a significant correlation between plasma concentrations of amylin and C-peptide at corresponding timepoints (r values ranged 0.62 to 0.83, p≤0.003). Plasma hormone concentrations were not measured during the third GE study.
GI Symptoms
At baseline, 6 patients reported GI symptoms. Of these, 5 patients had mild symptoms and one had severe symptoms; 4 had abnormal (delayed [3] or accelerated [1]) GE. Symptoms were heartburn/regurgitation (1 patient), nausea/vomiting (1 patient), upper abdominal pain (1 patient), lower abdominal pain (4 patients), and bloating (1 patient). The overall 20-item patient assessment of upper GI symptom severity index (PAGI-SYM) score was 0.4±0.1 where scores of 0 and 1 reflect no symptoms and very mild symptoms respectively. At 6 months, 6 patients, including 4 patients who had symptoms at baseline, reported one or more mild GI symptoms (nausea/vomiting [1 patient], lower abdominal pain [4 patients], postprandial fullness [1 patient] and bloating [2 patients]); the overall PAGI-SYM score was 0.3±0.1. Four of these 6 patients had abnormal (3 had delayed) GE.
Discussion
While several studies demonstrate that acute hyperglycemia can delay GE in humans, the effects of improving control of glycemia on GE in DM are unknown. There are three main observations from this study. First, contrary to current concepts, higher fasting blood glucose concentrations were associated with shorter thalf for GE (i.e., faster emptying) during baseline and post insulin/saline visits in patients with poorly controlled type 2 DM. Second, after overnight treatment with insulin or saline, changes in blood glucose concentrations were inversely correlated with changes in GE thalf (i.e., a smaller change in blood glucose concentration was associated with a more pronounced reduction in GE thalf). Third, control of glycemia but not GE significantly improved 6 months after more intensive anti-hyperglycemic therapy.
At baseline, nearly two-thirds of patients had abnormal (i.e., delayed [46%] or rapid [17%]) GE but most were asymptomatic. Nineteen patients (i.e., nearly two-thirds) had autonomic (vagal or adrenergic) dysfunctions, which is similar to the prevalence in a prior cohort of patients with DM and symptomatic upper GI motility disorders.4 Vagal dysfunction was associated with delayed GE in this study. The prevalence of delayed GE in this cohort, which was not selected on the basis of GI symptoms, was higher than previously documented in patients with type 2 DM.29–33 For example, in a study from Olmsted County, only 1% of patients with type 2 DM developed symptoms of gastroparesis and/or delayed GE over 10 years.34 However this figure may be an underestimate since GE disturbances are often asymptomatic6 and GE was only evaluated in a minority of patients in that study. The present observations reinforce concepts, which are well established in type 1 but less so in type 2 DM, that DM is associated with frequently asymptomatic, delayed or rapid GE.6, 35
Compared to euglycemia (blood glucose 5–8 mmol/l), acute hyperglycemia (blood glucose 16–20 mmol/l) delayed GE in healthy subjects and in type 1 DM 7, 36. Moreover, acute hyperglycemia for 24 hours induced apoptosis in murine myenteric neurons.37 Current concepts emphasize the contribution of hyperglycemia to delayed GE.38 Indeed, consensus guidelines for GE scintigraphy issued by the American Neurogastroenterology and Motility Society and the Society of Nuclear Medicine recommend that if the blood glucose is greater than 275 mg/dl on the morning of the test, the glucose should be lowered with insulin to 275 mg/dl before commencing the test.38 In contrast, we observed an inverse correlation between fasting glucose concentration and GE, both at baseline and during the second visit, which was preceded by treatment of hyperglycemia. Insulin was not administered for elevated fasting blood glucose concentrations just prior to the GE study because we sought to examine the relationship between the fasting blood glucose concentration and GE. Of interest, 9 of 90 GE studies were preceded by a blood glucose concentration >275 mg/dl. Among these patients, 2 had normal, 2 had delayed, and 5 had rapid GE. Moreover, among patients with delayed GE at baseline, a smaller reduction in fasting blood glucose concentration was associated with a more pronounced reduction in GE between baseline and second visits.
There are 2 critical implications of the latter observation. First, they suggest that the short-term reproducibility of GE in patients with DM is relatively limited even when the blood glucose concentration is relatively stable between initial and subsequent assessments. Second, they do not support the prevailing concept that hyperglycemia per se up to plasma concentrations observed in this study significantly delays GE in type 2 DM. What might explain these differences between current concepts and the present findings? One possibility is that the effects of hyperglycemia on GE depend on the diabetic phenotype. Indeed, this study was conducted in type 2 DM, whereas the effects of acute hyperglycemia on GE have only been studied in healthy people and in type 1 DM.7, 8, 39 There is considerable data from animal models (i.e., Lepr db/db and non-obese diabetic (NOD) mice) suggesting that hyperglycemia is also associated with rapid gastric emptying. In the Lepr db/db mice, which represent a model for type 2 DM, hyperglycemia induced hyperplasia of the stem cells of interstitial cells of Cajal (ICC) and ICC, which lead to accelerated gastric emptying.40 Hyperplasia of ICC occurred despite reduced signaling by the insulin like growth factor 1-dependent Kit ligand, which normally sustains ICC. Even in NOD mice, which represent a model for type 1 DM, hyperglycemia is initially associated with rapid gastric emptying. 41, 42 Subsequently, it is only when oxidative stress and reduced Kit signaling are not offset by mechanisms such as the upregulation of the antioxidant enzyme heme-oxygenase 1 42 and mitogen-activated protein kinases, 40 respectively, that ICC are depleted, and gastric emptying is delayed. Taken together, these observations suggest the hypothesis that ICC are likely preserved in patients with DM and rapid gastric emptying.
Plasma amylin, GLP-1 and C-peptide concentrations increased after the GE meal. Confirming the accuracy of these measurements, plasma concentrations of amylin and C-peptide were strongly correlated, which is consistent with cosecretion of these hormones by the islets. Might hormonal differences explain the different effects of hyperglycemia on GE in type 1 and type 2 DM?43 While insulin-induced hypoglycemia (but not euglycemic hyperinsulinemia) accelerated GE in DM,28, 32 this explanation seems unlikely because patients were euglycemic during overnight insulin administration and infusions (insulin or saline) were discontinued before the GE study. Pharmacological concentrations of GLP-1 and amylin can delay GE,26, 27 and impaired hyperglycemia-induced release of amylin, which delays GE, may contribute to rapid GE in DM.44 However, plasma concentrations of amylin and GLP-1 were not correlated with GE, which argues against the explanation that inadequate release of amylin or GLP-1 is responsible for rapid GE and hyperglycemia. Previous studies suggest that higher glucagon concentrations in isolation are unlikely to explain rapid GE in type 2 DM.31, 45
During the 6 month period, therapy for diabetes was managed per clinical practice, generally by endocrinologists. Thereafter, HbA1c improved significantly and by a magnitude comparable to the average improvement in HbA1c in randomized trials (e.g., 1–2% for monotherapy with metformin or sulfonylureas, 0.5–1.4% for monotherapy with thiazolinediones and 1.5–3.5% for insulin).46 However, improved control of glycemia at 6 months was not associated with a significant improvement in GE either in the overall cohort or in patients who had delayed GE at baseline. Among 14 patients with delayed GE, the mean thalf was 128 minutes. Since the upper range of normal for GE thalf is 97 minutes, a reduction of approximately 35 minutes was required to normalize gastric emptying. Fourteen subjects provided 79% power to detect this difference; hence a type II error is unlikely.
Some diabetes guidelines recommend that the target HbA1c for non-pregnant patients is <7%. However, a systematic review of large randomized controlled trials in patients with type 2 diabetes suggests that “tight control of glycemia burdens patients with complex treatment programs, hypoglycemia, weight gain, and costs and offers uncertain benefits in return.” 47 For example, the United Kingdom Prospective Diabetes Study metformin trial reported that tight control of glycemia reduced mortality risks, whereas the Action to Control Cardiovascular Risk in Diabetes trial reported that tight control increased these risks. Moreover, it is unlikely the substantial improvement in HbA1c reported in these trials can be replicated in clinical practice. For example, a systematic review of 52 studies that implemented care management models in clinical practice observed a statistically significant but trivial reduction of HbA1c (weighted difference in means −0.21%, 95% confidence interval −0.40 to −0.03, p < .03) with intensive therapy. 48 Similar to other complications of DM (e.g., microvascular disease, nephropathy, neuropathy), it is conceivable that a more pronounced and/or long term improvement in control of glycemia is necessary to restore gastric emptying,12 assuming that delayed GE is not a result of irreversible mechanisms (e.g., loss of interstitial cells of Cajal). Alternatively, similar to the phenomenon of metabolic memory for autonomic neuropathy in type 1 DM, it is conceivable that intensive control of glycemia will improve GE only if it is instituted relatively early in the disease.49 Indeed, a recent study demonstrated a striking improvement, indeed normalization, of gastric emptying 3 months after improving control of glycemia in 30 women with recently diagnosed type 2 DM. 50 However, the improvement in HbA1c from an average of 10.5% to 5.8% 2–3 months after beginning glipizide in that trial far exceeds the effect of monotherapy in other trials. 46
These findings have implications on clinical practice. First, consideration should be given to assessing GE, even in asymptomatic patients with type 2 DM, because GE disturbances may at least partly explain impaired control of glycemia.43 The 13C-spirulina breath test, which has been extensively validated in healthy subjects and disease, provides an effective and noninvasive approach to measure GE without radiation exposure. Second, since GE assessments in DM may be variable, consideration should be given to reevaluating GE when indicated in patients with type 2 DM. To emphasize, higher variability in GE was associated with a smaller change in blood glucose concentrations between first and second visits. Third, the recommendation to cancel gastric emptying assessment in patients with type 2 DM when the fasting blood glucose greater than 275 mg/dl should be revisited 38. Four, while better control of glycemia is generally beneficial, long term studies are necessary to clarify whether improved control of glycemia improves GE in type 2 DM. Since these patients were mostly asymptomatic, the extent to which these findings are applicable to symptomatic patients with poorly controlled type 2 DM is unclear.
In summary, these observations demonstrate that nearly two thirds of patients with poorly-controlled type 2 DM had, mostly asymptomatic, delayed (46%) or rapid GE. While overnight insulin infusion and subsequent therapy (6 months) improved control of glycemia, neither significantly affected GE in patients with poorly controlled type 2 DM. Higher fasting blood glucose concentrations were associated with shorter thalf for GE (i.e., faster emptying) and after treatment with insulin or saline, changes in blood glucose concentrations were inversely correlated with changes in GE thalf,.
Supplementary Material
Acknowledgments
This study was primarily supported by USPHS NIH Grant R01 DK068055. It was made possible by CTSA Grant Number UL1 TR000135 from the National Center for Advancing Translational Sciences (NCATS), a component of the National Institutes of Health (NIH). Dr. Low’s contribution was supported in part by NIH (NS 32352, NS 44233, U54 NS065736) and Mayo Funds.
The authors are grateful to Ms. Anuja Kulkarni and Erica Veil for excellent technical support.
Abbreviations
- CASS
Composite Autonomic Severity Score
- DM
diabetes mellitus
- GE
gastric emptying
- GI
gastrointestinal
- HbA1c
glycosylated hemoglobin
Footnotes
There are no conflicts of interest for any of the authors.
Its contents are solely the responsibility of the author(s) and do not necessarily represent the official view of NCRR or NIH.
Contributions
Adil E. Bharucha, MBBS, MD—Study concept and design; obtained funding; screened participants; analyzed and interpreted data; supervised the study; drafted and edited the manuscript
Yogish Kudva, MD— data acquisition; edited the manuscript
Ananda Basu, MD— data acquisition; edited the manuscript
Michael Camilleri, MD— study design; edited the manuscript
Phillip A. Low, MD— data acquisition; edited the manuscript
Adrian Vella, MD— data acquisition; edited the manuscript
Alan R. Zinsmeister, PhD— statistical analysis, edited the manuscript
Publisher's Disclaimer: This is a PDF file of an unedited manuscript that has been accepted for publication. As a service to our customers we are providing this early version of the manuscript. The manuscript will undergo copyediting, typesetting, and review of the resulting proof before it is published in its final citable form. Please note that during the production process errors may be discovered which could affect the content, and all legal disclaimers that apply to the journal pertain.
References
- 1.Kassander P. Asymptomatic gastric retention in diabetics: gastroparesis diabeticorum. Annals of Internal Medicine. 1958;48:797–812. doi: 10.7326/0003-4819-48-4-797. [DOI] [PubMed] [Google Scholar]
- 2.Horowitz M, Edelbroek MA, Wishart JM, Straathof JW. Relationship between oral glucose tolerance and gastric emptying in normal healthy subjects. Diabetologia. 1993;36:857–62. doi: 10.1007/BF00400362. [DOI] [PubMed] [Google Scholar]
- 3.Jones KL, Horowitz M, Carney BI, Wishart JM, Guha S, Green L. Gastric emptying in early noninsulin-dependent diabetes mellitus. Journal of Nuclear Medicine. 1996;37:1643–8. [PubMed] [Google Scholar]
- 4.Bharucha AE, Camilleri M, Low PA, Zinsmeister AR. Autonomic dysfunction in gastrointestinal motility disorders. Gut. 1993;34:397–401. doi: 10.1136/gut.34.3.397. [DOI] [PMC free article] [PubMed] [Google Scholar]
- 5.Rayner CK, Samsom M, Jones KL, Horowitz M. Relationships of upper gastrointestinal motor and sensory function with glycemic control. Diabetes Care. 2001;24:371–81. doi: 10.2337/diacare.24.2.371. [DOI] [PubMed] [Google Scholar]
- 6.Camilleri M, Bharucha AE, Farrugia G. Epidemiology, mechanisms, and management of diabetic gastroparesis. Clinical Gastroenterology & Hepatology. 2011;9:5–12. doi: 10.1016/j.cgh.2010.09.022. quiz e7. [DOI] [PMC free article] [PubMed] [Google Scholar]
- 7.Fraser RJ, Horowitz M, Maddox AF, Harding PE, Chatterton BE, Dent J. Hyperglycaemia slows gastric emptying in type 1 (insulin-dependent) diabetes mellitus. Diabetologia. 1990;33:675–80. doi: 10.1007/BF00400569. [DOI] [PubMed] [Google Scholar]
- 8.Schvarcz E, Palmer M, Aman J, Horowitz M, Stridsberg M, Berne C. Physiological hyperglycemia slows gastric emptying in normal subjects and patients with insulin-dependent diabetes mellitus. Gastroenterology. 1997;113:60–6. doi: 10.1016/s0016-5085(97)70080-5. [DOI] [PubMed] [Google Scholar]
- 9.Horowitz M, Harding PE, Maddox AF, Wishart JM, Akkermans LM, Chatterton BE, Shearman DJ. Gastric and oesophageal emptying in patients with type 2 (non-insulin-dependent) diabetes mellitus. Diabetologia. 1989;32:151–9. doi: 10.1007/BF00265086. [DOI] [PubMed] [Google Scholar]
- 10.Bytzer P, Talley NJ, Hammer J, Young LJ, Jones MP, Horowitz M. GI symptoms in diabetes mellitus are associated with both poor glycemic control and diabetic complications. American Journal of Gastroenterology. 2002;97:604–11. doi: 10.1111/j.1572-0241.2002.05537.x. [DOI] [PubMed] [Google Scholar]
- 11.Hyett B, Martinez FJ, Gill BM, Mehra S, Lembo A, Kelly CP, Leffler DA. Delayed radionucleotide gastric emptying studies predict morbidity in diabetics with symptoms of gastroparesis. Gastroenterology. 2009;137:445–52. doi: 10.1053/j.gastro.2009.04.055. [DOI] [PubMed] [Google Scholar]
- 12.American Diabetes A. Standards of medical care in diabetes--2012. Diabetes Care. 2012;35 (Suppl 1):S11–63. doi: 10.2337/dc12-s011. [DOI] [PMC free article] [PubMed] [Google Scholar]
- 13.Holzapfel A, Festa A, Stacher-Janotta G, Bergmann H, Shnawa N, Brannath W, Schernthaner G, Stacher G. Gastric emptying in Type II (non-insulin-dependent) diabetes mellitus before and after therapy readjustment: no influence of actual blood glucose concentration. Diabetologia. 1999;42:1410–2. doi: 10.1007/s001250051311. [DOI] [PubMed] [Google Scholar]
- 14.Jones KL, Russo A, Berry MK, Stevens JE, Wishart JM, Horowitz M. A longitudinal study of gastric emptying and upper gastrointestinal symptoms in patients with diabetes mellitus [see comment] American Journal of Medicine. 2002;113:449–55. doi: 10.1016/s0002-9343(02)01228-7. [DOI] [PubMed] [Google Scholar]
- 15.Chang J, Russo A, Bound M, Rayner CK, Jones KL, Horowitz M. A 25-year longitudinal evaluation of gastric emptying in diabetes. Diabetes Care. 2012;35:2594–6. doi: 10.2337/dc12-0028. [DOI] [PMC free article] [PubMed] [Google Scholar]
- 16.Dyck PJ, Davies JL, Wilson DM, Service FJ, Melton LJ, 3rd, O’Brien PC. Risk factors for severity of diabetic polyneuropathy: intensive longitudinal assessment of the Rochester Diabetic Neuropathy Study cohort. Diabetes Care. 1999;22:1479–86. doi: 10.2337/diacare.22.9.1479. [DOI] [PubMed] [Google Scholar]
- 17.Ciferri O. Spirulina, the edible microorganism. Microbiological Reviews. 1983;47:551–78. doi: 10.1128/mr.47.4.551-578.1983. [DOI] [PMC free article] [PubMed] [Google Scholar]
- 18.Ciferri O, Tiboni O. The biochemistry and industrial potential of Spirulina. Annual Review of Microbiology. 1985;39:503–26. doi: 10.1146/annurev.mi.39.100185.002443. [DOI] [PubMed] [Google Scholar]
- 19.Klein PD. Clinical applications of 13CO2 measurements. Federation Proceedings. 1982;41:2698–701. [PubMed] [Google Scholar]
- 20.Bharucha AE, Camilleri M, Veil E, Burton D, Zinsmeister AR. Comprehensive assessment of gastric emptying with a stable isotope breath test. Neurogastroenterology and Motility. 2013;25:e60–9. doi: 10.1111/nmo.12054. [DOI] [PMC free article] [PubMed] [Google Scholar]
- 21.Szarka LA, Camilleri M, Vella A, Burton D, Baxter K, Simonson J, Zinsmeister AR. A stable isotope breath test with a standard meal for abnormal gastric emptying solids in the clinic and in research. Clinical Gastroenterology & Hepatology. 2008;6:635–643. doi: 10.1016/j.cgh.2008.01.009. [DOI] [PMC free article] [PubMed] [Google Scholar]
- 22.Rentz AM, Kahrilas P, Stanghellini V, Tack J, Talley NJ, de la Loge C, Trudeau E, Dubois D, Revicki DA. Development and psychometric evaluation of the patient assessment of upper gastrointestinal symptom severity index (PAGI-SYM) in patients with upper gastrointestinal disorders. Quality of Life Research. 2004;13:1737–49. doi: 10.1007/s11136-004-9567-x. [DOI] [PubMed] [Google Scholar]
- 23.Low PA. Autonomic nervous system function. Journal of Clinical Neurophysiology. 1993;10:14–27. doi: 10.1097/00004691-199301000-00003. [DOI] [PubMed] [Google Scholar]
- 24.Low PA, Denq JC, Opfer-Gehrking TL, Dyck PJ, O’Brien PC, Slezak JM. Effect of age and gender on sudomotor and cardiovagal function and blood pressure response to tilt in normal subjects. Muscle & Nerve. 1997;20:1561–8. doi: 10.1002/(sici)1097-4598(199712)20:12<1561::aid-mus11>3.0.co;2-3. [DOI] [PubMed] [Google Scholar]
- 25.Low PA. Composite autonomic scoring scale for laboratory quantification of generalized autonomic failure. Mayo Clinic Proceedings. 1993;68:748–52. doi: 10.1016/s0025-6196(12)60631-4. [DOI] [PubMed] [Google Scholar]
- 26.Vella A, Lee JS, Camilleri M, Szarka LA, Burton DD, Zinsmeister AR, Rizza RA, Klein PD. Effects of pramlintide, an amylin analogue, on gastric emptying in type 1 and 2 diabetes mellitus. Neurogastroenterology & Motility. 2002;14:123–31. doi: 10.1046/j.1365-2982.2002.00311.x. [DOI] [PubMed] [Google Scholar]
- 27.Meier JJ, Gallwitz B, Salmen S, Goetze O, Holst JJ, Schmidt WE, Nauck MA. Normalization of glucose concentrations and deceleration of gastric emptying after solid meals during intravenous glucagon-like peptide 1 in patients with type 2 diabetes. Journal of Clinical Endocrinology & Metabolism. 2003;88:2719–25. doi: 10.1210/jc.2003-030049. [DOI] [PubMed] [Google Scholar]
- 28.Russo A, Stevens JE, Chen R, Gentilcore D, Burnet R, Horowitz M, Jones KL. Insulin-induced hypoglycemia accelerates gastric emptying of solids and liquids in long-standing type 1 diabetes. Journal of Clinical Endocrinology & Metabolism. 2005;90:4489–95. doi: 10.1210/jc.2005-0513. [DOI] [PubMed] [Google Scholar]
- 29.Horowitz M, Maddox AF, Wishart JM, Harding PE, Chatterton BE, Shearman DJ. Relationships between oesophageal transit and solid and liquid gastric emptying in diabetes mellitus. European Journal of Nuclear Medicine. 1991;18:229–34. doi: 10.1007/BF00186645. [DOI] [PubMed] [Google Scholar]
- 30.Phillips WT, Schwartz JG, McMahan CA. Rapid gastric emptying of an oral glucose solution in type 2 diabetic patients. Journal of Nuclear Medicine. 1992;33:1496–500. [PubMed] [Google Scholar]
- 31.Frank JW, Saslow SB, Camilleri M, Thomforde GM, Dinneen S, Rizza RA. Mechanism of accelerated gastric emptying of liquids and hyperglycemia in patients with type II diabetes mellitus. Gastroenterology. 1995;109:755–65. doi: 10.1016/0016-5085(95)90382-8. [DOI] [PubMed] [Google Scholar]
- 32.Kong MF, King P, Macdonald IA, Blackshaw PE, Horowitz M, Perkins AC, Armstrong E, Buchanan KD, Tattersall RB. Euglycaemic hyperinsulinaemia does not affect gastric emptying in type I and type II diabetes mellitus. Diabetologia. 1999;42:365–72. doi: 10.1007/s001250051164. [DOI] [PubMed] [Google Scholar]
- 33.Parkman HP, Yates K, Hasler WL, Nguyen L, Pasricha PJ, Snape WJ, Farrugia G, Koch KL, Calles J, Abell TL, McCallum RW, Lee L, Unalp-Arida A, Tonascia J, Hamilton F National Institute of D, Digestive, Kidney Diseases Gastroparesis Clinical Research C. Similarities and differences between diabetic and idiopathic gastroparesis. Clinical Gastroenterology & Hepatology. 2011;9:1056–64. doi: 10.1016/j.cgh.2011.08.013. quiz e133–4. [DOI] [PMC free article] [PubMed] [Google Scholar]
- 34.Choung RS, Locke GR, 3rd, Schleck CD, Zinsmeister AR, Melton LJ, 3rd, Talley NJ. Risk of gastroparesis in subjects with type 1 and 2 diabetes in the general population. American Journal of Gastroenterology. 2012;107:82–8. doi: 10.1038/ajg.2011.310. [DOI] [PMC free article] [PubMed] [Google Scholar]
- 35.Bharucha AE, Camilleri M, Forstrom L, Zinsmeister AR. Relationship between clinical features and gastric emptying disturbances in diabetes mellitus. Clinical Endocrinology. 2008;70:415–420. doi: 10.1111/j.1365-2265.2008.03351.x. [DOI] [PMC free article] [PubMed] [Google Scholar]
- 36.MacGregor IL, Gueller R, Watts HD, Meyer JH. The effect of acute hyperglycemia on gastric emptying in man. Gastroenterology. 1976;70:190–6. [PubMed] [Google Scholar]
- 37.Anitha M, Gondha C, Sutliff R, Parsadanian A, Mwangi S, Sitaraman SV, Srinivasan S. GDNF rescues hyperglycemia-induced diabetic enteric neuropathy through activation of the PI3K/Akt pathway [see comment] Journal of Clinical Investigation. 2006;116:344–56. doi: 10.1172/JCI26295. [DOI] [PMC free article] [PubMed] [Google Scholar]
- 38.Abell TL, Camilleri M, Donohoe K, Hasler WL, Lin HC, Maurer AH, McCallum RW, Nowak T, Nusynowitz ML, Parkman HP, Shreve P, Szarka LA, Snape WJ, Jr, Ziessman HA American Neurogastroenterology and Motility Society and the Society of Nuclear M. Consensus recommendations for gastric emptying scintigraphy: a joint report of the American Neurogastroenterology and Motility Society and the Society of Nuclear Medicine.[reprint in J Nucl Med Technol. 2008 Mar;36(1):44–54; PMID: 18287197] American Journal of Gastroenterology. 2008;103:753–63. doi: 10.2967/jnmt.107.048116. [DOI] [PubMed] [Google Scholar]
- 39.Samsom M, Akkermans LM, Jebbink RJ, van Isselt H, vanBerge-Henegouwen GP, Smout AJ. Gastrointestinal motor mechanisms in hyperglycaemia induced delayed gastric emptying in type I diabetes mellitus. Gut. 1997;40:641–6. doi: 10.1136/gut.40.5.641. [DOI] [PMC free article] [PubMed] [Google Scholar]
- 40.Hayashi Y, Toyomasu Y, Bardsley MR, Mason JE, Eisenman ST, Moo Choi K, Linden DR, Szurszewski JH, Rubin BP, Farrugia G, Ordog T. 163 Hyperglycemia-Induced Hyperplasia of Interstitial Cells of Cajal (ICC) and ICC Stem Cells (ICC-SC) Is Associated With Accelerated Gastric Emptying in Obese Diabetic LeprDb/Db Mice. Gastroenterology. 2013;144:S-38. [Google Scholar]
- 41.Choi KM, Zhu J, Stoltz GJ, Vernino S, Camilleri M, Szurszewski JH, Gibbons SJ, Farrugia G. Determination of Gastric Emptying in Non-Obese Diabetic Mice. American Journal of Physiology - Gastrointestinal & Liver Physiology. 2007;293:G1039–1045. doi: 10.1152/ajpgi.00317.2007. [DOI] [PubMed] [Google Scholar]
- 42.Choi KM, Gibbons SJ, Nguyen TV, Stoltz GJ, Lurken MS, Ordog T, Szurszewski JHGF. Heme Oxygenase-1 Protects Interstitial Cells of Cajal From Oxidative Stress and Reverses Diabetic Gastroparesis. Gastroenterology. 2008;135:2055–2064. doi: 10.1053/j.gastro.2008.09.003. [DOI] [PMC free article] [PubMed] [Google Scholar]
- 43.Khoo J, Rayner CK, Feinle-Bisset C, Jones KL, Horowitz M. Gastrointestinal hormonal dysfunction in gastroparesis and functional dyspepsia. Neurogastroenterology and Motility. 2010;22:1270–8. doi: 10.1111/j.1365-2982.2010.01609.x. [DOI] [PubMed] [Google Scholar]
- 44.Woerle HJ, Albrecht M, Linke R, Zschau S, Neumann C, Nicolaus M, Gerich JE, Goke B, Schirra J. Impaired hyperglycemia-induced delay in gastric emptying in patients with type 1 diabetes deficient for islet amyloid polypeptide. Diabetes Care. 2008;31:2325–31. doi: 10.2337/dc07-2446. [DOI] [PMC free article] [PubMed] [Google Scholar]
- 45.Frank JW, Camilleri M, Thomforde GM, Dinneen SF, Rizza RA. Effects of glucagon on postprandial carbohydrate metabolism in nondiabetic humans. Metabolism: Clinical and Experimental. 1998;47:7–12. doi: 10.1016/s0026-0495(98)90185-8. [DOI] [PubMed] [Google Scholar]
- 46.Nathan DM, Buse JB, Davidson MB, Ferrannini E, Holman RR, Sherwin R, Zinman B. Medical management of hyperglycemia in type 2 diabetes: a consensus algorithm for the initiation and adjustment of therapy: a consensus statement of the American Diabetes Association and the European Association for the Study of Diabetes. Diabetes Care. 2009;32:193–203. doi: 10.2337/dc08-9025. [DOI] [PMC free article] [PubMed] [Google Scholar]
- 47.Montori VM, Fernandez-Balsells M. Glycemic control in type 2 diabetes: time for an evidence-based about-face?.[Erratum appears in Ann Intern Med. 2009 Jul 21;151(2):144] Annals of Internal Medicine. 2009;150:803–8. doi: 10.7326/0003-4819-150-11-200906020-00008. [DOI] [PubMed] [Google Scholar]
- 48.Egginton JS, Ridgeway JL, Shah ND, Balasubramaniam S, Emmanuel JR, Prokop LJ, Montori VM, Murad MH. Care management for Type 2 diabetes in the United States: a systematic review and meta-analysis. BMC Health Services Research. 2012;12:72. doi: 10.1186/1472-6963-12-72. [DOI] [PMC free article] [PubMed] [Google Scholar]
- 49.Pop-Busui R, Low PA, Waberski BH, Martin CL, Albers JW, Feldman EL, Sommer C, Cleary PA, Lachin JM, Herman WH, Group DER. Effects of prior intensive insulin therapy on cardiac autonomic nervous system function in type 1 diabetes mellitus: the Diabetes Control and Complications Trial/Epidemiology of Diabetes Interventions and Complications study (DCCT/EDIC) Circulation. 2009;119:2886–93. doi: 10.1161/CIRCULATIONAHA.108.837369. [DOI] [PMC free article] [PubMed] [Google Scholar]
- 50.Laway BA, Malik TS, Khan SH, Rather TA. Prevalence of abnormal gastric emptying in asymptomatic women with newly detected diabetes and its reversibility after glycemic control-a prospective case control study. Journal of Diabetes and Its Complications. 2013;27:78–81. doi: 10.1016/j.jdiacomp.2012.08.001. [DOI] [PubMed] [Google Scholar]
Associated Data
This section collects any data citations, data availability statements, or supplementary materials included in this article.