

Abstract
While World Health Organization (WHO) grading of meningioma stratifies patients according to recurrence risk overall, there is substantial within‐grade heterogeneity with respect to recurrence‐free survival (RFS). Most meningiomas are graded according to mitotic counts per unit area on hematoxylin and eosin sections, a method potentially confounded by tumor cellularity, as well as potential limitations of accurate mitotic figure detection on routine histology. To refine mitotic figure assessment, we evaluated 363 meningiomas with phospho‐histone H3 (Ser10) and determined the mitotic index (number of mitoses per 1000 tumor cells). The median mitotic indices among WHO grade I (n = 268), grade II (n = 84) and grade III (n = 11) tumors were 1, 4 and 12. Classification and regression tree analysis to categorize cut‐offs identified three subgroups defined by mitotic indices of 0–2, 3–4 and ≥5, which on univariate analysis were associated with RFS (P < 0.01). In multivariate analysis, mitotic index subgrouped in this manner was significantly associated with RFS (P < 0.01) after adjustment for Simpson grade, WHO grade and MIB‐1 index. Mitotic index was then examined within individual WHO grade, showing that for grade I and grade II meningiomas, mitotic index can add additional information to RFS risk. The results suggest that the use of a robust mitotic marker in meningioma could refine risk stratification.
Keywords: meningioma, mitotic index, pHH3, recurrence‐free survival
Introduction
Meningiomas represent more than one‐third of all primary central nervous system (CNS) tumors 26 and according to the latest World Health Organization (WHO) brain tumor classification system are graded as WHO grades I, II and III to help estimate clinical aggressiveness and risk of recurrence 21. The WHO grading criteria are in large part based on mitotic counts per 10 high power fields (HPFs) but there is substantial within‐grade variation of recurrence risk, as a substantial proportion of patients with grade I tumors experience recurrence, and a proportion of patients with grade II tumors do not. For example, grade I meningiomas have 5‐year recurrence rates of up to approximately 20% 4, 8, 28 and atypical meningiomas have 5‐year recurrence rates of up to approximately 40% 3, 8, 12, 28, 30. In addition, while the current WHO histological grading criteria for meningioma account for the HPF size used (0.16 mm2), the tumor cellular density frequently shows heterogeneity among tumors, a confounding factor in the determination of the proliferation potential of individual tumors. The use of the Ki‐67/MIB‐1 labeling index provides a potential means to circumvent this problem, but experience as well as the literature indicates inter‐laboratory variability in staining reproducibility and labeling index assessment 31, 48.
A major issue in the management of meningioma is predicting which patients are likely to experience a recurrence and therefore who would likely benefit from adjuvant radiation or warrant closer clinical follow‐up. To date, the WHO grade and the extent of resection (Simpson grade—reviewed in Appendix S1) are the strongest predictors of recurrence 13, 23, 40. However, even using these established parameters, prediction of which patients are likely to recur is imperfect 21. As patients with a higher likelihood of recurrence are often considered for adjuvant radiation vs. serial monitoring 25, there is a need for additional biomarkers to better predict recurrence risk for individual patients.
Histone H3 phosphorylated (pHH3) at serine 10 is a sensitive marker for mitotic figure detection 14 and allows the determination of a more objective mitotic index (number of mitotic figures per 1000 tumor cells) that could add prognostic information to better predict recurrence‐free survival (RFS) in meningioma. A potential advantage of the use of mitotic markers (such as pHH3) as a measure of proliferation compared with MIB‐1 is that the assessment is based on both the identification of positive staining as well as the morphologic confirmation of chromatin condensation 15, 35, with the potential for reduced inter‐laboratory technical variation related to immunohistochemistry set‐up and staining conditions. To address these considerations, we compared mitotic index with established clinical parameters to assess its potential role in recurrence risk for meningioma.
Materials and Methods
Tumor samples and data collection
The study protocol was approved and carried out in accordance with the Institutional Review Board (IRB) guidelines. Formalin‐fixed paraffin embedded (FFPE) tissues on 363 meningiomas, WHO grades I (n = 268), II (n = 84) and III (n = 11) were retrospectively identified and collected from the files of our institutions. The cases were not consecutive and span a period of 18 years, every year being represented by a number of 1 to 48 cases (median = 18.5, average = 20.16 cases). The hematoxylin and eosin (H&E) slides were reviewed for all cases. Tumors were re‐graded according to the 2007 WHO criteria when the resection specimen was collected before 2007 (n = 159). Meningiomas graded based on morphological features or brain invasion only were not included in the dataset. Special morphological subtypes of meningiomas or meningiomas with brain invasion were included only if mitotic activity equivalated the WHO grade [eg, a chordoid meningioma (grade II) was included only if it also had ≥4 and <20 mitoses per 10 HPFs]. The meningiomas with brain invasion and grade I histology on H&E (n = 9) were analyzed separately and were not included in the statistical analysis. For patients having multiple meningiomas with multiple resections, only one meningioma specimen was used, randomly chosen, based on tissue availability.
Recurrence was defined as either tumor recurrence following gross total resection or tumor growth (progression) following subtotal resection and was established by serial imaging review. Magnetic resonance imaging (MRI) was the primary means of imaging follow‐up used. Computerized tomography (CT) was performed if MRI was contraindicated. Progression/recurrence assessments were made after the post‐surgical changes were clearly resolved, as confirmed by the radiology report and by the treating physician. Ambiguous cases without sufficient follow‐up imaging studies were counted as non‐progressions (eg, if it was not clear if the imaging findings were due to post‐surgical changes vs. true tumor growth and the patient was lost to follow‐up, the case was counted as a non‐progression). Recurrence was defined on imaging as either grossly noticeable tumor after gross total resection or as grossly noticeable increase in tumor size following a stable period of no growth (progression). In addition, the determination of recurrence was made in the context of the written medical record, which included the radiological interpretation and subsequent treatment plan suggested by the treating physician.
The following data were collected: age (at initial diagnosis), gender, location, date of initial surgery, Simpson grade (of the initial resection specimen if multiple surgical resections were documented), WHO grade, recurrence status and the date of tumor recurrence or date of last follow‐up. Simpson grade was determined primarily based on the surgical operative report correlated with the first post‐operative imaging study. In 29 cases, Simpson grade was either not available or not applicable (ie, for non‐dura‐based meningiomas). The time to recurrence was calculated and defined the RFS, with details provided in Appendix S2A. Nine cases in which brain invasion was observed (and were therefore not graded according to mitotic activity criteria) were not included in the cohort of 363 tumors but are summarized in Appendix S2B.
Immunohistochemistry
Immunohistochemistry with anti‐pHH3 (Ser 10) rabbit polyclonal antibody (Cat. No. 9701L, dilution 1:100, Cell Signaling Technology, Danvers, MA, USA) and anti‐Ki‐67 mouse monoclonal antibody (clone MIB‐1, dilution 1:500, DAKO, Carpinteria, CA, USA) was manually performed. The largest representative tumor tissue section available was selected for immunohistochemistry. Five‐micrometer‐thick FFPE tissue sections were obtained. Briefly, tissue sections were deparaffinized and hydrated in graded ethanol concentrations. Antigen retrieval was performed using citrate pH 6 solution followed by endogenous peroxidase blocking using phosphate‐buffered saline (PBS), 30% hydrogen peroxide and Tween 20 (0.1%). Tissue sections were incubated with primary antibody solution overnight at 4°C, followed by washes and incubation with horseradish peroxidase (HRP)‐conjugated secondary antibody (DAKO) and detection of antibody complex by adding DAB (3,3′‐diaminobenzidine) chromogen (DAKO). Counterstaining was performed with hematoxylin. Diffuse glioma and normal tonsil tissue served as positive controls. Buffer without primary antibody was used for negative controls.
On a subset of cases, immunohistochemistry with anti‐Ki‐67 monoclonal mouse antibody (clone MIB‐1, dilution 1:100, DAKO) and pHH3 polyclonal rabbit antibody (Cat. No. 06‐570, dilution 1:400, EMD Millipore, Billerica, MA, USA) was also performed on an automatic Leica Bond immunostainer (Leica, Buffalo Grove, IL, USA). All controls were appropriate.
The immunohistochemical stains were independently scored manually by two neuropathologists (AO, KDA). For discrepancies, a consensus was reached. The highest area of proliferation was identified and the pHH3 and MIB‐1 indices were calculated as the number of mitotic figures or strongly positive nuclei after counting 1000 tumor cells. Mitotic index was determined from the pHH3‐stained sections by counting the number of mitoses per 1000 tumor cells. In addition, a subset of the pHH3 cases was also calculated in parallel by image analysis. Systematic discrepancies between manual pHH3 counting and automatic counting could not be observed. The tumor cell counts for mitotic index were obtained by determining the number of pHH3‐positive mitotic figures after counting 1000 tumor cells in an area.
Cases with wide discrepancies between the WHO grade and pHH3 index or between MIB‐1 and pHH3 indices were re‐reviewed and the results were confirmed. Discrepancy was defined as either incompatibility between WHO grade and mitotic index detected with the anti‐pHH3 antibody (eg, atypical meningioma with zero mitoses on pHH3 immunostaining) or incompatibility between MIB‐1 and pHH3 indices (eg, low pHH3 and extremely high MIB‐1 and vice versa). This occurred in a small proportion (2–4%) of samples for MIB‐1 (6/363 samples) and pHH3 indices (14/363 samples). These samples were identified, re‐reviewed, re‐scored and agreed upon.
Data‐mining and statistical analysis
The classification and regression tree (CART) data‐mining algorithm is a data‐driven method of analysis that identifies the best criteria that maximize separation of the data. The end result is a tree decision structure that provides a classification model 6. The CART algorithm was used to classify variables of importance for meningioma recurrence and identify pHH3 cut‐off values of potential prognostic significance (SPM Salford Predictive Modeler® software suite, version 7.0, Salford Systems, San Diego, CA, USA). Survival analyses were performed using Kaplan–Meier and Cox proportional hazards methods (Statistica, v. 11, StatSoft®, Inc., Tulsa, OK, USA). Spearman correlation coefficient was also computed with Statistica v. 11. Maximal information coefficient (MIC) and Pearson correlation coefficient were computed in R (v. 3.0.3) 33 using MINE algorithm (http://www.exploredata.net/) 34. The MIB‐1 vs. pHH3 plot was generated in Excel for Mac v. 2011.
Results
To assess mitotic index as a potential prognostic tool in meningioma, cases were included to evaluate measures of proliferation as relevant to grading. Most meningiomas are graded according to the mitotic activity observed over 10 HPFs. A minority of meningiomas are graded according to histologic subclass (eg, clear cell and chordoid meningiomas are classified as grade II regardless of proliferation) as well as a variety of morphologic features (eg, brain invasion, of which nine cases were identified), and cases that received a grade II or grade III diagnosis based on features other than tumor cell proliferation were excluded from the study. The mitotic index was defined by pHH3‐positive mitoses per 1000 cells in the highest mitotically active area and an example of pHH3 immunohistochemical stain in meningioma is illustrated in Figure 1. The age of the patients ranged from 6 to 86 years. Six patients were under the age of 18. The majority, 261 (72%) were women and 102 (28%) were men. Two hundred sixty‐eight (74%) meningiomas were grade I, whereas 84 (23%) were grade II and 11 (3%) were grade III. Details on meningioma location are presented in Table 1. Skull base tumors represented the largest proportion [n = 166 (46%)].
Figure 1.
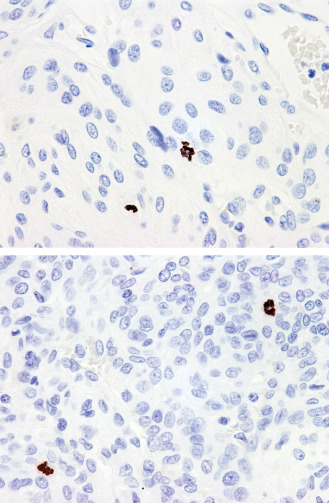
Histone H3 phosphorylated (pHH3), 400×: The differences in cellularity can be striking among different tumors or among intratumoral regions introducing subjectivity to interpretation. The pHH3 index (mitotic figures per 1000 cells) can be used as an objective tool for assessing mitotic activity. This value will also be independent of the size of the microscope field used.
Table 1.
Meningioma location
| Location categories | # (%) |
|---|---|
| Skull basea | 166 (46) |
| Cerebral convexityb | 78 (21) |
| Parasagittalc | 40 (11) |
| Falxd | 31 (9) |
| Tentoriume | 21 (6) |
| Spinal cord | 15 (4) |
| Cerebellar convexity | 3 (1) |
| Non‐dura | 9 (2) |
| Intraventricular | 5 |
| Intraosseous | 2 |
| Sub‐pial | 1 |
| Pineal | 1 |
All skull base tumors were included (anterior, middle and posterior).
Included tumors with primary convexity dura attachment with or without secondary extension to the falx, excluding tumors invading the superior sagittal sinus (SSS).
Included only parasagittal tumors with SSS invasion.
Included tumors with primary falcine attachment with or without secondary tentorial extension, excluding tumors with SSS invasion.
Included only tumors with primary tentorial attachment.
As expected, WHO grade was associated with patient outcome (Table 2 and Figure 2). The median RFS for grade I meningiomas was 650 weeks, grade II tumors 361 weeks and grade 3 tumors 126 weeks (P < 0.01). The extent of surgical resection (Simpson grade) was also correlated with outcome (Table 2). Mitotic index (defined as the number of mitoses identified in 1000 tumors cells in the highest mitotically active area of the tumor) was associated with WHO grade, although there was considerable within‐grade variation (Table 3). In addition, mitotic index showed a modest linear correlation with MIB‐1 index (Pearson's r = 0.639, MIC‐ρ2 = −0.092, Spearman's rank correlation ρ = 0.558, P‐value < 0.01) (Figure 3) (see Appendix S3 for details on MIC). On univariate analysis, mitotic index was significantly associated with RFS (P < 0.01) along with patient age, MIB‐1 index, WHO grade and Simpson grade (Table 4). Location and gender were not predictive of RFS.
Table 2.
Overview of cases and the associated median RFS.Abbreviations: RFS = recurrence‐free survival; WHO = World Health Organization
| WHO grade (363) | # (%) | Median RFS (range) (weeks) |
|---|---|---|
| I | 268 (74) | 650 (9–919) |
| II | 84 (23) | 361 (6–818) |
| III | 11 (3) | 126 (12–431) |
| Simpson grade (334) | # (%) | Median RFS (range) (weeks) |
| 1 | 128 (38) | Not reached |
| 2 | 88 (26) | Not reached |
| 3 | 66 (20) | 436 (26–438) |
| 4 | 102 (31) | 348 (6–818) |
Figure 2.
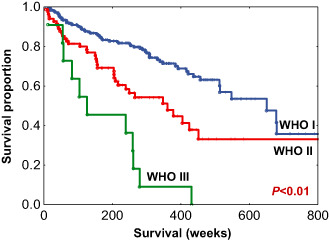
Recurrence‐free survival (RFS) among all World Health Organization (WHO) grade meningiomas.
Table 3.
The median mitotic index among all WHO meningioma grades.Abbreviations: WHO = World Health Organization
| WHO grade | Median mitotic index (range) |
|---|---|
| I | 1 (0–8) |
| II | 4 (1–27) |
| III | 12 (5–95) |
Figure 3.
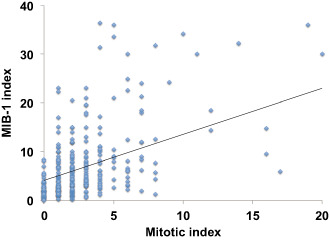
Mitotic index vs. MIB‐1 index. There is a modest linear correlation with MIB‐1 index (Pearson's r = 0.639, MIC‐ρ2 = −0.092, Spearman's rank correlation ρ = 0.558, P‐value < 0.01).
Table 4.
Univariate analysis—each variable was computed separately.Abbreviations: CI = confidence interval; WHO = World Health Organization
| Variable | P‐value | Hazard ratio | 95% CI |
|---|---|---|---|
| Age | <0.01 | 0.98 | 0.97–0.99 |
| WHO grade | <0.01 | 2.37 | 1.78–3.14 |
| MIB‐1 index | <0.01 | 1.03 | 1.02–1.04 |
| Mitotic index | <0.01 | 1.03 | 1.02–1.05 |
| Simpson grade | <0.01 | 1.67 | 1.42–1.97 |
To select discrete cut‐offs for risk categorization based on mitotic index, CART analysis was performed using recurrence status (known recurrence vs. no recurrence) as the outcome variable, which resulted in 2 cut‐offs/3 groups based on mitotic indices 0–2, 3–4 and ≥5 (for details on CART see Appendix S3) (Figure 4). In univariate analysis, mitotic index subgroups were significantly predictive of RFS [P < 0.01; hazard ratio (HR) = 1.96, 95% confidence interval (CI) = 1.57–2.43]. Kaplan–Meier analysis of RFS using the CART‐defined mitotic index subgroups is shown in Figure 5. The distribution of cases within each mitotic index subgroup along with the associated median RFS is presented in Table 5. The median RFS in the three pHH3‐defined groups were 681, 425 and 218 weeks.
Figure 4.
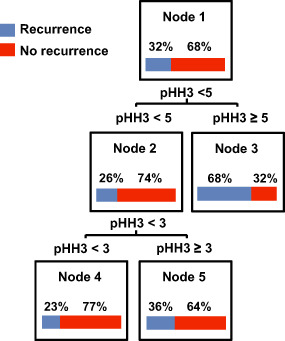
Classification and regression tree (CART) analysis identified histone H3 phosphorylated (pHH3) cut‐offs of potential significance in meningioma recurrence.
Figure 5.
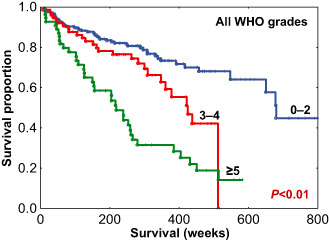
Recurrence‐free survival (RFS) among all World Health Organization (WHO) grade meningiomas stratified by mitotic index subgroups.
Table 5.
Selected mitotic index subgroups and associated median recurrence‐free survival (RFS)
| Mitotic index subgroups | # (%) | Median RFS (range) (weeks) |
|---|---|---|
| 0–2 | 231 (64) | 681 (9–919) |
| 3–4 | 76 (21) | 425 (6–512) |
| ≥5 | 56 (15) | 218 (9–583) |
To assess whether mitotic index was independent of known and clinically relevant variables, multivariate analysis was performed, showing mitotic index was significantly associated with RFS (P < 0.01) after adjusting for patient age, MIB‐1 index, WHO grade and Simpson grade (Table 6). Simpson grade remained an independent predictor, WHO grade was near significant and MIB‐1 index lost significance in this multivariate model. Mitotic index remained an independent predictor when it was computed as a continuous variable (Appendix S4), and also remained independent when the MIB‐1 labeling index was condensed into three subgroups (details in Appendix S5).
Table 6.
Multivariate analysis including mitotic index subgroups (0–2, 3–4, ≥5 mitoses).Abbreviations: CI = confidence interval; WHO = World Health Organization
| Variable | P‐value | Hazard ratio | 95% CI |
|---|---|---|---|
| Age | 0.255 | 0.99 | 0.97–1.00 |
| WHO grade | 0.087 | 1.55 | 0.93–2.59 |
| MIB‐1 index | 0.401 | 0.98 | 0.95–1.01 |
| Mitotic index subgroups | <0.01 | 1.81 | 1.28–2.57 |
| Simpson grade | <0.01 | 1.74 | 1.47–2.07 |
We performed additional analyses of mitotic index to characterize its relation to RFS as a function of tumor grade, extent of resection and anatomic site. For a within‐grade analysis, among the 268 grade I meningiomas, mitotic index was also examined for RFS. As most grade I tumors have a low mitotic index, the 3–4 and ≥5 groups were condensed into a ≥3 subgroup and compared to tumors with mitotic index of 0–2. This resulted in a significant difference in RFS (P = 0.013), with medians of 438 and 678 weeks, respectively (Figure 6A). When patients with grade II meningiomas were analyzed, the lower two mitotic index subgroups were condensed to a 0–4 group and compared with grade II tumors with a ≥5 mitotic index, again showing a significant difference in RFS with medians of 424 and 204 weeks, respectively (P < 0.01) (Figure 6B). The number of cases for grade III tumors (n = 11) was insufficient for a within‐grade analysis. To examine the relationships of mitotic index stratified by extent of resection, cases were separated based on gross total resection (Simpson grades 1–3, n = 232), vs. those which were subtotally resected (Simpson grade 4, n = 102). Mitotic index was found to be significantly correlated with RFS both within meningiomas with gross total resection (Figure 7A) as well as within those with subtotal resection (Figure 7B). As a further analysis, as intracranial tumors are often clinically separated by anatomic site, we examined tumors groups as either localized to the skull base (n = 166) or outside the skull base (n = 197). The mitotic index was significantly correlated with RFS in tumors subgrouped by anatomic site (P < 0.01) (Figure 8A,B). Taken together, these additional analyses demonstrate potential value in the determination of the mitotic index in meningioma as a clinically relevant parameter in addition to WHO grade, extent of resection and anatomic site.
Figure 6.
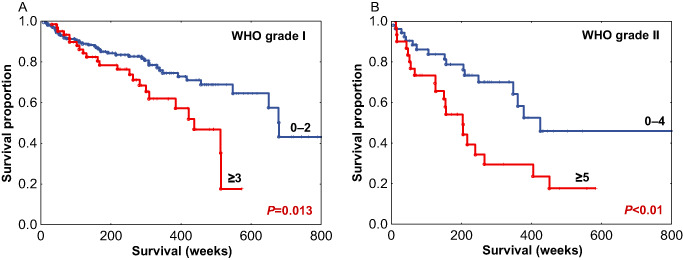
Recurrence‐free survival (RFS) among World Health Organization (WHO) grade I meningiomas (A) and WHO grade II meningiomas (B) stratified by mitotic index subgroups.
Figure 7.
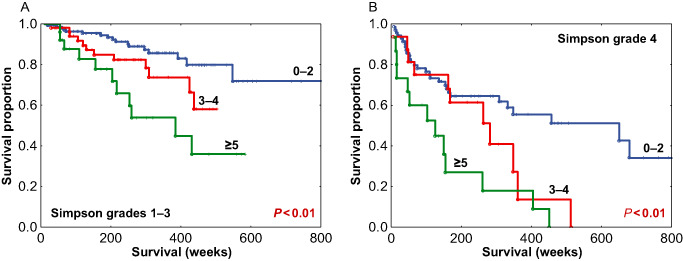
Recurrence‐free survival (RFS) among meningiomas with gross total resection (Simpson grades 1–3) (A) and meningiomas with subtotal resection (Simpson grade 4) (B) stratified by mitotic index subgroups.
Figure 8.
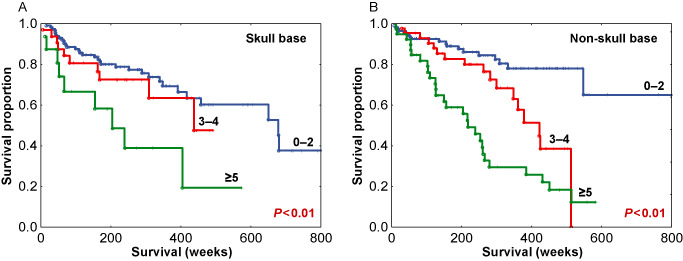
Recurrence‐free survival (RFS) among skull base meningiomas (A) and non‐skull base meningiomas (B) stratified by mitotic index subgroups.
The nine meningiomas with brain invasion and grade I histology (not included in the primary analysis) were predominantly present in females (F : M = 8:1). All received a grade II diagnosis at presentation based on brain invasion only (ie, not based on mitotic activity). Following pHH3 immunostaining, four of these cases had mitotic indices ranging between 2 and 4 mitoses per 1000 cells and the remainder showed less than 2 mitoses per 1000 cells. A recurrence could be documented in two cases (Appendix S2B).
Discussion
Meningioma affects predominantly the cranial meninges and represents the most common primary CNS tumor. The grading criteria for meningioma are mainly based on mitotic figures per 10 HPF, the suggested HPF size being 0.16 mm2. Additional criteria predictive of RFS have been defined, such as brain invasion, a combination of morphological features (eg, hypercellularity, small cell change, necrosis, macronucleoli, patternless growth), and several morphological tumor subtypes (eg, clear cell, chordoid, rhabdoid and papillary) 21. Most cases are in the grade I–II category, with very rare instances of grade III (anaplastic meningioma) 21. Accordingly, the major clinical problem in the management of meningioma is to accurately identify the high recurrence risk tumors and find ways to prevent recurrence. Accordingly, RFS is a key measure of patient outcomes in meningioma. Despite well‐defined histopathologic criteria for grading, there is large within‐grade variation in RFS among patients with intracranial meningioma 3, 4, 8, 12, 28, 30. Identification of criteria to identify tumors with a high likelihood of recurrence is essential in the management of meningioma and therapy decision making. Patients whose tumors have a high likelihood of recurrence warrant the option of adjuvant radiation and/or increased clinical follow‐up with the potential for re‐resection 25. Conversely, sparing of adjuvant therapy is warranted for patients with low recurrence risk. Accordingly, it is important to identify early and predict which patients will experience tumor recurrence for possibly early initiation of adjuvant therapy (radiation) or closer clinical follow‐up.
The anti‐pHH3 (Ser10) antibody is highly sensitive for mitotic figure detection, is commercially available and is amenable to use on FFPE tissues 14, 35, 37, 44. The use of pHH3 immunostain for mitotic figure detection offers the possibility of defining a more objective mitotic index, as compared to the current practice of counting mitoses per unit area. A second advantage of the pHH3 immunostain could be to resolve morphologically ambiguous structures where it may be difficult to distinguish a mitosis from, for example, an apoptotic body. A mitotic index, defined by pHH3‐positive mitoses per 1000 cells in the highest mitotically active area, may provide a more accurate determination of the proliferative potential of tumor cells, as compared to a method that relies on a per‐area assessment, given the high variability in cellularity among meningiomas (Figure 1). In addition, the ease of mitotic figure detection following pHH3 immunohistochemistry offers the possibility for reduced inter‐observer variation of WHO grade assignment, especially for borderline cases.
Histone H3 phosphorylation is a specific step during mitosis 38, 39. Chromatin condensation starts during the S‐phase and reaches its maximum during mitosis 2. The phosphorylation of the histone H3 initiates in late G2 interphase cells in the pericentromeric heterochromatin and then spreads progressively throughout the condensing chromatin during mitosis 14. From a practical standpoint, when using anti‐pHH3 antibodies, often finely speckled or intensely stained nuclei are noted. These represent small foci of H3 phosphorylation of individual chromosomes spreading throughout the genome, before an overt mitotic stage is started 14. Because mitotic figures by definition imply chromatin condensation (Figure 1), positively stained nuclei in the absence of chromatin condensation typical of mitoses should not be accounted for when scoring the pHH3 mitotic index. In addition, the anti‐pHH3 (Ser10) antibody accurately differentiates between true mitoses and apoptotic bodies, as histone phosphorylation is not associated with apoptosis 15, 35. Similarly, this highly sensitive antibody can also help in interpreting crushed nuclear artifacts that frequently create difficulties on H&E. Phospho‐HH3 has been investigated in other tumors and, taken together, there appears to be a consensus that the antibody is very sensitive and allows for rapid mitotic figure detection 7, 10, 11, 17, 37, 41, 44, 45, 46, 47, 49 with improved inter‐observer agreement 37, 41. The use of a mitotic marker such as the anti‐pHH3 antibody can reduce the mitotic figure detection time by 50% 45, a significant advantage when handling cases in a busy clinical service.
Sun et al investigated the differences in immunostaining between anti‐pHH3 (Ser10) and anti‐pHH3 (Ser28) (directed toward a different histone H3 phosphorylation site) in melanoma and ovarian cancer specimens and concluded that anti‐pHH3 (Ser10) is more sensitive than anti‐pHH3 (Ser28), picking up a significantly greater number of mitoses 44, suggesting that only a subset of histones H3 phosphorylated at Ser10 is also phosphorylated at Ser28 during mitosis. No other studies have performed this comparison to the best of our knowledge and the anti‐pHH3 (Ser28) has not been investigated in meningioma. Further studies in this area may be warranted to evaluate mitotic figure detection in a clinical setting. Several studies have accurately investigated the usefulness of the pHH3 (Ser10) antibody in meningioma grading and confirmed its sensitivity for mitotic figure detection; however, we note that in such studies, the mitotic figure count was performed per 10 HPFs 9, 20, 35. While directly related to the current WHO guidelines, we believe that use of an index, rather than a per‐unit area count, offers theoretical advantages to compare proliferative potential from case to case as the denominator (number of tumor cells counted) remains constant. We chose the highest mitotically active area and the mitotic index was calculated as the number of mitotic figures per 1000 tumor cells. On both univariate and multivariate analyses, mitotic index was predictive of RFS (Table 4, Appendix S4).
Based on mitotic index, CART analysis (Figure 4) defined three subgroups of tumors: those with 0–2, 3–4 and ≥5 mitotic figures in a RFS model. Using these cut‐offs, univariate (P < 0.01; HR = 1.96, 95% CI = 1.57–2.43), multivariate (Table 6) and Kaplan–Meier survival analyses (Figures 5, 6, 7, 8) were performed. On proportional hazards multivariate analysis, mitotic index subgroups and Simpson grade were predictive of RFS, providing a confirmation of the importance of mitotic index as correlated with RFS in meningioma.
As stated earlier, there is great within‐grade variation of recurrence risk in meningioma and this was evident in our study cohort. As such, mitotic index segregated risk groups overall (Figure 5), but more importantly segregated within‐grade risk groups: within grade I meningiomas (P = 0.013) (Figure 6A) and within grade II meningiomas (P < 0.01) (Figure 6B). The mitotic index was also predictive of recurrence within meningiomas stratified by the extent of resection (Figure 7A,B) and tumor location (Figure 8A,B). These results indicate that the pHH3 mitotic index may add relevant data for patient risk stratification in meningioma and potentially improve meningioma management decision making regarding closer follow‐up vs. adjuvant radiation.
MIB‐1 index is currently used in clinical practice, although it is widely acknowledged that its values should be carefully interpreted. MIB‐1 values span and overlap among WHO grades and a wide range of cut‐offs predictive of recurrence have been reported among different studies 1, 5, 16, 22, 24, 27, 29. A meta‐analysis of MIB‐1 index in meningioma from 53 studies in the literature highlights great variation in labeling index cut‐offs recommended to predict recurrence risk, ranging from 1% to 10% 1. In our dataset, we identified MIB‐1 subgroups predictive of RFS (Appendix S5). Correlation analysis pointed a modest linear relationship between mitotic index and MIB‐1 index (Pearson's r = 0.639, MIC‐ρ2 = −0.092, Spearman's rank correlation ρ = 0.558, P‐value < 0.01) (Figure 3, Appendix S3 for details on MIC) 32, 34, 42. On univariate analysis, MIB‐1 index was predictive of RFS (Table 4). However, when multivariate analysis was performed, MIB‐1 index lost significance after adjustment for Simpson grade and mitotic index, the latter as either a continuous variable (Appendix S4) or as the grouped variable defined by the CART analysis (Table 6). Our data, therefore, confirm the literature findings on MIB‐1 and suggest that the use of the mitotic index may be warranted, even in the setting where MIB‐1 index is routinely performed, to help better predict RFS in meningioma.
Age was predictive of RFS only on univariate analysis (Table 4) but not on multivariate analysis (Table 6, Appendix S4). The role of age in meningioma progression is uncertain. Some studies have reported a worse prognosis for younger age 4, 8, 36, 43, whereas others have not found a prognostic value for age at all 18, 19.
Potential pitfalls of the study include its retrospective nature, as well as the requirement that additional validation and testing be performed to optimize clinically useful mitotic cut‐offs. In addition, our sample of WHO grade III tumors was limited, consistent with its rarity (n = 11). Overall, our findings require testing in independent cohorts for validation. Finally, it is important to note that our study did not address cases in which grade is assigned independent of mitotic counts, but based on histologic appearance (eg, clear cell, chordoid and papillary meningiomas), and therefore our findings are not intended to apply to those categories of tumors.
An additional consideration is that mitotic index, using pHH3 immunohistochemistry, results in clear ascertainment bias, in favor of increased detection of mitotic figures relative to H&E stains. It is our experience from clinical practice (AO, KDA and GNF) and substantiated by published observations 35 that pHH3 staining invariably results in increased detection of mitotic activity compared with the H&E routine stain. This was also demonstrated in the current study on the small cohort of brain invasive meningiomas with grade I histology. For this reason, current WHO guidelines for mitotic activity are likely not appropriate for pHH3‐stained sections. In parallel with this observation, we believe that the use of a mitotic index (and therefore a constant denominator), rather than a mitotic count per unit area, controls for tumor cellularity, which can vary widely in meningioma. This practice is in line with the current use of MIB‐1/Ki‐67, which is typically reported as an index or percent, rather than a count per unit microscopic field. A strength of our study is that we analyze mitotic index on a large number of grade I and grade II meningiomas (n = 352) with complete clinical data, including imaging, resection status (Simpson grade) and, importantly, adequate follow‐up data. As with every immunohistochemical test, independent validation and inter‐laboratory comparisons for technical adequacy will be required to determine the eventual use of this modality as a potential prognostic marker for meningioma.
Conclusions
The mitotic index, measured by pHH3 immunohistochemistry, is a predictor of recurrence in meningioma independent of grade and MIB‐1 index. Moreover, our data show that within the WHO grade I and grade II meningiomas, more aggressive tumors are nested. These tumors can be easily identified using the anti‐pHH3 (Ser10) antibody, and scoring a pHH3 index defined as the number of mitotic figures per 1000 cells. In our experience, the pHH3 (Ser10) antibody is reliable both on automated and on manual techniques. Its role in clinical practice should be considered, especially in WHO grade II tumors, to stratify recurrence risk and potentially to guide decisions regarding adjuvant therapy.
Supporting information
Appendix S1. Simpson grade definitions as originally described.
Appendix S2. (A) Data (on main 363 cases). (B) Data on additional 9 cases with brain invasion.
Appendix S3. MINE statistics and CART analysis.
Appendix S4. Multivariate analysis.
Appendix S5. Data on MIB‐1.
Acknowledgments
The authors thank Alicia Ledoux and Bhavana Singh for their expert technical assistance. Partial results of this study have been presented at the United States and Canadian Academy of Pathology Annual Meeting, February–March, 2014, San Diego, CA, USA. Funding was provided by the National Institutes of Health/National Cancer Institute (SPORE Grant No. P50CA127001). Dr. Adriana Olar was supported by the National Institutes of Health/National Cancer Institute (Training Grant No. 5T32CA163185).
Conflict of Interest
The authors declare they have no conflict of interest.
References
- 1. Abry E, Thomassen IO, Salvesen OO, Torp SH (2010) The significance of Ki‐67/MIB‐1 labeling index in human meningiomas: a literature study. Pathol Res Pract 206:810–815. [DOI] [PubMed] [Google Scholar]
- 2. Adlakha RC, Rao PN (1986) Molecular mechanisms of the chromosome condensation and decondensation cycle in mammalian cells. Bioessays 5:100–105. [DOI] [PubMed] [Google Scholar]
- 3. Aghi MK, Carter BS, Cosgrove GR, Ojemann RG, Amin‐Hanjani S, Martuza RL et al (2009) Long‐term recurrence rates of atypical meningiomas after gross total resection with or without postoperative adjuvant radiation. Neurosurgery 64:56–60. [DOI] [PubMed] [Google Scholar]
- 4. van Alkemade H, de Leau M, Dieleman EM, Kardaun JW, van Os R, Vandertop WP et al (2012) Impaired survival and long‐term neurological problems in benign meningioma. Neuro‐Oncol 14:658–666. [DOI] [PMC free article] [PubMed] [Google Scholar]
- 5. Amatya VJ, Takeshima Y, Sugiyama K, Kurisu K, Nishisaka T, Fukuhara T, Inai K (2001) Immunohistochemical study of Ki‐67 (MIB‐1), p53 protein, p21WAF1, and p27KIP1 expression in benign, atypical, and anaplastic meningiomas. Hum Pathol 32:970–975. [DOI] [PubMed] [Google Scholar]
- 6. Breiman L, Friedman J, Olshen RA, Stone JC (1983) Classification and Regression Trees, 1st edn. Chapman and Hall/CRC: Boca Raton, FL. [Google Scholar]
- 7. Casper DJ, Ross KI, Messina JL, Sondak VK, Bodden CN, McCardle TW, Glass LF (2010) Use of anti‐phosphohistone H3 immunohistochemistry to determine mitotic rate in thin melanoma. Am J Dermatopathol 32:650–654. [DOI] [PubMed] [Google Scholar]
- 8. Domingues PH, Sousa P, Otero A, Goncalves JM, Ruiz L, de Oliveira C et al (2014) Proposal for a new risk stratification classification for meningioma based on patient age, WHO tumor grade, size, localization, and karyotype. Neuro‐Oncol 16:735–747. [DOI] [PMC free article] [PubMed] [Google Scholar]
- 9. Fukushima S, Terasaki M, Sakata K, Miyagi N, Kato S, Sugita Y, Shigemori M (2009) Sensitivity and usefulness of anti‐phosphohistone‐H3 antibody immunostaining for counting mitotic figures in meningioma cases. Brain Tumor Pathol 26:51–57. [DOI] [PubMed] [Google Scholar]
- 10. Glatz K, Hartmann C, Antic M, Kutzner H (2010) Frequent mitotic activity in banal melanocytic nevi uncovered by immunohistochemical analysis. Am J Dermatopathol 32:643–649. [DOI] [PubMed] [Google Scholar]
- 11. Habberstad AH, Gulati S, Torp SH (2011) Evaluation of the proliferation markers Ki‐67/MIB‐1, mitosin, survivin, pHH3, and DNA topoisomerase IIalpha in human anaplastic astrocytomas—an immunohistochemical study. Diagn Pathol 6:43. [DOI] [PMC free article] [PubMed] [Google Scholar]
- 12. Hardesty DA, Wolf AB, Brachman DG, McBride HL, Youssef E, Nakaji P et al (2013) The impact of adjuvant stereotactic radiosurgery on atypical meningioma recurrence following aggressive microsurgical resection. J Neurosurg 119:475–481. [DOI] [PubMed] [Google Scholar]
- 13. Heald JB, Carroll TA, Mair RJ (2014) Simpson grade: an opportunity to reassess the need for complete resection of meningiomas. Acta Neurochir (Wien) 156:383–388. [DOI] [PubMed] [Google Scholar]
- 14. Hendzel MJ, Wei Y, Mancini MA, Van Hooser A, Ranalli T, Brinkley BR et al (1997) Mitosis‐specific phosphorylation of histone H3 initiates primarily within pericentromeric heterochromatin during G2 and spreads in an ordered fashion coincident with mitotic chromosome condensation. Chromosoma 106:348–360. [DOI] [PubMed] [Google Scholar]
- 15. Hendzel MJ, Nishioka WK, Raymond Y, Allis CD, Bazett‐Jones DP, Th'ng JP (1998) Chromatin condensation is not associated with apoptosis. J Biol Chem 273:24470–24478. [DOI] [PubMed] [Google Scholar]
- 16. Ho DM, Hsu CY, Ting LT, Chiang H (2002) Histopathology and MIB‐1 labeling index predicted recurrence of meningiomas: a proposal of diagnostic criteria for patients with atypical meningioma. Cancer 94:1538–1547. [DOI] [PubMed] [Google Scholar]
- 17. Idriss MH, Kazlouskaya V, Malhotra S, Andres C, Elston DM (2013) Phosphohistone‐H3 and Ki‐67 immunostaining in cutaneous pilar leiomyoma and leiomyosarcoma (atypical intradermal smooth muscle neoplasm). J Cutan Pathol 40:557–563. [DOI] [PubMed] [Google Scholar]
- 18. Ildan F, Erman T, Gocer AI, Tuna M, Bagdatoglu H, Cetinalp E, Burgut R (2007) Predicting the probability of meningioma recurrence in the preoperative and early postoperative period: a multivariate analysis in the midterm follow‐up. Skull Base 17:157–171. [DOI] [PMC free article] [PubMed] [Google Scholar]
- 19. Kasuya H, Kubo O, Tanaka M, Amano K, Kato K, Hori T (2006) Clinical and radiological features related to the growth potential of meningioma. Neurosurg Rev 29:293–296, discussion 6–7. [DOI] [PMC free article] [PubMed] [Google Scholar]
- 20. Kim YJ, Ketter R, Steudel WI, Feiden W (2007) Prognostic significance of the mitotic index using the mitosis marker anti‐phosphohistone H3 in meningiomas. Am J Clin Pathol 128:118–125. [DOI] [PubMed] [Google Scholar]
- 21. Louis DN, Ohgaki H, Wiestler OD, Cavenee WK (2007) WHO Classification of Tumors of the Central Nervous System, 4th edn. IARC: Lyon, France. [Google Scholar]
- 22. Matsuno A, Fujimaki T, Sasaki T, Nagashima T, Ide T, Asai A et al (1996) Clinical and histopathological analysis of proliferative potentials of recurrent and non‐recurrent meningiomas. Acta Neuropathol 91:504–510. [DOI] [PubMed] [Google Scholar]
- 23. Moon HS, Jung S, Jang WY, Jung TY, Moon KS, Kim IY (2012) Intracranial meningiomas, WHO grade II: prognostic implications of clinicopathologic features. J Korean Neurosurg Soc 52:14–20. [DOI] [PMC free article] [PubMed] [Google Scholar]
- 24. Nakasu S, Li DH, Okabe H, Nakajima M, Matsuda M (2001) Significance of MIB‐1 staining indices in meningiomas: comparison of two counting methods. Am J Surg Pathol 25:472–478. [DOI] [PubMed] [Google Scholar]
- 25. NCCN (2014) Clinical Practice Guidelines in Oncology. Central Nervous System Cancers. Version 2.
- 26. Ostrom QT, Gittleman H, Farah P, Ondracek A, Chen Y, Wolinsky Y et al (2013) CBTRUS statistical report: primary brain and central nervous system tumors diagnosed in the United States in 2006–2010. Neuro‐Oncol 15(Suppl. 2):ii1–ii56. [DOI] [PMC free article] [PubMed] [Google Scholar]
- 27. Oya S, Kawai K, Nakatomi H, Saito N (2012) Significance of Simpson grading system in modern meningioma surgery: integration of the grade with MIB‐1 labeling index as a key to predict the recurrence of WHO grade I meningiomas. J Neurosurg 117:121–128. [DOI] [PubMed] [Google Scholar]
- 28. Perry A, Stafford SL, Scheithauer BW, Suman VJ, Lohse CM (1997) Meningioma grading: an analysis of histologic parameters. Am J Surg Pathol 21:1455–1465. [DOI] [PubMed] [Google Scholar]
- 29. Perry A, Stafford SL, Scheithauer BW, Suman VJ, Lohse CM (1998) The prognostic significance of MIB‐1, p53, and DNA flow cytometry in completely resected primary meningiomas. Cancer 82:2262–2269. [PubMed] [Google Scholar]
- 30. Perry A, Scheithauer BW, Stafford SL, Lohse CM, Wollan PC (1999) “Malignancy” in meningiomas: a clinicopathologic study of 116 patients, with grading implications. Cancer 85:2046–2056. [DOI] [PubMed] [Google Scholar]
- 31. Polley MY, Leung SC, McShane LM, Gao D, Hugh JC, Mastropasqua MG et al (2013) An international Ki67 reproducibility study. J Natl Cancer Inst 105:1897–1906. [DOI] [PMC free article] [PubMed] [Google Scholar]
- 32. Posnett D, Devanbu PT, Filkov V (2012) MIC check: a correlation tactic for ESE data . IEEE. 22–31.
- 33. R Core Team (2014) R: A Language and Environment for Statistical Computing. R Foundation for Statistical Computing: Vienna, Austria. Available at: http://www.R‐project.org/ (accessed March, 2014). [Google Scholar]
- 34. Reshef DN, Reshef YA, Finucane HK, Grossman SR, McVean G, Turnbaugh PJ et al (2011) Detecting novel associations in large data sets. Science 334:1518–1524. [DOI] [PMC free article] [PubMed] [Google Scholar]
- 35. Ribalta T, McCutcheon IE, Aldape KD, Bruner JM, Fuller GN (2004) The mitosis‐specific antibody anti‐phosphohistone‐H3 (PHH3) facilitates rapid reliable grading of meningiomas according to WHO 2000 criteria. Am J Surg Pathol 28:1532–1536. [DOI] [PubMed] [Google Scholar]
- 36. Ruiz J, Martinez A, Hernandez S, Zimman H, Ferrer M, Fernandez C et al (2010) Clinicopathological variables, immunophenotype, chromosome 1p36 loss and tumour recurrence of 247 meningiomas grade I and II. Histol Histopathol 25:341–349. [DOI] [PubMed] [Google Scholar]
- 37. Schimming TT, Grabellus F, Roner M, Pechlivanis S, Sucker A, Bielefeld N et al (2012) pHH3 immunostaining improves interobserver agreement of mitotic index in thin melanomas. Am J Dermatopathol 34:266–269. [DOI] [PubMed] [Google Scholar]
- 38. Shibata K, Ajiro K (1993) Cell cycle‐dependent suppressive effect of histone H1 on mitosis‐specific H3 phosphorylation. J Biol Chem 268:18431–18434. [PubMed] [Google Scholar]
- 39. Shibata K, Inagaki M, Ajiro K (1990) Mitosis‐specific histone H3 phosphorylation in vitro in nucleosome structures. Eur J Biochem 192:87–93. [DOI] [PubMed] [Google Scholar]
- 40. Simpson D (1957) The recurrence of intracranial meningiomas after surgical treatment. J Neurol Neurosurg Psychiatry 20:22–39. [DOI] [PMC free article] [PubMed] [Google Scholar]
- 41. Solomides CC, Birbe RC, Nicolaou N, Bagley D, Bibbo M (2012) Does mitosis‐specific marker phosphohistone H3 help the grading of upper tract urothelial carcinomas in cell blocks? Acta Cytol 56:285–288. [DOI] [PubMed] [Google Scholar]
- 42. Speed T (2011) Mathematics. A correlation for the 21st century. Science 334:1502–1503. [DOI] [PubMed] [Google Scholar]
- 43. Stafford SL, Perry A, Suman VJ, Meyer FB, Scheithauer BW, Lohse CM, Shaw EG (1998) Primarily resected meningiomas: outcome and prognostic factors in 581 Mayo Clinic patients, 1978 through 1988. Mayo Clin Proc 73:936–942. [DOI] [PubMed] [Google Scholar]
- 44. Sun A, Zhou W, Lunceford J, Strack P, Dauffenbach LM, Kerfoot CA (2012) Level of phosphohistone H3 among various types of human cancers. BMJ Open 2:1–6. [DOI] [PMC free article] [PubMed] [Google Scholar]
- 45. Tapia C, Kutzner H, Mentzel T, Savic S, Baumhoer D, Glatz K (2006) Two mitosis‐specific antibodies, MPM‐2 and phospho‐histone H3 (Ser28), allow rapid and precise determination of mitotic activity. Am J Surg Pathol 30:83–89. [DOI] [PubMed] [Google Scholar]
- 46. Tetzlaff MT, Curry JL, Ivan D, Wang WL, Torres‐Cabala CA, Bassett RL et al (2013) Immunodetection of phosphohistone H3 as a surrogate of mitotic figure count and clinical outcome in cutaneous melanoma. Mod Pathol 26:1153–1160. [DOI] [PubMed] [Google Scholar]
- 47. Tsuta K, Liu DC, Kalhor N, Wistuba II, Moran CA (2011) Using the mitosis‐specific marker anti‐phosphohistone H3 to assess mitosis in pulmonary neuroendocrine carcinomas. Am J Clin Pathol 136:252–259. [DOI] [PubMed] [Google Scholar]
- 48. Varga Z, Diebold J, Dommann‐Scherrer C, Frick H, Kaup D, Noske A et al (2012) How reliable is Ki‐67 immunohistochemistry in grade 2 breast carcinomas? A QA study of the Swiss Working Group of Breast‐ and Gynecopathologists. PLoS ONE 7:e37379. [DOI] [PMC free article] [PubMed] [Google Scholar]
- 49. Veras E, Malpica A, Deavers MT, Silva EG (2009) Mitosis‐specific marker phospho‐histone H3 in the assessment of mitotic index in uterine smooth muscle tumors: a pilot study. Int J Gynecol Pathol 28:316–321. [DOI] [PubMed] [Google Scholar]
Associated Data
This section collects any data citations, data availability statements, or supplementary materials included in this article.
Supplementary Materials
Appendix S1. Simpson grade definitions as originally described.
Appendix S2. (A) Data (on main 363 cases). (B) Data on additional 9 cases with brain invasion.
Appendix S3. MINE statistics and CART analysis.
Appendix S4. Multivariate analysis.
Appendix S5. Data on MIB‐1.