

Abstract
The insulin receptor (IR) regulates nutrient uptake and utilization in multiple organs, but its role in the intestinal epithelium is not defined. This study developed a mouse model with villin-Cre (VC) recombinase-mediated intestinal epithelial cell (IEC)-specific IR deletion (VC-IRΔ/Δ) and littermate controls with floxed, but intact, IR (IRfl/fl) to define in vivo roles of IEC-IR in mice fed chow or high-fat diet (HFD). We hypothesized that loss of IEC-IR would alter intestinal growth, biomarkers of intestinal epithelial stem cells (IESC) or other lineages, body weight, adiposity, and glucose or lipid handling. In lean, chow-fed mice, IEC-IR deletion did not affect body or fat mass, plasma glucose, or IEC proliferation. In chow-fed VC-IRΔ/Δ mice, mRNA levels of the Paneth cell marker lysozyme (Lyz) were decreased, but markers of other differentiated lineages were unchanged. During HFD-induced obesity, IRfl/fl and VC-IRΔ/Δ mice exhibited similar increases in body and fat mass, plasma insulin, mRNAs encoding several lipid-handling proteins, a decrease in Paneth cell number, and impaired glucose tolerance. In IRfl/fl mice, HFD-induced obesity increased circulating cholesterol; numbers of chromogranin A (CHGA)-positive enteroendocrine cells (EEC); and mRNAs encoding Chga, glucose-dependent insulinotrophic peptide (Gip), glucagon (Gcg), Lyz, IESC biomarkers, and the enterocyte cholesterol transporter Scarb1. All these effects were attenuated or lost in VC-IRΔ/Δ mice. These results demonstrate that IEC-IR is not required for normal growth of the intestinal epithelium in lean adult mice. However, our findings provide novel evidence that, during HFD-induced obesity, IEC-IR contributes to increases in EEC, plasma cholesterol, and increased expression of Scarb1 or IESC-, EEC-, and Paneth cell-derived mRNAs.
Keywords: small intestine, obesity, hyperinsulinemia, lysozyme, glucose-dependent insulinotrophic peptide, glucagon, cholesterol
the insulin receptor (IR) mediates insulin action on glucose and lipid metabolism in a number of organs, including the liver, skeletal muscle, and adipose tissue. The IR is a heterotetrameric receptor tyrosine kinase that shares significant structural homology with insulin-like growth factor (IGF) 1 receptor (IGF1R) (11). The IR exists as two isoforms produced by alternative splicing. IR isoform A (IR-A) binds both insulin and IGFs and is implicated in growth during fetal development and in cancer (11, 36, 55). IR isoform B (IR-B) is considered the metabolic IR and is highly expressed in differentiated tissues and those sensitive to the metabolic actions of insulin (4, 6, 14, 33, 66, 72). IR-A, IR-B, and IGF1R and their ligands, insulin, IGF1, and IGF2, comprise the insulin-IGF system, which controls metabolism and growth in numerous tissues (37). The IR and IGF1R display the highest affinity for insulin and IGFs, respectively, but also exhibit ligand cross-reactivity (11, 37). High levels of insulin can bind and activate IGF1R. IGF1 and IGF2 can also bind and activate IR, although IR-A binds IGFs, particularly IGF2, with higher affinity than IR-B. In vitro evidence suggests that, in some situations, signaling through the remaining receptor can compensate for loss of the IR or IGF1R (19, 20, 23, 27, 78).
The role of the IR has been most thoroughly characterized in the liver, adipose tissue, and skeletal muscle, even though the IR is expressed in most, if not all, other tissues (37). The development of tissue-specific IR knockout mice has enabled studies of the role of the IR in individual tissues, including skeletal muscle, liver, white and brown adipose tissue, the central nervous system, and the myeloid lineage (17, 21, 22, 42, 52, 60). Recent work from our group demonstrates that the IR is expressed in the intestinal epithelium, but its role in growth or function of this highly proliferative tissue is not defined (4). A number of studies in hamsters (1, 34, 43), rats (84), desert gerbils (88), and humans (32, 48, 83) link hyperinsulinemia, insulin resistance, and/or type 2 diabetes mellitus with biomarkers of intestinal insulin resistance and increased intestinal chylomicron production or aberrant lipid handling by enterocytes (2). All of these studies were performed in situations of whole body insulin resistance. The functional roles of the IR in the intestinal epithelium, specifically its potential contributions to normal growth or renewal of the epithelium and/or to the growth or metabolic responses to high-fat diet (HFD)-induced obesity and insulin resistance, are not defined.
The intestinal epithelium is a single layer of cells lining the luminal surface of the intestine that is responsible for nutrient digestion, absorption, and barrier functions. This tissue is also the most proliferative in the body; it renews itself every 3–10 days from a small population of intestinal epithelial stem cells (IESC) located at the crypt base (9, 24, 39, 86, 87). Actively cycling IESC are marked by mRNA expression of leucine-rich repeat-containing G protein-coupled receptor 5 (Lgr5), achaete-scute complex homolog 2 (Ascl2), and olfactomedin 4 (Olfm4) and low levels of sex-determining region Y-box 9 (Sox9). Other studies support the existence of a more quiescent, activatable IESC population identified by expression of Bmi1 polycomb ring finger oncogene (Bmi1), HOP homeobox (Hopx), leucine-rich repeats and immunoglobulin-like domains 1 (Lrig1), and high levels of Sox9 (9, 35, 41, 63, 70, 75, 80, 82). The IESC self-renew and generate rapidly proliferating, transit-amplifying progenitor cells (9, 74, 79). As the progenitor cells migrate out of the crypts, they undergo cell cycle arrest and differentiate into postmitotic specialized cells, including enterocytes, enteroendocrine cells (EEC), goblet cells, and Paneth cells (9, 16, 24, 74, 79). Terminally differentiated, absorptive enterocytes are marked by expression of the brush border enzyme sucrase isomaltase (Sis), goblet cells by mucin-2 (Muc2), EEC by chromogranin A (Chga), and Paneth cells by lysozyme (Lyz). Enterocytes also express a number of receptors responsible for mediating nutrient absorption (44, 49, 51); EEC secrete hormones involved in metabolic regulation, including the incretins glucose-dependent insulinotrophic peptide (GIP) and glucagon-like peptide (GLP) 1 (GLP1) (62); and Paneth cells produce a variety of antimicrobial peptides, including the defensins (7).
IGF1 is known to play a prominent role in regulating intestinal epithelial renewal, adaptation, and recovery from injury (18, 29–31, 65, 82). However, the role of insulin in intestinal epithelial growth is not well defined. One study in rats demonstrated that insulin increased proliferation in colonic epithelium (77), while another study demonstrated that oral insulin increased cell proliferation in vitro and in a rat model of short bowel syndrome (12, 13). In humans, elevated levels of circulating insulin have been linked to decreased apoptosis in the normal colonic mucosa and an increased risk of colorectal adenoma (50, 71).
IR-A, IR-B, and IGF1R are each expressed within the intestinal epithelium (4, 65). We recently demonstrated that IR-A expression predominates in IESC and proliferative progenitor cells of the crypt, while IR-B expression is enriched in differentiated intestinal epithelial cells (IEC) (4). In Caco-2 cells, increases in IR-B accompanied differentiation and forced IR-B expression accelerated increases in differentiation markers (4). Other studies provide evidence that IGF1R is enriched in IESC (57) and that IGF1R is required for GLP2-mediated increases in intestinal growth (65). Recent work in cancer cell lines and other cancer models suggests that, in a tumor environment, the IR, particularly IR-A, may mediate proliferation and compensate for loss or inhibition of signaling through IGF1R (4, 23, 78). The specific roles of IGF1R or the two IR isoforms in mediating proliferation, differentiation, or metabolic functions of insulin in the normal intestinal epithelium, in vivo or during obesity and hyperinsulinemia induced by long-term HFD, are not well defined.
In the present study we generated mice with specific disruption of the IR gene in all IEC. We cross-bred mice with loxP-modified IR alleles (IRfl/fl) and mice expressing villin-Cre (VC) recombinase to generate VC-IRΔ/Δ mice with IEC-IR gene disruption. The VC transgene is expressed in all small intestinal IEC in both crypts and villi (56). We hypothesized that loss of IEC-IR would 1) alter intestinal epithelial growth via loss of IR-A or, potentially, by favoring signaling through the remaining IGF1R, 2) affect numbers or biomarkers of differentiated IEC lineages due to loss of IR-B, and 3) alter the effect of HFD-induced obesity and hyperinsulinemia on intestinal growth, differentiated lineages, or nutrient handling. We first examined the effects of IEC-IR loss on basal intestinal epithelial structure. We then performed a HFD challenge, which induces obesity, hyperinsulinemia, and elevated plasma IGF1 in wild-type mice (3, 28, 38, 64, 67, 85). By comparing IRfl/fl mice with intact IR and VC-IRΔ/Δ mice with IEC-IR deletion fed chow or HFD, we aimed to assess whether loss of IEC-IR affects metabolic responses to HFD or HFD-induced changes in intestinal epithelial growth or gene expression. Our findings indicate that loss of IEC-IR does not affect normal intestinal morphology, measures of intestinal epithelial growth, or glucose tolerance in lean, chow-fed animals. After HFD consumption that leads to obesity and hyperinsulinemia, loss of IEC-IR has little impact on intestinal morphology or measures of intestinal epithelial growth. In mice with HFD-induced obesity and hyperinsulinemia, loss of IEC-IR attenuated HFD-associated increases in plasma cholesterol, mRNAs encoding the cholesterol transporter Scarb1, and biomarkers of IESC. Loss of IEC-IR also attenuated HFD-associated increases in numbers of CHGA-positive EEC, Chga mRNA, and mRNAs encoding GIP (Gip) and glucagon (Gcg), as well as Lyz and Def1a mRNAs, produced in Paneth cells.
MATERIALS AND METHODS
IRfl/fl and VC-IRΔ/Δ mice.
Mice were maintained in a specific-pathogen-free facility at the University of North Carolina at Chapel Hill; food (PMI Prolab RMH 3000, LabDiet, St. Louis, MO) and water were provided ad libitum. The IRfl/fl mice were originally characterized and generously provided by C. Ronald Kahn (22). The VC mice were purchased from Jackson Laboratory (Bar Harbor, ME). To generate mice with IEC-specific IR disruption, IRfl/fl mice were cross-bred with VC-IR+/+ mice to generate mice heterozygous for the floxed IR allele (VC-IRΔ/+). These animals were bred with mice homozygous for the floxed IR allele (IRfl/fl) to generate mice with homozygous IR disruption (VC-IRΔ/Δ). Study animals were generated by crossing VC-IRΔ/Δ and IRfl/fl mice. Genotyping was performed as described elsewhere (22, 61). All data were collected from co-housed, sex-matched littermate pairs of ≥4-mo-old male or female mice. All animal studies were approved by the Institutional Animal Care and Use Committee at the University of North Carolina at Chapel Hill.
Diet studies.
Four-week-old IRfl/fl and VC-IRΔ/Δ sex-matched littermate pairs were fed a diet with 60% of kilocalories from fat (HFD; D12492, Research Diets, New Brunswick, NJ) for 22–26 wk. Control sex-matched littermate pairs were fed standard rodent chow, with 14% of kilocalories from fat (PMI Prolab RMH 3000). Body weight was monitored weekly.
Glucose tolerance tests.
After an overnight (∼16-h) fast, mice were given an oral gavage of glucose (1.5 g/kg body wt; Gibco, Grand Island, NY) in PBS. Glucose in blood taken from the tail was measured using a OneTouch Ultra glucometer (LifeScan, Milpitas, CA) prior to glucose administration and at 15, 30, 60, and 120 min after glucose gavage.
Body fat mass measurements and tissue collection.
Fat and lean body mass were measured by MRI (EchoMRI, Houston, TX). At 90 min prior to euthanasia, mice were given an intraperitoneal injection of 5-ethyl-2′-deoxyuridine (EdU, 100 μg/25 g body wt; Sigma) to mark cells in the S phase. Animals were euthanized with a lethal dose of pentobarbital sodium (Nembutal; 150 μg/g body wt). The small intestine was removed and flushed with ice-cold PBS (0.137 M NaCl, 3 mM KCl, 8 mM Na2HPO4, and 2 mM KH2PO4, pH 7.4). Mesentery and mesenteric fat were removed. Mass of gonadal fat pads and mesenteric fat surrounding the small intestine were measured. Mass and length of the small intestine were measured. Length was measured using a 3-g clip attached to the end of the tissue to avoid any impact of differences in peristalsis. The most-proximal quarter of the small intestine was designated the duodenum, the middle two quarters the jejunum, and the most-distal quarter the ileum (Fig. 1). The most-proximal 2 cm of each small intestinal segment were fixed as intact tubes overnight in 10% zinc-buffered formalin (Thermo Fisher Scientific, Pittsburgh, PA) at 4°C before paraffin embedding for histology and morphometric measures of growth. The next most-proximal segment from the duodenum, jejunum, and ileum was fixed overnight in fresh 4% paraformaldehyde in 1× PBS at 4°C (Fig. 1) for immunofluorescence. Paraformaldehyde-fixed segments were taken through a gradient of 10% and 30% sucrose sequentially overnight at 4°C and then cryoembedded in optimum cutting temperature medium. Embedded tissues were sectioned (∼5 μm), and sections were placed on positively charged microscope slides.
Fig. 1.
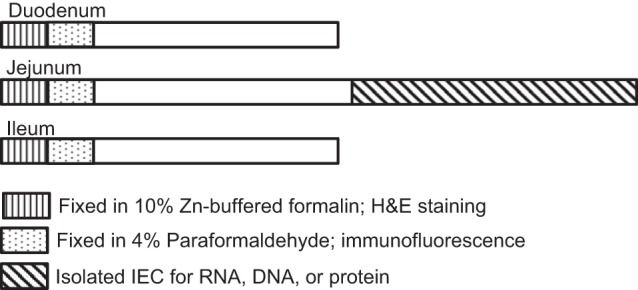
Schematic for intestinal tissue harvest and fixation. Small intestine was divided into 3 segments: duodenum, jejunum, and ileum. Designated regions were isolated and fixed or the epithelium was isolated for RNA, DNA, or protein assays. H&E, hematoxylin and eosin; IEC, intestinal epithelial cell(s).
Morphological measurements, submucosal circumference, and crypt and villus density.
All measurements were taken on paraffin-embedded, hematoxylin-eosin-stained cross sections. Tissue was visualized using Axio Imager.A2 (Zeiss, Thornwood, NY) and a ProgRes CF Scan camera (Jenoptik, Jena, Thuringia, Germany). Measurements were made with ProgRes Capture Pro 2.7 software. Crypt depth and villus height were measured in ≥15 well-oriented crypts and 10 well-oriented villi for each intestinal region and animal. For measurement of crypt density, the number of visible crypts within a jejunal cross section was counted and then divided by the submucosal circumference. For measurement of villus density, the number of villi attached to the surrounding epithelium within a cross section was counted and then divided by the submucosal circumference. All scoring was performed by an observer blinded to animal genotype and diet.
Immunofluorescent staining and quantification of EdU-, Lyz-, and CHGA-positive cells.
Cryopreserved sections were brought to room temperature and washed with 1× PBS to remove the optimal cutting temperature compound. Heat-induced epitope retrieval was performed in a decloaking chamber at 120°C for 30 s followed by 90°C for 10 s. Samples were then incubated with 10% normal goat serum in Tris (Thermo Fisher Scientific, Rockford, IL) for 30 min at room temperature. EdU staining was performed using the Click-iT EdU Alexa Fluor 594 kit according to the manufacturer's instructions (Invitrogen, Carlsbad, CA). For Lyz and CHGA staining, tissue sections were incubated in a primary antibody [rabbit α-lysozyme (1:400 dilution; Leica, Buffalo Grove, IL) or rabbit α-CHGA (1:400 dilution; Abcam, Cambridge, MA)] overnight at 4°C and then with the secondary antibody goat anti-rabbit Cy3 (1:500 dilution; Jackson ImmunoResearch, West Grove, PA). Slides were rinsed in 1× PBS and mounted with medium containing 4′,6-diamidino-2-phenylindole (DAPI; Fluoro-Gel II, Electron Microscopy Services, Hatfield, PA).
EdU-, Lyz-, or CHGA-positive cells were visualized and quantified in the jejunum using an IX83 fluorescence microscope (Olympus, Tokyo, Japan) and an ORCA-Flash4.0 C11440 camera (Hamamatsu, Hamamatsu City, Japan) with Cellsens (Olympus) accompanying software. Individual cells were identified and quantified using DAPI staining. Cells containing clear, nuclear EdU staining, cytoplasmic Lyz granules/staining, or cytoplasmic CHGA staining were considered positive; all others were considered negative. The position of EdU-positive cells in the crypt was recorded to assess if loss of IEC-IR preferentially altered proliferation of cells within the IESC or progenitor zones of the crypt. For the analyses, the two cells at the crypt base were designated cells at position 1. Each adjacent cell between position 1 and the mouth of the crypt was assigned a positional value. At least 15 well-oriented crypts were scored per animal by an observer blinded to animal genotype and diet.
ELISAs.
Blood was collected by cardiac puncture. Plasma was isolated by centrifugation (1,200 g, 10 min, 4°C), snap-frozen in liquid nitrogen, and stored at −80°C. Plasma insulin levels were assessed by ELISA (Mercodia, Uppsala, Sweden) following the manufacturer's instructions. Prior to IGF1 ELISA, IGF-binding proteins were removed from plasma samples by acid-ethanol extraction. Plasma samples were incubated for 30 min at room temperature in acid-ethanol (87.5% ethanol-12.5% 2 M HCl). Samples were centrifuged at 10,000 g for 13 min at 4°C, and supernatant was neutralized with 0.855 mM Tris base. Samples were incubated at −80°C for 30 min. After cryoprecipitation, the samples were spun down at 10,000 g for 15 min at 4°C. Unbound IGF1, present in the supernatant, was quantified using a mouse IGF1 ELISA kit (R & D Systems, Minneapolis, MN) according to the manufacturer's instructions.
Cholesterol assay.
Plasma cholesterol levels were assessed using the Cholesterol E assay kit (Wako Diagnostics, Mountain View, CA) according to the manufacturer's instructions.
IEC isolation.
IEC were isolated from the distal half of the jejunum (Fig. 1) as described elsewhere (82). Isolated cells were used for subsequent DNA, RNA, or protein isolation.
DNA isolation and PCR.
For extraction of DNA, isolated IEC were boiled at 95°C in 50 mM NaOH for 10 min and then neutralized with 1 M Tris·HCl, pH 6.8. Contents were pelleted by centrifugation (13,000 rpm, 6 min, room temperature). Supernatant was used for subsequent PCR. IEC-specific recombination of the IR allele was confirmed at the DNA level by PCR as described elsewhere (78).
Protein isolation and Western blotting.
IEC and liver samples were lysed in Laemmli lysis buffer (200 mM Tris, pH 6.8, 20% glycerol, 5% β-mercaptoethanol, 4% sodium dodecyl sulfate, and 0.03% bromophenol blue). Lysates were boiled, sonicated, and resolved on NuPAGE 4–12% Bis-Tris 1.5-mm gels (Invitrogen, Grand Island, NY) and transferred to a PVDF membrane (0.45-μm pore; Millipore, Billerica, MA). The membrane was blocked in Blocker Casein in PBS (Thermo Fisher Scientific, Pittsburgh, PA). Primary antibodies [mouse anti-α-tubulin monoclonal (1:500 dilution, Sigma) or rabbit anti-β-actin polyclonal (1:2,000 dilution; Sigma) as invariant controls; rabbit anti-IR-β polyclonal (1:500 dilution; sc-711, Santa Cruz Biotechnology, Santa Cruz, CA) or rabbit anti-IGF1R-β polyclonal (1:1,000 dilution; Cell Signaling, Beverly, MA)] were incubated overnight at 4°C.
RNA isolation and quantitative RT-PCR.
RNA was isolated from IEC using the RNeasy Mini Kit with on-column DNase digestion (Qiagen, Valencia, CA) after homogenization with Lysing Matrix D tubes (MP Biomedicals, Santa Ana, CA) containing RLT lysis buffer and 1% β-mercaptoethanol (Gibco) and Precellys24 (Bertin Technologies, Rockville, MD). cDNA synthesis was performed using 0.5 μg of RNA and the High Capacity cDNA Reverse Transcription kit, including RNase inhibitor (Applied Biosystems, Carlsbad, CA). Quantitative RT-PCR (qRT-PCR) was performed using Platinum Quantitative PCR 2× Supermix-UDG (Invitrogen, Grand Island, NY) and TaqMan primer/probe sets (Applied Biosystems). Reactions were run using the Applied Biosystems Step One Plus Real Time PCR system (Applied Biosystems). Gene expression values were calculated using a standard curve generated from a pool of samples, and expression values reflect an average of duplicates. All expression values were normalized to the invariant control gene β-actin (ActB). The primer/probe sets were as follows: ActB (Mm00607939_s1), apolipoprotein A-4 (Apoa4, Mm00431814_m1), apolipoprotein B-48 (Apob-48, Mm01545156_m1), Ascl2 (Mm01268891_g1), Bmi1 (Mm03053308_g1), Chga (Mm00514341_m1), Def1a (Mm 02524428_g1), Gcg (Mm01269055_m1), Gip (Mm00433601_m1), Hopx (Mm00558630_m1), Igf1r (Mm00802831_m1), Lgr5 (Mm00438890_m1), Lrig1 (Mm00456116_m1), Lyz (Mm00727183_s1), Muc2 (Mm00458299_m1), Olfm4 (Mm01320260_m1), peroxisome proliferator-activated receptor-γ (Pparγ, Mm01184322_m1), Scarb1 (Mm00450234_m1), Sis (Mm01210305_m1), Sox9 (Mm00448840_m1), and sterol regulatory element-binding transcription factor 1 (Srebf1, Mm00550338_m1).
Statistical analyses.
Values are means ± SE. Data were analyzed using a two-way ANOVA for main effect of diet, main effect of genotype, or significant diet × genotype interaction. Post hoc comparisons were conducted using Sidak's test, as appropriate. P < 0.05 was considered statistically significant. All analyses were performed using GraphPad Prism 6.
RESULTS
VC-mediated IR disruption is specific to the intestinal epithelium at the DNA and the protein level.
Mice homozygous for loxP sites (floxed) flanking exon 4 of the IR were crossed with animals carrying the transgene for Cre recombinase, located downstream of genomic regulatory elements for villin (VC; Fig. 2A). VC is expressed along the entire crypt-villus axis and throughout the entire length of the intestine and colon (56). Expression begins 14–15 days postcoitum (56). IEC were isolated from the small intestine of adult mice homozygous for the intact, but floxed, allele of the IR (IRfl/fl) and mice homozygous for the recombined allele of IR due to VC-mediated recombination (VC-IRΔ/Δ). DNA was isolated from the IEC, and PCR was performed using three primers that amplify the intact, but floxed, or the recombined allele (Fig. 2A). In animals with intact, but floxed, IR, these primers generate a 293-bp amplicon. In animals with recombined IR (lacking exon 4 and genomic DNA lying between the loxP sites), primers will amplify the remaining DNA between introns 3 and 4, yielding a 220-bp amplicon. As shown in Fig. 2B, recombination occurred only in the IEC from VC-IRΔ/Δ animals. Recombination did not occur in the IRfl/fl animals or in the underlying serosa in animals of either genotype (data not shown). Evaluation of IR protein by Western blotting on lysates of epithelial cells from the small intestine and colon, as well as the liver, confirmed that recombination resulted in undetectable IR only in the IEC from the small intestine and colon of VC-IRΔ/Δ mice (Fig. 2C). Loss of IR expression in small intestinal epithelial cells did not result in statistically significant increases in Igf1r mRNA (Fig. 2D) or protein (Fig. 2E).
Fig. 2.
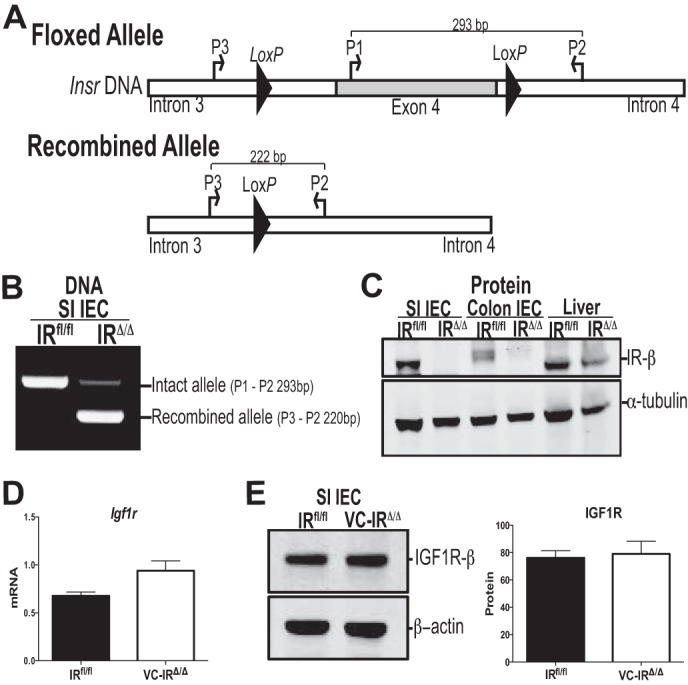
Villin-Cre (VC)-mediated insulin receptor (IR) disruption is specific to the epithelium at DNA and protein levels. A: IRfl/fl mice are homozygous for a floxed allele of the IR gene, where exon 4 is flanked by loxP sites, as originally described by Bruning et al. (22). Mice homozygous for the recombined allele (VC-IRΔ/Δ) were generated by crossing IRfl/fl animals to mice carrying VC recombinase (expressing Cre recombinase only in intestinal and colonic epithelial cells). Insr, insulin receptor gene. B: level of VC-mediated recombination in IR DNA in IEC from IRfl/fl and VC-IRΔ/Δ animals assessed by PCR using primers in introns 3 and 4 and exon 4. SI, small intestine. C: Western blot assessment of IR protein levels in small intestinal and colonic IEC and liver from IRfl/fl and VC-IRΔ/Δ mice. α-Tubulin was used as loading control. D: quantitative RT-PCR measurement of insulin-like growth factor 1 receptor (Igf1r) mRNA expression in small intestinal IEC from IRfl/fl and VC-IRΔ/Δ mice. E: Western blot assessment of IGF1R protein levels in small intestinal IEC from IRfl/fl and VC-IRΔ/Δ mice. mRNA and protein expression levels are normalized to β-actin invariant control. Values are means ± SE; n ≥ 3.
Loss of IEC-IR does not affect body weight or adiposity in chow- or HFD-fed animals.
We challenged the IRfl/fl and VC-IRΔ/Δ animals with a HFD (60% of kilocalories from fat) to assess if loss of intestinal epithelial IR influenced 1) metabolic effects of HFD, 2) impact of obesity/hyperinsulinemia on intestinal epithelial growth, or 3) IESC or differentiated IEC lineages. It is well established that 14–20 wk of HFD feeding in C57BL/6 mice or other rodent models leads to increased fat mass, obesity, and increases in circulating plasma insulin (15, 28, 57), IGF1 (38, 57, 67, 85), and cholesterol (15) levels.
After chow or HFD feeding, body weight and percent lean and fat mass were assessed by MRI. Both HFD-fed IRfl/fl and VC-IRΔ/Δ mice lost significant lean mass and gained significant fat mass relative to chow-fed controls and showed significant increases in mass of gonadal and mesenteric fat (P < 0.05, by 2-way ANOVA with Sidak's post hoc pair-wise comparisons for an effect of diet; Table 1). Body weight, fat and lean body mass, gonadal fat pad mass, and small intestinal mesenteric fat did not differ between IRfl/fl and VC-IRΔ/Δ mice (Table 1).
Table 1.
Intestinal epithelial IR disruption does not alter body mass or adiposity in mice fed chow or HFD
| Chow (n ≥ 6) |
HFD (n ≥ 11) |
|||
|---|---|---|---|---|
| IRfl/fl | VC-IRΔ/Δ | IRfl/fl | VC-IRΔ/Δ | |
| Body wt, g | 30.8 ± 1.5 | 30.7 ± 1.6 | 41.5 ± 2.4* | 42.3 ± 1.8* |
| Lean mass, % | 75 ± 2 | 75 ± 3 | 57 ± 3* | 56 ± 2* |
| Fat mass, % | 16 ± 2 | 17 ± 3 | 39 ± 4* | 40 ± 3* |
| Gonadal fat pad wt, g | 0.57 ± 0.1 | 0.65 ± 0.2 | 1.9 ± 0.4* | 2.0 ± 0.2* |
| SI mesenteric fat wt, g | 0.15 ± 0.02 | 0.19 ± 0.04 | 0.63 ± 0.12* | 0.58 ± 0.08* |
Values are means ± SE.
IR, insulin receptor; HFD, high-fat diet (60% of kilocalories from fat); SI, small intestine; VC, villin-Cre.
P < 0.05 (by 2-way ANOVA for main effect of diet).
VC-IRΔ/Δ and IRfl/fl mice show identical responses to oral glucose and impact of HFD on plasma insulin or IGF1 levels, but the HFD-induced increase in cholesterol is attenuated in VC-IRΔ/Δ mice.
Given known roles of IR in glucose uptake and metabolism in other tissues, we examined oral glucose tolerance in IRfl/fl and VC-IRΔ/Δ mice in the basal state and after HFD feeding. Glucose tolerance was assessed after ≥23 wk of HFD. HFD feeding significantly increased the area under the curve in both genotypes (P < 0.05, by 2-way ANOVA for main effect of diet), but we found no difference in glucose tolerance between genotypes (Fig. 3, A and B).
Fig. 3.
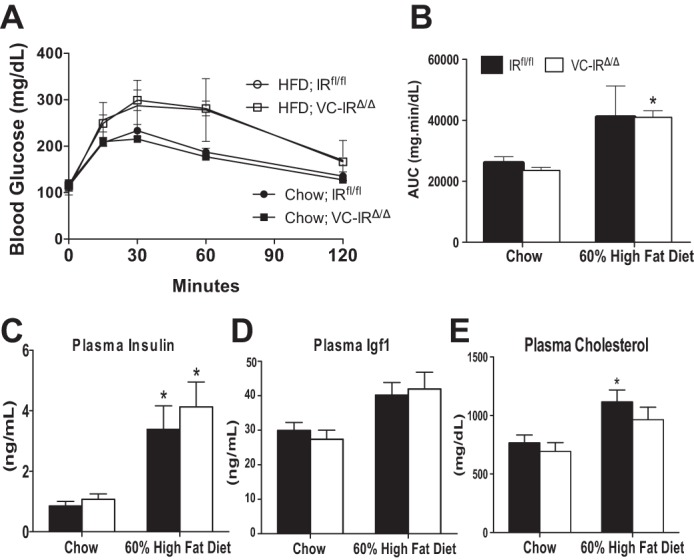
Loss of intestinal epithelial IR does not impact glucose tolerance, blood insulin, or insulin-like growth factor 1 (IGF1) levels after chow or high-fat diet (HFD) feeding but attenuates HFD-induced increases in circulating cholesterol. A and B: blood glucose levels following intestinal absorption and glucose secretion into the circulation (A) and concentration of blood glucose over time [area under the curve (AUC), B] in IRfl/fl and VC-IRΔ/Δ mice measured by oral glucose tolerance test. C–E: fed plasma insulin and IGF1 levels measured by ELISA (C and D) and plasma cholesterol levels assessed by colorimetric cholesterol assay (E) in IRfl/fl and VC-IRΔ/Δ mice fed chow or HFD (60% of kilocalories from fat). Values are means ± SE; n ≥ 5. *P ≤ 0.05, HFD vs. chow (by 2-way ANOVA with Sidak's post hoc pair-wise comparisons for main effect of diet).
After 22–26 wk on the HFD, both IRfl/fl and VC-IRΔ/Δ mice exhibited significant increases in plasma insulin levels compared with their chow-fed counterparts of the same genotype (Fig. 3C). Plasma IGF1 levels increased significantly following HFD feeding, independent of genotype (Fig. 4D; P < 0. 05, by 2-way ANOVA for main effect of diet). Circulating cholesterol levels increased significantly in the IRfl/fl, but not VC-IRΔ/Δ, mice after HFD feeding (Fig. 3E).
Fig. 4.
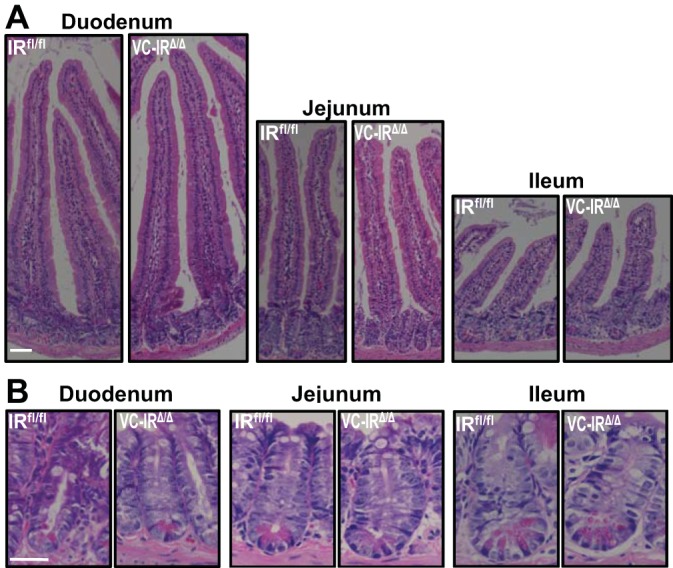
Intestinal epithelial-specific disruption of the IR does not alter crypt depth or villus height. Representative images of hemotoxylin-eosin-stained sections show crypt-villus (A) and crypt (B) from duodenum, jejunum, and ileum of chow-fed IRfl/fl and VC-IRΔ/Δ mice. Magnification ×20 (a) and ×40 (b); scale bars = 50 μm (A) and 20 μm (B).
Loss of IEC-IR does not dramatically alter small intestinal morphology in chow-fed animals.
Hematoxylin-eosin-stained sections of duodenum, jejunum, and ileum from chow-fed IRfl/fl and VC-IRΔ/Δ mice show no obvious differences in crypt or villus size or morphology (Fig. 4). Subsequent quantitative comparisons verified that there was no significant effect of IEC-IR loss in chow-fed mice.
Intestinal epithelial-specific IR disruption does not alter morphometric measures of intestinal growth or IEC proliferation in the basal state or with HFD feeding.
Table 2 summarizes data for measures of intestinal growth and morphometry in IRfl/fl and VC-IRΔ/Δ littermates fed chow or HFD. HFD feeding significantly decreased small intestine length and increased crypt depth in IRfl/fl and VC-IRΔ/Δ mice. There was no difference in intestinal length or mass, jejunal crypt depth, or villus height between genotypes fed the same diet. There was also no difference in duodenal or ileal crypt depth or villus height between chow-fed IRfl/fl and VC-IRΔ/Δ mice (data not shown). Jejunal submucosal circumference and crypt and villus density were also similar in IRfl/fl and VC-IRΔ/Δ mice fed chow or HFD (Table 2). Although loss of IEC-IR did not significantly affect the majority of the parameters measured, one exception was villus height in the jejunum, which was modestly increased in VC-IRΔ/Δ animals after HFD but decreased in IRfl/fl littermates, resulting in a significant interaction between diet and genotype (P < 0.05, by 2-way ANOVA). As shown in Fig. 5A, there was no difference in the total number of cells per crypt across genotypes or diet groups. The total number of EdU-positive cells per crypt was quantified as a measure of proliferation. There was no difference in the average number of EdU-positive cells per crypt between genotypes fed chow or HFD (Fig. 5B). Assessment of the position of EdU-labeled cells revealed no significant differences in the position of proliferating cells in the crypts of IRfl/fl vs. VC-IRΔ/Δ mice when diet-matched littermates were compared (Fig. 5, C–E).
Table 2.
Intestinal epithelial IR disruption does not alter intestinal structure in mice fed chow or HFD
| Chow (n ≥ 5) |
HFD (n ≥ 4) |
|||
|---|---|---|---|---|
| IRfl/fl | VC-IRΔ/Δ | IRfl/fl | VC-IRΔ/Δ | |
| SI length, cm | 39.7 ± 1.0 | 41.0 ± 0.9 | 37.4 ± 0.6* | 36.1 ± 0.6* |
| SI mass, g | 1.5 ± 0.09 | 1.5 ± 0.08 | 1.35 ± 0.05 | 1.36 ± 0.06 |
| Jejunal crypt depth, μm | 66.7 ± 1.4 | 62.1 ± 2.4 | 75.8 ± 2.1* | 75.1 ± 2.5* |
| Jejunal villus height, μm† | 350.7 ± 15.5 | 321.3 ± 8.3 | 312.7 ± 12.2 | 343.8 ± 13.0 |
| Jejunal circumference, mm | 7.91 ± 0.35 | 7.66 ± 0.51 | 7.83 ± 0.33 | 7.72 ± 0.32 |
| Crypt density, mm−1 | 14.8 ± 1.1 | 16.3 ± 0.6 | 16.5 ± 1.1 | 16.8 ± 0.9 |
| Villus density, mm−1 | 4.4 ± 0.42 | 5.4 ± 0.36 | 4.7 ± 0.33 | 5.2 ± 0.27 |
Values are means ± SE.
P < 0.05 (by 2-way ANOVA for main effect of diet).
P < 0.05 (by 2-way ANOVA for diet × genotype interaction).
Fig. 5.
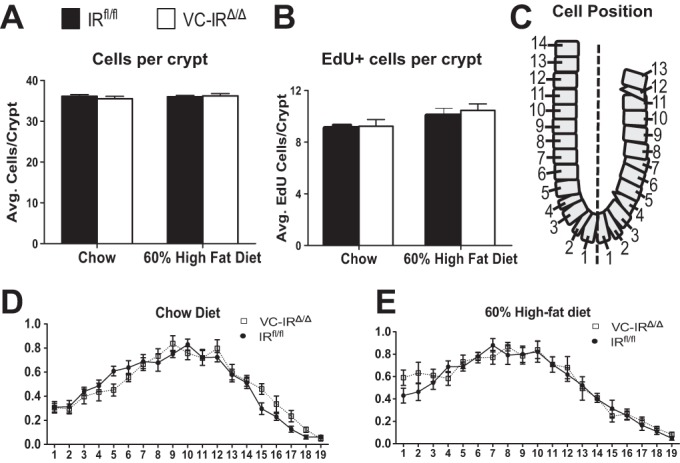
Intestinal epithelial-specific disruption of the IR does not alter cell proliferation in the basal state or during HFD feeding. A and B: cells per crypt assessed by quantification of 4′,6-diamidino-2-phenylindole (DAPI)-stained nuclei (A) and cells in the S phase assessed by quantification of 5-ethyl-2′-deoxyuridine (EdU) staining (B) in IRfl/fl and VC-IRΔ/Δ mice fed chow or HFD (60% of kilocalories from fat). C: schematic showing positions of EdU-positive cells within the crypt. D and E: location of proliferating cells in IRfl/fl and VC-IRΔ/Δ mice fed chow (D) or HFD (60% of kilocalories from fat; E) assessed by quantification of number of EdU-positive cells at each position along the crypt. Values are means ± SE; n ≥ 5.
Our previous study demonstrated that HFD-induced obesity expanded IESC (57). We therefore assessed mRNAs encoding biomarkers of crypt-based columnar (CBC), actively cycling IESC and quiescent/reserve IESC. HFD resulted in significant increases in Olfm4 and Ascl2, which are enriched in CBC IESC, a similar trend for Lgr5, and increased Sox9 mRNA, which is expressed in both types of IESC. HFD and obesity were also associated with increased expression of Hopx, which marks the quiescent/reserve IESC, but not Bmi1 or Lrig1 (Table 3). Interestingly, the impact of HFD on these biomarkers was attenuated or abolished in mice with IEC-IR deletion, such that HFD induced no significant increase in any IESC biomarker in VC-IRΔ/Δ mice (Table 3).
Table 3.
IESC biomarker gene expression in HFD-fed mice
| HFD-Fed Mice |
|||
|---|---|---|---|
| Gene | CBC/Quiescent | IRfl/fl | VC-IRΔ/Δ |
| Lgr5 | CBC | 1.42 ± 0.15 | 1.15 ± 0.10 |
| Olfm4 | CBC | 1.67 ± 0.17* | 1.08 ± 0.12◇ |
| Ascl2 | CBC | 2.92 ± 0.40* | 1.77 ± 0.19 |
| Sox9† | CBC/quiescent | 1.69 ± 0.11* | 1.10 ± 0.08 |
| Bmi1 | Quiescent | 0.93 ± 0.10 | 0.76 ± 0.09* |
| Hopx† | Quiescent | 1.38 ± 0.15 | 0.75 ± 0.06◇ |
| Lrig1 | Quiescent | 1.02 ± 0.12 | 0.70 ± 0.06 |
Values (means ± SE; n ≥ 9) are expressed as fold change vs. chow-fed mice.
CBC, crypt-based columnar intestinal epithelial stem cell (IESC).
P < 0.05 (by 2-way ANOVA with Sidak's multiple comparisons for effect of diet).
P < 0.05 (by 2-way ANOVA for diet × genotype interaction).
P < 0.05 (by 2-way ANOVA with Sidak's multiple comparisons for effect of genotype).
IEC-IR deletion does not affect Sis or Muc2 expression.
We next examined mRNA expression of markers of differentiated IEC lineages. The mRNA expression of Sis, which marks enterocytes, was similar between diet and genotype groups (Fig. 6A). Expression of Muc2, a goblet cell marker, decreased with HFD feeding but was not affected by IEC-IR loss (Fig. 6B).
Fig. 6.
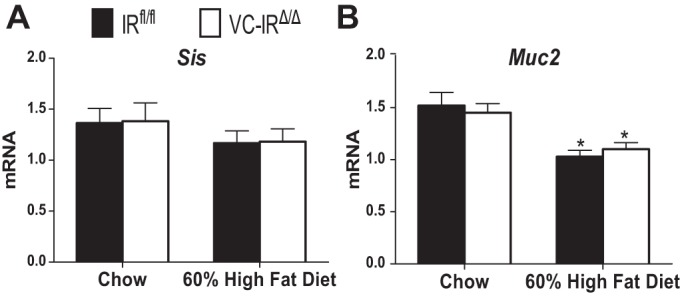
Loss of IEC-IR has no effect on mRNA expression of enterocyte and goblet cell markers. Sucrase isomaltase (Sis, A) and mucin-2 (Muc2, B) mRNA levels in jejunal epithelial cells isolated from IRfl/fl and VC-IRΔ/Δ mice fed chow or HFD (60% kilocalories from fat) were measured using quantitative RT-PCR. Expression levels were normalized to β-actin invariant control. Values are means ± SE; n ≥ 6. *P ≤ 0.05, HFD vs. chow (by 2-way ANOVA with Sidak's post hoc pair-wise comparisons for main effect of diet).
HFD-induced obesity is associated with increased numbers and biomarkers of EEC, and loss of IEC-IR attenuates these effects.
In IRfl/fl mice, HFD-induced obesity was associated with significant increases in the number of cells positive for CHGA, which marks a majority of EEC (Fig. 7, A and B), and also increased the levels of Chga mRNA (Fig. 7C). Gip and Gcg mRNAs were examined, because levels of these EEC products are altered in obesity (62). Gip mRNA was increased almost threefold (Fig. 7D), while Gcg mRNA was increased almost twofold, in obese IRfl/fl mice (Fig. 7E). Effects of obesity on CHGA-positive cells and Chga, Gip, and Gcg mRNAs were lost in VC-IRΔ/Δ mice lacking IEC-IR.
Fig. 7.

IEC-IR loss prevents HFD-induced increases in chromogranin A (CHGA)-positive cells and Chga, glucose-dependent insulinotrophic peptide (Gip), and glucagon (Gcg) mRNAs. A: representative images of CHGA immunostaining (red) and DAPI (blue). Magnification ×20; scale bar = 50 μm. B: quantification of number of CHGA-positive enteroendocrine cells in chow- or HFD-fed IRfl/fl and VC-IRΔ/Δ mice from images in A. C–E: quantitative RT-PCR assessment of Chga (C), Gip (D), and Gcg (E) mRNA levels in jejunal epithelial cells isolated from chow- or HFD-fed IRfl/fl and VC-IRΔ/Δ mice. Data are normalized to β-actin invariant control. Values are means ± SE; n ≥ 6. *P < 0.05 (by 2-way ANOVA with Sidak's post hoc pair-wise comparisons for main effect of diet). ◇P < 0.05 (by 2-way ANOVA with Sidak's post hoc pair-wise comparisons for main effect of genotype).
HFD-induced increase in Paneth cell antimicrobial peptides is abolished in mice lacking IEC-IR.
Quantification of Lyz-positive Paneth cells revealed similar Paneth cell numbers per crypt in chow-fed IRfl/fl and VC-IRΔ/Δ mice (Fig. 8, A and B). HFD reduced the number of Lyz-positive Paneth cells in both genotypes. HFD and obesity were associated with increases in Lyz mRNA in IRfl/fl, but not VC-IRΔ/Δ, mice (Fig. 8C). Another Paneth cell-specific mRNA (Def1a) was also increased after HFD, but only in IRfl/fl mice (Fig. 8D).
Fig. 8.

Loss of intestinal epithelial IR attenuates production of mRNAs encoding Paneth cell antimicrobial peptides. A: representative images of lysozyme (LYZ) immunostaining (red) and DAPI (blue). Magnification ×40; scale bar = 20 μm. B: quantification of number of Paneth (Lyz+) cells in chow- or HFD-fed IRfl/fl and VC-IRΔ/Δ mice from images in A. Magnification ×40; scale bar = 20 μm. C and D: quantitative RT-PCR assessment of Lyz (C) and Def1a (D) mRNA expression in jejunal epithelial cells isolated from chow- or HFD-fed IRfl/fl and VC-IRΔ/Δ mice. Data are normalized to β-actin invariant control. Values are means ± SE; n ≥ 6. *P < 0.05 (by 2-way ANOVA with Sidak's post hoc pair-wise comparisons for main effect of diet). ◇P < 0.05 (by 2-way ANOVA with Sidak's post hoc pair-wise comparisons for main effect of genotype).
IEC-specific IR loss attenuates HFD-induced increase in cholesterol transporter Scarb1 mRNA expression.
The levels of mRNAs encoding a number of proteins involved in lipid handling or lipid metabolism were evaluated in IEC prepared from the jejunum of IRfl/fl and VC-IRΔ/Δ mice. These mRNAs were chosen on the basis of previous studies in the fructose-fed hamster model of insulin resistance or in short-term HFD studies that demonstrated that insulin resistance or HFD was associated with increased expression of a number of genes involved in intestinal lipid handling (5, 25, 45, 46). Consistent with these reports, HFD feeding significantly increased levels of mRNAs encoding the transcription factors Pparγ and Srebf1, as well as Apoa4, in both IRfl/fl and VC-IRΔ/Δ mice (Fig. 9, A–C). Neither diet nor genotype resulted in significant differences in the levels of mRNAs encoding Apob-48, which is involved in chylomicron synthesis (Fig. 9D). In IRfl/fl and VC-IRΔ/Δ mice fed HFD, levels of mRNAs encoding the intestinal cholesterol transporter Scarb1 were significantly increased; however, the increase was significantly attenuated in VC-IRΔ/Δ mice (Fig. 9E). The same effect was also seen in animals fed HFD over a short-term [0.49 ± 0.2 and 1.93 ± 0.5 in chow- and HFD-fed IRfl/fl mice, respectively (P = 0.0063, by 2-way ANOVA for main effect of diet; P = 0.02, by 2-way ANOVA for main effect of genotype) and 0.32 ± 0.03 and 0.64 ± 0.1 in chow- and HFD-fed VC-IRΔ/Δ mice, respectively]. Overall results suggest that effects of IEC-IR loss may be specific to cholesterol handling.
Fig. 9.
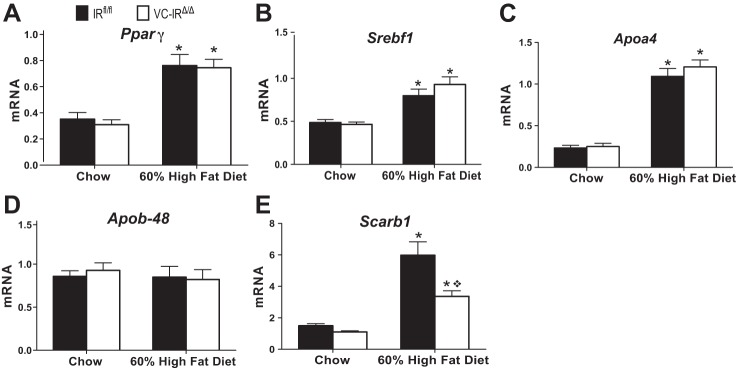
IEC-specific IR loss attenuates HFD-induced increase in mRNA encoding the cholesterol transporter Scarb1. Peroxisome proliferator-activated receptor-γ (Pparγ, A), sterol regulatory element-binding transcription factor 1 (Srebf1, B), apolipoprotein A-4 (Apoa4, C), apolipoprotein B-48 (Apob-48, D), and Scarb1 (E) mRNA expression in jejunal epithelial cells isolated from chow- or HFD-fed IRfl/fl and VC-IRΔ/Δ mice was determined by quantitative RT-PCR. All gene expression data are normalized to β-actin invariant control. Values are means ± SE; n ≥ 5. *P ≤ 0.05, HFD vs. chow (by 2-way ANOVA with Sidak's multiple-comparisons for effect of diet). ◇P < 0.05 (by 2-way ANOVA with Sidak's post hoc pair-wise comparisons for main effect of genotype).
DISCUSSION
This work provides new evidence that genetic deletion of the IR, specifically in IEC, has a minimal effect on intestinal epithelial growth and morphology, as well as plasma markers of metabolism, in lean, chow-fed animals. In contrast, in obesity due to HFD, loss of IEC-IR attenuates or prevents increases in EEC, mRNAs encoding IESC biomarkers, Paneth cell products, and an intestinal cholesterol transporter and also attenuates elevations in plasma cholesterol.
We initially hypothesized that adult VC-IRΔ/Δ mice would exhibit altered intestinal growth, resulting from loss of the growth-promoting effects of IR-A (4, 55) or, potentially, enhanced proliferative signaling, via the remaining IGF1R. Our findings of similar intestinal weight, length, morphometry, morphology, and proliferation levels in adult, chow-fed VC-IRΔ/Δ mice and IRfl/fl littermates indicate that the IR is dispensable for normal maintenance of the intestinal epithelium in adult animals. The lack of a basal morphological phenotype could be explained if the IGF1R can compensate for the growth-promoting roles of the IR (or IR-A) in the basal state. Although there was no significant change in Igf1r mRNA or protein expression in the basal state, this does not exclude the possibility that activation of the IGF1R is increased to compensate for IR loss.
One report in a colon cancer cell line with predominantly IR-A expression indicated that siRNA-mediated loss of IR enhanced cell viability and IGF1 signaling via the IGF1R (20). This led us to hypothesize that IR deletion might enhance intestinal growth by favoring IGF1R-mediated growth effects in a setting of diet-induced obesity and hyperinsulinemia, where circulating IGF1 is also elevated. However, our studies demonstrate that in vivo loss of IR does not result in enhanced intestinal growth, even after HFD feeding.
Our group previously demonstrated that IESC express high levels of both IR-A and Igf1r mRNA (4, 57) and that HFD expands Sox9-EGFPLow IESC, which rely on insulin/IGF1 signaling for intrinsic function following HFD feeding (57). Consistent with this study, HFD-fed IRfl/fl mice exhibited an increase in the IESC biomarkers Olfm4, Ascl2, Sox9, and Hopx that was not seen in VC-IRΔ/Δ mice after HFD feeding. These data suggest that the IR impairs HFD-induced IESC expansion, at least on the basis of abundance of mRNAs enriched in these cells, and that IGF1R cannot fully compensate for IR loss, in a setting of obesity and elevated circulating insulin levels.
These findings indicate that it will be of interest to assess the effect of IEC-IR loss in a model carrying a stem cell reporter to permit direct analyses of the role of IR in IESC. Consistent with prior findings, HFD-induced obesity did not affect the total number of EdU-labeled proliferating cells (57), and loss of IEC-IR had no effect on the number of EdU-labeled cells.
We recently reported evidence for predominance of IR-B in differentiated IEC lineages vs. proliferating IESC or progenitors (4). On the basis of this finding and the findings of our group and others that HFD impacts Paneth cells, goblet cells, and EECs (40, 57, 69, 73), we examined differentiated IEC lineages in chow- and HFD-fed IRfl/fl and VC-IRΔ/Δ mice. In chow-fed animals, there was little evidence that IR-B loss affected differentiated lineages on the basis of similar villus height, similar relative expression of mRNA biomarkers of enterocytes, goblet cells, or EEC, and direct evaluation of Paneth cell and EEC numbers.
Elevations in the number of CHGA-positive EEC and levels of Chga mRNA in obese mice after prolonged HFD feeding are consistent with prior reports of EEC hyperplasia in obesity (8, 40). The significant increases in CHGA-positive cells and Chga mRNA levels in HFD-fed mice with intact IR were not observed in VC-IRΔ/Δ mice, indicating roles for IR in these effects. EEC produce and secrete a number of hormones involved in regulating metabolism, including the incretins GIP and GLP1, which stimulate insulin synthesis and secretion from the pancreas (76). Several studies demonstrate that GIP levels are elevated during obesity or HFD feeding (8, 40, 62). GLP1 is produced from the intestinal precursor proglucagon and, as well as stimulating insulin synthesis and secretion in islets, is responsible for numerous metabolic functions, including increased glucose uptake by the liver, muscle, and adipocytes, decreased gastric emptying, and increased satiety (58). Insulin-resistant mice display elevated basal levels of GLP1 (54). Increases in Gip and Gcg mRNA levels in IEC from the HFD-fed IRfl/fl animals in the present study are consistent with these previous observations and suggest that HFD increases synthesis of these hormones. Findings in VC-IRΔ/Δ mice suggest that IEC-IR contributes to the increase in Gip and Gcg expression during HFD-induced obesity. Investigation of the effects of IEC-IR loss on additional EEC products and hormone secretion is of future interest.
Our group recently demonstrated that HFD-induced obesity and hyperinsulinemia reduce Paneth and goblet cell numbers in wild-type mice (57). Consistent with these observations, HFD was associated with decreases in Paneth cell numbers and Muc2 mRNA expression in the present study. This occurred in both IRfl/fl and VC-IRΔ/Δ mice, indicating no role of IR in these effects of HFD. A recent human study demonstrated elevated LYZ and DEFA5 mRNA levels in obese human patients (47), indicating an effect of diet-induced obesity on Paneth cell expression of antimicrobial products. Consistent with these findings, we observed increases in Lyz and Def1a mRNA levels in the HFD-fed IRfl/fl mice. Our findings that loss of IEC-IR led to reduced Lyz mRNA in chow-fed animals, prevented a HFD-induced increase in Lyz mRNA, and attenuated HFD-induced increases in Def1a mRNA suggest that loss of IR affects Paneth cell expression of antimicrobial peptides. Our current data suggest that IR may directly or indirectly impact effects of obesity on Paneth cell antimicrobial mRNAs. Whether the reduction in antimicrobial mRNA production in the HFD-fed IEC-IR-deficient mice is sufficient to alter intestinal barrier function, the microbial community, or immune mechanisms requires further investigation. Further studies are also needed to elucidate the physiological significance and role of IR in Paneth cells.
HFD-fed IRfl/fl and VC-IRΔ/Δ animals accumulated significant amounts of fat relative to chow-fed controls. Despite these gross similarities in fat accumulation, we examined mRNA expression of a number of lipid-handling proteins in IEC, as increasing evidence suggests a potential link between intestinal insulin sensitivity and lipid production by the intestine (26, 32, 34, 43, 45, 53, 83, 84, 88). Consistent with previously published work, we found that levels of mRNAs encoding the transcription factors Pparγ and Srebf1, which control expression of enterocyte lipid-handling genes, as well as mRNA for the chylomicron-associated protein Apoa4, were significantly increased in small intestinal IEC following HFD feeding (46), and this was unaffected by IR loss. An exception was Scarb1 mRNA encoding a cholesterol receptor (44). Consistent with previous work (81), Scarb1 was elevated in IEC of HFD-fed IRfl/fl controls. Loss of IEC-IR attenuated HFD-induced increases in Scarb1 mRNA, providing evidence for a role of IR in regulating this transporter. It is noteworthy that a prior pilot study revealed elevated Scarb1 mRNA in IRfl/fl mice fed a HFD with 45% of kilocalories from fat, and this effect was not observed in VC-IRΔ/Δ animals. Thus the impact of loss of IEC-IR on Scarb1 mRNA is consistent across two independent HFD challenges.
Although we have only examined Scarb1 at the mRNA level, available evidence suggests that decreases in SCARB1 protein could impact lipid sensing and handling within the enterocytes of VC-IRΔ/Δ mice. In vitro studies have demonstrated that SCARB1 is present at the apical membrane, where it is required for sensing postprandial lipid, as well as lipid transport, and for mobilizing APOB-48 from the plasma membrane to the endoplasmic reticulum for chylomicron generation (10, 68). This is further supported by Hayashi et al. (45), who showed that knockdown of Scarb1 resulted in reduced APOB-48 chylomicron secretion in vitro. Although VC-IRΔ/Δ animals are not protected from HFD-induced adiposity, they are protected from increases in circulating cholesterol present in HFD-fed IRfl/fl littermates, suggesting that IEC-IR impacts both Scarb1 expression and enterocyte cholesterol handling.
There is growing evidence that obesity and insulin resistance lead to alterations in intestinal nutrient handling, which have been attributed to intestinal epithelial insulin resistance. This includes increased APOB-48 chylomicron production and secretion, leading to dyslipidemia (34, 43, 45, 48, 83, 84, 88). Direct evidence that intestinal epithelial insulin resistance contributes to these problems is, however, lacking. Our studies provide new evidence that complete loss of IEC-IR expression does not lead to systemic insulin resistance or increased weight gain in animals fed a chow diet, as glucose tolerance tests, body weight, and mRNA expression levels of lipid-handling proteins in chow-fed VC-IRΔ/Δ mice are identical to those in IRfl/fl littermates. These studies in mice provide important insights that loss of intestinal epithelial IR signaling is not sufficient to promote or exacerbate weight gain or systemic hyperinsulinemia. We cannot exclude the possibility that IGF1R or other metabolic receptors are able to fulfill some metabolic roles of IR.
Although we originally hypothesized that there would be a more robust intestinal growth or metabolic phenotype in these IEC-specific IR knockout mice, our findings add to a body of evidence for relatively mild phenotypic effects of deletion of IR in nonhepatic tissues. For example, loss of IR in skeletal muscle did not alter circulating glucose or insulin levels but did increase fat mass (22). Ablation of IR in adipose tissue resulted in increased longevity and reduced fat mass but did not dramatically alter glucose homeostasis and actually improved age-associated glucose intolerance (17). Knocking out IR in the central nervous system had broad effects on energy homeostasis and reproductive maturation (21). Thus it is not surprising that a pathway as critical to survival as the insulin system has some redundancy or compensatory mechanisms to guard against phenotypic effects of IR loss on IR ablation in adult animals. Enhanced IGF1R signaling may compensate for IR loss, although this has not been reported for other tissues following IR ablation (17, 21, 22, 42, 52, 59, 60).
Overall, our data demonstrate that loss of IR signaling in IEC does not impact gross or morphometric measures of small intestinal growth, systemic insulin sensitivity, or adiposity in lean animals or animals fed HFD to induce obesity. However, our findings do point to functional roles of IEC-IR in plasma cholesterol, EEC expansion, biomarkers of IESC, Paneth cell antimicrobial peptides, and intestinal cholesterol transporter mRNA expression during HFD-induced obesity.
GRANTS
This work was supported by National Institutes of Health Grants F31-AG-040943 (S. F. A), 5-R01-DK-040247-19 and 5-R01-AG-041198-01A1 (P. K. Lund), and P30-DK-034987 (CGIBD).
AUTHOR CONTRIBUTIONS
S.F.A. designed, conducted, and analyzed the majority of the experiments or oversaw those performing them and wrote the manuscript. M.A.S. conducted the PCR and Western blot experiments to validate the knockout specificity and took some images of immunofluorescence staining. A.T.M. assisted with experiments and performed some quantitative RT-PCRs. J.A.K. analyzed tissue sections for CHGA-positive cells and morphological measures and performed some quantitative RT-PCRs. A.E.B. analyzed tissue sections for proliferation. R.E.B. assisted with all tissue harvests and performed some quantitative RT-PCRs. P.K.L. oversaw all studies and data analysis, contributed to the writing of the manuscript, and provided guidance throughout the study. All authors reviewed and approved the manuscript.
DISCLOSURES
No conflicts of interest, financial or otherwise, are declared by the authors.
ACKNOWLEDGMENTS
The authors thank C. Ronald Kahn for providing the IRfl/fl mice and valuable assistance with study design, Carolyn Suitt and the Center for Gastrointestinal Biology and Disease (CGIBD) Histology Core for paraffin embedding, Kirk McNaughton and Ashley Ezzell for immunohistochemistry and immunofluorescence staining, Carlton Anderson (CGIBD Advanced Analytics Core) for performing the ELISAs and cholesterol assays, Jim Simmons for performing IEC isolations, and Lin Xiao, Justine Moore, and Elle Glenny for assistance with RNA isolation, quantitative RT-PCR, or morphological measures. Many useful discussions with Laurianne Van Landeghem, Kathleen Caron, Chris Dekaney, Tope Keku, John Rawls and Kathryn Hamilton are gratefully acknowledged.
REFERENCES
- 1.Abumrad NA, Davidson NO. Role of the gut in lipid homeostasis. Physiol Rev 92: 1061–1085, 2012. [DOI] [PMC free article] [PubMed] [Google Scholar]
- 2.Adeli K, Lewis GF. Intestinal lipoprotein overproduction in insulin-resistant states. Curr Opin Lipidol 19: 221–228, 2008. [DOI] [PubMed] [Google Scholar]
- 3.Aleman JO, Eusebi LH, Ricciardiello L, Patidar K, Sanyal AJ, Holt PR. Mechanisms of obesity-induced gastrointestinal neoplasia. Gastroenterology 146: 357–373, 2014. [DOI] [PMC free article] [PubMed] [Google Scholar]
- 4.Andres SF, Simmons JG, Mah AT, Santoro MA, Van Landeghem L, Lund PK. Insulin receptor isoform switching in intestinal stem cells, progenitors, differentiated lineages and tumors: evidence that IR-B limits proliferation. J Cell Sci 126: 5645–5656, 2013. [DOI] [PMC free article] [PubMed] [Google Scholar]
- 5.Apfelbaum TF, Davidson NO, Glickman RM. Apolipoprotein A-IV synthesis in rat intestine: regulation by dietary triglyceride. Am J Physiol Gastrointest Liver Physiol 252: G662–G666, 1987. [DOI] [PubMed] [Google Scholar]
- 6.Avnet S, Perut F, Salerno M, Sciacca L, Baldini N. Insulin receptor isoforms are differently expressed during human osteoblastogenesis. Differ Res Biol Diversity 83: 242–248, 2012. [DOI] [PubMed] [Google Scholar]
- 7.Ayabe T, Ashida T, Kohgo Y, Kono T. The role of Paneth cells and their antimicrobial peptides in innate host defense. Trends Microbiol 12: 394–398, 2004. [DOI] [PubMed] [Google Scholar]
- 8.Bailey CJ, Flatt PR, Kwasowski P, Powell CJ, Marks V. Immunoreactive gastric inhibitory polypeptide and K cell hyperplasia in obese hyperglycaemic (ob/ob) mice fed high fat and high carbohydrate cafeteria diets. Acta Endocrinol 112: 224–229, 1986. [DOI] [PubMed] [Google Scholar]
- 9.Barker N, van de Wetering M, Clevers H. The intestinal stem cell. Genes Dev 22: 1856–1864, 2008. [DOI] [PMC free article] [PubMed] [Google Scholar]
- 10.Beaslas O, Cueille C, Delers F, Chateau D, Chambaz J, Rousset M, Carriere V. Sensing of dietary lipids by enterocytes: a new role for SR-BI/CLA-1. PLos One 4: e4278, 2009. [DOI] [PMC free article] [PubMed] [Google Scholar]
- 11.Belfiore A, Frasca F, Pandini G, Sciacca L, Vigneri R. Insulin receptor isoforms and insulin receptor/insulin-like growth factor receptor hybrids in physiology and disease. Endocr Rev 30: 586–623, 2009. [DOI] [PubMed] [Google Scholar]
- 12.Ben Lulu S, Coran AG, Mogilner JG, Shaoul R, Shamir R, Shehadeh N, Sukhotnik I. Oral insulin stimulates intestinal epithelial cell turnover in correlation with insulin-receptor expression along the villus-crypt axis in a rat model of short bowel syndrome. Pediatr Surg Int 26: 37–44, 2010. [DOI] [PubMed] [Google Scholar]
- 13.Ben Lulu S, Coran AG, Shehadeh N, Shamir R, Mogilner JG, Sukhotnik I. Oral insulin stimulates intestinal epithelial cell turnover following massive small bowel resection in a rat and a cell culture model. Pediatr Surg Int 28: 179–187, 2012. [DOI] [PubMed] [Google Scholar]
- 14.Berlato C, Doppler W. Selective response to insulin versus insulin-like growth factor-I and -II and up-regulation of insulin receptor splice variant B in the differentiated mouse mammary epithelium. Endocrinology 150: 2924–2933, 2009. [DOI] [PubMed] [Google Scholar]
- 15.Biddinger SB, Almind K, Miyazaki M, Kokkotou E, Ntambi JM, Kahn CR. Effects of diet and genetic background on sterol regulatory element-binding protein-1c, stearoyl-CoA desaturase 1, and the development of the metabolic syndrome. Diabetes 54: 1314–1323, 2005. [DOI] [PubMed] [Google Scholar]
- 16.Bjerknes M, Cheng H. The stem-cell zone of the small intestinal epithelium. III. Evidence from columnar, enteroendocrine, and mucous cells in the adult mouse. Am J Anat 160: 77–91, 1981. [DOI] [PubMed] [Google Scholar]
- 17.Bluher M, Kahn BB, Kahn CR. Extended longevity in mice lacking the insulin receptor in adipose tissue. Science 299: 572–574, 2003. [DOI] [PubMed] [Google Scholar]
- 18.Bortvedt SF, Lund PK. Insulin-like growth factor 1: common mediator of multiple enterotrophic hormones and growth factors. Curr Opin Gastroenterol 28: 89–98, 2012. [DOI] [PMC free article] [PubMed] [Google Scholar]
- 19.Boucher J, Tseng YH, Kahn CR. Insulin and insulin-like growth factor-1 receptors act as ligand-specific amplitude modulators of a common pathway regulating gene transcription. J Biol Chem 285: 17235–17245, 2010. [DOI] [PMC free article] [PubMed] [Google Scholar]
- 20.Brierley GV, Macaulay SL, Forbes BE, Wallace JC, Cosgrove LJ, Macaulay VM. Silencing of the insulin receptor isoform A favors formation of type 1 insulin-like growth factor receptor (IGF-IR) homodimers and enhances ligand-induced IGF-IR activation and viability of human colon carcinoma cells. Endocrinology 151: 1418–1427, 2010. [DOI] [PubMed] [Google Scholar]
- 21.Bruning JC, Gautam D, Burks DJ, Gillette J, Schubert M, Orban PC, Klein R, Krone W, Muller-Wieland D, Kahn CR. Role of brain insulin receptor in control of body weight and reproduction. Science 289: 2122–2125, 2000. [DOI] [PubMed] [Google Scholar]
- 22.Bruning JC, Michael MD, Winnay JN, Hayashi T, Horsch D, Accili D, Goodyear LJ, Kahn CR. A muscle-specific insulin receptor knockout exhibits features of the metabolic syndrome of NIDDM without altering glucose tolerance. Mol Cell 2: 559–569, 1998. [DOI] [PubMed] [Google Scholar]
- 23.Buck E, Gokhale PC, Koujak S, Brown E, Eyzaguirre A, Tao N, Rosenfeld-Franklin M, Lerner L, Chiu MI, Wild R, Epstein D, Pachter JA, Miglarese MR. Compensatory insulin receptor (IR) activation on inhibition of insulin-like growth factor-1 receptor (IGF-1R): rationale for cotargeting IGF-1R and IR in cancer. Mol Cancer Ther 9: 2652–2664, 2010. [DOI] [PubMed] [Google Scholar]
- 24.Cheng H, Leblond CP. Origin, differentiation and renewal of the four main epithelial cell types in the mouse small intestine. V. Unitarian theory of the origin of the four epithelial cell types. Am J Anat 141: 537–561, 1974. [DOI] [PubMed] [Google Scholar]
- 25.de Wit NJ, Boekschoten MV, Bachmair EM, Hooiveld GJ, de Groot PJ, Rubio-Aliaga I, Daniel H, Muller M. Dose-dependent effects of dietary fat on development of obesity in relation to intestinal differential gene expression in C57BL/6J mice. PLos One 6: e19145, 2011. [DOI] [PMC free article] [PubMed] [Google Scholar]
- 26.Demignot S, Beilstein F, Morel E. Triglyceride-rich lipoproteins and cytosolic lipid droplets in enterocytes: key players in intestinal physiology and metabolic disorders. Biochimie 96: 48–55, 2014. [DOI] [PubMed] [Google Scholar]
- 27.Dinchuk JE, Cao C, Huang F, Reeves KA, Wang J, Myers F, Cantor GH, Zhou X, Attar RM, Gottardis M, Carboni JM. Insulin receptor (IR) pathway hyperactivity in IGF-IR null cells and suppression of downstream growth signaling using the dual IGF-IR/IR inhibitor, BMS-754807. Endocrinology 151: 4123–4132, 2010. [DOI] [PubMed] [Google Scholar]
- 28.Ding S, Chi MM, Scull BP, Rigby R, Schwerbrock NM, Magness S, Jobin C, Lund PK. High-fat diet: bacteria interactions promote intestinal inflammation which precedes and correlates with obesity and insulin resistance in mouse. PLos One 5: e12191, 2010. [DOI] [PMC free article] [PubMed] [Google Scholar]
- 29.Dong CX, Zhao W, Solomon C, Rowland KJ, Ackerley C, Robine S, Holzenberger M, Gonska T, Brubaker PL. The intestinal epithelial insulin-like growth factor-1 receptor links glucagon-like peptide-2 action to gut barrier function. Endocrinology 155: 370–379, 2014. [DOI] [PubMed] [Google Scholar]
- 30.Dube PE, Forse CL, Bahrami J, Brubaker PL. The essential role of insulin-like growth factor-1 in the intestinal tropic effects of glucagon-like peptide-2 in mice. Gastroenterology 131: 589–605, 2006. [DOI] [PubMed] [Google Scholar]
- 31.Dube PE, Rowland KJ, Brubaker PL. Glucagon-like peptide-2 activates β-catenin signaling in the mouse intestinal crypt: role of insulin-like growth factor-I. Endocrinology 149: 291–301, 2008. [DOI] [PubMed] [Google Scholar]
- 32.Duez H, Lamarche B, Uffelman KD, Valero R, Cohn JS, Lewis GF. Hyperinsulinemia is associated with increased production rate of intestinal apolipoprotein B-48-containing lipoproteins in humans. Arterioscler Thromb Vasc Biol 26: 1357–1363, 2006. [DOI] [PubMed] [Google Scholar]
- 33.Entingh AJ, Taniguchi CM, Kahn CR. Bi-directional regulation of brown fat adipogenesis by the insulin receptor. J Biol Chem 278: 33377–33383, 2003. [DOI] [PubMed] [Google Scholar]
- 34.Federico LM, Naples M, Taylor D, Adeli K. Intestinal insulin resistance and aberrant production of apolipoprotein B48 lipoproteins in an animal model of insulin resistance and metabolic dyslipidemia: evidence for activation of protein tyrosine phosphatase-1B, extracellular signal-related kinase, and sterol regulatory element-binding protein-1c in the fructose-fed hamster intestine. Diabetes 55: 1316–1326, 2006. [DOI] [PubMed] [Google Scholar]
- 35.Formeister EJ, Sionas AL, Lorance DK, Barkley CL, Lee GH, Magness ST. Distinct SOX9 levels differentially mark stem/progenitor populations and enteroendocrine cells of the small intestine epithelium. Am J Physiol Gastrointest Liver Physiol 296: G1108–G1118, 2009. [DOI] [PMC free article] [PubMed] [Google Scholar]
- 36.Frasca F, Pandini G, Scalia P, Sciacca L, Mineo R, Costantino A, Goldfine ID, Belfiore A, Vigneri R. Insulin receptor isoform A, a newly recognized, high-affinity insulin-like growth factor II receptor in fetal and cancer cells. Mol Cell Biol 19: 3278–3288, 1999. [DOI] [PMC free article] [PubMed] [Google Scholar]
- 37.Frasca F, Pandini G, Sciacca L, Pezzino V, Squatrito S, Belfiore A, Vigneri R. The role of insulin receptors and IGF-I receptors in cancer and other diseases. Arch Physiol Biochem 114: 23–37, 2008. [DOI] [PubMed] [Google Scholar]
- 38.Frystyk J. Free insulin-like growth factors—measurements and relationships to growth hormone secretion and glucose homeostasis. Growth Hormone IGF Res 14: 337–375, 2004. [DOI] [PubMed] [Google Scholar]
- 39.Garrison AP, Helmrath MA, Dekaney CM. Intestinal stem cells. J Pediatr Gastroenterol Nutr 49: 2–7, 2009. [DOI] [PubMed] [Google Scholar]
- 40.Gniuli D, Calcagno A, Dalla Libera L, Calvani R, Leccesi L, Caristo ME, Vettor R, Castagneto M, Ghirlanda G, Mingrone G. High-fat feeding stimulates endocrine, glucose-dependent insulinotropic polypeptide (GIP)-expressing cell hyperplasia in the duodenum of Wistar rats. Diabetologia 53: 2233–2240, 2010. [DOI] [PubMed] [Google Scholar]
- 41.Gracz AD, Ramalingam S, Magness ST. Sox9 expression marks a subset of CD24-expressing small intestine epithelial stem cells that form organoids in vitro. Am J Physiol Gastrointest Liver Physiol 298: G590–G600, 2010. [DOI] [PMC free article] [PubMed] [Google Scholar]
- 42.Guerra C, Navarro P, Valverde AM, Arribas M, Bruning J, Kozak LP, Kahn CR, Benito M. Brown adipose tissue-specific insulin receptor knockout shows diabetic phenotype without insulin resistance. J Clin Invest 108: 1205–1213, 2001. [DOI] [PMC free article] [PubMed] [Google Scholar]
- 43.Haidari M, Leung N, Mahbub F, Uffelman KD, Kohen-Avramoglu R, Lewis GF, Adeli K. Fasting and postprandial overproduction of intestinally derived lipoproteins in an animal model of insulin resistance. Evidence that chronic fructose feeding in the hamster is accompanied by enhanced intestinal de novo lipogenesis and ApoB48-containing lipoprotein overproduction. J Biol Chem 277: 31646–31655, 2002. [DOI] [PubMed] [Google Scholar]
- 44.Hauser H, Dyer JH, Nandy A, Vega MA, Werder M, Bieliauskaite E, Weber FE, Compassi S, Gemperli A, Boffelli D, Wehrli E, Schulthess G, Phillips MC. Identification of a receptor mediating absorption of dietary cholesterol in the intestine. Biochemistry 37: 17843–17850, 1998. [DOI] [PubMed] [Google Scholar]
- 45.Hayashi AA, Webb J, Choi J, Baker C, Lino M, Trigatti B, Trajcevski KE, Hawke TJ, Adeli K. Intestinal SR-BI is upregulated in insulin-resistant states and is associated with overproduction of intestinal apoB48-containing lipoproteins. Am J Physiol Gastrointest Liver Physiol 301: G326–G337, 2011. [DOI] [PubMed] [Google Scholar]
- 46.Hernandez Vallejo SJ, Alqub M, Luquet S, Cruciani-Guglielmacci C, Delerive P, Lobaccaro JM, Kalopissis AD, Chambaz J, Rousset M, Lacorte JM. Short-term adaptation of postprandial lipoprotein secretion and intestinal gene expression to a high-fat diet. Am J Physiol Gastrointest Liver Physiol 296: G782–G792, 2009. [DOI] [PubMed] [Google Scholar]
- 47.Hodin CM, Verdam FJ, Grootjans J, Rensen SS, Verheyen FK, Dejong CH, Buurman WA, Greve JW, Lenaerts K. Reduced Paneth cell antimicrobial protein levels correlate with activation of the unfolded protein response in the gut of obese individuals. J Pathol 225: 276–284, 2011. [DOI] [PubMed] [Google Scholar]
- 48.Hogue JC, Lamarche B, Tremblay AJ, Bergeron J, Gagne C, Couture P. Evidence of increased secretion of apolipoprotein B-48-containing lipoproteins in subjects with type 2 diabetes. J Lipid Res 48: 1336–1342, 2007. [DOI] [PubMed] [Google Scholar]
- 49.Iqbal J, Hussain MM. Intestinal lipid absorption. Am J Physiol Endocrinol Metab 296: E1183–E1194, 2009. [DOI] [PMC free article] [PubMed] [Google Scholar]
- 50.Keku TO, Lund PK, Galanko J, Simmons JG, Woosley JT, Sandler RS. Insulin resistance, apoptosis, and colorectal adenoma risk. Cancer Epidemiol Biomarkers Prev 14: 2076–2081, 2005. [DOI] [PubMed] [Google Scholar]
- 51.Kellett GL, Brot-Laroche E, Mace OJ, Leturque A. Sugar absorption in the intestine: the role of GLUT2. Annu Rev Nutr 28: 35–54, 2008. [DOI] [PubMed] [Google Scholar]
- 52.Kulkarni RN, Bruning JC, Winnay JN, Postic C, Magnuson MA, Kahn CR. Tissue-specific knockout of the insulin receptor in pancreatic beta cells creates an insulin secretory defect similar to that in type 2 diabetes. Cell 96: 329–339, 1999. [DOI] [PubMed] [Google Scholar]
- 53.Levy E, Sinnett D, Thibault L, Nguyen TD, Delvin E, Menard D. Insulin modulation of newly synthesized apolipoproteins B-100 and B-48 in human fetal intestine: gene expression and mRNA editing are not involved. FEBS Lett 393: 253–258, 1996. [DOI] [PubMed] [Google Scholar]
- 54.Lim GE, Huang GJ, Flora N, LeRoith D, Rhodes CJ, Brubaker PL. Insulin regulates glucagon-like peptide-1 secretion from the enteroendocrine L cell. Endocrinology 150: 580–591, 2009. [DOI] [PMC free article] [PubMed] [Google Scholar]
- 55.Louvi A, Accili D, Efstratiadis A. Growth-promoting interaction of IGF-II with the insulin receptor during mouse embryonic development. Dev Biol 189: 33–48, 1997. [DOI] [PubMed] [Google Scholar]
- 56.Madison BB, Dunbar L, Qiao XT, Braunstein K, Braunstein E, Gumucio DL. Cis elements of the villin gene control expression in restricted domains of the vertical (crypt) and horizontal (duodenum, cecum) axes of the intestine. J Biol Chem 277: 33275–33283, 2002. [DOI] [PubMed] [Google Scholar]
- 57.Mah AT, Van Landeghem L, Gavin HE, Magness ST, Lund PK. Impact of diet-induced obesity on intestinal stem cells: hyperproliferation but impaired intrinsic function that requires insulin/IGF1. Endocrinology 155: 3302–3314, 2014. [DOI] [PMC free article] [PubMed] [Google Scholar]
- 58.Mansour A, Hosseini S, Larijani B, Pajouhi M, Mohajeri-Tehrani MR. Nutrients related to GLP1 secretory responses. Nutrition 29: 813–820, 2013. [DOI] [PubMed] [Google Scholar]
- 59.Mauer J, Chaurasia B, Plum L, Quast T, Hampel B, Bluher M, Kolanus W, Kahn CR, Bruning JC. Myeloid cell-restricted insulin receptor deficiency protects against obesity-induced inflammation and systemic insulin resistance. PLoS Genet 6: e1000938, 2010. [DOI] [PMC free article] [PubMed] [Google Scholar]
- 60.Michael MD, Kulkarni RN, Postic C, Previs SF, Shulman GI, Magnuson MA, Kahn CR. Loss of insulin signaling in hepatocytes leads to severe insulin resistance and progressive hepatic dysfunction. Mol Cell 6: 87–97, 2000. [PubMed] [Google Scholar]
- 61.National Cancer Institute. Villin-Cre PCR Protocol. Bethesda, MD: National Cancer Institute; http://mouse.ncifcrf.gov/protocols.asp?ID=01XE7&p_allele=Tg%28Vil-Cre%2920Syr&prot_no=2 First accessed: March 1, 2013. [Google Scholar]
- 62.Opinto G, Natalicchio A, Marchetti P. Physiology of incretins and loss of incretin effect in type 2 diabetes and obesity. Arch Physiol Biochem 119: 170–178, 2013. [DOI] [PubMed] [Google Scholar]
- 63.Powell AE, Wang Y, Li Y, Poulin EJ, Means AL, Washington MK, Higginbotham JN, Juchheim A, Prasad N, Levy SE, Guo Y, Shyr Y, Aronow BJ, Haigis KM, Franklin JL, Coffey RJ. The pan-ErbB negative regulator Lrig1 is an intestinal stem cell marker that functions as a tumor suppressor. Cell 149: 146–158, 2012. [DOI] [PMC free article] [PubMed] [Google Scholar]
- 64.Rechler MM. Insulin-like growth factor binding proteins. Vitam Horm 47: 1–114, 1993. [DOI] [PubMed] [Google Scholar]
- 65.Rowland KJ, Trivedi S, Lee D, Wan K, Kulkarni RN, Holzenberger M, Brubaker PL. Loss of glucagon-like peptide-2-induced proliferation following intestinal epithelial insulin-like growth factor-1-receptor deletion. Gastroenterology 141: 2166–2175, 2011. [DOI] [PubMed] [Google Scholar]
- 66.Rowzee AM, Ludwig DL, Wood TL. Insulin-like growth factor type 1 receptor and insulin receptor isoform expression and signaling in mammary epithelial cells. Endocrinology 150: 3611–3619, 2009. [DOI] [PMC free article] [PubMed] [Google Scholar]
- 67.Russell-Jones DL, Umpleby AM, Shojaee-Moradie F, Boroujerdi MA, Jones RH, Baxter RC, Sonksen PH. The effect of an intravenous infusion of IGF-I and insulin on IGFBP-1, IGFBP-3, acid labile subunit, free and bound IGF-I, catecholamines and potassium in normal volunteers during an amino acid and glucose clamp. Clin Endocrinol 47: 685–691, 1997. [DOI] [PubMed] [Google Scholar]
- 68.Saddar S, Carriere V, Lee WR, Tanigaki K, Yuhanna IS, Parathath S, Morel E, Warrier M, Sawyer JK, Gerard RD, Temel RE, Brown JM, Connelly M, Mineo C, Shaul PW. Scavenger receptor class B type I is a plasma membrane cholesterol sensor. Circ Res 112: 140–151, 2013. [DOI] [PMC free article] [PubMed] [Google Scholar]
- 69.Sakar Y, Duca FA, Langelier B, Devime F, Blottiere H, Delorme C, Renault P, Covasa M. Impact of high-fat feeding on basic helix-loop-helix transcription factors controlling enteroendocrine cell differentiation. Int J Obes (Lond) 38: 1482, 2014. [DOI] [PubMed] [Google Scholar]
- 70.Sangiorgi E, Capecchi MR. Bmi1 is expressed in vivo in intestinal stem cells. Nat Genet 40: 915–920, 2008. [DOI] [PMC free article] [PubMed] [Google Scholar]
- 71.Santoro MA, Andres SF, Galanko JA, Sandler RS, Keku TO, Lund PK. Reduced insulin-like growth factor 1 receptor and altered insulin receptor isoform mRNAs in normal mucosa predict colorectal adenoma risk. Cancer Epidemiol Biomarkers Prev 23: 2093–2100, 2014. [DOI] [PMC free article] [PubMed] [Google Scholar]
- 72.Serrano R, Villar M, Martinez C, Carrascosa JM, Gallardo N, Andres A. Differential gene expression of insulin receptor isoforms A and B and insulin receptor substrates 1, 2 and 3 in rat tissues: modulation by aging and differentiation in rat adipose tissue. J Mol Endocrinol 34: 153–161, 2005. [DOI] [PubMed] [Google Scholar]
- 73.Shin NR, Lee JC, Lee HY, Kim MS, Whon TW, Lee MS, Bae JW. An increase in the Akkermansia spp. population induced by metformin treatment improves glucose homeostasis in diet-induced obese mice. Gut 63: 727–735, 2014. [DOI] [PubMed] [Google Scholar]
- 74.Simons BD, Clevers H. Stem cell self-renewal in intestinal crypt. Exp Cell Res 317: 2719–2724, 2011. [DOI] [PubMed] [Google Scholar]
- 75.Takeda N, Jain R, LeBoeuf MR, Wang Q, Lu MM, Epstein JA. Interconversion between intestinal stem cell populations in distinct niches. Science 334: 1420–1424, 2011. [DOI] [PMC free article] [PubMed] [Google Scholar]
- 76.Tan T, Bloom S. Gut hormones as therapeutic agents in treatment of diabetes and obesity. Curr Opin Pharmacol 13: 996–1001, 2013. [DOI] [PubMed] [Google Scholar]
- 77.Tran TT, Naigamwalla D, Oprescu AI, Lam L, McKeown-Eyssen G, Bruce WR, Giacca A. Hyperinsulinemia, but not other factors associated with insulin resistance, acutely enhances colorectal epithelial proliferation in vivo. Endocrinology 147: 1830–1837, 2006. [DOI] [PubMed] [Google Scholar]
- 78.Ulanet DB, Ludwig DL, Kahn CR, Hanahan D. Insulin receptor functionally enhances multistage tumor progression and conveys intrinsic resistance to IGF-1R targeted therapy. Proc Natl Acad Sci USA 107: 10791–10798, 2010. [DOI] [PMC free article] [PubMed] [Google Scholar]
- 79.van der Flier LG, Clevers H. Stem cells, self-renewal, and differentiation in the intestinal epithelium. Annu Rev Physiol 71: 241–260, 2009. [DOI] [PubMed] [Google Scholar]
- 80.van der Flier LG, van Gijn ME, Hatzis P, Kujala P, Haegebarth A, Stange DE, Begthel H, van den Born M, Guryev V, Oving I, van Es JH, Barker N, Peters PJ, van de Wetering M, Clevers H. Transcription factor achaete scute-like 2 controls intestinal stem cell fate. Cell 136: 903–912, 2009. [DOI] [PubMed] [Google Scholar]
- 81.van der Velde AE, Vrins CL, van den Oever K, Seemann I, Oude Elferink RP, van Eck M, Kuipers F, Groen AK. Regulation of direct transintestinal cholesterol excretion in mice. Am J Physiol Gastrointest Liver Physiol 295: G203–G208, 2008. [DOI] [PubMed] [Google Scholar]
- 82.Van Landeghem L, Santoro MA, Krebs AE, Mah AT, Dehmer JJ, Gracz AD, Scull BP, McNaughton K, Magness ST, Lund PK. Activation of two distinct Sox9-EGFP-expressing intestinal stem cell populations during crypt regeneration after irradiation. Am J Physiol Gastrointest Liver Physiol 302: G1111–G1132, 2012. [DOI] [PMC free article] [PubMed] [Google Scholar]
- 83.Veilleux A, Grenier E, Marceau P, Carpentier AC, Richard D, Levy E. Intestinal lipid handling: evidence and implication of insulin signaling abnormalities in human obese subjects. Arterioscler Thromb Vasc Biol 34: 644–653, 2014. [DOI] [PubMed] [Google Scholar]
- 84.Vine DF, Takechi R, Russell JC, Proctor SD. Impaired postprandial apolipoprotein-B48 metabolism in the obese, insulin-resistant JCR:LA-cp rat: increased atherogenicity for the metabolic syndrome. Atherosclerosis 190: 282–290, 2007. [DOI] [PubMed] [Google Scholar]
- 85.Westley RL, May FE. A twenty-first century cancer epidemic caused by obesity: the involvement of insulin, diabetes, and insulin-like growth factors. Int J Endocrinol 2013: 632461, 2013. [DOI] [PMC free article] [PubMed] [Google Scholar]
- 86.Williamson RC. Intestinal adaptation: factors that influence morphology. Scand J Gastroenterol Suppl 74: 21–29, 1982. [PubMed] [Google Scholar]
- 87.Zeki SS, Graham TA, Wright NA. Stem cells and their implications for colorectal cancer. Nat Rev Gastroenterol Hepatol 8: 90–100, 2011. [DOI] [PubMed] [Google Scholar]
- 88.Zoltowska M, Ziv E, Delvin E, Sinnett D, Kalman R, Garofalo C, Seidman E, Levy E. Cellular aspects of intestinal lipoprotein assembly in Psammomys obesus: a model of insulin resistance and type 2 diabetes. Diabetes 52: 2539–2545, 2003. [DOI] [PubMed] [Google Scholar]