

Abstract
The involvement of mammalian target of rapamycin (mTOR) in lifespan control in invertebrates, calorie-restricted rodents, and extension of mouse lifespan by rapamycin have prompted speculation that diminished mTOR function may contribute to mammalian longevity in several settings. We show here that mTOR complex-1 (mTORC1) activity is indeed lower in liver, muscle, heart, and kidney tissue of Snell dwarf and global GH receptor (GHR) gene-disrupted mice (GHR−/−), consistent with previous studies. Surprisingly, activity of mTORC2 is higher in fasted Snell and GHR−/− than in littermate controls in all 4 tissues tested. Resupply of food enhanced mTORC1 activity in both controls and long-lived mutant mice but diminished mTORC2 activity only in the long-lived mice. Mice in which GHR has been disrupted only in the liver do not show extended lifespan and also fail to show the decline in mTORC1 and increase in mTORC2 seen in mice with global loss of GHR. The data suggest that the antiaging effects in the Snell dwarf and GHR−/− mice are accompanied by both a decline in mTORC1 in multiple organs and an increase in fasting levels of mTORC2. Neither the lifespan nor mTOR effects appear to be mediated by direct GH effects on liver or by the decline in plasma IGF-I, a shared trait in both global and liver-specific GHR−/− mice. Our data suggest that a more complex pattern of hormonal effects and intertissue interactions may be responsible for regulating both lifespan and mTORC2 function in these mouse models of delayed aging.
The mammalian target of rapamycin (mTOR) regulates multiple cell processes, including cell division, metabolism, and gene expression, and can regulate the aging process (1–5). mTOR is a serine/threonine kinase that forms the catalytic core of at least 2 complexes, mTOR complex-1 (mTORC1) and mTORC2. mTORC1 responds to nutrient environmental signals by modulation of protein translation (6, 7), cell growth (5, 8, 9), and some stress responses (10–13). Key downstream substrates of mTORC1 include ribosomal protein S6 kinase (S6K) at Thr-389 (pS6K) (6, 7, 14). In turn, activation of S6K leads to phosphorylation of ribosomal protein S6 at Ser-235 (pS6) (15). Another mTORC1 downstream substrate is the eukariotic translation initiation factor binding protein one (4E-BP1), an inhibitor of protein translation that can regulate mitochondrial biogenesis and function (15, 16). Phosphorylation of 4E-BP1 at Thr-37 (p4E-BP1) by mTORC1 leads to increased protein translation and mitochondrial function (17). Therefore, the levels of pS6K, pS6 and p4E-BP1 can be considered markers of mTORC1 activity. In contrast, mTORC2 regulates many other cellular process (for review see Refs. 18, 19), including membrane lipid turnover during stress responses (20, 21). The best-characterized substrate of mTORC2 is phosphorylation of the protein kinase B (AKT) at Ser-473 (pAKT(473)) (19, 22). There is, however, evidence that other kinases can phosphorylate this AKT site, and some authors have suggested that this site may not represent the best indicator of mTORC2 activity (19), arguing for the evaluation of other mTORC2 target sites in assessment of TORC2 activity. Other well-characterized mTORC2 substrates are glucocorticoid kinase-1 (SGK1) at Ser-422 (pSGK) (23), AKT at Ser-450 (pAKT(450)) (24), and the N-myc downstream-regulated gene at Thr-346 (pNDRG) via SGK1 activation (25–27). Therefore, the status of pNDRG, pAKT(450), pAKT(473), and pSGK can be considered markers of mTORC2 activity.
In organisms such as Caenorhabditis elegans and Drosophila melanogaster, inactivation or reduction of mTOR activity results in life span extension (28, 29). Similarly, reduction of mTOR activity in mice by pharmacologic or genetic approaches can increase lifespan, including rapamycin treatments (30), as can reduction in expression of mTOR kinase by hypomorphic mTOR alleles (31). Furthermore, it has been shown that a deletion of the S6K1 gene can also extend lifespan in mice, although apparently only in females (32). These data support models in which mTORC1 activity plays a critical role in regulating the rate of aging. The molecular mechanisms by which reduction in mTORC1 extends mouse lifespan, however, are not well understood, and it is unclear whether altering mTORC1 activity in specific tissues (such as the liver) can also extend lifespan. In contrast, the role of mTORC2 as a regulator of aging is unknown. Liver-specific rictor gene disruption, affecting mTORC2, leads to abnormal glucose metabolism (33), whereas muscle-specific rictor gene disruption has no apparent phenotype (34, 35). Our data have suggested that increased mTORC2 activity in cluster of differentiation 4 helper lymphocytes (CD4 T cells) may be a key mechanism underlying the age-related defects in immune function (36), suggesting that mTORC2 might play a critical role in age-related diseases and may be involved in regulating aspects of lifespan extension.
A loss-of-function mutation at the pituitary specific positive transcription factor 1 (Pit-1) locus, which regulates development of the pituitary gland and diminishes production of GH, TSH, and prolactin (Snell dwarf mice, DW), as well as genetic disruption of the GH receptor (GHR)/binding protein gene (GHR−/−) can prolong lifespan (37–43). The DW mutation (Pit1) has been reported to increase the mean, median, and maximum lifespan, ranging from 25% to 50%, in both male and female DW mice (44–49). The GHR−/− mutation also leads to an increase in the average, median, and maximum lifespans for both male and female mice (37, 43). The GHR−/− and Snell mice differ in background genes and in the deficit in prolactin and thyroid hormones seen in the Snell mice only but share deficits in GH action and IGF-I levels that are thought to produce similar changes in gene expression and metabolism that lead, through unknown pathways, to extended lifespan (see reviews in Refs. 50–54). The recent construction of mice with liver-specific disruption of GHR (LiGHR−/−) provides a new opportunity to evaluate the role of alterations in hepatic function, including IGF-I production, in mouse aging. LiGHR−/− mice have been shown to have changes in circulating insulin/IGF similar to those seen in mice with a global defect in GHR (55). However, studies of the effects of the LiGHR−/− on mTOR activity and lifespan extension have not been reported.
Thus, the invertebrate data, in combination with the longevity tests in GHR−/−, Ames, Snell, and Ghrh−/− mice (56), suggest that low levels of circulating GH and/or IGF are central in modulating the aging process in multiple tissues (50), but the fundamental intracellular pathways underlying lifespan extension remain unclear. It seems likely that changes in mTOR may play a role in the extended lifespan of these mutant mice (29). Activity of mTOR, measured by level of phosphorylation of the mTOR protein, was found to be diminished in liver of DW mice (57), but this earlier study did not evaluate substrates of mTORC2, or the effects of food consumption or look at nonhepatic tissues. Here, we studied the effect of fasting and feeding on the regulation of mTORC1 and mTORC2 in DW, GHR−/−, and LiGHR−/− mice. We expected, based on previous studies (37, 38, 58), that mTORC1 activity would be diminished in multiple tissue of both Snell and GHR−/−, and our findings were consistent with this idea. More surprisingly, we also found a consistent increase in phosphorylation of mTORC2 substrates, suggesting a higher mTORC2 activity during fasting, and alterations in the responsiveness of mTORC2 during feeding the slow-aging models. Furthermore, we found that liver-specific disruption of GHR (LiGHR−/−) does not lead either to increased lifespan, or to changes in mTOR signaling, implicating interactions among tissues rather than strictly hepatic modulation in lifespan and cellular metabolic endpoints.
Materials and Methods
Reagents and fasting and feeding conditions
DW and wild-type (WT) littermate control mice were produced by a cross between (DW/J × C3H/HeJ)-dw−/+ heterozygous parents, and maintained as described (58–61). The GHR−/− and littermate controls (WT) were produced by crossing the GHR−/− stocks (on a C57BL/6 background) as previously described (42); these heterozygote F1 mice were then crossed to generate homozygous gene-disrupted mice as well as littermate controls. The LiGHR−/− were produced as previously described (55). LiGHR−/− mice were generated directly in a C57BL/6 background and maintained in the same C57BL/6 background. All experiments conformed to institutional, national standards and the University of Michigan's Committee or Ohio University's Committee on Use and Care of Animals. Sentinel animals were examined quarterly for evidence of viral infection; all tests were negative. Mice used in the experimental determination of mTOR activity were fasted for 18 hours (fasted mice) or, after 18 hours of fasting, were fed ad libitum with a regular chow diet for 6 hours (fed mice). All mice had free access to water during the course of treatments. Chemical reagents were purchased from Sigma. Flow cytometry antibodies were purchased from Biolegends or Becton Dickson. Antibodies and phospho-specific rabbit antibodies were purchased from Cell Signaling, except the goat anti-NDRG and anti-pSGK1, which were obtained from Santa Cruz Biotechnology, Inc and the anti-SGK from GeneTex.
Liver-specific gene disruption of GHR
Liver-specific GHR−/− mice and littermate controls were generated by breeding conditional floxed GHRflox/flox mice in a C57BL/6 background to B6.Cg-Tg(alb-cre)21Mgn/J mice in a C57BL/6 background purchased from The Jackson Laboratory at Ohio University's animal facility as previously described (55). B6.Cg-Tg(alb-cre)21Mgn/J mice are transgenic for the bacteriophage P1 Cre-recombinase gene with expression under the control of the mouse albumin enhancer/promoter (61).
Tissue preparation, intracellular staining, and Western blot analysis
The brain cortex, gastrocnemius and upper leg skeletal muscles, heart, kidneys, liver, and spleen were harvested from young adult male and female mice (ranging from 5 to 6 mo of age). Tissues were frozen with liquid nitrogen and stored at −70°C with the exception of the spleen (see below). Tissues were processed, cell lysates were obtained, and equal amounts of protein were loaded for Western blot analysis. CD4 T cells from the spleen were processed on the same day as tissue extractions; then intracellular staining and flow cytometry were performed as we described (36).
Statistical analysis
Unless otherwise indicated, results are presented as mean ± SEM. Statistical tests for genotype, fasting and fed condition (nutritional), or interaction effects were assessed by two-way ANOVA using P = .05 as the threshold of significant effects. To compare specific effects between groups, an unpaired parametric t test was used with a P = .05 as the criterion for significance.
Results
mTORC1 activity is reduced in multiple tissues of DW and GHR−/− mice
To determine whether DW mice differed from controls in mTORC1 activity, we evaluated mice in 2 conditions: 18 hours of fasting or after 18 hours of fasting followed by 6 hours of free access to food. Figure 1A shows a representative result from liver tissue of phosphorylated vs total S6, S6K, and 4E-BP1 ratios as indicators of mTORC1 activity, and Figure 1B shows average values from a series of experiments involving 16 mice per group, half males and half females. The top row of Table 1 summarizes the results for this pS6 dataset, presented as the effects attributable to the genotype or to the fasting vs feeding condition. In the fasted condition, WT mice had 2.2-fold significant higher levels of pS6 (expressed as the phosphorylation ratio respective to total S6 protein, P < .01) with respect to DW mice. In the fed condition, WT mice had a significant 2.4-fold higher pS6 levels with respect to DW mice. Both WT and DW mice showed the expected increase in pS6 in response to feeding, with increases of 11.6- and 10.4-fold, respectively. A two-factor ANOVA, summarized in the last column of Table 1, confirmed the significant effect of the Snell Pit-1 mutation (genotype effects, WT > Snell) and feeding (nutritional effects, fed > fasting) but not a significant interaction factor; in other words, both WT and Snell mice responded to feeding with equal proportional increases in pS6. Furthermore, comparative analysis of pS6 between males and females for each group does not shown significant differences, suggesting that sexual dimorphism does not play a role in the outcomes (data not shown).
Figure 1.
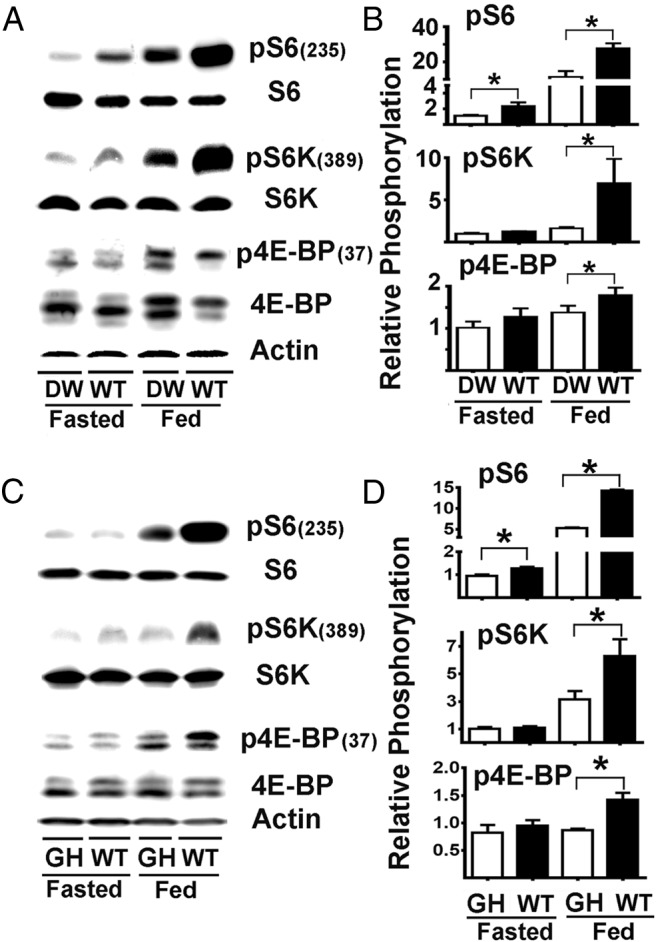
mTORC1 activity is diminished in liver of DW and GHR−/− mice. A, Representative Western blots showing the phosphorylation status for S6, S6K, and 4E-BP1 in liver samples from DW and control littermates (WT) under fasting (fasted) or fed (fed) conditions. B, Quantification of pS6, pS6K, and p4E-BP1 phosphorylation ratios from 3 independent experiments. C, Representative Western blots showing the phosphorylation status for S6, S6K, and 4E-BP1 in liver samples from GHR−/− (GH) and control litter mates (WT) under fasted or fed conditions. D, Quantification of pS6, pS6K, and p4E-BP1 phosphorylation ratios. Each bar represents the mean ± SEM from a total of 16 mice (8 females and 8 males) per group and normalized to the ratio found in fasted DW or GHR−/−, respectively, samples. An asterisk indicates statistical significance relative to the fasting DW or GHR−/− from each group.
Table 1.
Effects of Genotype and Feeding on the Ratio of pS6 to Total S6 in Different Tissues From DW (Mut) and GHR−/− (Mut) Mice Compared With Control Mice (WT)
| Tissue | Pro. | Genot. | WT/Mut (Fasted) | WT/Mut (Fed) | Fed/Fasted (Mutant) | Fed/fasted (WT) | ANOVA |
|---|---|---|---|---|---|---|---|
| Liver | pS6 | Snell | 2.2b | 2.4b | 10.4b | 11.6c | G + N |
| GHR−/− | 1.4a | 2.7c | 5.6c | 11.1c | G + N + Int | ||
| Skeletal muscle | pS6 | Snell | 2.0b | 2.0b | 3.1b | 3.1c | G + N |
| GHR−/− | 3.2a | 3.0c | 3.3a | 4.3c | G + N | ||
| Heart | pS6 | Snell | 2.3c | 4.1c | 2.2a | 3.9c | G + N |
| GHR−/− | 1.4 | 1.6b | 2.8b | 3.2c | G + N | ||
| Kidneys | pS6 | Snell | 1.6a | 2.1a | 3.2b | 4.7c | G + N |
| GHR−/− | 1.4b | 1.9b | 4.3b | 6.0c | G + N |
Values represent the mean fold change between compared groups. Unpaired t tests were used on untransformed data to compare individual groups. Two-way ANOVA was used to test the genotype (G, P < 0.05), nutritional (N, P < 0.05) and interaction (Int, P < 0.05) effects using log-transformed values.
P < 0.05.
P < 0.01.
P < 0.001.
As a separate test of mTORC1 activity, we evaluated pS6K in liver, as shown in the middle panel of Figure 1B. Data are summarized in the top row of Table 2. We found that pS6K ratios were similar in fasted WT and Snell mice, but after the mice were fed, these ratios increased 5-fold in the WT mice and only 1.5-fold in the DW liver. ANOVA confirmed the significant effects of genotype (WT > Snell) and feeding (fed > fasting). The pS6K interaction term was also significant (P < .05), showing that WT mice respond more dramatically to feeding than DW mice. The bottom panel of Figure 1B shows the results for 4E-BP1 phosphorylation (summarized in the top row of Supplemental Table 1). For liver, WT mice had higher levels of p4E-BP1 only in the fed state. Two-factor ANOVA showed significant effects of both genotype (WT > Snell) and feeding (fed > fasting). We found no differences in the expression of S6, S6K, or 4E-BP protein among any of the groups (data not shown), suggesting that the genotype or nutritional effects are not the result of changes in the expression of mTORC1 substrates.
Table 2.
Effect of Genotype and Feeding on the Ratio of pS6K to Total S6K in Different Tissues From DW and GHR−/− (Mut) Mice Compared With Control Mice (WT)
| Tissue | Pro. | Genot. | WT/Mut (Fasted) | WT/Mut (Fed) | Fed/Fasted (Mutant) | Fed/Fasted (WT) | ANOVA |
|---|---|---|---|---|---|---|---|
| Liver | pSK6 | Snell | 1.2 | 4.1a | 1.5b | 5.3a | G + N + Int |
| GHR−/− | 1.1 | 2.0a | 3.2b | 5.8b | G + N + Int | ||
| Skeletal muscle | pSK6 | Snell | 1.1 | 1.4c | 1.4a | 1.8c | G + N + Int |
| GHR−/− | 1.5 | 1.9a | 1.6a | 2.1b | G + N | ||
| Heart | pSK6 | Snell | 1.2 | 1.5b | 1.4 | 1.7c | G + N |
| GHR−/− | 1.9 | 1.7b | 1.2b | 1.2a | G + N | ||
| Kidneys | pSK6 | Snell | 1.2 | 1.6a | 1.4c | 1.8a | G + N |
| GHR−/− | 1.3 | 2.1b | 1.0 | 1.7a | G + N + Int |
Values represent the mean fold change between compared groups. Statistical analysis was performed as described in Table 1.
P < 0.05.
P < 0.01.
P < 0.001.
GHR−/− mice, like DW mice, have low IGF-I, diminished activity of GH, and extended lifespan (54). Unlike Snell mice, however, they do not have dramatic diminution of TSH, prolactin, or thyroid hormones. We hypothesize that lower mTORC1 function observed in the liver of Snell mice was replicated in GHR−/− mice. To test this hypothesis, we evaluated several indices of mTORC1 activity in liver (Figure 1, C and D); the statistical analysis is shown in the second lines of Tables 1 and 2. The pattern of results for liver of GHR−/− mice was quite similar to that seen in the DW animals: lower levels of pS6, pS6K, and in the case of p4E-BP1 as shown in Supplemental Table 1. After feeding, a low levels of pS6 was observed in the fasting mice as well. The interaction effect showed a significantly stronger response to feeding in the WT mice with respect to GHR−/− mice for pS6 and pS6K but not for p4E-BP1.
Tables 1 and 2 also summarize a series of similar experiments performed on skeletal muscle, heart, and kidney tissue from the same set of mice used for the tests of liver tissue. S6 phosphorylation (Table 1) in all these tissues showed essentially the same result as seen in the liver: lower levels in Snell and GHR−/− mice in the fasting state (statistically significant except for the hearts of GHR−/− mice), strong responses to feeding in each tissue for both mutants and controls, and significantly lower levels of pS6 in Snell and GHR−/− mice after feeding for all 3 tissues. pS6K (Table 2) followed a similar pattern as seen in the liver, with significantly lower ratios of pS6K in both Snell and GHR−/− mice after feeding, and smaller but statistically insignificant differences in the fasted state. The effect of feeding on pS6K was higher in WT mice than in Snell or GHR−/− mice for all 4 tissues and reached statistical significance in some cases (Snell liver and muscle; GHR−/− liver and kidney) but not in others. The data on p4E-BP1 show the expected response to feeding for all tissues and lower levels after feeding for Snell and GHR−/− tissues (Supplemental Table 1). Thus, the dataset as a whole suggests a lower mTORC1 activity in liver, muscle, heart, and kidney of 2 different types of long-lived mice, particularly in response to feeding after an overnight fast.
Lower mTORC1 activity is not a universal characteristic of all tissues in Snell and GHR−/− mice. As shown in Supplemental Table 3, we found no effect of either mutation on ratios of pS6, pS6K, and p4E-BP1 in the brain cortex in either the fasted or fed state. This result suggests that mTORC1 activity in the brain is isolated from hormonal effects. These findings are consistent with previous results showing that the brain of GHR−/− is also protected from genetic effects in the ERK and IGF/insulin pathways (43). We also observed a decline in the ratio of pS6 to S6 protein in CD4 T lymphocytes cells from DW and GHR−/− mice (Supplemental Table 3), but these were attributable to increases in the total amount of S6. We saw no effect of feeding on the pS6 ratio in CD4 T cells. The implications of these changes for T-cell immunity deserve further study.
mTORC2 activity is enhanced in multiple tissues of DW and GHR−/− mice
There is little information about how mTORC2 activity is regulated in different murine tissues and the response of mTORC2 to fasting and refeeding. To see whether the Snell mutation altered the activity of mTORC2 in the liver, we conducted experiments as shown in Figure 2A but using pNDRG, pAKT(450), pSGK, and pAKT(473) as indices of mTORC2 activity (19, 25, 62). The average ratio of phosphorylation for each of these proteins in liver is shown in Figure 2, and statistical results are summarized in the top row of Tables 3–5. In contrast to the results for mTORC1 substrates, we noted that in the fasting condition the livers of DW mice had a significantly higher level of phosphorylation for pNDRG, pSGK, and pAKT(450). In addition, DW mice differed from controls in the response to feeding: feeding decreased phosphorylation of each of these 3 substrates for Snell but not control mice. Formal analysis by ANOVA showed significant interaction terms for pNDRG and pGSK ratios (Tables 3 and 4, respectively), confirming the differential responses to feeding for these substrates and suggesting differences in response of mTORC2 to food in Snell and GHR−/− mice with respect to control. The pattern of responses for pAKT(473), summarized in Supplemental Table 2, was entirely different from the phosphorylation responses for pNDRG, pAKT(450), and pSGK. For pAKT(473), Snell and control mice did not differ in the fasting state, and the response to feeding, for each tissue, was higher in control mice than in Snell mice. The disparity between the results seen with AKT(473) and the other mTORC2 substrates will be discussed further, below.
Figure 2.
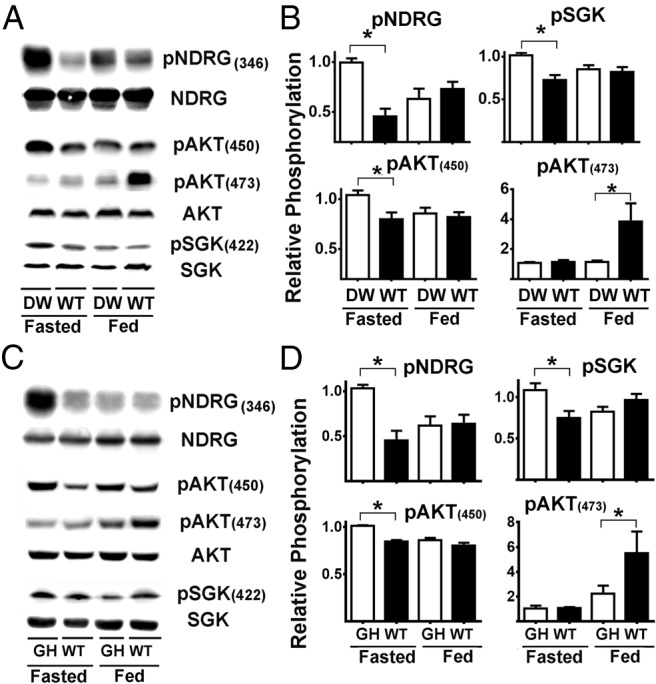
mTORC2 is differentially regulated in liver of DW and GHR−/− mice. A, Representative Western blottings showing the phosphorylation status for NDRG, SGK, AKT at (450), and AKT at (473) in liver samples from DW and control litter mates (WT) under fasted or fed condition. B, Quantification of pNDRG, pSGK, and pAKT (450) and (473) ratios. C, Representative Western blottings showing the phosphorylation status for NDRG, SGK, AKT at (450), and AKT at (473) in liver samples from GHR−/− (GH) and control litter mates (WT) under fasted or fed condition. D, Quantification of pNDRG, pSGK, and pAKT (450) and (473) ratios. All bar graph represents the mean ± SEM of 3 experiments, from a total of 16 mice (8 females and 8 males), after normalization to the ratio of fasted DW or GHR−/−, respectively, samples. An asterisk indicates statistical significance relative to the fasting DW or GHR−/− from each group.
Table 3.
Effect of Genotype and Feeding on the Ratio of pNDRG to Total NDRG in Different Tissues From DW and GHR−/− (Mut) Mice Compared With Control Mice (WT)
| Tissue | Pro. | Genot. | WT/Mut (Fasted) | WT/Mut (Fed) | Fed/Fasted (Mutant) | Fed/Fasted (WT) | ANOVA |
|---|---|---|---|---|---|---|---|
| Liver | pNDRG | Snell | 0.46a | 1.2 | 0.63b | 1.6a | G + Int |
| GHR−/− | 0.44b | 1.0 | 0.60b | 1.4 | G + Int | ||
| Skeletal muscle | pNDRG | Snell | 0.59c | 0.7 | 0.78b | 1.0 | G + Int |
| GHR−/− | 0.57b | 1.0 | 0.49c | 1.0 | G + N + Int | ||
| Heart | pNDRG | Snell | 0.47c | 0.7 | 0.63b | 1.0 | G + N + Int |
| GHR−/− | 0.59b | 1.2 | 0.58b | 1.2 | G + N + Int | ||
| Kidneys | pNDRG | Snell | 0.48c | 1.0 | 0.55c | 1.0 | G + N + Int |
| GHR−/− | 0.59c | 1.0 | 0.63b | 1.0 | G + N + Int |
Values represent the mean fold change between compared groups. Statistical analysis was performed as described in Table 1.
P < 0.05.
P < 0.01.
P < 0.001.
Table 4.
Effect of Genotype and Feeding on the Ratio of pSGK to Total SGK in Different Tissues From DW and GHR−/− (Mut) Mice Compared With Control Mice (WT)
| Tissue | Pro. | Genot. | WT/Mut (Fasted) | WT/Mut (Fed) | Fed/Fasted (Mutant) | Fed/Fasted (WT) | ANOVA |
|---|---|---|---|---|---|---|---|
| Liver | pSGK | Snell | 0.71c | 1.0 | 0.83a | 1.1 | G + Int |
| GHR−/− | 0.69a | 1.2 | 0.76a | 1.3 | G + Int | ||
| Skeletal muscle | pSGK | Snell | 0.60b | 1.0 | 0.56b | 1.0 | G + N |
| GHR−/− | 0.62a | 1.7 | 0.59a | 1.6 | G + Int | ||
| Heart | pSGK | Snell | 0.78a | 1.0 | 0.80 | 1.0 | G |
| GHR−/− | 0.74a | 1.1 | 0.79a | 1.2 | G + Int | ||
| Kidneys | pSGK | Snell | 0.54b | 1.0 | 0.73a | 1.4 | G |
| GHR−/− | 0.44b | 1.5 | 0.33c | 1.1 | G + N + Int |
Values represent the mean fold change between compared groups. Statistical analysis was performed as described in Table 1.
P < 0.05.
P < 0.01.
P < 0.001.
Table 5.
Effect of Genotype and Feeding on the Ratio of pAKT(450) to Total AKT in Different Tissues From DW and GHR−/− (Mut) Mice Compared With Control Mice (WT)
| Tissue | Pro. | Genot. | WT/Mut (Fasted) | WT/Mut (Fed) | Fed/Fasted (Mutant) | Fed/Fasted (WT) | ANOVA |
|---|---|---|---|---|---|---|---|
| Liver | pAKT (550) | Snell | 0.76a | 1.0 | 0.82a | 1.0 | G |
| GHR−/− | 0.84c | 1.0 | 0.85b | 1.1 | G + N + Int | ||
| Skeletal muscle | pAKT (550) | Snell | 0.69b | 0.9 | 0.76a | 0.9 | G |
| GHR−/− | 0.61b | 1.1 | 0.66b | 1.1 | G + Int | ||
| Heart | pAKT (550) | Snell | 0.64b | 1.0 | 0.71b | 1.1 | G + N + Int |
| GHR−/− | 0.67b | 1.0 | 0.77b | 1.2a | G + Int | ||
| Kidneys | pAKT (550) | Snell | 0.73c | 1.0 | 0.70b | 1.0 | G + N + Int |
| GHR−/− | 0.64b | 0.9 | 0.69b | 1.0 | G + N |
Values represent the mean fold change between compared groups. Statistical analysis was performed as described in Table 1.
P < 0.05.
P < 0.01.
P < 0.001.
Livers of GHR−/− mice had a pattern of responses very similar to those noted for the DW mice (Figure 2, C and D, and second lines of Tables 3–5): GHR−/− mutant mice had elevated levels of pNDRG, pSGK, and pAKT(450) under fasting conditions and declines after feeding, and only control mice responded to feeding with increased ratios of pAKT(473). Tables 3–5 also summarize the results for muscle, hearts, and kidney tissue of DW and GHR−/− mice. Responses of pNDRG, pSGK, and pAKT(450), in the fasted condition, were higher for mutant mice of both genotypes in each of the 4 tested organs. Feeding diminished phosphorylation of these 3 mTORC2 substrates in all 4 organs in both genotypes, and this response to feeding was not observed for the control mice in any of the organs tested. Similarly, the increase in pAKT(473) in response to feeding was only seen in the control mice but not in the long-lived mutants. Formal significance for this difference in response to feeding, evaluated by the interaction term in ANOVA (Tables 3–5), was seen for ratios of pNDRG (all tissues for both genotypes) and pSGK (all tissues for GHR−/− mice, and liver for Snell mice), and in some conditions for pAKT(450) (Snell mice hearts and kidneys, GHR−/− mice livers, muscles, and hearts). Again, the response of pAKT(473) to feeding was quite different. Responses to feeding were smaller for Snell and GHR−/− mice than for WT mice, in most cases failed to reach statistical significance in the mutants (Supplemental Table 2). Formal interaction effects, testing genotype differences in response to feeding, were noted in Snell mice for muscle and kidney, and in the GHR−/− mice for kidney. Brain cortex and CD4 T cells (Supplemental Table 3) showed no effects of genotype or feeding on any of these mTORC2 substrates, suggesting that mTORC2 is not affected in brain.
Liver-specific gene disruption of GHR does not affect lifespan or mTOR activity
A mouse strain in which GHR is disrupted only in the liver (LiGHR−/−) has been shown (55) to have 90% lower levels of serum IGF-I, higher levels of IGF-I in some nonhepatic tissues, and altered profiles of adipokines. Consistent with the role of IGF-I in growth regulation, these mice are lighter and smaller than controls and have 3 times higher levels of GH, consistent with disruption of feedback regulation by IGF-I of GH production. Liver tissue of LiGHR−/− mice shows altered patterns of expression of genes related to xenobiotic metabolism that reflect a mixture of direct effects of GH on liver and indirect effects mediated by GH or IGF-I on other organs (63). The decline in GH response and in serum IGF-I suggested that LiGHR−/− mice might prove to be long lived. Unexpectedly, as shown in Figure 3, two independent lifespan experiments, one conducted at the University of Michigan and the other at Ohio University, have shown no evidence that LiGHR−/− mice have increased lifespan compared with multiple controls. The Michigan experiment compared LiGHR−/− mice with controls with neither Cre nor flox-GHR alleles; thus, these negative controls were pooled from 3 separate control stocks (the LiGHR−/− stock, a stock in which GHR was disrupted in adipose tissue [64], and a stock in which GHR was deleted from skeletal muscle). There were no significant differences among the 3 varieties of control mice, which were therefore pooled for comparison with LiGHR−/− mice and for the plot shown in Figure 3. The Ohio experiment included 3 varieties of LiGHR−/− littermate control mice (mice with albumin-Cre alone, mice with 2 copies of the flox-GHR allele, and mice with neither construct); again, there were no significant differences among these control groups, and the 3 controls were pooled for analysis. We also conducted a separate analysis of male and female mice and found no effect of LiGHR−/− on survival in either sex (data not shown). Evaluation of GHR mRNA by quantitative RT-PCR showed a decline of at least 90% in liver tissue of mice at each university (55 and data not shown).
Figure 3.
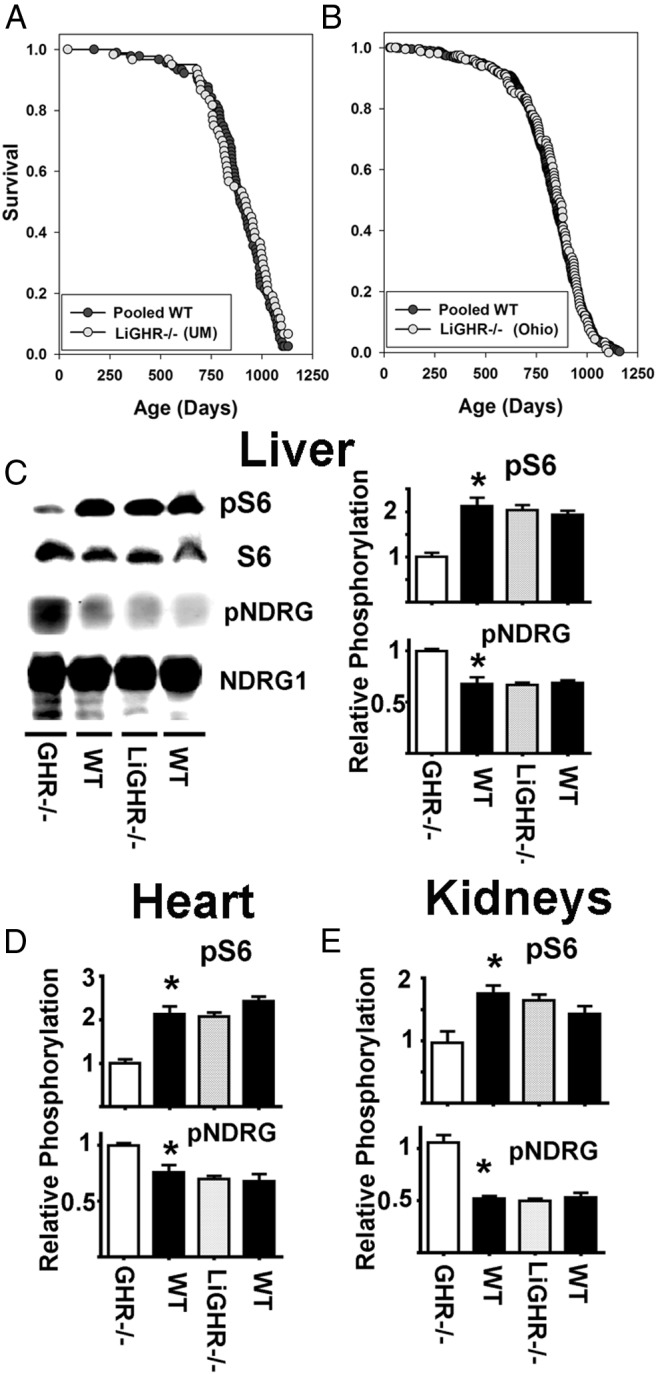
No lifespan extension or changes in mTOR activity in the liver-specific GHR−/− mice. A, Kaplan-Meier survival curves for combined male and females WT (•) and LiGHR−/− (○) at University of Michigan site (UM). B, Kaplan-Meier survival curves for combined male and females WT (•) and LiGHR−/− (○) at the Ohio University site (OH). LiGHR−/− and controls were in a C57BL/6 background. C, Representative Western blottings showing the phosphorylation status for pS6 (for mTORC1) and pNDRG (mTORC2) in liver samples from GHR−/−, LiGHR−/−, and respective control litter mates (WT) under fasting condition. The bar graph represents the mean ± SEM of 3 experiments, from a total of 12 mice (6 females and 6 males), after normalization to the GHR−/− samples. An asterisk indicates statistical significance relative to the GHR−/−, whereas no significant differences were seen comparing LiGHR−/− with their controls. D and E show parallel results for heart and kidney, respectively.
To determine whether LiGHR−/− mice showed the same changes in hepatic mTORC1 and mTORC2 seen in GHR−/− mice, we evaluated pS6 and pNDRG in liver, kidneys, and heart under fasting conditions, with results shown in Figure 3, C–E. As expected, concurrent experiments using liver of global GHR−/− mice show lower levels of mTORC1 action (pS6) and higher levels of mTORC2 function (pNDRG) in all 3 organs. In contrast, we found no differences between LiGHR−/− and control mice in either endpoint in any of the other 3 tissues. These results suggest that the changes in mTORC1 and mTORC2 and longevity are not due to the loss of GH-induced signals in the liver alone or just a simple decline in plasma IGF-I levels.
Discussion
In lower organisms, such as fruit flies and nematodes, low levels of circulating insulin/IGF can extend lifespan (52, 65). In mammals, lower circulating IGF-I levels have also been implicated in extending lifespan (for review see Refs. 50, 51). However, plasma IGF-I levels also influence a range of intracellular signaling pathways affecting metabolism, gene expression, mitochondria function, and mTOR, and it is not well understood which of these specific changes contribute to lifespan extension. The potential importance of mTOR in regulation of aging in mice has been suggested by studies of calorie-restricted mice, and by the beneficial effects on longevity of the mTOR inhibitor rapamycin (for a review see Refs. 66, 67). There is little previous information about mTORC1 activity in tissues from the DW and GHR−/− mice, or the responses of mTORCs to food availability. Our results on pS6 suggest that mTORC1 activity is down-regulated in liver, kidney, heart, and muscle of DW and GHR−/− mice (Figure 1). Similar results are seen for pS6K and p4E-BP1 after feeding, although under fasting conditions these substrates show smaller effects that do not reach statistical significance. Phosphorylation of these mTORC1 substrates under fasted condition is quite low, complicating quantification and analysis. It is possible that some of the changes we see are the result of alteration of kinases from mTORC1 independent pathways. Nevertheless, there is evidence that mTORC1 can down-regulate mTORC2 activity in vitro and in vivo (67), and our overall data suggest that a lower mTORC1 activity contributes to extended lifespan in these 2 long lived models perhaps mediated by, or in conjunction with, changes in other signaling pathways (67). Furthermore, results from our laboratory have shown that DW and GHR−/− mice also exhibit enhanced activation transcription factor (ATF-4) expression (68). Higher ATF-4 expression has been associated with lower mTORC1 activity (69, 70), and our data are consistent with these results. Interestingly, we did not see genetic or nutritional effects on mTORC1 activity in brain cortex (Supplemental Table 1), but fine-scale analysis of specific brain regions will test whether modulation of mTORC1 function in specific regions of the brain could contribute to slower aging and extended lifespan in these mice.
In cell lines, mTORC2 regulates many important cellular processes (18, 19, 71); however, the role of mTORC2 in tissue physiology and in aging is not understood. Our data in lymphocytes have suggested that increases in mTORC2 activity are responsible for the age-related defects in cytoskeleton dynamics and T-cell receptor signaling of CD4 T cells (36). Data presented here on liver, muscle, heart, and kidney show that during fasting, many mTORC2 substrates are highly phosphorylated, as measured by pNDRG, pAKT(450), and pSGK. These suggest a higher mTORC2 activity for the DW and GHR−/− mice (Tables 2–5). Unexpectedly, we found that feeding may lead to a decline in mTORC2 activity in DW and GHR−/− mice, although not in littermate controls, suggesting a distinct mTORC2 regulatory mechanism or an interaction of multiple pathways, potentially including some that are mTORC2 independent, in these slow-aging mice. It would be interesting to test whether calorie restriction, a well-known mechanism of lifespan extension, can also regulate mTORC2 activity as it does in the DW and GHR−/− mice. In addition, it would also be interesting to examine whether mTORC2 activity is affected by drugs or diets (72, 73) that lead to lifespan extension in males, females, or both sexes.
It has been suggested based on phosphorylation of AKT at 473 that mTORC2 activity may increase after feeding (68, 74). Our own data for control mice (Supplemental Table 2) are consistent with these observations. Our results for pAKT(473) are, however, different from those we see using 3 alternative and well-characterized mTORC2 substrates (Tables 3–5). We therefore think it is likely that the phosphorylation at pAKT(473) may be also regulated, in a variety of mouse tissues, by pathways independent of mTORC2. It is also possible that small changes in mTORC2 are easier to detect using the pNDRG, pSGK, and pAKT(450) endpoints than using pAKT(473) as an index of mTORC2 activity. Our preferred interpretation, involving elevated mTORC2 activity in tissues of the long-lived mutant mice, is consistent with recent data and models, suggesting a negative feedback loop between mTORC1 and mTORC2 (26, 75, 76). In these other systems, enhancing mTORC1 during feeding leads to phosphorylation of stress-activated protein kinase interacting protein (Sin-1) and declines in mTORC2 activity by dissociation of the mTORC2 complex. This hypothesis can be further tested when liver-specific rictor conditional deletion mutants are obtained in GHR−/− and DW mice. Overall, our data also suggest that mTORC1 and mTORC2 are often modulated in opposite directions in specific mammalian tissues. We hypothesize that when mTORC1 is reduced (by genetic or pharmacologic interventions), there is a concomitant increase in mTORC2, leading to metabolic changes and perhaps enhanced stress resistance observed in some varieties of long-lived mice. In addition, DW and GHR−/− mice show effects of feeding on mTORC2 action that are not seen in control mice (Tables 3–5), suggesting a unique mode of mTORC2 regulation that could contribute to delayed aging.
NDRGs are a family of ubiquitously expressed proteins (77–79) that are highly responsive to stress signals, including DNA damage and hypoxia (80, 81). NDRG expression is implicated DNA repair and in cancer progression by regulating differentiation, inhibiting growth, metastasis, and angiogenesis (82–85). The high level of pNDRG in the DW and GHR−/− mice suggests that some of the stress resistance and delay in cancer metastasis found in these mice might be the results of mTORC2 effects on NDRG action.
The development of LiGHR−/− mice (55) provides an opportunity to test the role of the liver, and IGF-I produced in the liver, in the physiology of Snell and GHR−/− mice. We report here, based on 2 separate experiments conducted in different locations, that LiGHR−/− mice do not appear to be long lived. Because plasma IGF-I levels are 90% lower in LiGHR−/− mice than in controls, the lack of a lifespan effect hints that GH effects other than a simple modulation of plasma IGF-I may be involved in the longevity of Snell, Ames, and GHR−/− mice. We have also found that the changes in mTORC1 and mTORC2 activity in liver, kidney, and heart of GHR−/− and Snell mice are not seen in LiGHR−/− mice, suggesting that they are not due to the lack of effects of GH on hepatocytes, nor on the level of plasma IGF-I, which might have been thought to be a principal mediator of GH effects on muscle and kidney. In addition, our data are in good agreement with recent results (86), suggesting that LiGHR−/− does not lead to changes in the expression of apoptosis-related genes seen in the global GHR−/−. It has been found that adiponectin can lower mTORC1 activity (87), suggesting that the changes in mTOR signaling and lifespan in GHR(−/−) and Snell mice could reflect a combination of direct effects of GH and IGF-I, combined with indirect effects mediated by adipokines and/or other hormones altered in these long-lived mutant mice. Contrasts between GHR(−/−) and LiGHR(−/−) mice in their patterns of hormones and endocrine sensitive cellular responses, and responses to diets and drugs that extend lifespan in mice, may shed further light on the pathways by which changes in cell biology and neuroendocrine physiology alter health status, disease risks, and lifespan in mice.
Acknowledgments
We thank Amanda Keedle, Lynn Winkelman, Sabrina Van Roekel, Brenna Turner, and Stephanie Fotui for technical assistance and Dr Andrzej Bartke for helpful suggestions.
This work was supported by National Institutes of Health Grants AG031736 and AG019899 and the University of Michigan Nathan Shock Center for the Biology of Aging Grant AG013283.
Disclosure Summary: The authors have nothing to disclose.
Footnotes
- AKT
- protein kinase B
- DW
- Snell dwarf
- 4E-BP1
- IF4E-binding protein
- GH
- GHR−/−
- GHR
- GH receptor
- LiGHR−/−
- liver-specific disruption of GHR
- mTOR
- mammalian target of rapamycin
- mTORC1
- mTOR complex-1
- mTORC2
- mTOR complex-2
- pS6K
- phosphorylation of ribosomal protein S6 kinase at Thr-389
- pS6
- phosphorylation of ribosomal protein S6 at Ser-235
- p4E-BP1
- phosphorylation of 4E-BP1 at Thr-37
- pAKT(450)
- AKT at Ser-450
- pAKT(473)
- phosphorylation of AKT at Ser-473
- pNDRG
- N-myc downstream-regulated gene at Thr-346
- pSGK
- phosphorylation of glucocorticoid kinase-1 at Ser-422
- S6K
- S6 kinase
- WT
- wild type
- (Mut)
- mutant mice corresponding to Snell Dwarf or GHR−/− models.
References
- 1. Evans DS, Kapahi P, Hsueh WC, Kockel L. TOR signaling never gets old: aging, longevity and TORC1 activity. Ageing Res Rev. 2011;10(2):225–237. [DOI] [PMC free article] [PubMed] [Google Scholar]
- 2. Gough NR. Focus issue: TOR signaling, a tale of two complexes. Sci Signal. 2012;5(217):eg4. [DOI] [PubMed] [Google Scholar]
- 3. Katewa SD, Kapahi P. Role of TOR signaling in aging and related biological processes in Drosophila melanogaster. Exp Gerontol. 2011;46(5):382–390. [DOI] [PMC free article] [PubMed] [Google Scholar]
- 4. Pani G. From growing to secreting: new roles for mTOR in aging cells. Cell Cycle. 2011;10(15):2450–2453. [DOI] [PubMed] [Google Scholar]
- 5. Zoncu R, Efeyan A, Sabatini DM. mTOR: from growth signal integration to cancer, diabetes and ageing. Nat Rev Mol Cell Biol. 2011;12(1):21–35. [DOI] [PMC free article] [PubMed] [Google Scholar]
- 6. Hanrahan J, Blenis J. Rheb activation of mTOR and S6K1 signaling. Methods Enzymol. 2006;407:542–555. [DOI] [PubMed] [Google Scholar]
- 7. Magnuson B, Ekim B, Fingar DC. Regulation and function of ribosomal protein S6 kinase (S6K) within mTOR signalling networks. Biochem J. 2012;441(1):1–21. [DOI] [PubMed] [Google Scholar]
- 8. Saci A, Cantley LC, Carpenter CL. Rac1 regulates the activity of mTORC1 and mTORC2 and controls cellular size. Mol Cell. 2011;42(1):50–61. [DOI] [PMC free article] [PubMed] [Google Scholar]
- 9. Zhou H, Huang S. Role of mTOR signaling in tumor cell motility, invasion and metastasis. Curr Protein Pept Sci. 2011;12(1):30–42. [DOI] [PMC free article] [PubMed] [Google Scholar]
- 10. Robida-Stubbs S, Glover-Cutter K, Lamming DW, et al. TOR signaling and rapamycin influence longevity by regulating SKN-1/Nrf and DAF-16/FoxO. Cell Metab. 2012;15(5):713–724. [DOI] [PMC free article] [PubMed] [Google Scholar]
- 11. Patel PH, Tamanoi F. Increased Rheb-TOR signaling enhances sensitivity of the whole organism to oxidative stress. J Cell Sci. 2006;119(pt 20):4285–4292. [DOI] [PubMed] [Google Scholar]
- 12. Cannizzo ES, Clement CC, Sahu R, Follo C, Santambrogio L. Oxidative stress, inflamm-aging and immunosenescence. J Proteomics. 2011;74(11):2313–2323. [DOI] [PubMed] [Google Scholar]
- 13. Proud CG. Amino acids and mTOR signalling in anabolic function. Biochem Soc Trans. 2007;35(pt 5):1187–1190. [DOI] [PubMed] [Google Scholar]
- 14. Garami A, Zwartkruis FJ, Nobukuni T, et al. Insulin activation of Rheb, a mediator of mTOR/S6K/4E-BP signaling, is inhibited by TSC1 and 2. Mol Cell. 2003;11(6):1457–1466. [DOI] [PubMed] [Google Scholar]
- 15. Jastrzebski K, Hannan KM, Tchoubrieva EB, Hannan RD, Pearson RB. Coordinate regulation of ribosome biogenesis and function by the ribosomal protein S6 kinase, a key mediator of mTOR function. Growth Factors. 2007;25(4):209–226. [DOI] [PubMed] [Google Scholar]
- 16. Inoki K, Li Y, Xu T, Guan KL. Rheb GTPase is a direct target of TSC2 GAP activity and regulates mTOR signaling. Genes Dev. 2003;17(15):1829–1834. [DOI] [PMC free article] [PubMed] [Google Scholar]
- 17. Shadel GS, Pan Y. Multi-faceted regulation of mitochondria by TOR. Cell Cycle. 2009;8(14):2143. [DOI] [PubMed] [Google Scholar]
- 18. Alessi DR, Pearce LR, Garcia-Martinez JM. New insights into mTOR signaling: mTORC2 and beyond. Sci Signal. 2009;2(67):pe27. [DOI] [PubMed] [Google Scholar]
- 19. Oh WJ, Jacinto E. mTOR complex 2 signaling and functions. Cell Cycle. 2011;10(14):2305–2316. [DOI] [PMC free article] [PubMed] [Google Scholar]
- 20. Berchtold D, Piccolis M, Chiaruttini N, et al. Plasma membrane stress induces relocalization of Slm proteins and activation of TORC2 to promote sphingolipid synthesis. Nat Cell Biol. 2012;14(5):542–547. [DOI] [PubMed] [Google Scholar]
- 21. Niles BJ, Powers T. Plasma membrane proteins Slm1 and Slm2 mediate activation of the AGC kinase Ypk1 by TORC2 and sphingolipids in S. cerevisiae. Cell Cycle. 2012;11(20):3745–3749. [DOI] [PMC free article] [PubMed] [Google Scholar]
- 22. Jacinto E, Facchinetti V, Liu D, et al. SIN1/MIP1 maintains rictor-mTOR complex integrity and regulates Akt phosphorylation and substrate specificity. Cell. 2006;127(1):125–137. [DOI] [PubMed] [Google Scholar]
- 23. García-Martínez JM, Alessi DR. mTOR complex 2 (mTORC2) controls hydrophobic motif phosphorylation and activation of serum- and glucocorticoid-induced protein kinase 1 (SGK1). Biochem J. 2008;416(3):375–385. [DOI] [PubMed] [Google Scholar]
- 24. Lamming DW, Mihaylova MM, Katajisto P, et al. Depletion of Rictor, an essential protein component of mTORC2, decreases male lifespan. Aging Cell. 2014;13(5):911–917. [DOI] [PMC free article] [PubMed] [Google Scholar]
- 25. Cameron AJ, Linch MD, Saurin AT, Escribano C, Parker PJ. mTORC2 targets AGC kinases through Sin1-dependent recruitment. Biochem J. 2011;439(2):287–297. [DOI] [PubMed] [Google Scholar]
- 26. Xie J, Proud CG. Crosstalk between mTOR complexes. Nat Cell Biol. 2013;15(11):1263–1265. [DOI] [PubMed] [Google Scholar]
- 27. Liu P, Gan W, Inuzuka H, et al. Sin1 phosphorylation impairs mTORC2 complex integrity and inhibits downstream Akt signalling to suppress tumorigenesis. Nat Cell Biol. 2013;15(11):1340–1350. [DOI] [PMC free article] [PubMed] [Google Scholar]
- 28. Sharp ZD, Curiel TJ, Livi CB. Chronic mechanistic target of rapamycin inhibition: preventing cancer to delay aging, or vice versa? Interdiscip Top Gerontol. 2013;38:1–16. [DOI] [PubMed] [Google Scholar]
- 29. Stanfel MN, Shamieh LS, Kaeberlein M, Kennedy BK. The TOR pathway comes of age. Biochim Biophys Acta. 2009;1790(10):1067–1074. [DOI] [PMC free article] [PubMed] [Google Scholar]
- 30. Harrison DE, Strong R, Sharp ZD, et al. Rapamycin fed late in life extends lifespan in genetically heterogeneous mice. Nature. 2009;460(7253):392–395. [DOI] [PMC free article] [PubMed] [Google Scholar]
- 31. Wu JJ, Liu J, Chen EB, et al. Increased mammalian lifespan and a segmental and tissue-specific slowing of aging after genetic reduction of mTOR expression. Cell Rep. 2013;4(5):913–920. [DOI] [PMC free article] [PubMed] [Google Scholar]
- 32. Selman C, Tullet JM, Wieser D, et al. Ribosomal protein S6 kinase 1 signaling regulates mammalian life span. Science. 2009;326(5949):140–144. [DOI] [PMC free article] [PubMed] [Google Scholar]
- 33. Lamming DW, Ye L, Katajisto P, et al. Rapamycin-induced insulin resistance is mediated by mTORC2 loss and uncoupled from longevity. Science. 2012;335(6076):1638–1643. [DOI] [PMC free article] [PubMed] [Google Scholar]
- 34. Risson V, Mazelin L, Roceri M, et al. Muscle inactivation of mTOR causes metabolic and dystrophin defects leading to severe myopathy. J Cell Biol. 2009;187(6):859–874. [DOI] [PMC free article] [PubMed] [Google Scholar]
- 35. Bentzinger CF, Romanino K, Cloëtta D, et al. Skeletal muscle-specific ablation of raptor, but not of rictor, causes metabolic changes and results in muscle dystrophy. Cell Metab. 2008;8(5):411–424. [DOI] [PubMed] [Google Scholar]
- 36. Perkey E, Fingar D, Miller RA, Garcia GG. Increased mammalian target of rapamycin complex 2 signaling promotes age-related decline in CD4 T cell signaling and function. J Immunol. 2013;191(9):4648–4655. [DOI] [PMC free article] [PubMed] [Google Scholar]
- 37. Bonkowski MS, Dominici FP, Arum O, et al. Disruption of growth hormone receptor prevents calorie restriction from improving insulin action and longevity. PLoS One. 2009;4(2):e4567. [DOI] [PMC free article] [PubMed] [Google Scholar] [Retracted]
- 38. Giani JF, Bonkowski MS, Muñoz MC, et al. Insulin signaling cascade in the hearts of long-lived growth hormone receptor knockout mice: effects of calorie restriction. J Gerontol A Biol Sci Med Sci. 2008;63(8):788–797. [DOI] [PubMed] [Google Scholar]
- 39. Chandrashekar V, Dawson CR, Martin ER, Rocha JS, Bartke A, Kopchick JJ. Age-related alterations in pituitary and testicular functions in long-lived growth hormone receptor gene-disrupted mice. Endocrinology. 2007;148(12):6019–6025. [DOI] [PubMed] [Google Scholar]
- 40. Bartke A, Masternak MM, Al-Regaiey KA, Bonkowski MS. Effects of dietary restriction on the expression of insulin-signaling-related genes in long-lived mutant mice. Interdiscip Top Gerontol. 2007;35:69–82. [DOI] [PubMed] [Google Scholar]
- 41. Al-Regaiey KA, Masternak MM, Bonkowski MS, Panici JA, Kopchick JJ, Bartke A. Effects of caloric restriction and growth hormone resistance on insulin-related intermediates in the skeletal muscle. J Gerontol A Biol Sci Med Sci. 2007;62(1):18–26. [DOI] [PubMed] [Google Scholar]
- 42. Bonkowski MS, Rocha JS, Masternak MM, Al Regaiey KA, Bartke A. Targeted disruption of growth hormone receptor interferes with the beneficial actions of calorie restriction. Proc Natl Acad Sci USA. 2006;103(20):7901–7905. [DOI] [PMC free article] [PubMed] [Google Scholar]
- 43. Al-Regaiey KA, Masternak MM, Bonkowski M, Sun L, Bartke A. Long-lived growth hormone receptor knockout mice: interaction of reduced insulin-like growth factor I/insulin signaling and caloric restriction. Endocrinology. 2005;146(2):851–860. [DOI] [PubMed] [Google Scholar]
- 44. Richardson A, Liu F, Adamo ML, Van Remmen H, Nelson JF. The role of insulin and insulin-like growth factor-I in mammalian ageing. Best Pract Res Clin Endocrinol Metab. 2004;18(3):393–406. [DOI] [PubMed] [Google Scholar]
- 45. Bartke A, Brown-Borg H. Life extension in the dwarf mouse. Curr Top Dev Biol. 2004;63:189–225. [DOI] [PubMed] [Google Scholar]
- 46. Liang H, Masoro EJ, Nelson JF, Strong R, McMahan CA, Richardson A. Genetic mouse models of extended lifespan. Exp Gerontol. 2003;38(11–12):1353–1364. [DOI] [PubMed] [Google Scholar]
- 47. Hsieh CC, DeFord JH, Flurkey K, Harrison DE, Papaconstantinou J. Implications for the insulin signaling pathway in Snell dwarf mouse longevity: a similarity with the C. elegans longevity paradigm. Mech Ageing Dev. 2002;123(9):1229–1244. [DOI] [PubMed] [Google Scholar]
- 48. Dozmorov I, Galecki A, Chang Y, Krzesicki R, Vergara M, Miller RA. Gene expression profile of long-lived snell dwarf mice. J Gerontol A Biol Sci Med Sci. 2002;57(3):B99–B108. [DOI] [PubMed] [Google Scholar]
- 49. Flurkey K, Papaconstantinou J, Miller RA, Harrison DE. Lifespan extension and delayed immune and collagen aging in mutant mice with defects in growth hormone production. Proc Natl Acad Sci USA. 2001;98(12):6736–6741. [DOI] [PMC free article] [PubMed] [Google Scholar]
- 50. Junnila RK, List EO, Berryman DE, Murrey JW, Kopchick JJ. The GH/IGF-1 axis in ageing and longevity. Nat Rev Endocrinol. 2013;9(6):366–376. [DOI] [PMC free article] [PubMed] [Google Scholar]
- 51. Anisimov VN, Bartke A. The key role of growth hormone-insulin-IGF-1 signaling in aging and cancer. Crit Rev Oncol Hematol. 2013;87(3):201–223. [DOI] [PMC free article] [PubMed] [Google Scholar]
- 52. Kenyon C. The first long-lived mutants: discovery of the insulin/IGF-1 pathway for ageing. Philos Trans R Soc Lond B Biol Sci. 2011;366(1561):9–16. [DOI] [PMC free article] [PubMed] [Google Scholar]
- 53. Holzenberger M. Igf-I signaling and effects on longevity. Nestle Nutr Workshop Ser Pediatr Program. 2011;68:237–245; discussion 246–239. [DOI] [PubMed] [Google Scholar]
- 54. Bartke A. Single-gene mutations and healthy ageing in mammals. Philos Trans R Soc Lond B Biol Sci. 2011;366(1561):28–34. [DOI] [PMC free article] [PubMed] [Google Scholar]
- 55. List EO, Berryman DE, Funk K, et al. Liver-specific GH receptor gene-disrupted (LiGHRKO) mice have decreased endocrine IGF-I, increased local IGF-I, and altered body size, body composition, and adipokine profiles. Endocrinology. 2014;155(5):1793–1805. [DOI] [PMC free article] [PubMed] [Google Scholar]
- 56. Sun LY, Spong A, Swindell WR, et al. Growth hormone-releasing hormone disruption extends lifespan and regulates response to caloric restriction in mice. Elife. 2013;2:e01098. [DOI] [PMC free article] [PubMed] [Google Scholar]
- 57. Hsieh CC, Papaconstantinou J. Akt/PKB and p38 MAPK signaling, translational initiation and longevity in Snell dwarf mouse livers. Mech Ageing Dev. 2004;125(10–11):785–798. [DOI] [PubMed] [Google Scholar]
- 58. Fang Y, Westbrook R, Hill C, et al. Duration of rapamycin treatment has differential effects on metabolism in mice. Cell Metab. 2013;17(3):456–462. [DOI] [PMC free article] [PubMed] [Google Scholar]
- 59. Vergara M, Smith-Wheelock M, Harper JM, Sigler R, Miller RA. Hormone-treated snell dwarf mice regain fertility but remain long lived and disease resistant. J Gerontol A Biol Sci Med Sci. 2004;59(12):1244–1250. [DOI] [PMC free article] [PubMed] [Google Scholar]
- 60. Murakami S, Salmon A, Miller RA. Multiplex stress resistance in cells from long-lived dwarf mice. FASEB J. 2003;17(11):1565–1566. [DOI] [PubMed] [Google Scholar]
- 61. Postic C, Shiota M, Niswender KD, et al. Dual roles for glucokinase in glucose homeostasis as determined by liver and pancreatic β cell-specific gene knock-outs using Cre recombinase. J Biol Chem. 1999;274(1):305–315. [DOI] [PubMed] [Google Scholar]
- 62. Chen CH, Sarbassov dos D. The mTOR (mammalian target of rapamycin) kinase maintains integrity of mTOR complex 2. J Biol Chem. 2011;286(46):40386–40394. [DOI] [PMC free article] [PubMed] [Google Scholar]
- 63. Li X, Bartke A, Berryman DE, et al. Direct and indirect effects of growth hormone receptor ablation on liver expression of xenobiotic metabolizing genes. Am J Physiol Endocrinol Metab. 2013;305(8):E942–E950. [DOI] [PMC free article] [PubMed] [Google Scholar]
- 64. List EO, Berryman DE, Funk K, et al. The role of GH in adipose tissue: lessons from adipose-specific GH receptor gene-disrupted mice. Mol Endocrinol. 2013;27(3):524–535. [DOI] [PMC free article] [PubMed] [Google Scholar]
- 65. Partridge L, Alic N, Bjedov I, Piper MD. Ageing in Drosophila: the role of the insulin/Igf and TOR signalling network. Exp Gerontol. 2011;46(5):376–381. [DOI] [PMC free article] [PubMed] [Google Scholar]
- 66. McCormick MA, Tsai SY, Kennedy BK. TOR and ageing: a complex pathway for a complex process. Philos Trans R Soc Lond B Biol Sci. 2011;366(1561):17–27. [DOI] [PMC free article] [PubMed] [Google Scholar]
- 67. Cornu M, Albert V, Hall MN. mTOR in aging, metabolism, and cancer. Curr Opin Genet Dev. 2013;23(1):53–62. [DOI] [PubMed] [Google Scholar]
- 68. Li W, Miller RA. Elevated ATF4 function in fibroblasts and liver of slow-aging mutant mice. J Gerontol A Biol Sci Med Sci. 2014. [published ahead of print April 1, 2014]. doi:10.1093/gerona/glu040. [DOI] [PMC free article] [PubMed] [Google Scholar]
- 69. Vesely PW, Staber PB, Hoefler G, Kenner L. Translational regulation mechanisms of AP-1 proteins. Mutat Res. 2009;682(1):7–12. [DOI] [PubMed] [Google Scholar]
- 70. Jin HO, Seo SK, Woo SH, et al. Activating transcription factor 4 and CCAAT/enhancer-binding protein-β negatively regulate the mammalian target of rapamycin via Redd1 expression in response to oxidative and endoplasmic reticulum stress. Free Radic Biol Med. 2009;46(8):1158–1167. [DOI] [PubMed] [Google Scholar]
- 71. Ikenoue T, Inoki K, Yang Q, Zhou X, Guan KL. Essential function of TORC2 in PKC and Akt turn motif phosphorylation, maturation and signalling. EMBO J. 2008;27(14):1919–1931. [DOI] [PMC free article] [PubMed] [Google Scholar]
- 72. Miller RA, Harrison DE, Astle CM, et al. Rapamycin-mediated lifespan increase in mice is dose and sex dependent and metabolically distinct from dietary restriction. Aging Cell. 2014;13(3):468–477. [DOI] [PMC free article] [PubMed] [Google Scholar]
- 73. Harrison DE, Strong R, Allison DB, et al. Acarbose, 17-α-estradiol, and nordihydroguaiaretic acid extend mouse lifespan preferentially in males. Aging Cell. 2014;13(2):273–282. [DOI] [PMC free article] [PubMed] [Google Scholar]
- 74. Gu Y, Lindner J, Kumar A, Yuan W, Magnuson MA. Rictor/mTORC2 is essential for maintaining a balance between β-cell proliferation and cell size. Diabetes. 2011;60(3):827–837. [DOI] [PMC free article] [PubMed] [Google Scholar]
- 75. Liu P, Guo J, Gan W, Wei W. Dual phosphorylation of Sin1 at T86 and T398 negatively regulates mTORC2 complex integrity and activity. Protein Cell. 2014;5(3):171–177. [DOI] [PMC free article] [PubMed] [Google Scholar]
- 76. Chen CH, Kiyan V, Zhylkibayev AA, et al. Autoregulation of the mechanistic target of rapamycin (mTOR) complex 2 integrity is controlled by an ATP-dependent mechanism. J Biol Chem. 2013;288(38):27019–27030. [DOI] [PMC free article] [PubMed] [Google Scholar]
- 77. Shimono A, Okuda T, Kondoh H. N-myc-dependent repression of ndr1, a gene identified by direct subtraction of whole mouse embryo cDNAs between wild type and N-myc mutant. Mech Dev. 1999;83(1–2):39–52. [DOI] [PubMed] [Google Scholar]
- 78. Qu X, Zhai Y, Wei H, et al. Characterization and expression of three novel differentiation-related genes belong to the human NDRG gene family. Mol Cell Biochem. 2002;229(1–2):35–44. [DOI] [PubMed] [Google Scholar]
- 79. Zhou RH, Kokame K, Tsukamoto Y, Yutani C, Kato H, Miyata T. Characterization of the human NDRG gene family: a newly identified member, NDRG4, is specifically expressed in brain and heart. Genomics. 2001;73(1):86–97. [DOI] [PubMed] [Google Scholar]
- 80. Park H, Adams MA, Lachat P, Bosman F, Pang SC, Graham CH. Hypoxia induces the expression of a 43-kDa protein (PROXY-1) in normal and malignant cells. Biochem Biophys Res Commun. 2000;276(1):321–328. [DOI] [PubMed] [Google Scholar]
- 81. Zhou D, Salnikow K, Costa M. Cap43, a novel gene specifically induced by Ni2+ compounds. Cancer Res. 1998;58(10):2182–2189. [PubMed] [Google Scholar]
- 82. Yao L, Zhang J, Liu X. NDRG2: a Myc-repressed gene involved in cancer and cell stress. Acta Biochim Biophys Sin (Shanghai). 2008;40(7):625–635. [DOI] [PubMed] [Google Scholar]
- 83. Ellen TP, Ke Q, Zhang P, Costa M. NDRG1, a growth and cancer related gene: regulation of gene expression and function in normal and disease states. Carcinogenesis. 2008;29(1):2–8. [DOI] [PubMed] [Google Scholar]
- 84. Maruyama Y, Ono M, Kawahara A, et al. Tumor growth suppression in pancreatic cancer by a putative metastasis suppressor gene Cap43/NDRG1/Drg-1 through modulation of angiogenesis. Cancer Res. 2006;66(12):6233–6242. [DOI] [PubMed] [Google Scholar]
- 85. Nishio S, Ushijima K, Tsuda N, et al. Cap43/NDRG1/Drg-1 is a molecular target for angiogenesis and a prognostic indicator in cervical adenocarcinoma. Cancer Lett. 2008;264(1):36–43. [DOI] [PubMed] [Google Scholar]
- 86. Gesing A, Wang F, List EO, et al. Expression of apoptosis-related genes in liver-specific growth hormone receptor gene-disrupted mice is sex dependent. J Gerontol A Biol Sci Med Sci. 2014. [published ahead of print February 18, 2014]. doi:10.1093/gerona/glu008. [DOI] [PMC free article] [PubMed] [Google Scholar]
- 87. Huypens P. Adipokines regulate systemic insulin sensitivity in accordance to existing energy reserves. Med Hypotheses. 2007;69(1):161–165. [DOI] [PubMed] [Google Scholar]