

Abstract
BACKGROUND
Patients with advanced, metastatic sarcoma have a poor prognosis, and the overall benefit from the few standard-of-care therapeutics available is small. The rarity of this tumor, combined with the wide range of subtypes, leads to difficulties in conducting clinical trials. The authors previously reported the outcome of patients with a variety of common solid tumors who received treatment with drug regimens that were first tested in patient-derived xenografts using a proprietary method (“TumorGrafts”).
METHODS
Tumors resected from 29 patients with sarcoma were implanted into immunodeficient mice to identify drug targets and drugs for clinical use. The results of drug sensitivity testing in the TumorGrafts were used to personalize cancer treatment.
RESULTS
Of 29 implanted tumors, 22 (76%) successfully engrafted, permitting the identification of treatment regimens for these patients. Although 6 patients died before the completion of TumorGraft testing, a correlation between TumorGraft results and clinical outcome was observed in 13 of 16 (81%) of the remaining individuals. No patients progressed during the TumorGraft-predicted therapy.
CONCLUSIONS
The current data support the use of the personalized TumorGraft model as an investigational platform for therapeutic decision-making that can guide treatment for rare tumors such as sarcomas. A randomized phase 3 trial versus physician's choice is warranted.
Keywords: sarcoma, prediction, biomarker, response, chemotherapy, trial, mice, TumorGraft
INTRODUCTION
Sarcomas represent a heterogeneous and diverse group of tumors; and, because of the rarity of each subtype, there is a lack of randomized data from which we can guide systemic, nonsurgical treatments.1 Gene expression profiling has led to significant advances in diagnosis and prognosis, and additional genetic studies have led to a better understanding of underlying chromosomal translocations in sarcoma.2–6 However, with the exception of gastrointestinal stromal tumors and Kaposi sarcoma, therapeutic options are limited, because drugs that directly target the fusion oncoproteins produced are not available. Molecular pathways activated by these fusion oncogenes may still be targeted, and inhibitory agents have been developed.7–9
Because sarcomas are usually somatic genetic diseases and tumorigenesis depends on permissive microenvirnoments,10 others have developed reliable mouse models that faithfully recapitulate the histopathologic, immunohistochemical, and transcriptional profile of human sarcomas, to the extent that 1 notable study appeared to identify the cell of origin for synovial sarcomas.11 Such models are valuable resources for studying tumor biology and are a striking example of how understanding normal tissue in the context of cancer growth will be central to developing appropriate therapies.12 These models are also more likely to be reliable indicators of in vivo tumor behavior and metastatic progression compared with cell line data, which only partially mimic the genetic features of cancer.13,14 Indeed, differences between cell lines and cancers can often reflect intratumor heterogeneity and adaptation through Darwinian selection.15 Nevertheless, although these models are more reliable indicators of in vivo growth, the rarity of sarcoma as well as patient diversity makes identifying and testing targeted therapies difficult and underscores the need to find real-time, personalized solutions for patients with sarcoma.
The use of tumor tissue engrafted into immune-deficient mice, termed “TumorGrafts” (Champions Oncology, Inc., Baltimore, Md), should overcome many of the aforementioned issues and allow a personalized approach to cancer therapy. This process preserves the characteristics of the live tumor, creating a replica that appears identical to the tumor in the patient's body, as characterized by genetic, genomic, and biochemical methods.16,17 The entire process, depicted in Figure 1A, typically takes 3 to 6 months, and approximately 75% of implanted tumors grow successfully in mice. Indeed, unique banks of serially transplantable, orthotopic, patient-derived TumorGrafts that retain that characteristics of the original tumor have been established for a series of breast cancers16 and colorectal cancers,17 along with case reports in pancreatic, adenoid cystic, and other tumor types,18–20 all of which were used to customize therapy. Herein, we describe our experience with TumorGrafts in 29 individuals who had advanced sarcoma, a disease for which few treatment options are available.
Figure 1.
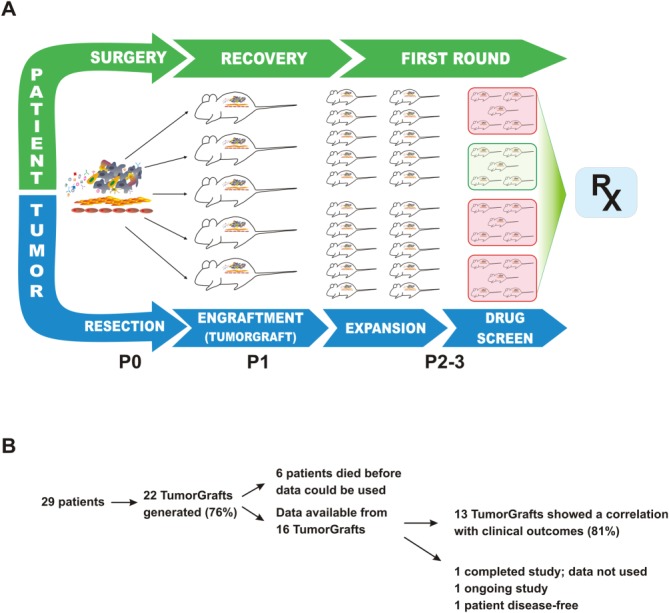
This is a schematic of the TumorGraft engraftment and testing process. A piece of the patient's tumor is collected at the time of surgery and implanted into immunocompromised mice for the purpose of propagation. While the patient recovers from surgery and receives treatment with first-line therapies, the TumorGraft is expanded across more mice (generations P0-P3). These engrafted mice eventually are enrolled in a drug-screening test to determine optimal treatments (RX). Test results are presented to the patient's treating oncologist to help guide later stages of therapy.
MATERIALS AND METHODS
TumorGraft Generation
Patients in the United States and Europe who were diagnosed with advanced sarcoma had the opportunity to have their tumors engrafted for the generation of a personalized TumorGraft. Patients who chose to participate were charged a fee to enroll and signed an informed consent document. The informed consent document followed federal regulatory requirements and covered the use of the patient's tumor for personalizing therapy, reporting of patient medical history, and use of tumor material for research purposes. A fresh specimen of the patient's tumor was removed by a surgeon at the time of resection or biopsy and sent to a dedicated laboratory. Fragments of the tumor measuring approximately 4 mm3, containing both malignant cells and supportive stromal components, were implanted subcutaneously into the flanks of 6-week-old immunodeficient mice, as previously described (female nu/nu athymic mice; Harlan Laboratories, Indianapolis, Ind.).16–20 The mice (P1 generation) were maintained under pathogen-free conditions and a 12-hour light/dark cycle. When P1 tumors reached an approximate size of 1500 mm3, they were harvested, fragmented, and reimplanted into additional mice (P2 generation) while maintained as a live bank according to approved Institutional Animal Care and Use Committee protocols. When enough P2 TumorGrafts reached a volume greater than 200 mm3, the animals were divided into groups of 3 to 5, and dosing of drugs or drug combinations was implemented according to the individual physician's choice and in consultation with the specific patient. Starting volumes varied between different TumorGraft models because of the individual doubling time.
Agent Efficacy
All test agents were formulated according to the manufacturer's specifications. Beginning on day-0, tumor dimensions were measured twice weekly by digital caliper; and data, including individual and mean estimated tumor volumes, were recorded for each group. Tumor volume (TV) was calculated using the formula: TV = width2 × length × π/2.
Tumor Growth Inhibition and Response Evaluation Criteria in Solid Tumors
At study completion, percentage tumor growth inhibition (%TGI) values were calculated for each treatment group (T) versus control (C) using initial (i) and final (f) tumor measurements according to the formula: %TGI = (1 − [Tf − Ti]/[Cf − Ci]) × 100. Individual mice that had a tumor volume >120% of the day-0 measurement were considered to have progressive disease (PD). Individual mice with neither sufficient shrinkage nor sufficient tumor volume increases were considered to have stable disease (SD). Individual mice that had a tumor volume ≤70% of the day-0 measurement for 2 consecutive measurements over a 7-day period were considered to have a partial response (PR). If the PR persisted until study completion, then the percentage tumor regression (%TR) was determined using the formula: %TR = (1 − [Tf/Ti]) × 100; and a mean value was calculated for the entire treatment group. Individual mice that lacked palpable tumors for 2 consecutive measurements over a 7-day period were considered to have a complete response (CR). All data collected in this study were managed electronically and stored on a redundant server system. %TGI and %TR values were ranked according to their efficacy and were provided to the treating physician, who selected an appropriate therapy in consultation with the patient. All investigations were performed after approval by local committees.
RESULTS
In total, 29 patients with heavily pretreated, advanced sarcomas entered the study (Table1, Fig. 1B). Sarcomas from 7 patients failed to successfully engraft in the mice, perhaps indicative of more slow-growing tumors, as suggested previously,16 or perhaps an effect of prior chemotherapy. Of the 22 patients who had successful engraftment and growth in mice, 6 died before data became available; therefore, therapeutic testing for them was abandoned. Of the 16 remaining patients, 13 (81%) demonstrated a correlation between results from their TumorGraft and their clinical outcome, including 3 patients whose TumorGrafts were tested more than once. Among these 13 patients, 6 experienced a direct clinical benefit from TumorGraft-directed therapy, and 7 had a retrospective analysis performed on their behalf that yielded a positive correlation between their postresection regimens and the response observed in their TumorGrafts. The individual patients enrolled on the study are further characterized and summarized in Table1 and are described below.
Table 1.
TumorGraft Results and Clinical Outcome for Sarcoma Patientsa
| Patient No. | Identifier | Sarcoma histology | TumorGraft and Outcome Status |
|---|---|---|---|
| 1 | 601 | Leiomyosarcoma | Direct clinical benefit demonstrated |
| 2 | 1119b | Liposarcoma | Direct clinical benefit demonstrated |
| 3 | 12113 | Spindle cell sarcoma | Direct clinical benefit demonstrated |
| 4 | 1241b | Myxoma | Direct clinical benefit demonstrated |
| 5 | 1207b | Ewing sarcoma | Direct clinical benefit demonstrated |
| 6 | 602 | Chondrosarcoma | Direct clinical benefit demonstrated |
| 7 | 1130b | Spindle cell sarcoma | Clinical benefit; retrospective clinical correlation demonstrated |
| 8 | 1255b | Liposarcoma | Mice data available, but not yet used clinically; retrospective clinical correlation demonstrated |
| 9 | 12111 | Multifocal sarcoma | Mice data available, but not yet used clinically; retrospective clinical correlation demonstrated |
| 10 | 13034 | Phyllodes sarcoma | Mice data available, but not yet used clinically; retrospective clinical correlation demonstrated |
| 11 | 1009b | Rhabdomyosarcoma | Died before using the data; retrospective clinical correlation demonstrated |
| 12 | 1174 | Rhabdomyosarcoma | Died before using the data |
| 13 | 1152b | Synovial sarcoma | Died before using the data; retrospective clinical correlation demonstrated |
| 14 | 13030 | Ewing sarcoma | Mice data is available but not yet used clinically |
| 15 | 13022 | Sarcoma, unspecified | Ongoing study |
| 16 | 1104 | Leiomyosarcoma | Patient has remained disease free postoperatively |
| 17 | 138 | Rhabdomyosarcoma | Died before using the data |
| 18 | 1278 | Liposarcoma | Died before using the data |
| 19 | 13014 | Liposarcoma | Died before using the data |
| 20 | 1132 | Myxoma | Died before using the data |
| 21 | 1164 | Ewing sarcoma | Died before using the data |
| 22 | 12106 | Small round cell sarcoma | Died before using the data |
| 23 | 1115 | Rhabdomyosarcoma | Failed to grow |
| 24 | 1012 | Synovial sarcoma | Failed to grow |
| 25 | 1276 | Liposarcoma | Failed to grow |
| 26 | 1156 | Spindle cell sarcoma | Failed to grow |
| 27 | 1282 | Spindle cell sarcoma | Failed to grow |
| 28 | 1259 | Sarcoma, unspecified | Failed to grow |
| 29 | 1283 | Sarcoma, unspecified | Failed to grow |
This is a list of patients with sarcoma who were engrafted for TumorGraft studies. The patients are listed according to whether or not clinical benefit was demonstrated. TumorGraft testing results are provided along with clinical information.
Data on these patients are presented in the text (see Results) and are illustrated in the figures.
POS-1119
This man aged 55 years presented with a diagnosis of advanced, aggressive, high-grade, dedifferentiated liposarcoma of the mesentery (Fig. 2A). Six months after his first surgical resection, he demonstrated widespread recurrence, at which time a TumorGraft was established. Gene sequencing (exome sequencing using the Illumina platform [Illumina Inc., San Diego, Calif] to compare 50 million bases of tumor and normal DNA18,21) revealed a mutation in Janus kinase 2 (JAK2) as well as cyclin-dependent kinase 4 (CDK4) and mouse double minute 2 homolog (MDM2) copy number alterations, both of which are commonly detected in liposarcomas. High expression of CDK4 and MDM2 was further corroborated using immunohistochemical analysis (data not shown). The patient commenced daily treatment with a CDK4 inhibitor (350 mg P1446A-05), which, at first, inhibited the rapid growth of the tumors, as detected by computed tomography (CT) scans. This treatment was then supplemented with a JAK2 inhibitor (ruxolitinib), in agreement with the correlative, retrospective TumorGraft data (Fig. 2B). This produced limited clinical benefit, as indicated by a decrease in size of 1 of the tumors followed by the appearance of 2 new lesions at 3 months and 4 months of treatment, respectively. Prospective TumorGraft model drug-sensitivity testing was completed, and the results demonstrated tumor growth inhibition of 117% after treatment with ifosfamide, and all animals demonstrated SD. Moreover, treatment with a combination of gemcitabine and docetaxel resulted in tumor growth inhibition of 93% in the models. At the time of disease progression, the patient commenced 5 cycles of TumorGraft-directed therapy with ifosfamide, which resulted in an objective response (Fig. 2C). This was followed by 5 months of daily TumorGraft-directed regorafenib, which had demonstrated a %TGI value of 144% in the mice, leading to a PR in all animals. Clinical use of regorafenib resulted in further tumor regression of all nodules, and treatment is still ongoing.
Figure 2.

Clinical and TumorGraft data are illustrated for patient POS-1119. (A) Histology of the TumorGraft reveals a dedifferentiated liposarcoma, similar to results from the patient's pathology reports. (B-D) TumorGraft sensitivity testing was performed to determine which drugs would be effective against the patient's tumor. Ruxolitinib, regorafenib, and ifosfamide significantly blocked tumor growth during TumorGraft testing. Asterisks denote significance (a single asterisk indicates P ≤ .05; double asterisks, P ≤ .01; triple asterisks, P ≤ .001). (E) Radiology reports for patient POS-1119 demonstrate a partial response after treatment with ifosfamide.
POS-1130
This woman aged 52 years had a high-grade, pleomorphic, spindle and epithelioid tumor (Fig. 3A). After the tumor was resected, a TumorGraft model was established. The results demonstrated tumor regression after treatment either with a combination of docetaxel and gemcitabine or with doxorubicin (as a single agent), which produced %TGI values of 135% and 111%, respectively; and the mice demonstrated a spectrum of responses, including SD, PR, and CR. Treatment with ifosfamide, sunitinib, combined carboplatin and paclitaxel, or vorinostat produced modest to minimal tumor growth inhibition, with %TGI values of 80%, 66%, 59%, and 20%, respectively. All TumorGrafts in these groups demonstrated PD. The patient commenced treatment with gemcitabine and docetaxel and demonstrated a very good PR for 10 months. Upon disease progression around the lower pelvic scar, she commenced treatment with doxorubicin, again according to the TumorGraft-directed therapy (Fig. 3B). Today, after 8 months, the patient is still demonstrating a response, although the treating physician (1 of the authors of the current report [J.S.]) has switched the patient to liposomal doxorubicin to decrease the potential for cardiac toxicity.
Figure 3.
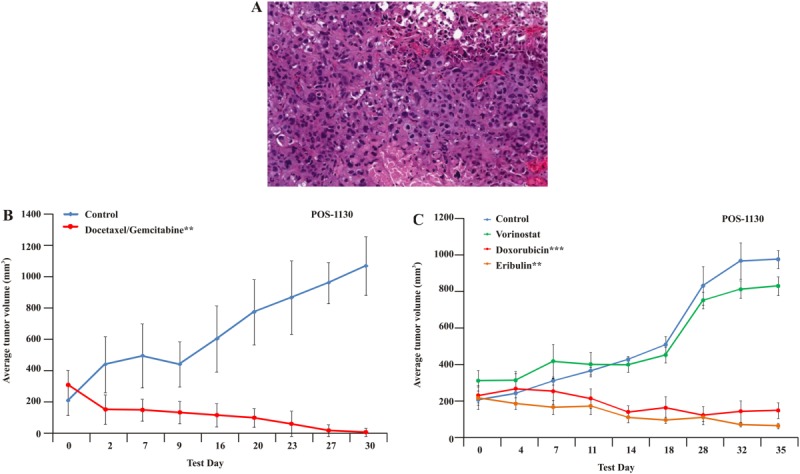
Clinical and TumorGraft data are illustrated for patient POS-1130. (A) Histology of the TumorGraft reveals a high-grade, pleomorphic, spindle and epithelioid sarcoma. (B,C) TumorGraft sensitivity testing was performed to determine which drugs would be effective against the patient's tumor. Everolimus, doxorubicin, eribulin, and a combination of docetaxel and gemcitabine proved effective using TumorGraft technology. Asterisks denote significance (a single asterisk indicates P ≤ .05; double asterisks, P ≤ .01; triple asterisks, P ≤ .001).
POS-1207
This boy, now aged 9 years, was diagnosed at age 6 years with Ewing sarcoma of the left scapula with bilateral pulmonary metastases (Fig. 4A). The tumor was positive for the Ewing sarcoma/Fli-1 proto-oncogene, ETS transcription factor (EWS-FLI1) fusion gene rearrangement. Initial therapy consisted of 7 cycles of intensively dosed vincristine with doxorubicin and cyclophosphamide (cycles 1-3 and 7) and ifosfamide plus etoposide given over 6 months; scapulectomy after cycle 3 revealed predominantly viable residual tumor (grade I necrosis). Consolidative whole-lung irradiation (1500 centigrays in 10 fractions) was administered 11 months postdiagnosis after the completion of 6 cycles of adjuvant “maintenance therapy” with irinotecan plus temozolomide. Recurrent, subcentimeter, left-sided pulmonary metastases developed 8 months later. Three fully viable metastatic nodules (measuring 2 mm, 6 mm, and 11 mm) were resected after 7 cycles (6 months) of cyclophosphamide plus topotecan relapse therapy, at which time a sample was submitted for drug-sensitivity testing to evaluate the activity of 5 different regimens with 1 investigational drug arm. The results demonstrated a %TR value of 64% after treatment with the combination of gemcitabine, docetaxel, and bevacizumab with a %TGI value of 122%. Treatment with pazopanib as a single agent yielded a moderate %TGI value of 47%, whereas treatment with gemcitabine and mithramycin A as single agents produced no benefit compared with control. Postoperatively, rapid disease recurrence/progression occurred during continued treatment with 3 additional cycles of cyclophosphamide plus topotecan. Subsequently, rapid disease progression occurred over 1 month during treatment on a phase 1 trial of an investigational immunostimulating virus. Treatment with a combination of an insulin-like growth factor 1 (IGF1)-receptor antibody and a mechanistic target of rapamycin (serine/threonine kinase) (mTOR) inhibitor during a phase 2 trial produced SD at 6 weeks followed by PD at 3 months; murine testing of this same combination (unnamed because of company restrictions) resulted in growth inhibition, and all tumor-bearing mice demonstrated SD (data not presented; clinical trial ongoing). On the basis of the results from TumorGraft experiments, treatment with the combination of docetaxel, gemcitabine, and bevacizumab was started (Fig. 4B). After 2 cycles of treatment, the patient had a CT scan that revealed PR (Fig. 4C); ongoing radiographic improvement was observed after 5 treatment cycles, and the patient remains on this therapy ≥6 months after the start of treatment.
Figure 4.
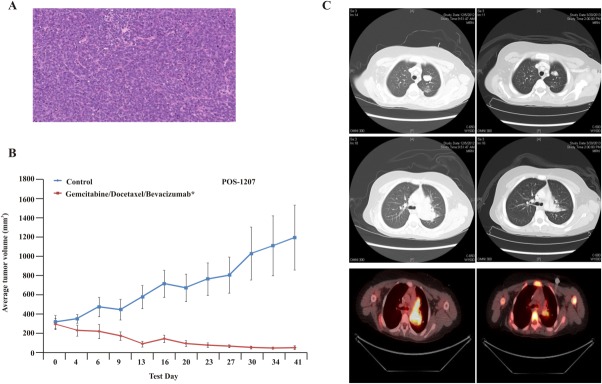
Clinical and TumorGraft data are illustrated for patient POS-1207. (A) Histology of the TumorGraft confirms Ewing sarcoma. (B) TumorGraft sensitivity testing was performed to determine which drugs would be effective against the patient's tumor. A combination of docetaxel, gemcitabine, and bevacizumab proved effective using TumorGraft technology. Asterisks denote significance (a single asterisk indicates P ≤ .05; double asterisks, P ≤ .01; triple asterisks, P ≤ .001). (C) Radiology reports for patient POS-1119 demonstrate a partial response after treatment with ifosfamide.
POS-1241
This man aged 48 years was diagnosed 5 years ago with metastatic myxoma to the lung and the neck and has a history of testicular and renal cancer before that. The patient went through several lines of therapy, most recently including treatments with gemcitabine, doxorubicin, sorafenib, and others. The patient's tumor was resected, and a TumorGraft model was generated and tested against several lines of therapy, as illustrated in Figure 5. The patient commenced TumorGraft-guided treatment with irinotecan and temozolomide, and a CT scan performed at the completion of 2 cycles (6 weeks) demonstrated evidence of a favorable response with reduction in pleural effusions and a decrease in the size of multiple lung metastases.
Figure 5.
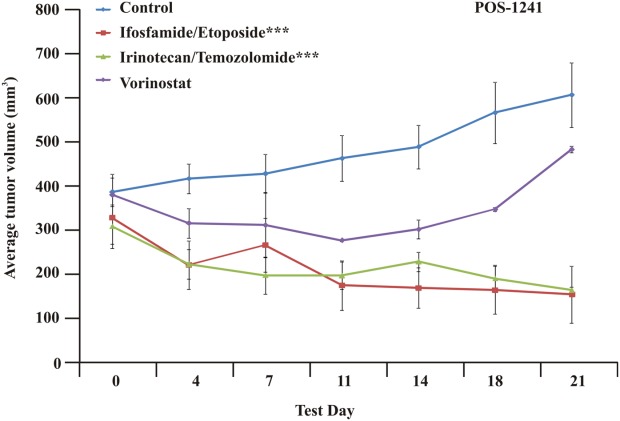
TumorGraft sensitivity testing is illustrated for Patient 1241 (POS-1241), who was diagnosed with metastatic myxoma. TumorGraft testing demonstrates significant tumor growth inhibition after treatment with a combination of either ifosfamide and etoposide or irinotecan and temozolomide. Asterisks denote significance (triple asterisks indicate P ≤ .001).
POS-1009
This man aged 49 years with a grade 3 pleomorphic rhabdomyosarcoma presented with >40 metastases in his lungs. After tumor resection, a TumorGraft model was generated. A retrospective analysis demonstrated growth inhibition after treatment with sunitinib as a single agent and with a combination of docetaxel, gemcitabine, and bevacizumab, which produced %TGI values of 98% and 80%, respectively (Fig. 6A). The patient commenced treatment with the combination of docetaxel, gemcitabine, and bevacizumab and had a PR for approximately 6 months, although SD was predicted (data not shown).
Figure 6.

Retrospective TumorGraft testing is illustrated. (A) Retrospective TumorGraft testing for patient POS-1009 reveals significant growth reduction with a combination of gemcitabine and docetaxel. (B,C) Retrospective TumorGraft testing for patient POS-1152 indicates strong antitumor effects with either trabectidin or ifosfamide. (D) Retrospective TumorGraft testing for patient POS-1255 demonstrates that, although eribulin and sunitinib slow tumor growth relative to controls, the patient's tumor still grows, albeit more slowly. Asterisks denote significance (a single asterisk indicates P ≤ .05; double asterisks, P ≤ .01; triple asterisks, P ≤ .001).
POS-1152
This man aged 57 years had a heavily pretreated, metastatic sarcoma of the perineum with an synaptotagmin (SYT) translocation consistent with synovial sarcoma. The patient experienced several remissions and recurrences for more than 6 years and most recently progressed in the lung. A progressing lung lesion was resected as in patient POS-1009 and allowed for the generation of a TumorGraft model and chemosensitivity testing of 7 drug combinations. The drug-sensitivity test demonstrated growth inhibition after treatment with ifosfamide and with trabectedin, which produced %TGI values of 91% and 99%, respectively, and all 3 study animals demonstrated SD. Treatment with gemcitabine, pazopanib, etoposide or with a combination of etoposide and vorinostat demonstrated moderate effects on tumor growth, with %TGI values of 43%, 56%, 23% and 23%, respectively (Fig. 6B,C). Genome analysis of the patient's tumor revealed a mutation leading to abnormal splicing of patched (PTCH1). PTCH1 inhibits the smoothened receptor and hedgehog signaling. However, vismodegib, an antagonist of the smoothened receptor that acts downstream of PTCH1, exhibited no efficacy in this TumorGraft model. The patient commenced ifosfamide treatment in parallel to the drug-sensitivity testing in the mice and, in agreement with TumorGraft data, experienced 6 months of SD.
POS-1255
This man aged 74 years with metastatic, dedifferentiated liposarcoma was diagnosed 8 years ago and received several lines of therapy, including trabectedin, ifosfamide, and sunitinib, all of which resulted in PD. The patient then received treatment with eribulin for approximately 3 years and attained a clear PR, but he progressed and developed an eribulin-resistant tumor. The patient commenced pazopanib treatment for 5 months, which resulted in SD. His tumor was resected, and a TumorGraft model was generated and tested against the aforementioned drugs to retrospectively compare the tumor's sensitivity. Treatment with eribulin resulted in a moderate growth inhibition with %TGI value of 63%. Treatment with sunitinib resulted in a minor %TGI value of 41% (Fig. 6D). Treatment with trabectedin, ifosfamide, and pazopanib is ongoing.
DISCUSSION
The development of personalized mouse models for patients with cancer is useful for drug screening and biomarker development, and it also may have predictive capacity in a group of heterogeneous patients with difficult-to-treat, advanced cancers. Results of studies by us and others support the use of TumorGrafts as a reliable and consistent method to provide direction for optimizing personalized cancer treatment and may deliver an innovative opportunity for patients and their oncologist when faced with a challenging therapeutic spectrum. In some of these individuals, TumorGraft responses were used on more than 1 occasion to accurately predict responses to several lines of therapy without requiring fresh tissue grafting.
Although these clinical cases were not randomized versus physician's best choice, we suggest that the response rates, durability of responses, and precision of the drug combinations were above standard expectations. Such an approach is not without its difficulties. Limitations include the need for a sufficient amount of fresh tissue, which can be difficult considering that many of these patients are not otherwise scheduled for surgery. In addition, although the development and propagation of a TumorGraft model can take as little as 6 weeks, it is more often up to 6 months before study results can be made available. This timeline directly correlates with tumor aggressiveness, invasiveness, and the quality and quantity of malignant tissue received. Furthermore, it is conceivable that this prolonged timeline also allows additional DNA alterations to occur within the patient tumor, and thus a careful consideration of the patient medical history with a particular focus on previous treatments should be incorporated into the drug-sensitivity study design. Finally, there is a 20% failure rate in TumorGraft establishment, although anecdotal evidence suggests that this may indicate that the patient's cancer is perhaps less “aggressive.” Indeed, the ability of a tumor to grow in mice may indicate a more aggressive phenotype; and, in 1 previous study, positive engraftment was correlated with shorter survival.16
One of the primary advantages of the TumorGraft is that it allows discrimination between the different standard-of-care therapies that may be available, as well as other potential treatments not normally indicated for that tumor. Our increased understanding of tumor heterogeneity, even within a single subtype, means that knowing how patients with the same tumor previously responded to a particular drug is no guarantee that the current patient will respond similarly. The TumorGraft overcomes this problem by helping guide oncologists to those treatments that are most likely to provide a positive clinical outcome. In addition, TumorGrafts also provide an opportunity to test nonmarketed drugs in development. This approach not only provides the patient and their oncologist with an insight into the potential response in a clinical trial setting, but it also allows a better understanding of the tumorigenesis mechanism of their specific tumor. With TumorGrafts, the performance status of the patient can be considered when deciding which drugs to test, keeping in mind the known toxicity profiles of these therapies.
Even in our modern era of oncology with biomarker-enriched populations, response rates are frequently far from satisfying. For example, among the subpopulation of metastatic colorectal cancers that carry the wild-type Kirsten rat sarcoma viral oncogene homolog (KRAS) allele, objective responses to antiepidermal growth factor receptor therapeutics is still confined to 13% to 17% of patients.22–24 Although the identification of v-raf murine sarcoma viral oncogene homolog B (BRAF), phosphatidylinositol-4,5-bisphosphate 3-kinase, catalytic subunit α (PIK3CA), neuroblastoma v-ras oncogene homolog (NRAS), and rare KRAS mutations may increase this percentage, there is a lack of standard therapeutic options, and the issue of tumor and/or patient heterogeneity in clinical trials remains important. Moreover, only a small fraction of tumors harbor these specific alterations, meaning that the majority of patients with advanced cancer will receive no benefit from these therapies. The TumorGraft approach may overcome these issues and represents a truly personalized approach.
There have been other attempts to develop personalized approaches to cancer therapy. For example, in vitro sensitivity assays exist in which a patient's tumor is disaggregated and plated into tissue culture flasks before drug treatment to assess which drugs induce tumor cell death.25 Although these have demonstrated some value, the narrow window over which these assays are performed means that only those drugs that appear to kill effectively can be identified, perhaps excluding therapies that are effective at blocking tumor growth without inducing cell death. For example, in Figure 5, at first, it appears that vorinostat is effective, and in vitro testing also may have suggested that this was the case. However, the tumor recovers, and growth accelerates rapidly in the mouse model, indicating that, in fact, vorinostat is unlikely to be of clinical benefit to the patient. Moreover, in vitro sensitivity tests still lack the 3-dimensional interplay between tumor, stroma, and other cells fluxing into the environment, all of which can have a marked impact on drug responses.26
The TumorGraft models used here include the tumor microenvironment present in the human host and maintain the features of the transplanted tumor, including gene expression profiles, copy number variants, and, most important, treatment response.16 Serially passaged tumors retain the morphologic and genomic features of their original counterparts.17 TumorGrafts derived from surgical specimens conserve the interindividual diversity and the genetic heterogeneity typical of the tumors of origin.17 In those patients reported herein who had TumorGraft models that grew, and for those who had a drug-sensitivity evaluation in the mice, the clinical response rates appeared to be impressive. For sarcoma patients with few standard options, this approach is promising, and the limitations of speed and cost should be resolved with time.
FUNDING SUPPORT
No specific funding was disclosed.
CONFLICT OF INTEREST DISCLOSURES
Dr. Sidransky is a consultant to Champions Oncology and Chairman of the company's board of directors of Champions Oncology. The terms of this arrangement are being managed by Johns Hopkins University in accordance with its conflict of interest policies. K. Paz, R. Morris, D. Vasquez, D. Ciznadija, and A. Katz are employees of Champions Oncology. R. Maki has received consulting fees from Champions Oncology outside the submitted work.
REFERENCES
- Nielsen TO, West RB. Translating gene expression into clinical care: sarcomas as a paradigm. J Clin Oncol. 2010;28:1796–1805. doi: 10.1200/JCO.2009.26.1917. [DOI] [PubMed] [Google Scholar]
- Nielsen TO, West RB, Linn SC, et al. Molecular characterisation of soft tissue tumors: a gene expression study. Lancet. 2002;359:1301–1307. doi: 10.1016/S0140-6736(02)08270-3. [DOI] [PubMed] [Google Scholar]
- Henderson SR, Guiliano D, Presneau N, et al. A molecular map of mesenchymal tumors [serial online] Genome Biol. 2005;6:R76. doi: 10.1186/gb-2005-6-9-r76. [DOI] [PMC free article] [PubMed] [Google Scholar]
- Segal NH, Pavlidis P, Antonescu CR, et al. Classification and subtype prediction of adult soft tissue sarcoma by functional genomics. Am J Pathol. 2003;163:691–700. doi: 10.1016/S0002-9440(10)63696-6. [DOI] [PMC free article] [PubMed] [Google Scholar]
- Baird K, Davis S, Antonescu CR, et al. Gene expression profiling of human sarcomas: insights into sarcoma biology. Cancer Res. 2005;65:9226–9235. doi: 10.1158/0008-5472.CAN-05-1699. [DOI] [PubMed] [Google Scholar]
- Nilbert M, Meza-Zepeda LA, Francis P, et al. Lessons from genetic profiling in soft tissue sarcomas. Acta Orthop Scand. 2004;75(suppl):35–50. doi: 10.1080/00016470410001708310. [DOI] [PubMed] [Google Scholar]
- Borden EC, Baker LH, Bell RS, et al. Soft tissue sarcomas of adults: state of the translational science. Clin Cancer Res. 2003;9:1941–1956. [PubMed] [Google Scholar]
- Wunder JS, Nielsen TO, Maki RG, O'Sullivan B, Alman BA. Opportunities for improving the therapeutic ratio for patients with sarcoma. Lancet Oncol. 2007;8:513–524. doi: 10.1016/S1470-2045(07)70169-9. [DOI] [PubMed] [Google Scholar]
- Nielsen TO. Discovery research to clinical trial: a ten year journey [serial online] Clin Invest Med. 2010;33:E342–E348. doi: 10.25011/cim.v33i6.14584. [DOI] [PubMed] [Google Scholar]
- Hahn WC, Weinberg RA. Rules for making human tumor cells. N Engl J Med. 2002;347:1593–1603. doi: 10.1056/NEJMra021902. [DOI] [PubMed] [Google Scholar]
- Haldar M, Hancock JD, Coffin CM, Lessnick SL, Capecchi MR. A conditional mouse model of synovial sarcoma: insights into a myogenic origin. Cancer Cell. 2007;11:375–388. doi: 10.1016/j.ccr.2007.01.016. [DOI] [PubMed] [Google Scholar]
- Davis SR, Meltzer PS. Modeling synovial sarcoma: timing is everything. Cancer Cell. 2007;11:305–307. doi: 10.1016/j.ccr.2007.03.016. [DOI] [PubMed] [Google Scholar]
- Neve RM, Chin K, Fridlyand J, et al. A collection of breast cancer cell lines for the study of functionally distinct cancer subtypes. Cancer Cell. 2006;10:515–527. doi: 10.1016/j.ccr.2006.10.008. [DOI] [PMC free article] [PubMed] [Google Scholar]
- Kao J, Salari K, Bocanegra M, et al. Molecular profiling of breast cancer cell lines defines relevant tumor models and provides a resource for cancer gene discovery [serial online] PLoS One. 2009;4:e6146. doi: 10.1371/journal.pone.0006146. [DOI] [PMC free article] [PubMed] [Google Scholar]
- Gerlinger M, Rowan AJ, Horswell S, et al. Intra-tumor heterogeneity and branched evolution revealed by multiregion sequencing. N Engl J Med. 2012;366:883–892. doi: 10.1056/NEJMoa1113205. [DOI] [PMC free article] [PubMed] [Google Scholar]
- DeRose YS, Wang G, Lin YC, et al. Tumor grafts derived from women with breast cancer authentically reflect tumor pathology, growth, metastasis and disease outcomes. Nat Med. 2011;17:1514–1520. doi: 10.1038/nm.2454. [DOI] [PMC free article] [PubMed] [Google Scholar]
- Bertotti A, Migliardi G, Galimi F, et al. A molecularly annotated platform of patient-derived xenografts (“xenopatients”) identifies HER2 as an effective therapeutic target in cetuximab-resistant colorectal cancer. Cancer Discov. 2011;1:508–523. doi: 10.1158/2159-8290.CD-11-0109. [DOI] [PubMed] [Google Scholar]
- Villarroel MC, Rajeshkumar NV, Garrido-Laguna I, et al. Personalizing cancer treatment in the age of global genomic analyses: PALB2 gene mutations and the response to DNA damaging agents in pancreatic cancer. Mol Cancer Ther. 2010;10:3–8. doi: 10.1158/1535-7163.MCT-10-0893. [DOI] [PMC free article] [PubMed] [Google Scholar]
- Hidalgo M, Bruckheimer E, Rajeshkumar NV, et al. A pilot clinical study of treatment guided by personalized tumorgrafts in patients with advanced cancer. Mol Cancer Ther. 2011;10:1311–1316. doi: 10.1158/1535-7163.MCT-11-0233. [DOI] [PMC free article] [PubMed] [Google Scholar]
- Morelli MP, Calvo E, Ordonez E, et al. Prioritizing phase I treatment options through preclinical testing on personalized tumorgraft. J Clin Oncol. 2012;30:e45–e48. doi: 10.1200/JCO.2011.36.9678. [DOI] [PMC free article] [PubMed] [Google Scholar]
- Jones S, Hruban RH, Kamiyama M, et al. Exomic sequencing identifies PALB2 as a pancreatic cancer susceptibility gene. Science. 2009;324:217. doi: 10.1126/science.1171202. [DOI] [PMC free article] [PubMed] [Google Scholar]
- Van Cutsem E, Kohne CH, Hitre E, et al. Cetuximab and chemotherapy as initial treatment for metastatic colorectal cancer. N Engl J Med. 2009;360:1408–1417. doi: 10.1056/NEJMoa0805019. [DOI] [PubMed] [Google Scholar]
- Van Cutsem E, Kohne CH, Lang I, et al. Cetuximab plus irinotecan, fluorouracil, and leucovorin as first-line treatment for metastatic colorectal cancer: updated analysis of overall survival according to tumor KRAS and BRAF mutation status. J Clin Oncol. 2011;29:2011–2019. doi: 10.1200/JCO.2010.33.5091. [DOI] [PubMed] [Google Scholar]
- Diaz LA, Jr, Williams RT, Wu J, et al. The molecular evolution of acquired resistance to targeted EGFR blockade in colorectal cancers. Nature. 2012;486:537–540. doi: 10.1038/nature11219. [DOI] [PMC free article] [PubMed] [Google Scholar]
- Brower SL, Fensterer JE, Bush JE. The ChemoFx assay: an ex vivo chemosensitivity and resistance assay for predicting patient response to cancer chemotherapy. Methods Mol Biol. 2008;414:57–78. doi: 10.1007/978-1-59745-339-4_6. [DOI] [PubMed] [Google Scholar]
- Junttila MR, de Sauvage FE. Influence of tumour micro-environment heterogeneity on therapeutic response. Nature. 2013;501:346–354. doi: 10.1038/nature12626. [DOI] [PubMed] [Google Scholar]