Abstract
Enhancements to the ion source and transfer optics of our 9.4 T FT-ICR mass spectrometer have resulted in improved ion transmission efficiency for more sensitive mass measurement of complex mixtures at the MS and MS/MS levels. The tube lens/skimmer has been replaced by a dual ion funnel and the following octopole by a quadrupole for reduced ion cloud radial expansion before transmission into a mass-selective quadrupole. The number of ions that reach the ICR cell is increased by an order of magnitude for the funnel/quadrupole relative to the tube lens/skimmer/octopole.
Keywords: FT MS, ICR, quadrupole ion guide, ion funnel, mass selection
Introduction
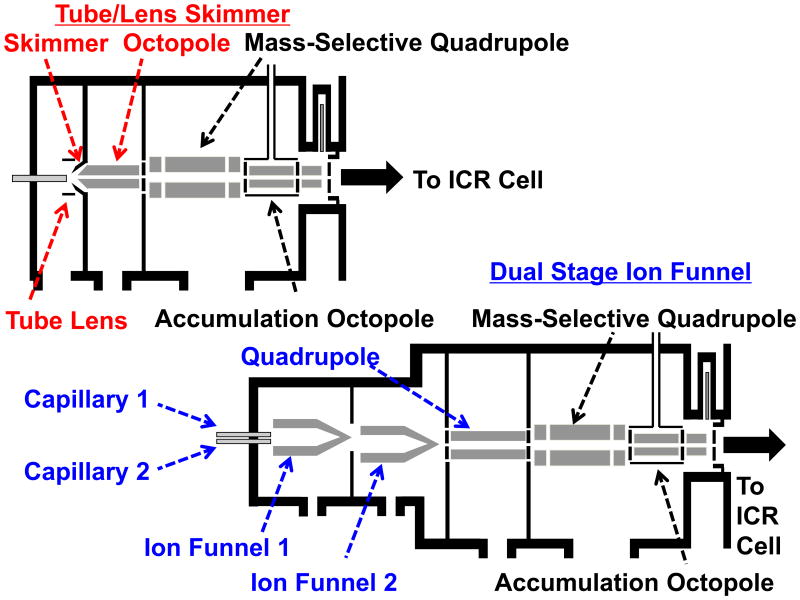
Fourier transform ion cyclotron resonance (FT-ICR) mass spectrometry provides unparalleled mass accuracy and resolving power.[1],[2] Although our 9.4 T FT-ICR mass spectrometer[3],[4] has set several benchmarks for FT-ICR performance,[5-7] low efficiency of ion transport from atmospheric pressure to the first differently pumped region significantly limits the recovery of ions. Our spectrometer employs a skimmer as a conductance-limiting orifice to separate the first and second vacuum chambers, as shown in Figure 1 (top). However, the skimmer allows only a small fraction of incoming ions to enter the mass spectrometer. Ions emanating from the tube lens/skimmer are transmitted by an octopole ion guide and a quadrupole mass filter before entering an octopole trap for collisional cooling and accumulation prior to ion injection into the FT-ICR analyzer cell.
Figure 1.
Schematic diagrams of the front end of the 9.4 T FT-ICR mass spectrometer. Top: The prior instrument configuration with tube lens/skimmer followed by an octopole ion guide. Bottom: Current instrument configuration with dual capillaries and PNNL-designed dual ion funnel followed by a quadrupole ion guide.
To overcome the limited ion transfer allowed by the skimmer, we have implemented a dual ion funnel, originally developed by Smith and co-workers at Pacific Northwest National Laboratory (PNNL)[8-11]. The large entrance aperture of the ion funnel efficiently captures and focuses the ion plume emanating from a heated capillary and results in nearly lossless transmission. To accompany this enhancement, the following octopole ion guide after the skimmer has been replaced by a quadrupole. In an octopole ion guide, the pseudopotential varies as r4, whereas a quadrupolar pseudopotential varies as r2, in which r is radial position.[12, 13] Therefore, an octopole ion guide can potentially accommodate more ions than a quadrupole, due to the radially flatter octopole pseudopotential: e.g., twice the charge capacity for ions of low internal energy, and three times the charge capacity for ions near their dissociation energy threshold.[14] Although an octopole ion guide can potentially accommodate more ions than a quadrupole, upon entering the octopole, a pre-focused ion beam can diverge from the central axis as ions tend to distribute along the inner cylindrical surface of the device (with charge density of an ion cloud increasing with increasing radial displacement). In contrast, in a quadrupole ion guide, ions are more tightly held on-axis.[14] As a result, a quadrupole ion guide exhibits narrower radial confinement of an ion beam and enables improved ion transmission efficiency.
These modifications complement the re-designed back end of our spectrometer which has a shorter ion flight time from the external accumulation ion trap to ICR cell for reduced time-of-flight mass discrimination and wider m/z range; improved optical alignment along the center of the bore of the magnet; increased accessibility to the ICR cell facilitating future modifications; decreased detection circuit capacitance for improved signal-to-noise ratio and detection sensitivity; and implementation of a compensated seven-segment ICR cell for more nearly quadrupolar trapping potential.[15],[16] Here, we report the re-design of the front end of our 9.4 T FT-ICR mass spectrometer with a tandem high pressure ion funnel and a quadrupole ion guide for increased ion transmission efficiency, demonstrating the impact of these instrumental improvements for complex mixture analysis and tandem mass spectrometry, as well as improved mass selection accuracy (narrower isolation window) due to tighter radial confined ion beam by a quadrupole ion guide.
Experimental
Sample Preparation
Melittin, apo-hemoglobin (human), carbonic anhydrase (human), and Ultramark© were purchased from Sigma Aldrich (St. Louis, MO, USA) and used without further purification; HPLC grade water and acetonitrile were purchased from Avantor Performance Materials Inc. (Center Valley, PA, USA). HeLa S3 suspension cells were purchased from ATCC (Manassas, VA, USA), and were harvested and subjected to nuclei isolation followed by standard acid extraction.[17] Extracts were further purified and separated by reversed-phase high-performance liquid chromatography (RP-HPLC).[18] Histone H2A fractions were collected with an UltiMate 3000 Autosampler (Thermo Scientific, Waltham, MA, USA) and dried by speed-vac, model SPD121P (Thermo Scientific, Waltham, MA, USA). Electrosprayed samples were diluted to 1-2 μM in 49:49:2 methanol/water acetic acid (v/v/v). A North American crude oil was diluted to 0.03 mg/mL in toluene. Samples were electrosprayed by direct infusion at a flow rate of 0.5 μL/min.
Capillary Housing
Figure 1 (bottom) is a schematic diagram of the re-designed front end of our custom-built 9.4 T FT-ICR mass spectrometer. Two capillary housings are mounted in parallel on a PEEK holder on the front plate of a dual ion funnel chamber. The upper housing holds an i.d. 0.015″ capillary for petroleum analysis, whereas the lower housing holds an i.d. 0.03″ capillary for biomolecule analysis. (The smaller diameter was used for the petroleum sample because of its high concentration; at lower concentration, solvent contaminants appear.) Both capillaries are 3.94″ long. The vacuum end of each capillary is separated by ∼0.4″ from the entrance of the first ion funnel. Each capillary housing is heated by two 300 W cartridge heaters (Star Electric, Alpharetta, Georgia, USA) connected in series. The heater power is controlled by a dc power supply (Model XFR 150-8, Xantrex, Elkhart, Indiana, USA), and the temperature of the capillary is monitored by a K type thermocouple (Model HH81, Omega Engineering, Stamford, Connecticut, USA). Ions generated by positive ESI are introduced into vacuum via a heated capillary, biased at ∼350 V and heated to ∼100 °C.
Dual Ion Funnel
Each ion funnel is located in a differentially pumped vacuum stage, pumped by a rotary pump (E2M40, Edwards, Sanborn, NY, USA). The ion gauge readings in the differentially pumped chambers are ∼3.0 and ∼0.3 torr, respectively. The centers of two ion funnels are offset by 0.25″ to reduce transmission of large charged particles or droplets that might be deposited on the downstream quadrupole ion guide. Each funnel consists of 83 0.022″ thick printed circuit board (PCB) plates, each of which contains a gold-plated center hole to form a ring electrode.[19] Adjacent electrodes are separated by a 0.028″ thick PCB plate with a 1.2″ ID center hole. The first 43 electrodes have a constant i.d. of 1.0″, whereas the latter 40 electrodes have IDs that decrease linearly from 1.0″ to 0.079″. A linear dc gradient is applied across the ion funnel by applying a dc voltage to the first and last electrode, with a resistor chain connecting all intervening electrodes. Adjacent electrodes receive equal and opposite phases of an rf signal, generating an oscillating electric field to focus ions radially to the center of the ion funnel. The dc voltages applied to the first ion funnel are 280 and 140 V, and for the second ion funnel are 120 and 10 V. As a result, the electric field across the dual ion funnel is ∼27 V/inch for improved ion transmission efficiency. (The funnels can operate with 100/70 V on funnel 1, and 40/10 V on funnel 2, but the choice of voltages can affect the relative abundance of ions of different charge states for large bio-molecules.) Radiofrequency voltages (∼100 Vp-p) of opposite phase at a frequency of ∼1120 kHz are applied to adjacent electrodes of each ion funnel. The RF signal source was generated using a custom-built RF and DC power supply developed by PNNL. The RF source is generated by use of a power MOSFET to drive a balanced tuned circuit resonating with the capacitance of the ion funnel; thereby producing equal-amplitude RF voltages of opposite phase that are applied to adjacent electrodes of each ion funnel.
Quadrupole Ion Guide
A quadrupole ion guide is placed downstream of the dual ion funnel. The pressure is maintained at ∼2.5 × 10⁻³ torr by a 520 L/s turbopump (Pfeiffer, model TPH 520, Germany). The quadrupole ion guide consists of four 12.7″ long, 0.25” diameter titanium rods. The four rods are assembled with an inscribed diameter of 0.22″ to achieve an optimized quadrupolar confining electric potential field.[20] The quadrupole ion guide assembly is aligned by three Vespel SP-1 holders, and is mounted in a 1.25″ OD aluminum shell with wall thickness 0.083″. Opposite rods are connected by a copper strip to ensure identical rf voltage on opposite rod pairs via a single input.
A waveform generator (33120 A, Agilent, Santa Clara, CA, USA) produces a 2.0 MHz rf voltage (1.0 Vp-p), increased to 300 Vp-p by a model 2100L amplifier (Electronics & Innovation, Rochester, NY, USA), and split into two equal-amplitude, opposite phase components by an rf transformer balun. The two rf voltages are applied to adjacent rods of the quadrupole ion guide.
Ion Transfer
Ions are focused by the off-center dual ion funnel, with differentially pumped stages at ∼3.0 torr and 0.3 torr. The first ion funnel is offset from the magnet axis by 0.25″, whereas the second funnel is centered along the magnet axis. Ions emanating from the dual ion funnel are focused by a quadrupole ion guide, operated at 2.0 MHz and ∼300 Vp-p. Ions of interest are selected by a quadrupole mass filter, and are accumulated in an octopole equipped with angled wires for improved ion ejection.8 The octopole is encased by a collision cell containing helium or nitrogen for collisional cooling and efficient trapping.
To improve ion accumulation efficiency, ions may be held in the quadrupole ion guide for 20 ms, and ejected into the downstream octopole accumulator. The process may be repeated several times until enough ions are accumulated in the octopole, after which all ions are ejected into the ICR cell.
ECD Experiments
During ECD experiments, an electron beam is generated by an on-axis 3 mm diameter dispenser cathode at the back of the instrument.[21-23] Electrons are injected into the ICR cell for 50 ms, and followed by a 100 ms electron cleanup event. A -2.5 V and a +10 V dc potential are applied to the cathode and accelerating grid during electron injection. Otherwise, the cathode and accelerating grid are kept at +10 V and ‐200 V.
Data Generation and Handling
Instrument control, data acquisition, and data analysis are carried out with a modular ICR data station.[24] Ions are excited by frequency-sweep (50 Hz/μs) and the 1 Mword time-domain ICR signal is Hanning apodized, zero-filled once, and Fourier transformed to produce a magnitude-mode spectrum that is converted to a mass-to-charge ratio spectrum by a two term calibration equation.[25]
Results and Discussion
Dual Ion Funnel vs Tube Lens/Skimmer
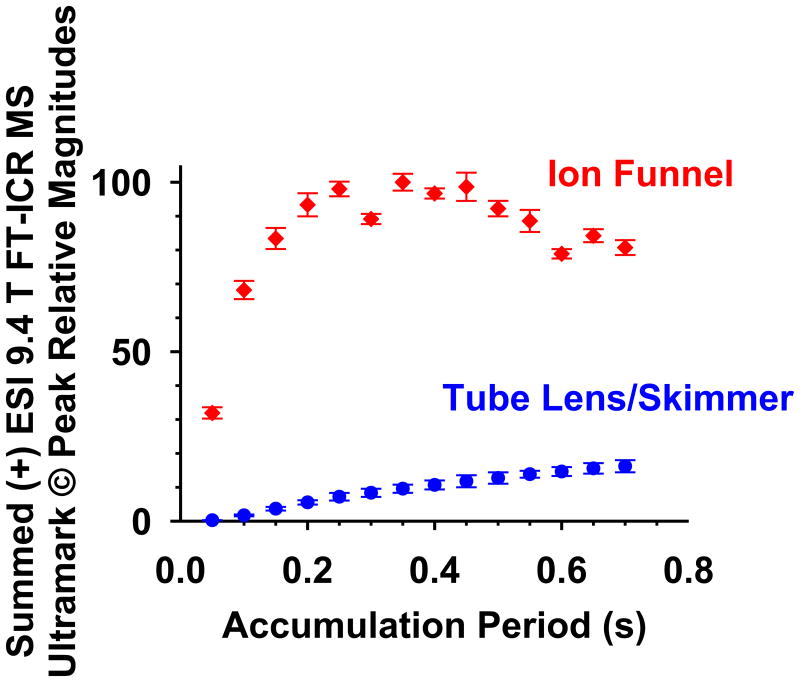
Figure 2 is a plot of summed Ultramark© ion abundance vs. external ion accumulation period for the prior and present instrument configurations. For the skimmer/tube lens configuration, ions accumulate slowly as the accumulation period increases. In contrast, for the funnel, ions accumulate almost immediately and rapidly reach a plateau after ∼0.3 s, at which point the octopole accumulator is saturated. After 0.4 s accumulation, the total ion transmission efficiency is ten-fold higher for the dual ion funnel than for the prior lens/skimmer configuration.
Figure 2.
Summed (+) ESI 9.4 T FT-ICR MS peak magnitudes vs. ion accumulation period, for Ultramark© ions of m/z 922, 1022, 1122, 1222, 1322, 1422, 1522, 1622, 1722, and 1822.
Ion Funnel Pressure
Figure S1 in the Supporting Information shows summed ion abundance as a function of the pressure in the first ion funnel chamber, for Ultramark©, melittin, apo-hemoglobin, and carbonic anhydrase. The pressure in the first ion funnel chamber is controlled by a ball valve on the rough pump, with corresponding effect on the pressure in the second ion funnel chamber. The pressure in the first ion funnel chamber is maintained below 10 torr. The summed ion abundance for Ultramark© decreases with increasing chamber pressure, whereas the summed ion abundance for melittin, hemoglobin, or carbonic anhydrase is relatively independent of funnel 1 pressure. The effective pseudopotential in the funnel is proportional to ion charge,[12, 26] explaining why pressure has less effect for ions of higher charge state. Similar results were observe in prior study by Ibrahim et al.[9]
Quadrupole Ion Guide for Improved Ion Transmission Efficiency
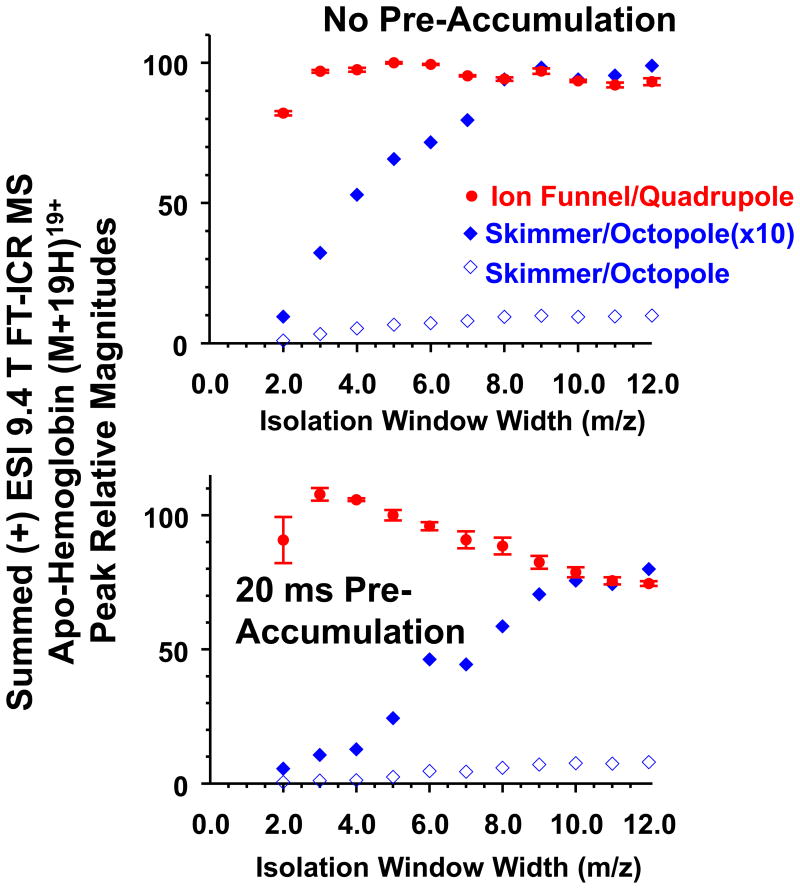
Figure 3 (top) shows summed ion abundance for the apo-hemoglobin (M+19H)19+ isotopic distribution as a function of quadrupole isolation window width for skimmer/octopole and ion funnel/quadrupole configurations. In these experiments, electrosprayed ions are trapped and collisionally cooled in the octopole accumulator before being ejected into the ICR cell. The summed ion abundance for ion funnel/quadrupole configuration remains constant as the isolation m/z window width narrows to as low as 2, whereas the summed ion abundance for the skimmer/octopole configuration decreases gradually below m/z window width = 8.0, making ion isolation for subsequent MS/MS much less efficient. These results suggest that the ion beam inside the quadrupole ion guide is confined to a smaller diameter than for the octopole, leading to more efficient ion transmission and mass selection by the downstream quadrupole mass filter.
Figure 3.
Summed (+) ESI 9.4 T FT-ICR MS signal magnitudes for the apo-hemoglobin (M+19H)19+ charge state isotopic distribution as a function of m/z isolation window width. Top: Ion accumulation in an octopole with angled wires. Bottom: Ion accumulation in the first quadrupole prior to accumulation in the wired octopole (see Figure 1).
For Figure 3 (bottom), ions are accumulated in the quadruple ion guide for 20 ms, prior to trapping and collisional cooling in the octopole accumulator. The results for the skimmer/octopole and funnel/quadrupole are qualitatively similar to those for Figure 3 (top). The results shown in Figure 3 are consistent with the study by Tolmachev et al.,[14] whose theoretical model suggests that charge density is relatively uniform radially in a quadrupole ion guide. As a result, ion density is higher on-axis for a quadrupole compared with an octopole. Therefore, a narrower isolation window for improved mass selection becomes possible if a quadrupole ion guide is utilized for ion transmission. This feature is important for all MS/MS applications. For example in top-down proteomics, proteins with sequence variants and post-translational modifications have very similar m/z, so that precise mass selection is needed.
We acquired (+) ESI 9.4 T FT-ICR mass spectra for compositionally complex Middle Eastern crude oil, for several m/z isolation window widths: 2.0, 4.0, 6.0, and 10.0. For quadrupole mass selection of ions of m/z 581.5, more peaks are selected as the m/z isolation window width is increased from 2.0 to 12.0. In each case, there is a drop in signal magnitude toward either end of the window. The signal amplitude for ions of m/z 581.5 (i.e., the center of the window) increases slightly with increasing m/z isolation window width (see Figure S2 of the Supporting Information).
Histone H2A ECD MS/MS
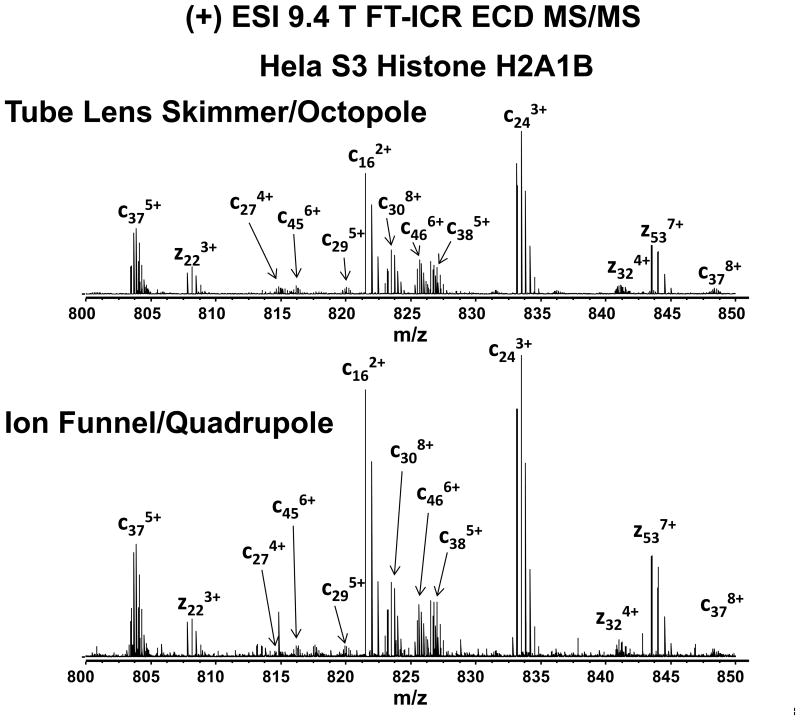
Figure 4 shows a segment m/z = 800 – 850) for the products of electron capture dissociation (ECD) of N-acetylated histone H2A1B (M+15H)15+ precursor ions from HeLa S3 cells, acquired with tube/lens skimmer (top) and ion funnel/quadrupole (bottom) configurations. (M+15H)15+ ions of m/z 937.5 were isolated by a quadrupole mass filter with isolation window of ± 2.0 Da, and held in the octopole accumulator prior to ejection into the ICR cell. Once inside the ICR cell, ions are further isolated by stored waveform inverse Fourier transform (SWIFT) excitation[27, 28] (window width = 0.75 Da) prior to ECD. In order to yield a sufficient number of precursor ions for ECD, histone H2A1B ions had to be accumulated in the octopole accumulator for 4 s for the skimmer/tube lens configuration. The improved transmission efficiency of ion funnel/quadrupole configuration significantly reduced the accumulation period by 10-fold to 0.4 s. Because ECD efficiency depends on the correct timing for electron injection with respect to ion magnetron phase,[23] multiple ECD product ion mass spectra were averaged to improve signal-to noise (S/N) ratio. Figure 4 shows ECD spectra of H2A1B from m/z 800 - 850 collected by tube lens/skimmer (top) and ion funnel (bottom) configurations. Although the tube/lens skimmer configuration requires 10-fold longer data acquisition period compared to the ion funnel configuration, the overall signal-to-noise ratio is comparable for both spectra. Figure S3 in the Supporting Information shows the histone H2A1B ECD fragmentation map produced by ProSight PTM[29]. The same sequence coverage, 67.4% was obtained for both spectra.
Figure 4.
(+) ESI 9.4 T FT-ICR ECD product ion mass spectra for HeLa S3 histone H2A1B acquired with tube lens skimmer/octopole (top) and ion funnel/quadrupole (bottom) configurations
Conclusions
Re-design of the front end of our custom-built 9.4 T FT-ICR mass spectrometer, consisting of replacing a skimmer and octopole ion guide by of a dual ion funnel and a quadrupole ion guide, results in a more than ten-fold increase in ion transmission efficiency. The quadrupole ion guide significantly narrows radial confinement of ions, leading to improved ion transmission and mass selection. Ion abundance remains fairly constant across a quadruple mass filter m/z isolation window width range of 2 to 10, enabling a narrow isolation window without sacrificing ion number. Due to the improved ion transmission efficiency, the ion accumulation period for the reconfigured 9.4 T FT-ICR mass spectrometer could be reduced by ∼10-fold for ECD MS/MS.
Supplementary Material
Figure S-1. Summed (+) ESI 9.4 T FT-ICR MS signal magnitudes vs. pressure in the first ion funnel chamber, for Ultramark© ions of m/z 1022, 1422, and 1622; mellitin 4+ and 5+ charge state ions; apo-hemoglobin 21+, 19+, and 17+ charge state ions; and carbonic anhydrase 38+, 35+, and 32+ charge state ions.
Figure S-2. (+) ESI 9.4 T FT-ICR MS signal magnitude for Middle East crude oil as a function of m/z isolation window width.
Figure S-3. ECD fragmentation map for HeLa S3 histone H2A1B produced by ProSight PTM. Top: data acquired with tube lens skimmer/octopole. Bottom: data acquired with dual ion funnel/quadrupole.
Acknowledgments
We thank Daniel McIntosh for manufacture of all ion funnel components, and Christopher L. Hendrickson, John P. Quinn, Gregory T. Blakney, Tong Chen, and Steven C. Beu for helpful discussions. This work was supported by the National Science Foundation, NSF Division of Materials Research through DMR-11-57490, NSF CHE-1019193, the State of Florida, and (to R.D.S.) NIH P41 GM103493. The ion funnels were designed and assembled in the W. R. Wiley Environmental Molecular Sciences Laboratory (EMSL), a DOE national scientific user facility at the Pacific Northwest National Laboratory (PNNL). PNNL is operated by Battelle for the DOE under contract DE-AC05-76RL0 1830.
Footnotes
Supporting Information: Additional supporting information may be found in the online version of this article at the publisher's web site.
References
- 1.Marshall AG, Hendrickson CL, Jackson GS. Mass Spectrom Rev. 1998;17:1. doi: 10.1002/(SICI)1098-2787(1998)17:1<1::AID-MAS1>3.0.CO;2-K. [DOI] [PubMed] [Google Scholar]
- 2.Marshall AG. Int J Mass spectrom. 2000;200:331. [Google Scholar]
- 3.Senko MW, Hendrickson CL, Emmett MR, Shi SDH, Marshall AG. J Am Soc Mass Spectrom. 1997;8:970. [Google Scholar]
- 4.Senko MW, Hendrickson CL, Paša-Tolić L, Marto JA, White FM, Guan S, Marshall AG. Rapid Commun Mass Spectrom. 1996;10:1824. doi: 10.1002/(SICI)1097-0231(199611)10:14<1824::AID-RCM695>3.0.CO;2-E. [DOI] [PubMed] [Google Scholar]
- 5.Shi SDH, Hendrickson CL, Marshall AG. Proceedings of the National Academy of Sciences. 1998;95:11532. doi: 10.1073/pnas.95.20.11532. [DOI] [PMC free article] [PubMed] [Google Scholar]
- 6.He F, Hendrickson CL, Marshall AG. Anal Chem. 2000;73:647. doi: 10.1021/ac000973h. [DOI] [PubMed] [Google Scholar]
- 7.Kelleher NL, Senko MW, Siegel MM, McLafferty FW. J Am Soc Mass Spectrom. 1997;8:380. [Google Scholar]
- 8.Shaffer SA, Prior DC, Anderson GA, Udseth HR, Smith RD. Anal Chem. 1998;70:4111. doi: 10.1021/ac9802170. [DOI] [PubMed] [Google Scholar]
- 9.Ibrahim Y, Tang K, Tolmachev AV, Shvartsburg AA, Smith RD. J Am Soc Mass Spectrom. 2006;17:1299. doi: 10.1016/j.jasms.2006.06.005. [DOI] [PMC free article] [PubMed] [Google Scholar]
- 10.Kelly RT, Tolmachev AV, Page JS, Tang K, Smith RD. Mass Spectrom Rev. 2010;29:294. doi: 10.1002/mas.20232. [DOI] [PMC free article] [PubMed] [Google Scholar]
- 11.Belov ME, Gorshkov MV, Udseth HR, Anderson GA, Tolmachev AV, Prior DC, Harkewicz R, Smith RD. J Am Soc Mass Spectrom. 2000;11:19. doi: 10.1016/S1044-0305(99)00121-X. [DOI] [PubMed] [Google Scholar]
- 12.Gerlich D. Inhomogeneous rf fields: A versatile tool for the study of processes with slow ions. In: Ng CY, Baer M, editors. State-Selected and State-to-State Ion-Molecule Reaction. Dynamics Part 1. Experiment. Wiley; New York: 1992. pp. 1–176. (Advances in Chemical Physics Series 82). [Google Scholar]
- 13.Kaiser N, Skulason G, Weisbrod C, Bruce J. J Am Soc Mass Spectrom. 2009;20:755. doi: 10.1016/j.jasms.2008.12.022. [DOI] [PMC free article] [PubMed] [Google Scholar]
- 14.Tolmachev AV, Udseth HR, Smith RD. Anal Chem. 2000;72:970. doi: 10.1021/ac990729u. [DOI] [PubMed] [Google Scholar]
- 15.Kaiser N, Quinn J, Blakney G, Hendrickson C, Marshall A. J Am Soc Mass Spectrom. 2011;22:1343. doi: 10.1007/s13361-011-0141-9. [DOI] [PubMed] [Google Scholar]
- 16.Kaiser NK, Savory JJ, McKenna AM, Quinn JP, Hendrickson CL, Marshall AG. Anal Chem. 2011;83:6907. doi: 10.1021/ac201546d. [DOI] [PubMed] [Google Scholar]
- 17.Shechter D, Dormann HL, Allis CD, Hake SB. Nat Protocols. 2007;2:1445. doi: 10.1038/nprot.2007.202. [DOI] [PubMed] [Google Scholar]
- 18.Young NL, DiMaggio PA, Plazas-Mayorca MD, Baliban RC, Floudas CA, Garcia BA. Molecular & Cellular Proteomics. 2009;8:2266. doi: 10.1074/mcp.M900238-MCP200. [DOI] [PMC free article] [PubMed] [Google Scholar]
- 19.Ibrahim YM, Baker ES, Danielson WF, III, Norheim RV, Prior DC, Anderson GA, Belov ME, Smith RD. Int J Mass spectrom. 2014 doi: 10.1016/j.ijms.2014.07.034. in press. [DOI] [PMC free article] [PubMed] [Google Scholar]
- 20.Dawson PH. Quadrupole Mass Spectrometry and its Applications. Elsevier; Amsterdam: 1976. pp. 121–152. Chapter VI. [Google Scholar]
- 21.Tsybin Y, Quinn J, Tsybin O, Hendrickson C, Marshall A. J Am Soc Mass Spectrom. 2008;19:762. doi: 10.1016/j.jasms.2008.02.007. [DOI] [PubMed] [Google Scholar]
- 22.Tsybin YO, He H, Emmett MR, Hendrickson CL, Marshall AG. Anal Chem. 2007;79:7596. doi: 10.1021/ac071165u. [DOI] [PubMed] [Google Scholar]
- 23.Tsybin YO, Hendrickson CL, Beu SC, Marshall AG. Int J Mass spectrom. 2006;255–256:144. [Google Scholar]
- 24.Blakney GT, Hendrickson CL, Marshall AG. Int J Mass spectrom. 2011;306:246. doi: 10.1016/j.ijms.2011.08.006. [DOI] [PMC free article] [PubMed] [Google Scholar]
- 25.Ledford EB, Rempel DL, Gross ML. Anal Chem. 1984;56:2744. doi: 10.1021/ac00278a027. [DOI] [PubMed] [Google Scholar]
- 26.Dehmelt HG. In: Advances in Atomic and Molecular Physics. Bates DR, Immanuel E, editors. Vol. 3. Academic Press; 1968. p. 53. [Google Scholar]
- 27.Marshall AG, Wang TCL, Ricca TL. J Am Chem Soc. 1985;107:7893. [Google Scholar]
- 28.Guan S, Marshall AG. Int J Mass Spectrom Ion Processes. 1996;157–158:5. doi: 10.1016/S0168-1176(96)04407-2. [DOI] [PMC free article] [PubMed] [Google Scholar]
- 29.LeDuc RD, Taylor GK, Kim YB, Januszyk TE, Bynum LH, Sola JV, Garavelli JS, Kelleher NL. Nucleic Acids Res. 2004;32:W340. doi: 10.1093/nar/gkh447. [DOI] [PMC free article] [PubMed] [Google Scholar]
Associated Data
This section collects any data citations, data availability statements, or supplementary materials included in this article.
Supplementary Materials
Figure S-1. Summed (+) ESI 9.4 T FT-ICR MS signal magnitudes vs. pressure in the first ion funnel chamber, for Ultramark© ions of m/z 1022, 1422, and 1622; mellitin 4+ and 5+ charge state ions; apo-hemoglobin 21+, 19+, and 17+ charge state ions; and carbonic anhydrase 38+, 35+, and 32+ charge state ions.
Figure S-2. (+) ESI 9.4 T FT-ICR MS signal magnitude for Middle East crude oil as a function of m/z isolation window width.
Figure S-3. ECD fragmentation map for HeLa S3 histone H2A1B produced by ProSight PTM. Top: data acquired with tube lens skimmer/octopole. Bottom: data acquired with dual ion funnel/quadrupole.


