

ABSTRACT
Using high-throughput RNA sequencing data from 50 common lymphoma cell culture models from the Cancer Cell Line Encyclopedia project, we performed an unbiased global interrogation for the presence of a panel of 740 viruses and strains known to infect human and other mammalian cells. This led to the findings of previously identified infections by Epstein-Barr virus (EBV), Kaposi's sarcoma herpesvirus (KSHV), and human T-lymphotropic virus type 1 (HTLV-1). In addition, we also found a previously unreported infection of one cell line (DEL) with a murine leukemia virus. High expression of murine leukemia virus (MuLV) transcripts was observed in DEL cells, and we identified four transcriptionally active integration sites, one being in the TNFRSF6B gene. We also found low levels of MuLV reads in a number of other cell lines and provided evidence suggesting cross-contamination during sequencing. Analysis of HTLV-1 integrations in two cell lines, HuT 102 and MJ, identified 14 and 66 transcriptionally active integration sites with potentially activating integrations in immune regulatory genes, including interleukin-15 (IL-15), IL-6ST, STAT5B, HIVEP1, and IL-9R. Although KSHV and EBV do not typically integrate into the genome, we investigated a previously identified integration of EBV into the BACH2 locus in Raji cells. This analysis identified a BACH2 disruption mechanism involving splice donor sequestration. Through viral gene expression analysis, we detected expression of stable intronic RNAs from the EBV BamHI W repeats that may be part of long transcripts spanning the repeat region. We also observed transcripts at the EBV vIL-10 locus exclusively in the Hodgkin's lymphoma cell line, Hs 611.T, the expression of which were uncoupled from other lytic genes. Assessment of the KSHV viral transcriptome in BCP-1 cells showed expression of the viral immune regulators, K2/vIL-6, K4/vIL-8-like vCCL1, and K5/E2-ubiquitin ligase 1 that was significantly higher than expression of the latency-associated nuclear antigen. Together, this investigation sheds light into the virus composition across these lymphoma model systems and provides insights into common viral mechanistic principles.
IMPORTANCE Viruses cause cancer in humans. In lymphomas the Epstein-Barr virus (EBV), Kaposi's sarcoma herpesvirus (KSHV) and human T-lymphotropic virus type 1 are major contributors to oncogenesis. We assessed virus-host interactions using a high throughput sequencing method that facilitates the discovery of new virus-host associations and the investigation into how the viruses alter their host environment. We found a previously unknown murine leukemia virus infection in one cell line. We identified cellular genes, including cytokine regulators, that are disrupted by virus integration, and we determined mechanisms through which virus integration causes deregulation of cellular gene expression. Investigation into the KSHV transcriptome in the BCP-1 cell line revealed high-level expression of immune signaling genes. EBV transcriptome analysis showed expression of vIL-10 transcripts in a Hodgkin's lymphoma that was uncoupled from lytic genes. These findings illustrate unique mechanisms of viral gene regulation and to the importance of virus-mediated host immune signaling in lymphomas.
INTRODUCTION
Over the past 50 years, it has become well established that viruses are a significant cause of a variety of human malignancies (1). Throughout this time, a large number of highly varied experimental methods ranging from electron microscopy to PCR have been important for the study of virus-tumor associations and the underlying mechanisms. From this work, we have gained a great appreciation for many of the virus-cancer associations, as well as for many of the mechanisms driving the virus infection cycle and virus-mediated oncogenesis. Despite the substantial advances using these methods, next-generation sequencing (NGS) has the potential to further our understanding of viral oncogenesis in new ways. First, NGS can be used to investigate infectious agents without the aid of prior knowledge of the infectious agents. At the same time, there are diverse kinds of information that can be derived from NGS studies (ranging from global transcriptome information, chromatin association and configuration data, to viral integration information) that expand beyond the simple virus-tumor associations to teach us new aspects of viral infection and oncogenic mechanisms.
Human viruses such as the Epstein-Barr virus (EBV), Kaposi's Sarcoma Herpesviruses (KSHV) and human T-lymphotropic virus type 1 (HTLV-1) are important contributors to B-cell and T-cell lymphomas. Despite some common themes, there is great diversity in the ways that these viruses interact with the host to achieve productive infections and in some cases, oncogenesis. Here, we utilized lymphoma RNA sequencing (RNA-seq) data sets to perform a global assessment of viral involvement in a panel of 50 routinely used lymphoma cell line models. We also took advantage of the richness of RNA-seq data to inform us about the viral transcriptomes and mechanisms of virus-host interactions in these model systems.
MATERIALS AND METHODS
RNA-seq data acquisition.
RNA-seq data (in BAM format) from 50 lymphoma cell lines was obtained from the Cancer Genomics Hub (CGHub) (https://cghub.ucsc.edu/). These data were generated by the Broad Institute for The Cancer Cell Line Encyclopedia (CCLE) project (2) and was deposited under “lymphoid neoplasm diffuse large B-cell lymphoma.” Poly(A)-selected cDNA libraries were prepared using total RNA from each cell line. The libraries were subjected to paired-end 101 base sequencing reactions using the Illumina platform. The downloaded BAM files were converted to paired FASTQ files using the Picard samtofastq script (default parameters; http://picard.sourceforge.net). Under the default condition, Picard samtofastq outputs only the primary alignments. This is important because the BAM files contain secondary alignments for repeat regions which results in multiple copies of repeat aligned reads. The inclusion of these copies during conversion to FASTQ format would cause gross overrepresentation of read coverage at repeat regions.
Virome analysis.
The paired-end FASTQ files for each of the 50 cell lines were aligned to a custom reference genome using the sequencing aligner STAR (Spliced Transcripts Alignment to a Reference) version 2.3.0 (command options: clip5pNbases 6, outFilterMultimapNmax 1000) (3). The custom reference genome was built to include the human reference genome, hg19 (Genome Reference Consortium GRCH37), human ribosomal DNA sequences, 740 mammalian virus genomes from NCBI (see Table S1 in the supplemental material) and bacterial phage genomes from the DDBJ (DNA Database of Japan). The numbers of reads that mapped to human hg19, ribosomal DNA, viruses and phages were quantified using in-house scripts. Viral read numbers were normalized by calculating viral reads per million unique mapped reads (VPMM).
Transcriptome and splicing analysis.
The paired-end FASTQ files were aligned to the human hg19 genome and the genomes of the identified viruses in our virome analysis using the junction aligner, TopHat version 2.0.9 (command options: -p 10, –solexa-quals, -g 1, –no-coverage-search, –fusion-search) (4). Aligned viral reads were extracted from the subsequent TopHat output. Splice junction reads with counts lower than 5 were discarded. Viral reads and annotated junctions were loaded onto the Integrative Genomics Viewer (IGV) (5, 6) for visualization and analysis.
Hierarchical clustering analysis of EBV gene expression.
The expression of EBV genes was quantified using SAMMate (7). Reads aligned to each EBV gene were counted, and FPKMs (i.e., fragments per kilobase per million mapped reads) were calculated by normalizing the read numbers to the kilobases of total exon length and millions of total mapped EBV reads. The oriLyt unique regions (right and left), W repeat intronic regions, and W repeat exonic regions were included as additional annotated gene features in our annotation file. Lytic genes that overlap latent genes were excluded from the clustering analysis to avoid ambiguous read allocation. In addition, quantification data for the Raji cell line was excluded from the clustering analysis because the deletion of a number of lytic genes may cause biases in determining the basal lytic transcription level for this cell line. Hierarchical clustering analysis was performed using MeV (MultiExperiment Viewer) based on EBV read counts and FPKM values (metric: Pearson correlation, average linkage clustering) (8).
Quantification of KSHV gene expression.
The paired FASTQ files from the KSHV-positive BCP-1 cell line were run through RSEM-1.2.12 (command options: rsem-calculate-expression -p 24 –paired-end –no-bam-output) (9) to quantify gene expression. The RSEM reference file was built with genome sequences and annotation for hg19, EBV, KSHV, murine leukemia virus (MuLV), and HTLV-1.
Cell culture.
Hs 611.T (ATCC CRL7373) cells were cultured in Dulbecco modified Eagle medium/high glucose medium (Thermo Scientific, catalog number SH30243) supplemented with 10% fetal bovine serum (FBS; Invitrogen-Gibco, catalog number 16000-069) and 0.5% penicillin-streptomycin (pen/strep; Invitrogen-Gibco, catalog number 15070-063). EBV-positive Akata, Raji, and JY cells were cultured in RPMI 1640 medium (Thermo Scientific, catalog number SH30027) supplemented with 10% FBS and 0.5% pen/strep. All cell lines were cultured at 37°C in a humidified, 5% CO2 incubator.
Viral interleukin-10 (vIL-10) transcription analysis.
Total RNA was isolated from Hs 611.T and Akata cells using TRIzol reagent (Life Technologies, catalog number 15596-018) according to the vendor's protocol. Nuclear and cytoplasmic RNA was isolated using a cytoplasmic and nuclear RNA purification kit (Norgen Biotek Corp., catalog number 21000) according to the vendor's protocol. All RNA preparations were subjected to DNase treatment using the DNA-free kit (Life Technologies, catalog number AM1906). Standard reverse transcription was performed using an iScript cDNA synthesis kit (Bio-Rad, catalog number 170-8891) according to the vendor's protocol. Strand-specific reverse transcription was carried out with modified gene specific primers using the method as described by Feng et al. (10). cDNA was synthesized at 65°C for 50 min using ThermoScript reverse transcriptase (Life Technologies, catalog number 12236-022) and treated with exonuclease I (NEB, catalog number M0293L) to remove the excess gene-specific primers. Quantitative PCR (qPCR) analysis was performed using iQ SYBR green Supermix (Bio-Rad, catalog number 170-8882) on a Bio-Rad CFX96 instrument as follows: 2 μl of cDNA (5 ng/μl) and 1 μl of 10 μM primers were mixed with 10 μl of SYBR green Supermix, and 7 μl of nuclease free H2O was added to a final reaction volume of 20 μl. Polymerase was activated and cDNA was denatured at 95°C for 5 min. cDNA was then amplified for 40 cycles with 15 s of denaturation at 95°C, 60 s of annealing/extension, and plate reading at 60°C. Melting curve analysis was performed at temperatures from 60 to 90°C with 0.5°C increment per 5 s. Expression fold changes were calculated using the comparative threshold cycle method (2−ΔΔ CT).
The primers used for qPCR were as follows: P1_F, ATAGCACAATGCCACCACTGAACC; P1_R, GCCTGCTTCTTCATTCTCCTTCGT; P2_F, GTATGGAGCGAAGGTTAGTG; P2_R, GTCACATTGGTCTGTACCTC; P3_F, GAAGGTTAGTGGTCACTCTG; P3_R, GACTGAAGGCATCTCTTAGG; ACTB_F, CACTCTTCCAGCCTTCCTTC; and ACTB_R, GTACAGGTCTTTGCGGATGT. The modified gene specific primers used for strand-specific RT (lowercase letters indicate mismatches) were as follows: P1_mGSP_L, ATAGCACAATGCCACCACTGAACCaattaTTCAAATTTTA; P1_mGSP_R, GCCTGCTTCTTCATTCTCCTTCGTggcGCggcTAGAATAACTG; P3_mGSP_L, GAAGGTTAGTGGTCACTCTGtAtTaatTGGTGCTGCTTTA; P3_mGSP_R, GACTGAAGGCATCTCTTAGGTttaTaAAtATTTGGGGAA; and ACTB_mGSP, GTACAGGTCTTTGCGGATGTttAtaTaACACTTCATG.
De novo assembly of virus genomes.
For the virus genome assembly in the DEL cell line, all reads that mapped to viruses were pulled out from the SAM alignment file and de novo assembled using the assembler, Trinity (11). Three long contigs of about 6,800 bp (representing alternatively spliced transcripts) and a single overlapping short contig were used to assemble a nearly full-length sequence that spanned most of the genome except for a few hundred long terminal repeat (LTR) sequences at each end. The missing flanking LTR sequences were substituted with the corresponding sequences from the close relatives EKVX and DG75 to generate a chimeric genome. Alignment of reads from DEL cells against this reconstructed genome yielded three mismatches at the 5′ inserted DG75 derived sequence. This sequence was corrected in our genome after which alignment of reads from the DEL cell line showed no mismatches. The HTLV-1 genomes in the HuT 102 and MJ cell lines were assembled through a similar process.
Virus integration analysis.
Raji integration sites were first detected by analyzing the chimeric reads that span both the EBV genome and the human genome as described in the following paragraph. The result of this analysis was consistent with the finding in a previous report by Takakuwa et al. (12). To study the aberrant transcription and splicing caused by EBV integration, a chimeric EBV-chr6 chromosome was generated representing the integration and Raji FASTQ files were aligned to this chimeric chromosome along with all of the other human chromosomes using TopHat. Splice junctions with read counts lower than 5 were discarded. The read coverage and filtered junctions were loaded onto IGV to visualize the transcription and assess the consequences of integration on BACH2 and EBV gene splicing.
Viral integration analysis was carried out using the following in-house protocol and scripts. To increase the sensitivity for detection of virus integrations and the junction spanning potential of each read pair, truncated read pairs contained the first 27 bases from each of the original paired-end reads were generated, and the read partners were aligned separately to the human hg19 genome plus the appropriate virus genome using Novoalign (Novocraft Technologies). Read pairs in which one of the pair aligned to the EBV genome and the other aligned to the human genome were pulled out. To dismiss ligation chimeras, clusters of reads were collated and counted based on the number of consecutive reads that mapped to within 300 bases of each other in the human genome. Read clusters with greater than 10 unique (non-PCR duplicate) reads were visually inspected on a genome browser to assess uniform read orientations (for ligation chimeras, read orientation is random, whereas for true integrations, reads are uniformly aligned toward the integration site).
EBV integration and splicing validation in Raji cells.
Total Raji RNA was isolated using TRIzol reagent. cDNA was made using the iScript cDNA synthesis kit. To validate the integration sites and splicing junctions, PCR was performed using a Taq PCR kit (NEB, catalog number E5000S) according to the vendor's protocol. Initial denaturation of cDNA templates was carried out at 95°C for 30 s. The templates were then amplified for 30 cycles: denaturation at 95°C for 30 s, annealing at 55 to 60°C for 30 s and elongation at 68°C for 1 min. The final extension was at 68°C for 5 min. Annealing temperatures were optimized for each primer pair. The PCR products were run on a 1% agarose gel. The primers used for PCR were as follows: BACH2 exon1-exon2_F, CTTGGTCCCAAATGATGTCT; BACH2 exon1-exon2_R, CGAGCTGCCATGTGATG; BGRF1-BACH2 exon1_F, CTTCAGTAGGTGGCGAAATG; BGRF1-BACH2 exon1_R, TTGTGGACGAGGCTAACT; Exon1-EBNAs_F, CTTCACTTCGGTCTCCCCTA; and Exon1-EBNAs_R, GAACGAGCTGCCATGTG.
RNA sequencing.
Total RNA was extracted from JY cells using TRIzol reagent according to the vendor's instructions. Poly(A)-selected or ribodepleted (Ribo-Zero; Epicentre, catalog number MRZH11124) cDNA libraries were prepared using the TruSeq stranded protocol (Illumina, catalog number RS-930-2001). Poly(A)-selected samples underwent 101 base paired-end sequencing using an Illumina HiSeq 2000 instrument. Ribodepleted samples underwent 101 base single-end strand-specific sequencing using an Illumina HiSeq 2000 instrument.
RESULTS
Virome analysis of 50 lymphoma cell lines.
To assess the viromes of lymphoma cell lines sequenced through the CCLE project, we downloaded a 50-lymphoma RNA-seq data set from the Cancer Genomics Hub (CGHub; https://cghub.ucsc.edu/). This panel of cell lines represented a range of B- and T-cell lymphoma subtypes. The average number of reads per cell line was approximately 164 million, ranging from 74.6 million to 209.8 million. Based on our previous investigations of microbial agents in biological specimens and cell lines (13–15), these read depths were deemed to be well above the minimum levels required to detect meaningful pathological infections.
The virome for each cell line was assessed by aligning each RNA-seq data set against a reference genome containing the human hg19 genome plus the genomes of 740 virus strains that are known to infect human and other mammalian cells (see Table S1 in the supplemental material). The reads aligned to each virus from each cell line were counted and the data for all detected viruses was collated into a single excel spread sheet (see Table S2 in the supplemental material). Although low numbers of reads aligned to the hepatitis C genome in most samples, these reads were found to be composed of homopolymer sequences [poly(T) tracts] that mapped to a poly(T) tract in the hepatitis C genome. With a lack of any other read evidence for hepatitis C, these poly(T)-containing sequences most likely represent poly(A) tails from human transcripts. Low numbers of reads were also attributed to hepatitis B, human herpesvirus 7, Merkel cell polyomavirus, simian virus 40, human adenovirus, and parainfluenza virus 5 in several samples. Manual BLAST analysis of these reads showed true matches to the corresponding viruses. Nevertheless, the low read numbers in these cases suggest that they are most likely due to cross-contamination during sequencing rather than transcription from endogenous viruses (see M. J. Strong et al. [58] and below). In contrast, more than 10,000 reads were found for EBV, KSHV, HTLV-1 and murine retroviruses (see Table S2 in the supplemental material and Fig. 1) in some samples and these viruses were investigated in more detail.
FIG 1.

HTLV-1, EBV, KSHV, and murine type C retrovirus (Mu-C-retro) detection in 50 lymphoma cell lines. (A) A heat map shows the number of detected viral reads per million unique mapped reads (VPMM) in the 50 cell lines. Color intensity represents relative VPMM across all cell lines. (B) Histogram of VPMM for each virus in the respective virus-positive cell lines.
Detection of EBV.
For each of the seven cell lines known to harbor EBV, more than 10,000 reads were detected (see Table S2 in the supplemental material), corresponding to more than 400 reads per million unique mapped reads (Fig. 1). An additional cell line, DOHH-2, showed a relatively low 838 EBV reads (see Table S2 in the supplemental material). The DOHH-2 cell line was originally categorized as EBV negative (16) and a cell line vendor, Deutsche Sammlung von Mikroorganismen und Zellkulturen (DSMZ), classifies it as EBV negative. Nevertheless, a previous study showed the presence of EBV in DOHH-2 cells by PCR analysis with EBV episomes detected in only a small fraction of cells by FISH (17). Since the DOHH-2 cell line was derived by the clonal expansion of a mixed EBV negative and EBV positive culture as described by DSMZ, it is possible that there was carryover of a small percentage of EBV positive cells during the selection of EBV negative cells. Lastly, very low numbers of EBV reads were detected in another 29 samples. Manual BLAST analysis of the corresponding EBV reads excluded the possibility of misalignment of human reads to the EBV genome. We therefore suspect that similar to our contention regarding low read numbers detected for other viruses, these low numbers of EBV reads most likely reflect cross-contamination during sample processing and/or sequencing (58).
EBV transcriptome analysis.
To comprehensively explore the EBV transcriptome in EBV positive cell lines, we aligned the corresponding RNA-seq reads to the Akata EBV genome (18). To allow for the detection of LMP2 splicing across the terminal repeat region, we split the genome between the lytic genes, BBRF2/3 and BGLF3.5, rather than at the terminal repeats (Fig. 2). As additional comparisons, we included the RNA-seq data generated in our lab for the type I latency Akata cell line (19) and the type III latency JY cell line (see Materials and Methods). For the most part, gene expression reflected type III latency-like transcription profiles and was in line with previously reported gene expression profiles and genomic deletion data for these cell lines (Fig. 2) (20–22). Nevertheless, unique expression patterns were detected in the EBNA BamHI W repeat intronic regions, the oriLyt loci and the oriP-BCRF1/vIL-10 region.
FIG 2.

EBV read coverage in EBV-positive lymphoma cell lines. The vertical axis represents the number of reads aligning to each nucleotide position. The linear EBV annotation was split between BBLF2/3 and the BGLF3.5 lytic genes instead of the terminal repeats to facilitate the analysis of coverage and splicing for the LMP2 gene. Blue bars represent lytic genes, red bars represent latent genes, green bars represent noncoding genes, aquamarine bars represent microRNAs, and black bars represent nongene features.
EBV BamHI W repeat intronic transcripts.
A recent study identified a short (81-nucleotide) stable intronic sequence (sis)RNA between the W1 and W2 exon of the EBV EBNA BamHI W repeat region and a large RNA hairpin structure upstream from the W1 exon (Fig. 3B) (23). The large hairpin is part of an extensively structured RNA predicted throughout the long W repeat intron which was similarly suggested to be an independent sisRNA (24). In all type III or type III-like latency cell lines, we noted marked coverage across most of the intronic regions of the BamHI W repeat sequences although the levels in the Namalwa cell line were found to be low (Fig. 2 and 3B). In contrast, no expression was observed in the type I latency cell line Akata. This is in keeping with the hypothesis that these transcripts are derived from the Cp and/or Wp promoters that drive EBNA latency gene expression in latency type III cells (as opposed to type I latency cell lines where EBNA1 expression is derived from the downstream Qp promoter). Strand-specific RNA sequencing of the JY cell line indicated that transcription of the intronic regions is in the rightward direction (Fig. 3B), an observation that is likewise consistent with the sisRNAs being generated from the Cp or Wp promoters.
FIG 3.

Analysis of transcription in the EBV BamHI W intronic and oriLyt regions. (A) Hierarchical clustering analysis of EBV gene expression shows expression in the BamHI W intronic region and oriLyt regions more closely resembles latency gene expression than lytic gene expression. Overlapping genes were excluded from analysis due to uncertainty of read mapping. The Raji cell line was excluded from the analysis due to deletion of a number of lytic genes. The top horizontal axis shows distance between cell lines based on EBV transcriptome patterns. (B) Read coverage in the BamHI W repeat region. The vertical axis represents the number of reads aligned to each nucleotide position. Only the beginning of the repeat region is shown to better illustrate coverage. Ribodepleted strand-specific JY RNA-seq data (JY-se for transcription in sense direction and JY-as for antisense direction) suggests the BamHI W intronic region is transcribed from the sense direction. (C) Read coverage in the right oriLyt (oriLyt-Rt) and left oriLyt (oriLyt-Lt) regions. Transcription of oriLyt regions is in the sense direction in JY cells.
sisRNAs typically arise from excised intronic sequences and are therefore not polyadenylated. Expecting that excised intronic BamHI W RNAs were not polyadenylated, we were surprised to find abundant coverage in the data from the CCLE cell lines and the non-strand-specific JY cell line, all of which was derived from poly(A)-selected RNA. Furthermore, the level of BamHI W intronic coverage was similar in data from ribodepleted (strand-specific experiment) and poly(A) (non-strand-specific data) selected JY RNA (Fig. 3B). In contrast, 20,717 and 0 reads mapping to the nonpolyadenylated EBV EBER1 gene were found in ribodepleted and poly(A)-selected JY RNA, respectively. This suggests that the BamHI W intronic RNAs are linked to poly(A) tracts or tails.
Considering the possibility that cryptic poly(A) signals might exist in the BamHI W region, we searched EBV reads for evidence of poly(A) tails using the bioinformatic approach that we had used previously (19). While poly(A)-containing reads were well correlated with other known poly(A) signals in the EBV genome, we saw no clear evidence of poly(A) reads mapping to the BamHI W region. This raises the possibility that much of the coverage that we observe in the BamHI W intron regions results from long, relatively unspliced, EBNA transcripts containing their normal 3′ terminal poly(A) sequences. Clearly, some of these transcripts were normally spliced because we detected junction reads across this region (data not shown). Nevertheless, the high levels of intronic coverage suggest a complex mixture of spliced, partially spliced, sisRNA, and possibly unspliced transcripts that perhaps extend across the entire BamHI W repeat region.
EBV oriLyt transcripts.
We have previously observed bidirectional transcription of the oriLyt region in reactivated Akata cells (19; S. Cao et al., unpublished data). Here we observed read coverage at the lytic origins of replication in the type III latency cell lines that was not observed in uninduced Akata cells (Fig. 3C). At least in JY cells, these transcripts are oriented in the rightward direction as determined by strand-specific sequencing (Fig. 3C). Due to the homology between the left and the right oriLyts, however, we were not able to determine whether the transcripts originated from one or the other or both regions of the genome. There was no noticeable correlation between oriLyt coverage and lytic gene expression (Fig. 2) raising the possibility that these reads were derived from latency transcripts. Further, hierarchical clustering showed that these transcripts cluster more closely to latency genes with the closest relationship being to the intronic W repeat transcripts and BHRF1 transcripts (Fig. 3A). These oriLyt transcripts likely represent latency RNAs similar to transcripts described by Xue et al. (25) and/or are isoforms of BHRF1 transcripts (26).
Transcription of the EBV vIL-10 locus in a Hodgkin's lymphoma cell line.
Although the coverage at most of the lytic genes roughly correlated with each other across the different cell lines, we noted unusually high coverage at the EBV encoded vIL-10 (BCRF1) locus in the Hodgkin's cell line, Hs 611.T, that did not correlate with the coverage levels of other lytic genes (Fig. 4A). In line with the disconnection between vIL-10 coverage and other lytic genes, vIL-10 clustered separately from other lytic genes (Fig. 3A) and was expressed at higher relative levels in Hs 611.T cells (see Fig. S1 in the supplemental material). qRT-PCR analysis showed higher transcription levels in Hs 611.T than Akata cells (Fig. 4B) and strand-specific qRT-PCR showed that these are transcribed in the rightward direction (Fig. 4C). Together, these data suggest that expression of vIL-10 transcripts in Hs 611.T cells is disconnected from the expression of other lytic genes, perhaps driven instead by tissue specific cellular factors in this Hodgkin's lymphoma milieu.
FIG 4.

Analysis of transcription in the EBV oriP-BCRF1/vIL-10 gene region. (A) Transcription level at the oriP-BCRF1 region is higher in Hs 611.T than in other EBV-positive cell lines. The vertical axis represents the number of reads aligned to each nucleotide position. BBRF3 is used as a reference gene to illustrate the discordance of oriP-BCRF1 expression with other lytic gene expression. (B) Transcription in oriP-BCRF1 region in Hs 611.T cells is validated by qRT-PCR analysis. (C) Strand-specific qRT-PCR analysis shows that the oriP-BCRF1 region is predominantly transcribed in the sense direction. The primers used for analysis are indicated in panel A.
New splicing evidence in the BamHI A region of the EBV genome.
Alternative splicing of a group of rightward noncoding latency transcripts from the BamHI A region (BamHI A rightward transcripts [BARTs]) has been extensively studied (27–29). In addition to giving rise to apparently stable viral lncRNAs, introns from some of these transcripts are further processed to generate the bulk of the EBV encoded microRNAs. We analyzed splicing across the EBV genome using TopHat and detected all of the previously identified canonical splicing events for these EBV lncRNAs (Fig. 5A). A genome deletion of part of this region in JY cells (corresponding to the deletion found in the B95-8 strain of virus) gives rise to the splicing of upstream exons to the most proximal splice acceptors of the last few exons (Fig. 5A).
FIG 5.

Evidence of new splicing of BARTs in the BamHI A region of the EBV genome. (A) Canonical splicing of BARTs is shown for each cell line. (B) Novel splicing events identified in each cell line. Each bar represents a spliced-out intron with color intensity (black to red) reflecting read abundance for each splicing event (total read number was shown below each bar). Only introns with more than five reads are shown.
In addition to previously annotated splice junctions, we also found evidence of novel splicing. Evidence for a new junction originating from the intron downstream from exon 4 and spliced to the exon 5 splice acceptor was found in seven of the cell lines. And exon 6 was spliced to a new acceptor in its 3′ intron (Fig. 5B and Table S7 in the supplemental material). Additional new splice junctions were found within exons 5 and 7, some of which were observed in multiple cell lines (Fig. 5B and Table S7 in the supplemental material). These data add to the already complex splicing known for this region and implies the presence of extensive fine-tuning mechanisms that generate a complex set of isoforms with refined functions in regulating EBV and/or cellular gene expression and signaling.
In Raji cells, EBV integration disrupts BACH2 expression through a splice donor sequestration mechanism.
Although rare, EBV has occasionally been found to integrate into the host cell genome (30–36). To assess integration events in all EBV-infected cell lines, we developed a pipeline to identify chimeric transcripts and their associated genome locations from NGS data. This method uses truncated read ends (27 bases each) from each paired-end read set to align separately to the human and EBV genomes. Chimeric read pairs are then analyzed for high-density clustering on the human genome (see Materials and Methods for details). Using this approach, we saw no evidence of integration in the Granta-519, Daudi, CI-1, Namalwa, Hs 611.T, or P3HR-1 cell lines (DOHH-2 data were not analyzed due to the low read numbers). Consistent with previous studies, however, we found two clusters of 209 and 235 chimeric read pairs mapping to the first intron of the BACH2 tumor suppressor gene in Raji cells (see Table S3 in the supplemental material) (12, 30). Alignment using full-length Raji reads showed robust coverage of BACH2 exon 1 but minimal coverage at all downstream exons, whereas Namalwa cells, which do not have a BACH2 integration, showed high coverage across all exons (Fig. 6, top panel). This suggests that the integration in intron 1 is disruptive to BACH2 expression.
FIG 6.

Disruption of BACH2 expression by EBV integration in Raji cells occurs through a splice donor sequestration mechanism. The vertical axis represents the number of reads aligned to each nucleotide position. The top panel shows read coverage and splicing data for the wild-type BACH2 gene in Namalwa and Raji cells (only canonical splicing is shown). The bottom panel shows the alignment of RNA-seq data to EBV-chr6 chimeric genome and the splicing events across the EBV-chr6 junction sites. Gel pictures show the presence of chimeric transcripts in Raji cells but not in the negative control Akata cells by RT-PCR analysis.
To address the mechanism of BACH2 disruption, we generated a chimeric chromosome 6 containing the EBV genome in silico. We then aligned full-length Raji reads to this chimeric genome using the junction mapper, TopHat. Whereas no BACH2 exon 1 to 2 splicing was observed in the alignment to the wild-type genome, 135 reads mapped to a chimeric junction corresponding to splicing from the BACH2 exon 1 to the BamHI W exon, W1 (Fig. 6, lower right panel). BACH2 exon 1 to W1 splicing but not the BACH2 exon 1 to exon 2 splicing was validated in Raji cells by RT-PCR (Fig. 6, bottom panel). These data showed that disruption of BACH2 expression occurs through sequestration of the exon 1 splice donor. Conversely, these findings also show that expression of EBV latency genes in Raji cells is directed in part by the BACH2 promoter.
KSHV transcriptome analysis.
Like EBV, the KSHV genome principally resides in the host cell as an episome rather than through integration into the host genome. In line with this, we saw no evidence of transcriptionally active integrations for KSHV indicating that this is likely the case in BCP-1 cells.
The classic KSHV latency locus is located toward the right side of the linear genome and encodes genes such as kaposin A, vFLIP, vCyclin, and LANA, as well as the viral microRNAs (Fig. 7). Nevertheless, it is becoming clear that other genes, such as the noncoding PAN and the vIL-6 genes located in the left cluster of the genome (Fig. 7) are expressed in some tissues in the absence of reactivation (37–42). Notably, in BCP-1 cells, many genes in the left cluster of the genome, including vIL-6 and PAN (Fig. 7), are expressed at levels that are considerably higher than genes in the classic rightward latency cluster. For example, the most highly expressed gene in the rightward cluster was found to be LANA, which showed an expression value of 39 FPKM (fragments per kilobase per million mapped reads). In contrast, the expression of K2/vIL-6 was 840 FPKMs, that of K4/vIL-8/vCCL3 was 145 FPKMs, that of K5/E3-ubiquitin ligase was 351 FPKMs, and that of K6/vIL-8/vCCL-1 was 54 FPKMs. Expression of some of these genes, such as K4/vIL-8/vCCL3 were shown previously to be partly dependent on Rta expression (42). Nevertheless, even if expression of some of these genes occurs in a small percentage of reactivating cells, the high expression levels of secreted cytokines, for example, might be expected to not only have an intrinsic impact on lytic cells but may also have an extrinsic impact on proximal latently infected cells.
FIG 7.

KSHV transcriptome analysis in BCP-1 cells. The vertical axis represents the number of reads aligned to each nucleotide position. Coverage across entire genome is represented in the bottom panel and expanded coverage views for the left, middle, and right expressed gene clusters are shown in the upper panels.
In addition to this cluster, we also noted the expression of the IRF cluster containing viral IRF1, -2, -3, and -4, at levels similar to those of the LANA-containing rightward cluster (Fig. 7). Therefore, in addition to the expression of cytokines, the virus is programmed to modulate innate immunity in mostly latently infected cell populations.
A murine type C-like retrovirus in the DEL cell line.
Over the past several years, we and others have unexpectedly discovered the presence of murine leukemia viruses or related viruses in a number of routinely used human cell lines (15, 43–49). In many cases, this has been thought to occur during propagation of human cell lines in mouse xenografts (48). As seen in Fig. 1B and 8A, two anaplastic large cell lymphoma cell lines, DEL and Ki-JK, were found to have more than 2,000 reads that aligned to the murine type C retrovirus, with the DEL cell line having nearly 600,000 virus matching reads. To our knowledge, the presence of a murine retrovirus has not previously been reported for these cell lines and at least for DEL cells, this needs to be considered for future experiments utilizing this cell line (see Discussion).
FIG 8.

Evidence of sample cross-contamination. Coverage and single nucleotide variation spectrum exhibits different patterns that cluster according to their file names. (A) The left panel shows the numerical ordering of file names of cell line data with total number of reads mapping to the murine type C retrovirus. Alignments are shown in the right panel, with the vertical axis representing the number of reads aligned to each nucleotide position. (B) The left panel shows the numerical ordering of file names of cell line data with total number of reads mapping to the Moloney MuLV. Alignments are shown in the right panel, with the vertical axis representing the number of reads aligned to each nucleotide position.
When the murine type C retroviral reads were displayed in the order of file names, we found that the DEL and the Ki-JK cell lines are positioned in two separate sample clusters with cell lines that all contain lower but detectable numbers of reads matching the murine type C retrovirus (Fig. 8A). We also noted that the alignment profile of all murine type C retrovirus reads within the DEL cluster are similar and that single nucleotide differences with the aligned genome are nearly identical across all samples. We have previously addressed the impact of sample cross-contamination during the sequencing process (58). Because the file names are sequential, we suggest that they were likely processed in a batch and that samples may have been contaminated with DEL sequences at some point in the sequencing pipeline. The samples in the cluster at the bottom of Fig. 8A have homology to murine type C retrovirus but have a better match to the Moloney murine leukemia virus (Fig. 8B). Here it can be seen that there are similar mismatch profiles with the Moloney MuLV genome, suggesting a possible common contaminating source. In this case, however, it is possible that the contamination occurred from a separate cell line that is not in our study set because all read numbers are relatively low.
Resolution of the murine retrovirus genome in DEL cells.
To resolve the genomic structure of the murine retrovirus in DEL cells, we first performed de novo assembly of all DEL reads that matched to viruses in the viral genome index. De novo assembly was performed using the Trinity assembler and resulted in a long genomic sequence. BLASTing this assembled sequence against the NCBI NT database showed close homology to the EKVX genome (NCBI accession number JF908817) and the DG75 virus genome (NCBI accession number AF221065). Approximately 1,510 bases of flanking LTR sequences missing from our de novo assembled contig were taken from the EKVX and DG75 virus genomes and appended to the ends of the DEL genome. DEL reads were then aligned to this chimeric genome and three mismatches were corrected to give the final DEL murine retrovirus genome (Fig. 9). This analysis showed that the DEL retrovirus has similarity to the murine retrovirus originally identified in human prostate samples, XMRV (xenotropic murine retrovirus) (48), but has closest homology to the murine retroviruses found in EKVX and DG75 cells (Fig. 9).
FIG 9.

Resolution of the murine retrovirus genome in DEL cells. DEL RNA-seq data were aligned to several closely related retrovirus genomes and the de novo-assembled DEL retrovirus genome. The vertical axis represents the number of reads aligned to each nucleotide position. Phylogenic tree (generated by Lasergene 10 MegAlign) shows the distance of sequence divergence between the DEL retrovirus and other analyzed retroviruses.
Integration of the DEL murine retrovirus into the human TNFRSF6B gene.
Using our integration analysis pipeline, we identified 4 candidate sites of integration for the DEL retrovirus, three of which were within the introns of human coding genes (TNFRSF6B, OPA1, and ZNF767) (see Table S4 in the supplemental material). The integration at TNFRSF6B, which encodes a factor that suppresses FasL and LIGHT mediated cell death, showed the greatest chimeric read depth with 1,607 junction spanning reads (Fig. 10 and see Table S4 in the supplemental material). Notably, greater TNFRSF6B expression was observed at the first two exons than the third exon which is downstream from the integration site (Fig. 10) raising the possibility that the integration disrupts TNFRSF6B expression.
FIG 10.
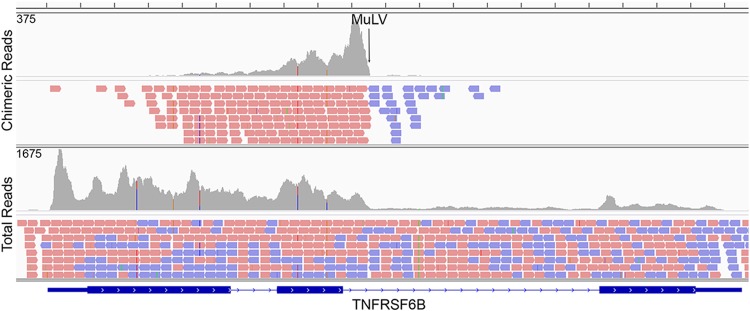
MuLV integration analysis in DEL cells. The top panel shows the coverage for chimeric read pairs aligning to the TNFRSF6B gene (their mates are mapped to the MuLV genome). The vertical axis represents the number of reads aligned to each nucleotide position. Mapped reads are shown below coverage frames, with pink representing rightward-oriented reads and blue representing leftward-oriented reads. The MuLV integration site is located in the second intron of the TNFRSF6B gene. The bottom panel shows the coverage of total reads aligned to the TNFRSF6B gene in the DEL cell line.
Resolution of HTLV-1 genomes in MJ and HuT 102 cells.
Alignment of reads from MJ and HuT 102 cells to the HTLV-1 (NCBI accession number NC_001436.1) genome showed close homology but with numerous mismatches (Fig. 11). We resolved the viral genomes harbored in these cells using the de novo assembly approach outlined above for the DEL MuLV genome. Aligning MJ and HuT 102 reads to the resolved genomes showed near exact matching although a small number of partially penetrant differences were observed. The presence of these partially penetrant differences suggests genome heterogeneity due to mutations or modifications in these cell lines. It may also represent the nucleotide variation caused by RNA editing. Nevertheless, the consensus genomes show close relationships with a number of members of the HTLV-1 family (Fig. 11, bottom panel).
FIG 11.

Resolution of HTLV-1 genomes in MJ and HuT 102 cells. The top panel shows the alignment of MJ RNA-seq reads to the HTLV-1 reference genome and the de novo-assembled HTLV-1 genome. The middle panel shows the alignment of HuT 102 RNA-seq reads to the HTLV-1 reference genome and the de novo-assembled HTLV-1 genome. A phylogenetic tree in the bottom panel shows the distance of sequence divergence between different HTLV-1 strains.
Multiple HTLV-1 integrations in HuT 102 and MJ cells.
Previous studies have shown that primary HTLV-1 induced T-cell tumors generally have a single integrated provirus but that during propagation in tissue culture, the number of integrations can increase significantly (50, 51). Whether these extra integrations influence cell line evolution and/or cell growth in culture is unclear.
We globally assessed HTLV-1 integrations in HuT 102 and MJ cells through the identification of chimeric transcripts. This analysis revealed 14 transcriptionally active integrations in HuT 102 cells and 66 transcriptionally active integrations in MJ cells (see Tables S5 and S6 in the supplemental material). Most of these were found in known gene loci, but a few were localized to unannotated regions of the genome. Visualization of all integrations shows an expected strong bias for introns over exons, likely due to the general substantially greater length of introns, which makes them much larger targets.
Although integration into coding exons clearly predicts functional disruption, intronic insertions are also likely in most cases to have an impact on the respective gene function/expression. Some of these intron insertions are likely to alter the corresponding gene expression through disruption, whereas others are likely to enhance expression of the cognate gene (see Tables S5 and S6 in the supplemental material). Interestingly, in each cell line, there are a number of insertions that occur within introns but which are nonetheless upstream from the exons containing the translation initiation codon (see Tables S5 and S6 in the supplemental material and Fig. 12). In these cases, we observed little coverage of the upstream noncoding exon(s) but detected expression of exons downstream from the integration site with evidence of splicing from the HTLV-1 genome to the expressed downstream exons (for examples, see Fig. 12). These examples are suggestive of a mechanism for integration mediated expression of otherwise silent cellular genes.
FIG 12.

HTLV-1 integration analysis in HuT 102 and MJ cells. In HuT 102 and MJ cells, 14 and 66 integrations were detected, respectively, with 3 and 8, respectively, occurring upstream from exons containing AUG initiation codons. The coverage of chimeric reads and total reads are shown on upper and lower tracks for the integration into the IL-15 (HuT 102 cells) and the STAT5B (MJ cells) genes. The vertical axis represents the number of reads aligned to each nucleotide position. Mapped reads are shown below coverage frames, with pink representing rightward-oriented reads and blue representing leftward-oriented reads.
DISCUSSION
Virus findings in lymphoma cell lines.
For nearly all of the cell lines tested here, our virome survey revealed no previously unknown infections. It is comforting to know that there are likely no other viral infectious agents in these “workhorse” cell lines that may potentially confound data interpretation. In contrast, the previously unknown finding of MuLV in DEL cells may potentially cause unforeseen alterations in cell signaling pathways that can cause data misinterpretation. For example, investigations into pathways related to TNFRSF6B might be affected by the integration of MuLV into this locus. More generally, the robust expression of retroviral transcripts in these cells may alter a number of signaling pathways and possibly influence overall metabolism. Outside of these concerns, the apparent ease with which murine leukemia viruses can infect human immune cells raises a potential hazard to unknowing investigators working with these cell lines.
Low-level virus read findings.
Theoretically, the presence of any viral reads in a sequencing data set should indicate the presence of the respective virus in the biological specimen. In practice, however, the high sensitivity of next-generation sequencing in which hundreds of millions of reads can be obtained from a single run sets the stage for the detection of low-level contaminants. We have recently reported on the pervasiveness of bacterial read contamination in RNA-seq data that likely arises from the sequencing pipeline itself rather than from the source material (58). Some contamination likely occurs through the presence of bacterial DNA in water and library preparation reagents, such as enzymes, nucleotides, and other reagents that are derived from bacterial sources. Nevertheless, we also provided evidence for contamination across samples (58). Although it is unlikely for eukaryotic virus RNA or DNA to be present in library preparation reagents, it is certainly possible for virus cross-contamination in samples that are processed in parallel and/or in succession. Although not proof, the finding of clusters of samples with the same genome subtype intimates this possible source of viral reads in some of these cases. Care must therefore be taken to avoid reading too much into the finding of low levels of viral reads in biological samples using next-generation sequencing.
Nonconformists in gammaherpesvirus latent/lytic gene categorization.
In the EBV and KSHV fields, evidence has been accumulating over the past several years that blurs the lines between latent and lytic gene classification. In 2006, Keiff's lab (52) and Lu et al. (53) reported that EBV latent genes are induced during EBV reactivation. Conversely, a number of groups have reported that a number of KSHV genes that were considered to be lytic genes are, in fact, also regulated/expressed independently of reactivation (37–42). This indicates a role for cellular tissue specific transcription factors in controlling the expression of these genes in some milieu. Notably, many of these KSHV genes encode immune regulatory factors such as interleukins (e.g., vIL-6 and vIL-8) and interferon response factors (e.g., vIRF3). As shown in Fig. 3A and 4A, we observed expression of transcripts at the EBV vIL-10 region that is similarly disassociated from other lytic genes, being unique to the Hodgkin's lymphoma cell line. This is in line with another study in which IL-10 expression was noted in Hodgkin's lymphoma biopsy specimens (54). Like the observed tissue-specific expression of viral immune regulatory genes in KSHV, EBV similarly encodes at least one lytic immune modulatory factor that is also regulated in a tissue specific manner.
EBV BamHI W intronic RNAs.
Although read coverage at intronic regions is commonly found in ribodepletion-based RNA-seq experiments, the level is typically low in poly(A)-selected data (data not shown). Because transcripts mapping to the BamHI W intronic sequences are apparently not filtered out by poly(A) selection, we have proposed that they may be associated with a 3′ poly(A) sequence. The lack of poly(A)-containing reads mapping to within the BamHI W repeats raises the possibility that these intronic sequences are associated with a poly(A) signal that is downstream from the repeats. Notably, the high level of intronic coverage at the BamHI W repeats is discordant with the low coverage at the longer downstream introns that are spliced out in EBNA1 and EBNA3A, -B, and -C transcripts, suggesting that the splicing of these downstream introns is much more efficient. Possibly, transcripts containing the BamHI W introns utilize the EBNA-LP, EBNA2, or BHRF1 poly(A) signals or some other novel poly(A) signals. This scenario is consistent with findings from early studies (55, 56) where high-molecular-weight bands in the 20kb range were observed in Northern blots using a BamH W fragment probe. Combined, these observations support the idea that stable 20- to 30-kb unspliced intron-containing transcripts spanning the entire BamHI W repeat region are expressed in type III latency. These transcripts may serve regulatory functions such as regulating chromatin structure and/or controlling promoter activity and usage.
Alteration of gene function by virus integration.
Although exonic viral integrations typically have strong ablative impacts on gene function, the integration into intron regions is much more prevalent due to the substantially larger sizes of introns relative to exons. Nevertheless, there are many ways that intronic integration can have an impact on gene function. As nicely illustrated for EBV in Raji cells, integration can cause disruption by sequestering the splice donor from the upstream cellular gene exon through viral splice acceptors. In this case, the tumor suppressor gene, BACH2, is disrupted, potentially promoting cell growth and/or tumorigenesis. Conversely, this exact splicing configuration may be a way to support constitutive expression of the EBV latency genes, which would similarly be predicted to promote cell growth and survival through the function of viral latency genes. This integration may therefore serve a dual purpose.
A second interesting mechanism for altering gene function through intron integration was observed for a number of cases of HTLV-1 integration. Specifically, integration was observed in genes in which the translation initiation codon is located in downstream exons with the virus having integrated into an intron that is upstream from these AUG containing exons. This configuration allows highly expressed viral transcripts to splice to cellular gene splice acceptors in a manner that retains the full coding capacity of that particular gene. In these cases, we typically noted little to no expression of exons upstream from the integration site and high expression of downstream exons. The high transcriptional activity of the virus therefore likely causes expression of genes that are normally silent. As mentioned above, several of these scenarios for HTLV-1 integrations occurred in cytokines or cytokine regulatory factors that are predicted to promote cell proliferation or survival. For example, IL-15 (likely induced by integration in HuT 102 cells Fig. 12) is a proinflammatory cytokine that promotes T-cell growth and survival in vivo (57). IL-6ST, also likely induced by HTLV-1 integration in HuT 102 cells (see Table S5 in the supplemental material), promotes cytokine signaling that may provide a survival advantage to these cells in culture. In MJ cells, integrations such as those in the cellular genes STAT5B, HIVEP1, and IL-9R, may similarly play a role in promoting cell growth. Although most of these integrations likely occurred during culture and were not germane to the genesis of the original tumor, they may have had an evolutionary benefit in culture.
It is perhaps not a coincidence that in the gammaherpesviruses EBV and KSHV, which do not typically integrate into the genome, we observed high expression of virus encoded immune modulatory factors in lymphomas. With all of these findings being observed in lymphomas, they may speak to the importance of hijacking immune regulatory pathways in supporting lymphoid cell growth and survival.
Supplementary Material
ACKNOWLEDGMENTS
This study was supported by National Institutes of Health grants R01CA138268, R01AI101046, and R01AI106676 to E.K.F., F30CA177267 to M.J.S., F31CA180449 to T.O., R01CA119917 to R.R., and P20GM103518 to Prescott Deininger.
The data analysis was carried out in the Tulane Cancer Center Next Generation Sequence Analysis Core using core computational resources and in the University of Florida High Performance Computing Center.
Footnotes
Supplemental material for this article may be found at http://dx.doi.org/10.1128/JVI.02570-14.
REFERENCES
- 1.McLaughlin-Drubin ME, Munger K. 2008. Viruses associated with human cancer. Biochim Biophys Acta 1782:127–150. doi: 10.1016/j.bbadis.2007.12.005. [DOI] [PMC free article] [PubMed] [Google Scholar]
- 2.Barretina J, Caponigro G, Stransky N, Venkatesan K, Margolin AA, Kim S, Wilson CJ, Lehar J, Kryukov GV, Sonkin D, Reddy A, Liu M, Murray L, Berger MF, Monahan JE, Morais P, Meltzer J, Korejwa A, Jane-Valbuena J, Mapa FA, Thibault J, Bric-Furlong E, Raman P, Shipway A, Engels IH, Cheng J, Yu GK, Yu J, Aspesi P Jr, de Silva M, Jagtap K, Jones MD, Wang L, Hatton C, Palescandolo E, Gupta S, Mahan S, Sougnez C, Onofrio RC, Liefeld T, MacConaill L, Winckler W, Reich M, Li N, Mesirov JP, Gabriel SB, Getz G, Ardlie K, Chan V, Myer VE, Weber BL, Porter J, Warmuth M, Finan P, Harris JL, Meyerson M, Golub TR, Morrissey MP, Sellers WR, Schlegel R, Garraway LA. 2012. The Cancer Cell Line Encyclopedia enables predictive modeling of anticancer drug sensitivity. Nature 483:603–607. doi: 10.1038/nature11003. [DOI] [PMC free article] [PubMed] [Google Scholar]
- 3.Dobin A, Davis CA, Schlesinger F, Drenkow J, Zaleski C, Jha S, Batut P, Chaisson M, Gingeras TR. 2013. STAR: ultrafast universal RNA-seq aligner. Bioinformatics 29:15–21. doi: 10.1093/bioinformatics/bts635. [DOI] [PMC free article] [PubMed] [Google Scholar]
- 4.Trapnell C, Pachter L, Salzberg SL. 2009. TopHat: discovering splice junctions with RNA-Seq. Bioinformatics 25:1105–1111. doi: 10.1093/bioinformatics/btp120. [DOI] [PMC free article] [PubMed] [Google Scholar]
- 5.Robinson JT, Thorvaldsdottir H, Winckler W, Guttman M, Lander ES, Getz G, Mesirov JP. 2011. Integrative genomics viewer. Nature biotechnology 29:24–26. doi: 10.1038/nbt.1754. [DOI] [PMC free article] [PubMed] [Google Scholar]
- 6.Thorvaldsdottir H, Robinson JT, Mesirov JP. 2013. Integrative Genomics Viewer (IGV): high-performance genomics data visualization and exploration. Brief Bioinform 14:178–192. doi: 10.1093/bib/bbs017. [DOI] [PMC free article] [PubMed] [Google Scholar]
- 7.Xu G, Deng N, Zhao Z, Judeh T, Flemington E, Zhu D. 2011. SAMMate: a GUI tool for processing short read alignments in SAM/BAM format. Source Code Biol Med 6:2. doi: 10.1186/1751-0473-6-2. [DOI] [PMC free article] [PubMed] [Google Scholar]
- 8.Howe EA, Sinha R, Schlauch D, Quackenbush J. 2011. RNA-Seq analysis in MeV. Bioinformatics 27:3209–3210. doi: 10.1093/bioinformatics/btr490. [DOI] [PMC free article] [PubMed] [Google Scholar]
- 9.Li B, Dewey CN. 2011. RSEM: accurate transcript quantification from RNA-seq data with or without a reference genome. BMC Bioinformatics 12:323. doi: 10.1186/1471-2105-12-323. [DOI] [PMC free article] [PubMed] [Google Scholar]
- 10.Feng L, Lintula S, Ho TH, Anastasina M, Paju A, Haglund C, Stenman UH, Hotakainen K, Orpana A, Kainov D, Stenman J. 2012. Technique for strand-specific gene-expression analysis and monitoring of primer-independent cDNA synthesis in reverse transcription. Biotechniques 52:263–270. doi: 10.2144/0000113842. [DOI] [PubMed] [Google Scholar]
- 11.Grabherr MG, Haas BJ, Yassour M, Levin JZ, Thompson DA, Amit I, Adiconis X, Fan L, Raychowdhury R, Zeng Q, Chen Z, Mauceli E, Hacohen N, Gnirke A, Rhind N, di Palma F, Birren BW, Nusbaum C, Lindblad-Toh K, Friedman N, Regev A. 2011. Full-length transcriptome assembly from RNA-Seq data without a reference genome. Nat Biotechnol 29:644–652. doi: 10.1038/nbt.1883. [DOI] [PMC free article] [PubMed] [Google Scholar]
- 12.Takakuwa T, Luo WJ, Ham MF, Sakane-Ishikawa F, Wada N, Aozasa K. 2004. Integration of Epstein-Barr virus into chromosome 6q15 of Burkitt lymphoma cell line (Raji) induces loss of BACH2 expression. Am J Pathol 164:967–974. doi: 10.1016/S0002-9440(10)63184-7. [DOI] [PMC free article] [PubMed] [Google Scholar]
- 13.Strong MJ, O'Grady T, Lin Z, Xu G, Baddoo M, Parsons C, Zhang K, Taylor CM, Flemington EK. 2013. Epstein-Barr virus and human herpesvirus 6 detection in a non-Hodgkin's diffuse large B-cell lymphoma cohort by using RNA sequencing. J Virol 87:13059–13062. doi: 10.1128/JVI.02380-13. [DOI] [PMC free article] [PubMed] [Google Scholar]
- 14.Strong MJ, Xu G, Coco J, Baribault C, Vinay DS, Lacey MR, Strong AL, Lehman TA, Seddon MB, Lin Z, Concha M, Baddoo M, Ferris M, Swan KF, Sullivan DE, Burow ME, Taylor CM, Flemington EK. 2013. Differences in gastric carcinoma microenvironment stratify according to EBV infection intensity: implications for possible immune adjuvant therapy. PLoS Pathog 9:e1003341. doi: 10.1371/journal.ppat.1003341. [DOI] [PMC free article] [PubMed] [Google Scholar]
- 15.Lin Z, Puetter A, Coco J, Xu G, Strong MJ, Wang X, Fewell C, Baddoo M, Taylor C, Flemington EK. 2012. Detection of murine leukemia virus in the Epstein-Barr virus-positive human B-cell line JY, using a computational RNA-Seq-based exogenous agent detection pipeline, PARSES. J Virol 86:2970–2977. doi: 10.1128/JVI.06717-11. [DOI] [PMC free article] [PubMed] [Google Scholar]
- 16.Kluin-Nelemans HC, Limpens J, Meerabux J, Beverstock GC, Jansen JH, de Jong D, Kluin PM. 1991. A new non-Hodgkin's B-cell line (DoHH2) with a chromosomal translocation t(14;18)(q32;q21). Leukemia 5:221–224. [PubMed] [Google Scholar]
- 17.Uphoff CC, Denkmann SA, Steube KG, Drexler HG. 2010. Detection of EBV, HBV, HCV, HIV-1, HTLV-I and -II, and SMRV in human and other primate cell lines. J Biomed Biotechnol 2010:904767. doi: 10.1155/2010/904767. [DOI] [PMC free article] [PubMed] [Google Scholar]
- 18.Lin Z, Wang X, Strong MJ, Concha M, Baddoo M, Xu G, Baribault C, Fewell C, Hulme W, Hedges D, Taylor CM, Flemington EK. 2013. Whole-genome sequencing of the Akata and Mutu Epstein-Barr virus strains. J Virol 87:1172–1182. doi: 10.1128/JVI.02517-12. [DOI] [PMC free article] [PubMed] [Google Scholar]
- 19.O'Grady T, Cao S, Strong MJ, Concha M, Wang X, Splinter Bondurant S, Adams M, Baddoo M, Srivastav SK, Lin Z, Fewell C, Yin Q, Flemington EK. 2014. Global bidirectional transcription of the Epstein-Barr virus genome during reactivation. J Virol 88:1604–1616. doi: 10.1128/JVI.02989-13. [DOI] [PMC free article] [PubMed] [Google Scholar]
- 20.Jeang KT, Hayward SD. 1983. Organization of the Epstein-Barr virus DNA molecule. III. Location of the P3HR-1 deletion junction and characterization of the NotI repeat units that form part of the template for an abundant 12-O-tetradecanoylphorbol-13-acetate-induced mRNA transcript. J Virol 48:135–148. [DOI] [PMC free article] [PubMed] [Google Scholar]
- 21.Jones MD, Foster L, Sheedy T, Griffin BE. 1984. The EB virus genome in Daudi Burkitt's lymphoma cells has a deletion similar to that observed in a non-transforming strain (P3HR-1) of the virus. EMBO J 3:813–821. [DOI] [PMC free article] [PubMed] [Google Scholar]
- 22.Parker BD, Bankier A, Satchwell S, Barrell B, Farrell PJ. 1990. Sequence and transcription of Raji Epstein-Barr virus DNA spanning the B95-8 deletion region. Virology 179:339–346. doi: 10.1016/0042-6822(90)90302-8. [DOI] [PubMed] [Google Scholar]
- 23.Moss WN, Steitz JA. 2013. Genome-wide analyses of Epstein-Barr virus reveal conserved RNA structures and a novel stable intronic sequence RNA. BMC Genomics 14:543. doi: 10.1186/1471-2164-14-543. [DOI] [PMC free article] [PubMed] [Google Scholar]
- 24.Moss WN, Lee N, Pimienta G, Steitz JA. 2014. RNA families in Epstein-Barr virus. RNA biology 11:10–17. doi: 10.4161/rna.27488. [DOI] [PMC free article] [PubMed] [Google Scholar]
- 25.Xue SA, Griffin BE. 2007. Complexities associated with expression of Epstein-Barr virus (EBV) lytic origins of DNA replication. Nucleic Acids Res 35:3391–3406. doi: 10.1093/nar/gkm170. [DOI] [PMC free article] [PubMed] [Google Scholar]
- 26.Austin PJ, Flemington E, Yandava CN, Strominger JL, Speck SH. 1988. Complex transcription of the Epstein-Barr virus BamHI fragment H rightward open reading frame 1 (BHRF1) in latently and lytically infected B lymphocytes. Proc Natl Acad Sci U S A 85:3678–3682. doi: 10.1073/pnas.85.11.3678. [DOI] [PMC free article] [PubMed] [Google Scholar]
- 27.Edwards RH, Marquitz AR, Raab-Traub N. 2008. Epstein-Barr virus BART microRNAs are produced from a large intron prior to splicing. J Virol 82:9094–9106. doi: 10.1128/JVI.00785-08. [DOI] [PMC free article] [PubMed] [Google Scholar]
- 28.Sadler RH, Raab-Traub N. 1995. Structural analyses of the Epstein-Barr virus BamHI A transcripts. J Virol 69:1132–1141. [DOI] [PMC free article] [PubMed] [Google Scholar]
- 29.Smith PR, de Jesus O, Turner D, Hollyoake M, Karstegl CE, Griffin BE, Karran L, Wang Y, Hayward SD, Farrell PJ. 2000. Structure and coding content of CST (BART) family RNAs of Epstein-Barr virus. J Virol 74:3082–3092. doi: 10.1128/JVI.74.7.3082-3092.2000. [DOI] [PMC free article] [PubMed] [Google Scholar]
- 30.Anvret M, Karlsson A, Bjursell G. 1984. Evidence for integrated EBV genomes in Raji cellular DNA. Nucleic Acids Res 12:1149–1161. doi: 10.1093/nar/12.2.1149. [DOI] [PMC free article] [PubMed] [Google Scholar]
- 31.Matsuo T, Heller M, Petti L, O'Shiro E, Kieff E. 1984. Persistence of the entire Epstein-Barr virus genome integrated into human lymphocyte DNA. Science 226:1322–1325. doi: 10.1126/science.6095452. [DOI] [PubMed] [Google Scholar]
- 32.Gulley ML, Raphael M, Lutz CT, Ross DW, Raab-Traub N. 1992. Epstein-Barr virus integration in human lymphomas and lymphoid cell lines. Cancer 70:185–191. doi:. [DOI] [PubMed] [Google Scholar]
- 33.Delecluse HJ, Bartnizke S, Hammerschmidt W, Bullerdiek J, Bornkamm GW. 1993. Episomal and integrated copies of Epstein-Barr virus coexist in Burkitt lymphoma cell lines. J Virol 67:1292–1299. [DOI] [PMC free article] [PubMed] [Google Scholar]
- 34.Popescu NC, Chen MC, Simpson S, Solinas S, DiPaolo JA. 1993. A Burkitt lymphoma cell line with integrated Epstein-Barr virus at a stable chromosome modification site. Virology 195:248–251. doi: 10.1006/viro.1993.1367. [DOI] [PubMed] [Google Scholar]
- 35.Kripalani-Joshi S, Law HY. 1994. Identification of integrated Epstein-Barr virus in nasopharyngeal carcinoma using pulse field gel electrophoresis. Int J Cancer 56:187–192. doi: 10.1002/ijc.2910560207. [DOI] [PubMed] [Google Scholar]
- 36.Luo WJ, Takakuwa T, Ham MF, Wada N, Liu A, Fujita S, Sakane-Ishikawa E, Aozasa K. 2004. Epstein-Barr virus is integrated between REL and BCL-11A in American Burkitt lymphoma cell line (NAB-2). Laboratory Invest 84:1193–1199. doi: 10.1038/labinvest.3700152. [DOI] [PubMed] [Google Scholar]
- 37.Fakhari FD, Dittmer DP. 2002. Charting latency transcripts in Kaposi's sarcoma-associated herpesvirus by whole-genome real-time quantitative PCR. J Virol 76:6213–6223. doi: 10.1128/JVI.76.12.6213-6223.2002. [DOI] [PMC free article] [PubMed] [Google Scholar]
- 38.Chandriani S, Ganem D. 2010. Array-based transcript profiling and limiting-dilution reverse transcription-PCR analysis identify additional latent genes in Kaposi's sarcoma-associated herpesvirus. J Virol 84:5565–5573. doi: 10.1128/JVI.02723-09. [DOI] [PMC free article] [PubMed] [Google Scholar]
- 39.Dresang LR, Teuton JR, Feng H, Jacobs JM, Camp DG 2nd, Purvine SO, Gritsenko MA, Li Z, Smith RD, Sugden B, Moore PS, Chang Y. 2011. Coupled transcriptome and proteome analysis of human lymphotropic tumor viruses: insights on the detection and discovery of viral genes. BMC Genomics 12:625. doi: 10.1186/1471-2164-12-625. [DOI] [PMC free article] [PubMed] [Google Scholar]
- 40.Toth Z, Brulois KF, Wong LY, Lee HR, Chung B, Jung JU. 2012. Negative elongation factor-mediated suppression of RNA polymerase II elongation of Kaposi's sarcoma-associated herpesvirus lytic gene expression. J Virol 86:9696–9707. doi: 10.1128/JVI.01012-12. [DOI] [PMC free article] [PubMed] [Google Scholar]
- 41.Darst RP, Haecker I, Pardo CE, Renne R, Kladde MP. 2013. Epigenetic diversity of Kaposi's sarcoma-associated herpesvirus. Nucleic Acids Res 41:2993–3009. doi: 10.1093/nar/gkt033. [DOI] [PMC free article] [PubMed] [Google Scholar]
- 42.Rossetto CC, Tarrant-Elorza M, Verma S, Purushothaman P, Pari GS. 2013. Regulation of viral and cellular gene expression by Kaposi's sarcoma-associated herpesvirus polyadenylated nuclear RNA. J Virol 87:5540–5553. doi: 10.1128/JVI.03111-12. [DOI] [PMC free article] [PubMed] [Google Scholar]
- 43.Kotler M, Balabanova H, Ben-Moyal Z, Friedman A, Becker Y. 1977. Properties of the oncornavirus particles isolated from P3HR-1 and Raji human lymphoblastoid cell lines. Israel J Med Sci 13:740–746. [PubMed] [Google Scholar]
- 44.Yaniv A, Gotlieb-Stematsky T, Vonsover A, Perk K. 1980. Evidence for type-C retrovirus production by Burkitt's lymphoma-derived cell line. Int J Cancer 25:205–211. doi: 10.1002/ijc.2910250207. [DOI] [PubMed] [Google Scholar]
- 45.Lasky RD, Troy FA. 1984. Possible DNA-RNA tumor virus interaction in human lymphomas: expression of retroviral proteins in Ramos lymphoma lines is enhanced after conversion with Epstein-Barr virus. Proc Natl Acad Sci U S A 81:33–37. doi: 10.1073/pnas.81.1.33. [DOI] [PMC free article] [PubMed] [Google Scholar]
- 46.Sun R, Grogan E, Shedd D, Bykovsky AF, Kushnaryov VM, Grossberg SE, Miller G. 1995. Transmissible retrovirus in Epstein-Barr virus-producer B95-8 cells. Virology 209:374–383. doi: 10.1006/viro.1995.1269. [DOI] [PubMed] [Google Scholar]
- 47.Raisch KP, Pizzato M, Sun HY, Takeuchi Y, Cashdollar LW, Grossberg SE. 2003. Molecular cloning, complete sequence, and biological characterization of a xenotropic murine leukemia virus constitutively released from the human B-lymphoblastoid cell line DG-75. Virology 308:83–91. doi: 10.1016/S0042-6822(02)00074-0. [DOI] [PubMed] [Google Scholar]
- 48.Paprotka T, Delviks-Frankenberry KA, Cingoz O, Martinez A, Kung HJ, Tepper CG, Hu WS, Fivash MJ Jr, Coffin JM, Pathak VK. 2011. Recombinant origin of the retrovirus XMRV. Science 333:97–101. doi: 10.1126/science.1205292. [DOI] [PMC free article] [PubMed] [Google Scholar]
- 49.Strong MJ, Baddoo M, Nanbo A, Xu M, Puetter A, Lin Z. 2014. Comprehensive high-throughput RNA sequencing analysis reveals contamination of multiple nasopharyngeal carcinoma cell lines with HeLa cell genomes. J Virol 88:10696–10704. doi: 10.1128/JVI.01457-14. [DOI] [PMC free article] [PubMed] [Google Scholar]
- 50.Cook LB, Rowan AG, Melamed A, Taylor GP, Bangham CR. 2012. HTLV-1-infected T cells contain a single integrated provirus in natural infection. Blood 120:3488–3490. doi: 10.1182/blood-2012-07-445593. [DOI] [PMC free article] [PubMed] [Google Scholar]
- 51.Seigel LJ, Nash WG, Poiesz BJ, Moore JL, O'Brien SJ. 1986. Dynamic and nonspecific dispersal of human T-cell leukemia/lymphoma virus type-I integration in cultured lymphoma cells. Virology 154:67–75. doi: 10.1016/0042-6822(86)90430-7. [DOI] [PubMed] [Google Scholar]
- 52.Yuan J, Cahir-McFarland E, Zhao B, Kieff E. 2006. Virus and cell RNAs expressed during Epstein-Barr virus replication. J Virol 80:2548–2565. doi: 10.1128/JVI.80.5.2548-2565.2006. [DOI] [PMC free article] [PubMed] [Google Scholar]
- 53.Lu CC, Jeng YY, Tsai CH, Liu MY, Yeh SW, Hsu TY, Chen MR. 2006. Genome-wide transcription program and expression of the Rta responsive gene of Epstein-Barr virus. Virology 345:358–372. doi: 10.1016/j.virol.2005.09.064. [DOI] [PubMed] [Google Scholar]
- 54.Ohshima K, Suzumiya J, Akamatu M, Takeshita M, Kikuchi M. 1995. Human and viral interleukin-10 in Hodgkin's disease, and its influence on CD4+ and CD8+ T lymphocytes. Int J Cancer 62:5–10. doi: 10.1002/ijc.2910620103. [DOI] [PubMed] [Google Scholar]
- 55.Rogers RP, Speck SH. 1990. Bidirectional transcription of the Epstein-Barr virus major internal repeat. J Virol 64:2426–2429. [DOI] [PMC free article] [PubMed] [Google Scholar]
- 56.van Santen V, Cheung A, Hummel M, Kieff E. 1983. RNA encoded by the IR1-U2 region of Epstein-Barr virus DNA in latently infected, growth-transformed cells. J Virol 46:424–433. [DOI] [PMC free article] [PubMed] [Google Scholar]
- 57.Bamford RN, Battiata AP, Burton JD, Sharma H, Waldmann TA. 1996. Interleukin-15 (IL-15)/IL-T production by the adult T-cell leukemia cell line HuT-102 is associated with a human T-cell lymphotrophic virus type I region /IL-15 fusion message that lacks many upstream AUGs that normally attenuates IL-15 mRNA translation. Proc Natl Acad Sci U S A 93:2897–2902. doi: 10.1073/pnas.93.7.2897. [DOI] [PMC free article] [PubMed] [Google Scholar]
- 58.Strong MJ, Xu G, Morici L, Spliter Bon-Durant S, Baddoo M, Lin Z, Fewell C, Taylor CM, Flemington EK. Microbial contamination in next generation sequencing: implications for sequence-based analysis of clinical samples. PLoS Pathog, in press. [DOI] [PMC free article] [PubMed] [Google Scholar]
Associated Data
This section collects any data citations, data availability statements, or supplementary materials included in this article.