

Abstract
Proteins comprising the core of the eukaryotic cellular machinery are often highly conserved, presumably due to selective constraints maintaining important structural features. We have developed statistical procedures to decompose these constraints into distinct categories and to pinpoint critical structural features within each category. When applied to P-loop GTPases, this revealed within Rab, Rho, Ras, and Ran a canonical network of molecular interactions centered on bound nucleotide. This network presumably performs a crucial structural and/or mechanistic role considering that it has persisted for more than a billion years after the divergence of these families. We call these ‘FY-pivot’ GTPases after their most distinguishing feature, a phenylalanine or tyrosine that functions as a pivot within this network. Specific families deviate somewhat from canonical features in interesting ways, presumably reflecting their functional specialization during evolution. We illustrate this here for Ran GTPases, within which two highly conserved histidines, His30 and His139, strikingly diverge from their canonical counterparts. These, along with other residues specifically conserved in Ran, such as Tyr98, Lys99, and Phe138, appear to work in conjunction with FY-pivot canonical residues to facilitate alternative conformations in which these histidines are strategically positioned to couple Ran's basic patch and C-terminal switch to nucleotide exchange and effector binding. Other core components of the cellular machinery are likewise amenable to this approach, which we term Contrast Hierarchical Alignment and Interaction Network (CHAIN) analysis.
[Supplemental material is available online at www.genome.org.]
Certain proteins constitute the core of the cellular machinery inasmuch as they mediate essential processes, such as DNA replication and repair, transcription, translation, transport, and basic metabolism. In eukaryotes, such ‘core proteins’ also include the motor proteins kinesin and myosin, structural proteins, such as histones, actin, and tubulin, and regulatory and signaling factors, such as certain protein kinases and Ras-like GTPases. Because of their critical cellular roles, these proteins are conserved across major eukaryotic taxa and, in some cases, across all divisions of life.
Our knowledge of the structure, function, and mechanism of some core proteins seems quite extensive. Consider, for example, signaling P-loop GTPases related to Ran, a component of the nuclear transport machinery examined here in detail. There are currently dozens of structures of these GTPases (Vetter and Wittinghofer 2001), either alone or in complex with various regulators and effectors, and thousands of related sequences available. Moreover, published experimental studies on these proteins number in the tens of thousands. Our knowledge of certain other eukaryotic core proteins is similarly extensive.
Nevertheless, there is reason to believe that we may have barely scratched the surface in understanding these proteins. In particular, strong functional constraints must be preserving the high degree of sequence conservation seen across major taxonomic categories for many core protein families and subfamilies. This is seen, for instance, in the Ran alignment of Figure 1A. Although some of these conserved residues are involved in substrate binding and catalysis, many others have no known function—yet their persistence over 1–2 billion years of evolution implies that they are functionally quite important. Indeed, when even minor side-chain modifications, such as attachment or removal of an −OH or −CH3 group, are consistently eliminated by natural selection, such residues are likely to establish critical interactions similar to those established by key catalytic residues. If so, then the patterns of conservation present in these and related proteins may contain implicit information regarding important but unknown structural mechanisms.
Figure 1.


Ran family alignments generated by CHAIN analysis procedures. (A) Conventional multiple alignment. The leftmostcolumn specifies each sequence's phylum; these are colored by major eukaryotic taxa as follows: metazoans, red; fungi, dark yellow; plants, green; protozoans, cyan. The top sequence is the query. The NCBI sequence identifiers are: 5453555, 17553976, 3113905, 6323324, 11067497, 1710007, 13812290, 4881271, 585782, 1172840, 15691764, 606985, 8593487, 14089387, 585780, and 14581093. (B–D) Contrast hierarchical alignment. CHAIN analysis applies three different sequence highlighting schemes to the Ran family alignment in A to reveal the selective constraints most characteristic of each of three hierarchical categories, which here correspond to P-loop GTPases in B; FY-pivot GTPases in C; and the Ran family in D. Organism descriptions (leftmost column) are colored by category as specified in Figure 2; sequences obtained from ESTs are indicated. Note that for the Basidiomycota protein, which was predicted from an EST, the replacement of histidine (H) at position 30 by aspartate (D) is likely due to a sequencing error. Chemically similar highlighted residues are colored similarly. Histograms above the alignments display the relative strength of the inferred selective constraint acting at each position within that category (quasi-logarithmic scaling is used; see Methods). This and other aspects of this representational scheme are explained in Figure 2. Dots below the histograms (and directly above the alignments) indicate those residues specifically assigned to each category. Gray dots in B and C indicate positions for which Ran deviates from the canonical residues for that category. Note that the conventional alignment in A helps identify residues associated with intermediate categories, which correspond to conserved positions in Ran that are inconsistently conserved within the three categories of this hierarchy. A few residue positions (such as T42Ran) are misclassified in this analysis due to alignment errors; these were detected and addressed in our analysis through structural studies and CHAIN analysis of related GTPases.
To access this information, we devised a statistically based approach called CHAIN (Contrast Hierarchical Alignment and Interaction Network) analysis, which decomposes the sequence constraints associated with conserved patterns in a multiple alignment into distinct categories, while pinpointing critical features within each category (as, e.g., in Fig.1B–D). These categories presumably correspond to a series of evolutionary adaptations leading to functional specialization and divergence of related sequences into superfamilies, superfamilies into families, and so forth (Fig. 2A). We applied this approach to various protein families within the large and diverse class of P-loop GTPases (Hall 2000; Leipe et al. 2002). This revealed that the Ras, Rab, Rho, and Ran families share sequence constraints (Fig. 3B) corresponding to a network of generally conserved structural interactions (displayed in Fig. 4 and described below). Furthermore, detailed analysis of Ran GTPases, within the context of these canonical features, leads to striking observations relevant to Ran's C-terminal, basic patch, and nucleotide exchange mechanisms.
Figure 2.

CHAIN analysis representational schemes. The examples shown in A–D correspond to the hierarchical alignment in Figure 1. (A) Venn diagram representing hierarchical relationships between aligned sequence sets. The dotted oval corresponds to a hypothetical intermediate category consisting of conserved residues in Ran that fall outside the categories of this particular hierarchy. (B) Notation used within hierarchical alignments. Position 139 of Ran is shown. The main and superfamily sets, which contain too many sequences to display directly, are represented in the alignment as position-specific conserved patterns. (The total number of sequences for these two categories is shown in parentheses.) The corresponding residue frequencies (‘res_freq’) are given in integer tenths below conserved residues. For example, a ‘5’ in integer tenths indicates that the corresponding residue directly above it occurs in 50%–60% of the (weighted) sequences. Insertion and deletion frequencies are similarly given in integer tenths (black; range 10%–100%) or hundredths (gray; range 1%–9%) as indicated. Ran family aligned residues are displayed directly. Histogram bar heights are approximately logarithmically proportional to the measure of selective constraint (see Methods), as defined by the following urn model. (C) Urn model for measuring the selective constraint acting on a specific position. The residues observed in the main set at this position are modeled as distinctly colored balls in an urn. Some of the colors are similar (representing biochemically similar amino acids). The selective constraint is then defined as the difficulty of drawing by chance at least as many of the same- or similarly-colored balls from the urn as are observed in the subalignments (in this case, alanine for the FY-pivot superfamily or histidine for the Ran family). Note that our analysis of the Ran family uses the main set as the ‘superalignment’ urn (see Methods); alternatively, the FY-pivot GTPases may also be used as the superalignment urn, though the sparser data set would yield less accurate background frequency estimates. Note that the alignments in Figures 1A and 1B measure sequence constraints using a standard background model (see Methods). (D) Color scheme used for residue side-chains in Figures 4–9. (E) Color scheme for structural regions described in the text and figures. The structure of Sec4p (pdb code: 1G17) is shown in complex with a GTP analog (cyan) and magnesium (dark green).
Figure 3.

Characteristic conserved residues within distinct FY-pivot GTPases of known structure. FY-pivot GTPases from distinct families or subfamilies were structurally aligned against Sec4p using the CE program (Shindyalov and Bourne 2001); alignment errors were corrected based on direct structural observations. This alignment was then used as the ‘family set’ alignment for CHAIN analysis (see Methods) to obtain this two-tier hierarchical alignment. The histograms and highlighted residues correspond to category-specific selective constraints, as described in Figure 2B,C. (A) Conserved residues characteristic of P-loop GTPases. The structural regions shown in Figure 2E and in Figures 4–9 are indicated at the top. (B) Conserved residues characteristic of FY-pivot GTPases. Key residues shown in Figure 4 and in Figures 5–9 for Sec4p and Ran, respectively, are indicated at the bottom.
Figure 4.

Sec4p as a structural prototype of FY-pivot GTPases. The structure of Sec4p is shown in complex with GDP (pdb code: 1G16). The corresponding hierarchical alignment is given in Figure 3. Hydrogen bonds are depicted as dotted lines, and aromatic-aromatic and van der Waals interactions as dot clouds. Dotted lines into clouds depict CH-π or NH-π interactions (Weiss et al. 2001). Color scheme: GDP (cyan); main-chain traces and residue designations (colored by regions as indicated in Fig. 2E); residue side-chains and canonical glycine main-chains (color scheme of Fig. 2D); oxygen, nitrogen, and hydrogen atoms establishing hydrogen bonds (red, blue, and white, respectively); hydrogen bonding carbons (colored as their corresponding side-chains). Figures were generated using RasMol (Sayle and Milner-White 1995). (A) Canonical interactions between the LV.D and NK.D regions. These include a perpendicular aromatic-aromatic interaction (F108-Y100), four CH-π interactions (F108-Y100, G132-Y100, V142-F108, and I102-R140), and main-chain hydrogen bonds to two side-chains (T107 and R140). Y100 is the FY-pivot residue. The inset highlights interactions between the LV.D and P-loop regions. (B) Canonical interactions within and between the NK.D and SA regions. These include packing of a phenylalanine or tyrosine (F158) against two small residues (G147 and A151) in the helix following the NK.D loop, a salt bridge (R140 and E160), and several main-chain hydrogen bonds. Residues within the LV.D region are shown for comparison with A. (C) Canonical interactions between the SA and Switch I regions. Note that, unlike Ran (Figs. 7D, 8), there are no major structural differences between the GDP and GTP-forms of Sec4p in these regions. Also shown is a previously noted (Hall 2000) canonical aromatic-aromatic interaction between a phenylalanine (F45) and bound guanine. Residues homologous to R39 (mainly arginine, glutamine, or serine), though inconsistently conserved at the sequence level, conserve hydrogen bonding interactions with the SA region.
RESULTS AND DISCUSSION
Identification of a Distinct Class of P-loop GTPases
Our analysis of P-loop GTPases involved the construction of contrast hierarchical alignments (described in Methods) for about 35 distinct families and subfamilies, many of which correspond to core components of the translational and eukaryotic signaling machinery (Leipe et al. 2002). Among the various categories of GTPases analyzed in this way, we focus here on one category primarily consisting of the Ras (Bar-Sagi and Hall 2000; Crespo and Leon 2000), Rho (Bar-Sagi and Hall 2000; Symons and Settleman 2000), Rab (Pfeffer 2001; Stenmark and Olkkonen 2001; Tuvim et al. 2001), and Ran (Clarke and Zhang 2001; Moore 2001) families, but also including a few less characterized GTPases, such as Pike (Ye et al. 2000). For these GTPases, we examined corresponding molecular interaction networks (see Methods) within currently available structures, of which there are around 70. This revealed that the canonical residues distinguishing these from other GTPases (Fig. 3B) correspond to a network of structural interactions within and between six regions surrounding the nucleotide-binding site (Fig. 2E). These regions include the classical P loop, Switch I, and Switch II regions and three others, which we term the ‘LV.D,’ ‘NK.D,’ and ‘SA’ regions after their characteristic motifs (Fig. 3A; Valencia et al. 1991; Wittinghofer 1999; Hall 2000; Vetter and Wittinghofer 2001). We call these proteins the ‘FY-pivot’ GTPases after their most distinguishing feature, a phenylalanine or tyrosine that resembles a pivot near the center of this network (see below).
CHAIN analysis of these GTPases is robust. Using various FY-pivot GTPases as the query, we consistently find this network—though the characteristic residues highlighted within distinct hierarchical alignments can vary somewhat, mainly due to occasional misaligned regions. Close examination of these alignments and of the corresponding structures, however, readily allowed us to detect and account for these discrepancies. The canonical FY-pivot features found in this way are best seen in the hierarchical alignment of Figure 3, which was created using yeast Sec4p as the query and a structural alignment of FY-pivot GTPases as the ‘query family’ (see Methods).
We chose Sec4p as the query for this alignment because it retains all or nearly all of the most characteristic FY-pivot canonical features (as defined by the alignment in Fig. 3B) whereas members of other families sometimes diverge from these features in various ways. Divergent residues are often invariant within the family in which they occur, suggesting that they perform a family-specific function (this phenomenon is explored further for Ran below). Assuming that the most recent common ancestor of these GTPases possessed all of the canonical features, it would thus have more closely resembled Sec4p than these other GTPases and may therefore have functioned in vesicle transport prior to its duplication and divergence into these various families. A high degree of divergence is found in Pike GTPases, which nevertheless retain many of the canonical FY-pivot features. Notably, our analysis clearly places the Ras-like GTPases Arf and Sar outside of this class.
FY-pivot GTPases function as binary molecular switches that amplify and relay signals controlling various cellular pathways (for review, see Hall 2000; Takai et al. 2001). They are associated with regulators that modulate their on/off status and with effectors that mediate their downstream effects when in the ‘on’ or GTP-bound state (Hall 2000). Regulators include guanine nucleotide exchange factors (GEFs), which turn the switch on by exchanging bound GDP with GTP, and GTPase-activating proteins (GAPs), which turn the switch off by stimulating GTP hydrolysis. Effectors for Ran include Ran binding proteins (RanBPs; Dingwall et al. 1995) and nuclear transport receptors belonging to the importin-β family (Strom and Weis 2001).
FY-Pivot Canonical Features
Figure 4 portrays the Rab-family GTPase Sec4p as a structural prototype of FY-pivot GTPases with an emphasis on canonical features relevant to our analysis of Ran below. It displays these features from three perspectives (Fig. 4A–C) that are also used for subsequent figures (Figs. 5–7, respectively) in order to facilitate comparison between families. For nearly all of these canonical residues, no functional roles have previously been proposed.
Figure 5.

Canonical interactions between the LV.D and NK.D regions within the Ras, Rho, and Ran families. The perspective is as shown in Figure 4A. Representations and coloring are as described in Figure 4. (A) Human Ras-GTP (pdb code: 1QRA). Note that a canonical tryptophan (W114Sec4) that typically forms CH-π and NH-π hydrogen bonds with P-loop main-chain atoms is displaced by a tyrosine (Y96Ras; or, within other Ras proteins, a phenylalanine), suggesting that this residue performs a Ras-specific function. (B) The Rho family human Rac1 GTPase in complex with a GTP analog (pdb code: 1MH1). (C) Canine Ran-GDP (pdb code: 1BYU).
Figure 7.

Canonical interactions between the SA and Switch I regions within the Ras, Rho, and Ran families. Perspective is as shown in Figure 4C. Representations and coloring are as described in Figure 4. (A) Human Ras-GTP (pdb code: 1QRA). Note that at position 23 the canonical Phe or Tyr is replaced by Leu, which is highly conserved in the Ras subfamily. (B) The Ras family Rap2a GTPase from human in complex with GTP (pdb code: 2RAP). In the Rap2 subfamily, the canonical residue occurs at position 23. (C) The Rho family Rac1 GTPase from human (pdb code: 1MH1). (D) Human Ran in complex with importin-β and a GTP analog (pdb code: 1IBR). Note that H30 of Ran is noncanonical and that the canonical hydrogen bond between the previous residue and the SA region involves a N154 side-chain atom rather than a main-chain atom. These deviant features appear to be important to Ran's C-terminal switching mechanism (see Fig. 8).
Figure 4A represents the canonical interactions between the LV.D region and the NK.D and P-loop regions. These interactions are well conserved within the Ras, Rho, and Ran families (Fig. 5). Near the center of these interactions is the most distinctive feature—the phenylalanine or tyrosine (Y100Sec4 in Fig. 4A) immediately preceding the aspartate (D101Sec4) of the ‘LV.D’ motif (Fig. 3A). We refer to this residue as the FY-pivot because, within distinct structures and conformational states, it consistently maintains two CH-π hydrogen bonds with neighboring canonical residues through rotation or pivoting of its aromatic ring. The formation of these CH-π bonds involves interaction of the π electron clouds on either side of the FY-pivot aromatic ring with two hydrogens: A Cδ hydrogen donated by a canonical phenylalanine or tyrosine residue (F108Sec4), which also forms a perpendicular aromatic-aromatic interaction with the FY-pivot, and a Cα hydrogen donated by a canonical glycine residue (G132Sec4).
This glycine's and the FY-pivot's main-chains together form a parallel β sheet (not shown), within which the glycine occurs at a non-hydrogen bonded position. This type of CH-π interaction is predicted to stabilize the β-stranded conformation of glycine (Merkel and Regan 1998)—an otherwise intrinsically destabilizing residue in β sheets. Because this glycine immediately precedes the NK.D motif, its β-stranded conformation may be important for proper positioning of motif residues when they are bound to guanine and to the main-chain of the P loop, which, in turn, directly binds nucleotide phosphates. Conversely, disruption of this CH-π interaction may destabilize nucleotide binding.
Two other FY-pivot canonical residues (W114Sec4 and D28Sec4; Fig. 4A inset) indirectly link the LV.D region to the GTP- or GDP-bound state of the protein via hydrogen bonds to P-loop residues, the main-chain oxygens of which hydrogen bond to the P-loop lysine directly interacting with GTP or GDP. Below we explore how these interactions may facilitate Ran nucleotide exchange.
Figure 4B represents the canonical interactions between the SA and NK.D regions. One of these consists of a salt bridge between an arginine (R140Sec4) and a glutamate (E160Sec4) that is well conserved in FY-pivot GTPases (Fig. 6)—though sequence variability often obscures the canonical arginine within multiple sequence alignments (Fig. 3B). Another canonical interaction involves two small residues (G147Sec4, A151Sec4) that facilitate packing of the helix following the NK.D motif against a canonical phenylalanine or tyrosine (F158Sec4). Although these small residues are well conserved within the Rab, Ras, and Rho families (Figs. 4B and 6A,B), Ran strikingly diverges from these canonical residues (I136Ran and H139Ran in Fig. 6C) in a manner that presumably reflects its specific function, as we discuss further below.
Figure 6.

Canonical interactions between the NK.D and SA regions within the Ras, Rho, and Ran families. The perspective is as shown in Figure 4B. Representations and coloring are as described in Figure 4. (A) Human Ras-GTP (pdb code: 1QRA). (B) The Rho family human Rac1 in complex with a GTP analog (pdb code: 1MH1). (C) Canine Ran-GDP (pdb code: 1BYU).
Figure 4C represents three canonical interactions associated with the Switch I and SA regions: (1) an interaction between two aromatic side-chains (F40Sec4 and F173Sec4), (2) a hydrogen bond between the backbone of the SA loop and a weakly conserved residue (R39Sec4p) near the Switch I region, and (3) a (well known) coordination between a phenylalanine (F45Sec4) and bound guanine. Given their locations, these interactions may help coordinate the binding or release of guanine nucleotide with conformational changes in the Switch I region.
Figure 7 shows the Figure 4C canonical interactions within other FY-pivot GTPases. In about 12% of these GTPases, a leucine residue (e.g., L23Ras in Fig. 7A) replaces the canonical Switch I aromatic residue (F40Sec4). This common deviation may be viewed as a reversion back to a noncanonical state, as roughly a third of all P-loop GTPases contain leucine at this position. In Ran, however, this canonical residue is replaced by a histidine (H30Ran in Fig. 7D). CHAIN analysis clearly reveals that this histidine, although aromatic, is a highly unusual replacement at this position (as indicated by the histogram in Fig. 1D). Indeed, among all P-loop GTPases, histidine appears to be tolerated in Ran alone: Only three out of over 5000 P-loop GTPases outside of the Ran family contained histidine at this position, and these may be due to single base sequencing errors. The possible role of this histidine is discussed below.
Ran GTPases
Ran controls mitotic spindle assembly and nuclear envelope formation and directs nuclear transport of proteins bound to importin-β via the adaptor protein importin-α, which recognizes classical nuclear localization signals (Clarke and Zhang 2001; Moore 2001). When a complex of importin-α/β and cargo protein enters the nucleus, binding of Ran-GTP to importin-β induces release of the cargo. Levels of Ran-GTP are elevated in the nucleus due to chromatin-bound RCC1, the Ran nucleotide exchange factor. When the Ran-GTP-importin-β complex exits the nucleus, importin-β is released via interaction of Ran with RanBP and Ran-GAP, which together activate GTP hydrolysis to generate Ran-GDP. Ran-GDP is recycled back into the nucleus via a nuclear transport factor.
Ran differs from other Ras-like GTPases in that it has a long C-terminal extension consisting of a linker, an α-helix, and an acidic tail (DEDDDL). The acidic tail stabilizes Ran's GDP-bound state and mediates interactions with RCC1, Ran-GAP, and RanBP (Richards et al. 1995). In Ran-GDP, this C-terminal extension packs up against the GTPase domain such that the acidic tail is located near a basic patch region (139HRKK142) of Ran. In other Ran complexes this C-terminal extension often undergoes a dramatic conformational change or ‘C-terminal switch.’
Ran's Basic Patch and C-Terminal Switch
Our analysis points to H30Ran and H139 Ran as the two residues that most distinguish the Ran family from other P-loop GTPases (see Fig. 1D) and links these residues to Ran's basic patch and C-terminal switching mechanisms. These residues, though highly conserved in Ran, strikingly diverge from the FY-pivot canonical residues at those positions.
H30Ran (Fig. 7D) corresponds to and diverges from the canonical phenylalanine or tyrosine (F40Sec4 in Fig. 4C) within the P-loop/Switch I region that establishes an aromatic stacking interaction with a canonical phenylalanine (F173Sec4) within the SA region. H30Ran establishes a similar aromatic-aromatic interaction in those Ran complexes for which the C-terminal extension dissociates from the GTPase domain (Fig. 8A). In the GDP-bound form, however, this interaction is disrupted, and instead H30Ran hydrogen bonds with the backbone nitrogen of residue 33 (Fig. 8B), which is within a region of Switch I (32–34Ran) that would otherwise clash with the C-terminal linker (182–184Ran; Vetter et al. 1999a,b). This bond also serves as an N-cap (Presta and Rose 1988; Richardson and Richardson 1988) favoring formation of a short α-helix involving residues 31–35, that—along with other stabilizing interactions by Ran-conserved residues (Fig. 8B)—moves a canonical phenylalanine (F35Ran) out of coordination with guanine. Moreover, upon formation of this bond, nearby main-chain atoms and the sequence-adjacent conserved arginine (R29Ran) are repositioned for hydrogen bonding to the C-terminal linker (Fig. 8B inset). Thus, H30Ran appears to play a central role in establishing Ran-GDP's C-terminal conformation.
Figure 8.

Interactions involving H30Ran and Ran's C-terminal switching mechanism. See text for details. (A) Ran-GTP-importin-β. Note that H30Ran forms an aromatic-aromatic interaction with F161Ran that is similar to the canonical interaction (Fig. 4C). Rather than simply interacting with canonical F161Ran, however, H30Ran inserts itself into an aromatic pocket formed by F161Ran and two other aromatic residues specifically conserved in Ran, F26Ran and F157Ran (data not shown). (B) Ran-GDP. H30Ran appears to be critical for establishing this conformation, in which Ran's C-terminal linker displaces the F35Ran interaction with guanine. The inset provides a different perspective that shows main-chain to main-chain hydrogen bonds between the C-terminal and H30 regions.
H139Ran (Fig. 6C) likewise corresponds to and diverges from a canonical alanine typically found at this position (A151Sec4 in Fig. 4B). Notably, histidine is a particularly bulky and polar substitute for alanine. A nearby isoleucine residue (I136Ran in Fig. 6C) is a similarly bulky substitute for the canonical alanine or glycine at that position (G147Sec4 in Fig. 4B). Moreover, there is a single residue deletion between I136Ran and H139Ran relative to the canonical residues. (This deletion is evident in the structure-based alignment of Figure 3, but in the sequence-based alignment of Figure 1C this deletion and I136Ran are misaligned relative to the FY-pivot consensus pattern below the Ran family alignment.) Due to their small size, the canonical residues at these positions facilitate packing of the helix in which they occur against a canonical phenylalanine or tyrosine (F158Sec4 in Fig. 4B). In Ran this helix contains the basic patch (139HRKK142) that, in the GDP-bound state, is believed to interact with the C-terminal acidic tail (Fig. 9A). We propose that H139Ran, I136Ran, and the deletion between them destabilize packing of the basic patch helix against the canonical Y146Ran and thereby facilitate distinct conformation states, which are stabilized through alternative interactions involving these and other residues. In agreement with this notion, the conformation of the basic patch varies between different Ran-GDP structures (Scheffzek et al. 1995; Stewart et al. 1998a,b).
Figure 9.

Interactions involving H139Ran, Y98Ran, and Ran's basic patch switching mechanism. See text for details. This figure focuses on three structural forms: (A,D) canine Ran-GDP (pdb code: 1BYU), (B,E) human Ran in complex with RCC1 (pdb code: 1I2M), and (C) human Ran in complex with importin-β and a GTP analog (pdb code: 1IBR). The perspective for A–C is as that for Sec4p in Figure 4B; the perspective for D,E is rotated approximately 180° relative to that for A,B. The reaction pathway for these three forms of Ran is shown between the upper and lower figures. Note that in C the invariant histidine at position 139 in Ran forms both an aromatic-aromatic interaction and an NH-π (or perhaps a CH-π) interaction with Trp342 of importin-β. (F) Proposed mechanism for Ran nucleotide exchange. The conformation of Canine Ran-GDP is shown with arrows indicating the direction of movement of key residues and main-chain regions upon binding to RCC1. A movie demonstrating the conformational changes involved in this mechanism is available as supplementary information at www.genome.org.
Y98Ran appears to help mediate conformational changes of the basic patch helix (Fig. 9). This tyrosine residue is invariant in Ran, but in other FY-pivot GTPases phenylalanine typically occurs at this position (Figs. 1, 3). This suggests that the tyrosine −OH group, though apparently selected against in other GTPases, is critical to Ran's function. Consistent with this notion, the Y98Ran−OH group hydrogen bonds to the basic patch helix in various ways depending on Ran's conformational state. In GTP-bound forms complexed with either importin-β (Chook and Blobel 1999; Vetter et al. 1999a) or RanBD1 (Chook and Blobel 1999; Vetter et al. 1999a,b; the structure of Ran-GTP by itself is not yet available), this −OH group hydrogen bonds with two main-chain nitrogens (Fig. 9C). In Ran-RCC1 (Renault et al. 2001), the −OH group hydrogen bonds to the side-chain nitrogen of the basic patch residue K141Ran (Fig. 9B), whereas in Ran-GDP it typically hydrogen bonds to a main-chain oxygen (Fig. 9A; the latter is found in nine out of 12 of the available structures of Ran-GDP; in two of the three remaining structures the −OH group is slightly shifted away from this configuration, and in one it binds to the same main-chain nitrogens as in the Ran-GTP complexes).
In all available forms of Ran, the orientation of Y98Ran is stabilized through canonical CH-π and aromatic-aromatic interactions with the FY-pivot residue (F90Ran in Fig. 9A–C). In nucleotide-bound forms, further stabilization of the basic patch helix occurs through interaction of I136Ran with canonical Y146Ran and through the canonical salt bridge between the NK.D and SA regions (Figs. 9A,C) (these interactions are maintained in all of the 17 currently available structures of nucleotide-bound Ran).
These observations, together with others described below, suggest that I136Ran and H139Ran destabilize the basic patch helix and thereby facilitate distinct conformation states, which are stabilized through alternative interactions involving these residues, Y98Ran, and other residues depending on the particular conformational state. At the same time, nearby canonical residues provide a structural context for these conformational changes, which we believe to be important for the following nucleotide exchange mechanism.
RCC1-Mediated Nucleotide Exchange
The main contributors to guanine nucleotide-binding affinity, and thus the main inhibitors of nucleotide exchange, are the interaction of the P-loop lysine (Sigal et al. 1986; John et al. 1988; Klebe et al. 1993) and main-chain (Rensland et al. 1995) with β phosphate, and the coordination of Mg2+ (Hall and Self 1986; Klebe et al. 1995). Based on these facts and on various GTPase-GEF structures, Renault et al. (2001) proposed a general nucleotide exchange mechanism, a key component of which is disruption of the interaction of nucleotide phosphates with the invariant P-loop lysine and with Mg2+.
Renault et al. (2001) also proposed a specific Ran-RCC1 exchange mechanism, a key component of which is insertion of a surface-exposed ‘β-wedge’ on RCC1 between the Ran Switch II and P-loop regions. This displaces the P loop, thereby changing the orientation of Ran's GDP binding sites relative to the guanine base and the phosphate groups. This favors nucleotide release because, based on studies with Ras (Rensland et al. 1995), the relative orientation of these sites is critical to nucleotide binding. Another component of this Ran-specific mechanism is that, upon nucleotide release, the base leaves first and the phosphate last, whereas, upon reentry, the phosphate comes in first and the base last. Our analysis suggests additional features of this exchange mechanism where, in particular, H139Ran and Y98Ran play important roles.
Upon binding to Ran, RCC1 interacts most extensively with the LV.D region (Fig. 9; Renault et al. 2001) and appears to pull it away from its indirect link to the P-loop lysine (cf. W104Ran in Figs. 9D,E), perhaps thereby transiently tugging on the interaction of this lysine with the β phosphate of GDP. The RCC1-Ran interaction may also alter binding to the guanine base, because the LV.D region is connected via canonical interactions (Fig. 5C) to the NK.D loop, which binds both to guanine and the P loop.
To envision precisely what may occur, consider that upon binding to RCC1 a threefold CH-π interaction (Fig. 9B), which we term a CH-π triad, forms between the FY-pivot residue, F90Ran, and two other aromatic residues, Y98Ran and F138Ran. Notably, in Ran the FY-pivot is always phenylalanine rather than tyrosine, which is more commonly found at this position in other FY-pivot GTPases and which cannot participate in such a triad due to its −OH group. This CH-π triad may thus perform a specific function associated with the Ran-RCC1 complex. Further support for this notion is provided by the sequence adjacency of Y98Ran to K99Ran, a key residue that inserts into and hydrogen bonds to the central hole of the RCC1 β-propeller structure (Fig. 9E; Renault et al. 2001). Indeed, among all the residues of Ran, K99 establishes the greatest surface contact (164 Å2) with RCC1.
In forming the CH-π triad from Ran-GDP, Y98Ran loses a CH-π interaction with canonical V131Ran (cf. Fig. 9A,B) and gains one with V101Ran (cf. Fig. 9D,E), whereas the −OH group of Y98Ran loses its hydrogen bond with a main-chain −C=O group and gains one with K141Ran (cf. Fig. 9A,B). This allows this −C=O group and the main-chain nitrogen of F138Ran to form a hydrogen bond (not shown), thereby establishing a typical main-chain α-helical conformation that appears to help position F138Ran within the CH-π triad.
At the same time, H139Ran flips to the other side of the basic patch helix (Fig. 9A,B), a conformational change facilitated by participation of the sequence-adjacent F138Ran in the CH-π triad and by the establishment of two interactions that explain the absolute requirement for histidine at position 139: an aromatic-aromatic interaction with canonical Y146Ran and a hydrogen bond to a side-chain oxygen of canonical D148Ran. In Ran, aspartate may occur at position 148 more often than glutamate, which is prevalent in other FY-pivot GTPases, to better facilitate this hydrogen bond—the formation of which also disrupts the canonical salt bridge.
This H139Ran flip also brings it closer to the canonical location for this residue relative to Y146Ran, whereas I136Ran swings away from its interaction with Y146Ran. These coordinated changes may be aided by the single residue deletion between I136Ran and H139Ran, inasmuch as the deletion disfavors concurrent interaction of both of these residues with Y146Ran. Moreover, recall that F90Ran of the CH-π triad also forms a CH-π interaction with the glycine residue directly preceding the NK.D motif (G115Ran in Fig. 5C). Thus one may easily imagine these atomic rearrangements twisting the NK.D loop (cf. Fig. 9A,B) in coordination with the previously mentioned movement of the P loop. This may lead to opposing movements of the guanine and phosphate binding sites, thereby leveraging separation of the P loop from the β phosphate or separation of the guanine base from the NK.D loop (Fig. 9F). The latter is consistent with the ‘guanine base first’ nucleotide release mechanism proposed for Ran-RCC1 (Renault et al. 2001).
These events may also help dislodge Ran's C-terminal extension from the GTPase domain, given the proposed contact between the basic patch and the C-terminal acidic tail. Indeed, an active role for RCC1 in inducing the C-terminal switch has been suggested based on structural considerations (Renault et al. 2001) and in vitro experiments showing that deletion of the acidic tail speeds up RCC1-catalyzed GDP release (Richards et al. 1995). Thus, these basic patch conformational changes may link nucleotide exchange with Ran's C-terminal switch, which, in turn, could help orchestrate other events. For example, dissociation of the C-terminus would allow it to wrap around the Ran binding domains (RanBDs) of RanBPs (Vetter et al. 1999b), which play important roles in Ran nuclear transport. Indeed, RanBD1 and RCC1 bind to distinct regions of Ran (Renault et al. 2001), and RanBPs interact with Ran-RCC1 to form trimeric complexes (Bischoff et al. 1995; Yokoyama et al. 1995; Noguchi et al. 1997; Mueller et al. 1998) that modulate RCC1 nucleotide exchange activity (Bischoff et al. 1995). Furthermore, recent studies suggest that RanBP1 and another protein that binds to Ran, Mog1, act as cofactors ensuring that RCC1-catalyzed exchange promotes the generation of Ran-GTP (Nicolas et al. 2001). Thus the basic patch mechanism we propose may facilitate efficient ordering of the molecular events mediated by these proteins.
Ran Binding to Importin-β
Other aspects of this H139-mediated basic patch mechanism are suggested by Ran's interaction with importin-β. The three residues directly following H139Ran within Ran's basic patch establish key contacts with acidic residues in importin-β (Chook and Blobel 1999; Vetter et al. 1999a). In particular, the residue directly following H139Ran, R140Ran, establishes a 152 Å2 contact surface with importin-β; this is the second most extensive contact among all the residues in Ran. However, a comparison of the contacting acidic residues within distinct importin-β families (Chook and Blobel 1999; Vetter et al. 1999a) reveals that these residues are not homologous and, therefore, are nonconserved. In contrast, a tryptophan (W342impβ in human importin-β1) that establishes an aromatic-aromatic interaction with H139Ran (Fig. 9C) is conserved across diverse organisms and distinct families—as is an acidic loop directly preceding this tryptophan. This interaction, along with electrostatic repulsion by importin-β's acidic loop and the above-mentioned interactions of the other basic patch residues, may help release Ran's C-terminal acidic tail for binding to RanBP-related proteins, which, in this context, act as Ran-importin-β release factors and as coactivators of RanGAP (Bischoff et al. 1995; Bischoff and Gorlich 1997) upon exit from the nucleus (Melchior and Gerace 1998). The previously mentioned repositioning of the Y98Ran −OH group hydrogen bond may also assist the conformational change required for these interactions (Fig. 9C). Incidentally, the transcriptional enhancer TIP120, which like importin-β is composed of HEAT repeats (Andrade and Bork 1995), contains a similar acidic loop and adjacent tryptophan within one of these repeats (Neuwald and Hirano 2000)—suggesting a possible role for Ran in the regulation of this protein.
Summary and Conclusion
The cell has been likened to a collection of protein machines, each with highly coordinated moving parts driven by energy-dependent conformational changes (Alberts 1998). If so, then discovering the underlying mechanisms at the core of this machinery is critical to understanding cellular activities. CHAIN analysis addresses this problem by capitalizing on two statistically useful characteristics of many core components: High sequence conservation across diverse taxa (implying an intricate mechanism performing an essential function) and the existence of many homologs (reflecting the notion that Nature seldom uses a good idea only once). Furthermore, we focused on a set of related proteins (i.e., P-loop GTPases) for which there is extensive sequence, structural, and other experimental data—a situation where the sheer volume of data is likely to obscure pertinent information. Fortunately, such an overabundance of data lends itself favorably to statistical analysis, which can detect subtle clues pointing to the most significant features of these proteins. Taking this approach has led to our findings here, which demonstrate that mechanistic aspects of core components of the cellular machinery can indeed be explored in this way.
We found among FY-pivot GTPases a canonical network of atomic interactions, the evolutionary persistence of which implies a critical cellular function. What might this be? It seems unlikely to involve binding to a specific type of domain because regulators and effectors differ in structure from family to family. On the other hand, we note that all of these GTPases must be stably maintained in either a GDP- or GTP-bound state, yet, when necessary, readily undergo conformational switching between states. One way to achieve this may be by embedding bound guanine nucleotide within a sufficiently stable, yet flexible network of molecular interactions that incorporates a pivoting mechanism for coordinating conformational changes needed for nucleotide release (and possibly other molecular events).
More specifically, our analysis here provides useful clues regarding Ran's C-terminal, basic patch, and nucleotide exchange mechanisms. In particular, we find that H30Ran, T98Ran, and H139Ran, which deviate from the corresponding FY-pivot canonical residues (though in the case of Y98Ran, only slightly), appear to destabilize the canonical conformations in these regions and, at the same time, help stabilize alternative conformations unique to Ran. These deviant residues may thus facilitate additional Ran-specific conformational states. Such innovative deviations from canonical residues may be a common evolutionary strategy for functional divergence and specialization, considering that other FY-pivot families display similar variations on the canonical theme.
There is likely much more to this canonical network, however, than is evident from the limited perspective of Ran GTPases discussed here. Similar in-depth analysis of other FY-pivot families should help provide a more complete picture. On the other hand, many statistically surprising structural features found through CHAIN analysis may be difficult to interpret in the absence of sufficient biochemical and structural data. In these instances, CHAIN analysis nevertheless provides a stimulus for first formulating and then experimentally testing hypotheses regarding canonical features and strikingly conserved deviations from those features observed for some families. In this context, we note that experimental studies of H30F, F90Y, and Y98F mutants of Ran are likely to be particularly informative.
Finally, we note that CHAIN analysis has other applications. For example, it can help assess the biological relevance of specific types of atomic interactions, as we found regarding the critical role in FY-pivot GTPase function of CH-π hydrogen bonds—whose importance to structural biology has only rather recently been appreciated (Weiss et al. 2001). By enhancing our understanding of structural principles, this could, in turn, lead to improved structural refinement and homology modeling methods. Yet, even in the absence of structural data, contrast hierarchical alignments can identify structurally relevant signature patterns useful for functional classification of genomic sequences and for evolutionary studies—as in the analysis here, which indicates that Ras, Rho, Rab, and Ran may have evolved from a predecessor resembling Sec4p. Thus, the strategies applied here serve as a starting point for further analyses along various lines.
METHODS
CHAIN Analysis
CHAIN analysis first classifies the residues conserved in a protein family into distinct categories based on their patterns of conservation within related sequences. To ensure that conservation within that family reflects functionally imposed constraints rather than recent common descent, representative family members are selected from distinct phyla that have diverged at least half a billion years ago. This is sufficient time for random mutations to have eliminated sequence similarity merely due to recent descent.
CHAIN analysis is initiated using a particular query sequence of interest. Using the gapped BLAST/PSI-BLAST procedure (Altschul et al. 1997), the query, which is typically a protein of known structure, is aligned against two sets of sequences, the ‘family set’ consisting of the representatives of the query family, and the ‘main set’ consisting of these and other related sequences. Note that, when aligning the query against the main set, a family consensus sequence (of the same length as the query) is used rather than the query itself, as we found that this generally improves the main set alignment. Because the PSI-BLAST alignment still tends to misalign sequences distantly related to the query, however, sequences in the main set are subsequently realigned using an optimization procedure (Neuwald and Poleksic 2000) based on Gibbs sampling (Lawrence et al. 1993; Liu et al. 1995, 1999).
Next a ‘superfamily set’ that contains the family set is derived from the main set (Fig. 2A). This is done using a procedure, called Bayesian partitioning with pattern selection (BPPS), that optimally partitions the main set into two distinct sets, one of which (the superfamily set) consists of sequences sharing conserved patterns with the query family and with each other, but not with sequences in the other set. This yields a series of telescoping aligned sequence sets, which we term a ‘hierarchical alignment.’ We will limit our discussion here to three sets, though this approach easily generalizes to more sets.
BPPS Procedure
The BPPS procedure is a Markov chain Monte Carlo method for sampling random variables from a probability distribution (Liu 2001), the details of which are described in the Appendix herein. Here there are two variables: a conserved pattern and a set of indicators for assigning each sequence to either the query or the nonquery partition. The procedure explores possible combinations of pattern-partition pairs, searching for one where the pattern maximally distinguishes the sequences in the query partition from those in the nonquery partition. This corresponds to an optimum point in the probability distribution defined by our statistical model.
In order to examine all the categories to which the query family belongs, the BPPS procedure is called multiple times, each time initialized with a distinct ‘seed pattern’ characteristic of a particular query-related subgroup of the main set. For each seed pattern, the procedure converges on a corresponding (possibly locally) optimum pattern-partition pair that defines a superfamily set. The final pattern found should be viewed as the characteristic signature for this superfamily. When the superfamily and family sets are distinct, these, together with the main set, define a three-level hierarchical alignment. (The BPPS procedure can be used to define the family set, but this is usually unnecessary for highly conserved families.) Based on this alignment, the selective constraints acting on the query are decomposed into four distinct categories, namely the main, superfamily, and family categories as well as an intermediate category (see below). We will refer to a set lower in the hierarchy as a ‘subalignment’ and a set higher up as a ‘superalignment’.
Measuring Selective Constraints
We identify the most significant structural features within a contrast hierarchical alignment by determining which conserved residue positions are most characteristic of each category. From an evolutionary perspective this involves measuring the selective constraints shifting residues in a specific column of a subalignment away from (and thus in ‘contrast’ to) the composition observed in that column of the superalignment. This measure, which is defined by the urn model in Figure 2C, is displayed graphically in the highlighted alignments of Figures 1B–D and 3.
More precisely, the selective constraint acting at position j in a subalignment is expressed in terms of the number of random trials needed to draw from among the residues in a superalignment (with replacement) at least as many conserved residues as are observed in the subalignment at that position. The likelihood of this event is given by the cumulative binomial probability,
 |
where c and N
and N are the number of conserved residues and the total number of residues, respectively, in the j-th column of subalignment L, and p
 is the frequency of the conserved residues observed at that position for superalignment B, which serves as the background model. The corresponding selective constraint acting on subalignment L is then defined as
 |
the expected number of random trials needed to observe this event. This measure helps decompose the total constraints acting on the family into specific categories, because it essentially ‘subtracts’ the constraints acting on a superalignment from those acting on the subalignment.
Histogram bar heights in alignment figures are set proportional to the number of random trials implied by K . If displayed directly, however, a column with P = 0.01 (100 trials), for example, would appear insignificant relative to a column with P = 0.00001 (100,000 trials). On the other hand, direct logarithmic scaling may cause the bars for significant columns to disappear depending on the value of P for the most significant column. We get around these problems by setting the bar height
 |
where t is the number of random trials and 0 ≤ ς < 1 is a scaling parameter for adjusting the relative bar heights so as to converge to linear scaling at ς = 0 and to logarithmic scaling as ς → 1. An automated routine chooses the appropriate values of ς for display (as in Fig. 1) based on the pattern positions selected by the BPPS procedure. The order-of-magnitude-increase in t as a function of ς, when the relative bar height increases by twofold, is given by
 |
Amino Acid Distributions
Several points regarding amino acid distributions should be noted. First, for the alignments in Figures 1A,B and 3A selective constraints are based on a standard background distribution, which we define as the overall amino acid frequencies observed for sequences in the main set. Second, when estimating amino acid distributions from observed counts, we adjust for small sample size by adding one pseudo-count for each type of amino acid at each position. In a Bayesian statistical context, this procedure corresponds to an uninformed prior probability. Third, because misaligned positions corrupt position-specific background frequency estimates, marginal alignment probabilities may be computed (Yu and Smith 1999) and, when there is significant alignment uncertainty, background distributions can be based on the weighted average of all superalignment positions likely to be aligned with that position in the subalignment. (This weighting procedure is akin to the use of Dirichlet mixture priors; Brown et al. 1993.) Note, however, that currently marginal probabilities are computed solely to identify regions of uncertainty, rather than to modify background distributions in this way.
Finally, when counting observed residues (for measuring selective constraints or for the BPPS procedure), sequences are down-weighted to adjust for correlations between them, using the PSI-BLAST weighting scheme (Henikoff and Henikoff 1994; Altschul et al. 1997). Note, however, that PSI-BLAST weights sum to 1, whereas we require weights that sum to the effective number of observed sequences. Calculation of such weights is an unsolved problem, but, as a rough estimate, one approach is to normalize the weights so that the maximum weight (corresponding to the least correlated sequence) is one. This may yield erratic results, however, because the effective number of sequences then depends on a single outlying sequence. As a robust alternative, we normalize weights such that the expected weight is one-half, with occasional normalized weights greater than one being truncated to one. Though admittedly ad hoc, this approach is adequate because we use these as relative measures rather than as precise probabilities. Note that weights are not computed for the query family alignment, because these sequences are selected from distinct phyla or kingdoms and, therefore, are treated as statistically independent.
Categorization of Residue Positions
We would like to classify residue positions within a three-level hierarchical alignment into four functional categories, namely the Main, Superfamily, and Family categories (Fig. 1B–D, respectively), and an Intermediate category. Although the BPPS procedure assigns certain query residue positions to the Superfamily, it does not explicitly assign residue positions to other categories. To do this, CHAIN analysis uses the following (admittedly ad hoc) procedures based on our measure of category-specific selective constraints. In describing these procedures, we will use the following alignment notation: Main alignment, M; Superfamily alignment, S; Family alignment, F; null alignment (standard amino acid background model), ⊘. Note that the positions assigned by the following procedures are indicated by the dots directly above the alignments in Figures 1A–D and, with respect to the residue side-chains in Figures 4–9, by the color scheme of Figure 2D.
Residue positions in the Superfamily category are defined by the pattern obtained by the BPPS procedure. We also include in this category any other positions j for which the Superfamily-specific selective constraint K is at least as high as the K
 s for any of the pattern positions selected by the BPPS procedure. The subset of related residues yielding the maximum K
 is chosen as the conserved residue set at each of these additional positions. (Note that residues in this set are typically unrelated to the query residue.) These additional positions correspond to conserved residues in the superfamily that are either nonconserved or divergently conserved within the query family and thus were not selected by the BPPS procedure. In other words, this procedure identifies positions in the superfamily that (based on their K
 ) would have been detected by the BPPS procedure, if the query family had contained the conserved residue at that position.
Residue positions assigned to the Main category are defined as those that are absent from the Superfamily category and for which the Main-set-specific selective constraint K is greater than the average K
 obtained for those positions assigned to the Superfamily category. Note that all of these K
 are computed from equation (1) based on standard background frequencies. Conceptually, this identifies previously uncategorized residue positions that are more highly conserved in the Main set than the average Superfamily position.
Residue positions in the Family category are defined as those that are absent from the Superfamily category and for which the Family-specific selective constraint K is greater than one standard deviation above the average K
 for those positions assigned to the Superfamily category. Conceptually, this identifies those residue positions outside of the Superfamily category with Family constraints greater than most of the Superfamily-assigned positions. We also assign to this category any Superfamily-assigned positions with K
 s at least as high as any of these positions and for which the Family residue set (as defined in the Appendix) is a proper subset of the Superfamily residue set at that position.
Finally, we classify into an Intermediate category those previously uncategorized residue positions that have a standard background-based Family-specific selective constraint K greater than one standard deviation below the mean K
 for all previously categorized positions. Conceptually, this represents residues that are roughly just as conserved in the query family as many of the previously classified columns but that are inconsistently conserved across these other categories, and thus cannot otherwise be definitively classified under the current hierarchical scheme.
Interaction Network Analysis
Interaction network analysis involves the identification of molecular interactions associated with category-specific selective constraints within available structures. The interactions considered include both classical (Baker and Hubbard 1984) and weak (Wahl and Sundaralingam 1997; Toth et al. 2001; Weiss et al. 2001) hydrogen bonds, aromatic-aromatic interactions (Burley and Petsko 1985), and van der Waals contacts (determined based on a standard distance of 4.5 Å). The REDUCE program (Word et al. 1999) was used to attach hydrogen atoms prior to hydrogen bond determination. Residue interactions between subunits were assessed based on buried surface area (Lee and Richards 1971). Other procedures generated RasMol (Sayle and Milner-White 1995) scripts for displaying interactions (as in Figs. 4–9).
Acknowledgments
We thank Linda Van Aelst, Leemor Joshua-Tor, Ingrid Vetter, Mike Wigler, and Rui-Ming Xu for critical reading of the manuscript and helpful suggestions. This work was supported by NIH grant LM06747 to A.F.N., by a Cold Spring Harbor Association postdoctoral fellowship to N.K., and by NSF grant DMS0204674 and NIH grant HG02518-01 to J.S.L.
The publication costs of this article were defrayed in part by payment of page charges. This article must therefore be hereby marked “advertisement” in accordance with 18 USC section 1734 solely to indicate this fact.
APPENDIX
Bayesian Partitioning With Pattern Selection
Pattern Definition
A pattern is defined as sets of amino acids, one set (termed a ‘query residue set’) for each position in the query sequence. Each query residue set must contain either no residues, in which case the position is ignored, or the query residue at that position along with zero or more related residues, which ensures that these patterns capture features of the query. Related residues are defined as those amino acids with a positive BLOSUM62 (Henikoff and Henikoff 1992) score against the query residue. For example, if the query sequence contains ‘F’ at a certain position, then the possible residue sets at that position would be {F}, {F,Y}, {F,W}, and {F,Y,W} because the distinct, positive scoring residues against ‘F’ are ‘Y’, and ‘W.’
Bayesian Partitioning With Pattern Selection (BPPS)
Our statistical model treats the aligned sequences in the nonquery partition as randomly and independently generated using the position-specific residue frequencies (PSFs) observed for those sequences. It treats sequences in the query partition as having two types of positions: nonpattern and pattern positions. Residues at nonpattern positions are generated from the same PSF as the nonquery sequences. Residues at pattern positions are generated from a mixture model at each position that is based both on the nonquery PSF (which models nonconserved residues) and on the query residues matching the conserved pattern at that position. For these mixture models a parameter α, the value of which is inferred from the observed sequences, specifies for the query partition the relative fraction of the observed residues derived from the conserved pattern model. Note that, to ensure that the query partition contains the query family itself, assignment of sequences in the family alignment to the nonquery partition is disallowed by the BPPS procedure. A complicating aspect of this model is that we do not know which sequences outside of the query family belong to the query partition nor which positions correspond to pattern positions nor exactly which residues are conserved at each pattern position. To solve this problem we set up the following statistical model and corresponding sampling strategy.
The Basic Model
To begin with, suppose we have vector observations (corresponding to n multiply aligned protein sequences) xi = (xi1,…,xik) for i = 1,…,n, where k is the number of columns (or aligned positions) and where each xij takes one of the residues in an alphabet of size m = 20. A more convenient method is to represent xij as a 20-dimensional vector (0,…,0,1,0,…,0), where the lone ‘1’ indicates the observed residue type.
Suppose that each xi falls into one of two clusters (the query or the nonquery partition), but that only a selected number of columns (the pattern positions) are differentiating these clusters and the remaining columns (the nonpattern positions) are just “dummies.” We introduce a row indicator vector R = (Rl,…,Rn) and a column indicator vector C = (Cl,…,Ck), where Ri = 1 if sequence i belongs to the query partition and 0 otherwise, and Cj = 1 if column j is differentiating (i.e., a pattern position) and 0 otherwise.
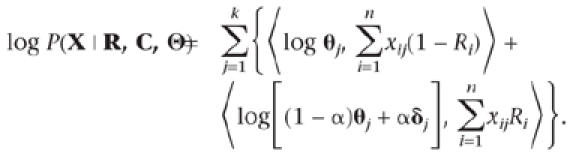
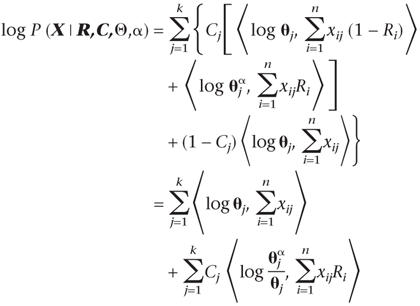
For a differentiating column, we require two 20-dimensional frequency vectors, θj(0) and θj(1), to describe the nonquery and the query compositions, respectively, whereas for a nondifferentiating column (i.e., when Cj = 0) we only need one θj. For convenience in writing, in the latter case we let θj(0) ≡ θj(1) = θj. Then, the log-likelihood of the sequence data can be written as:
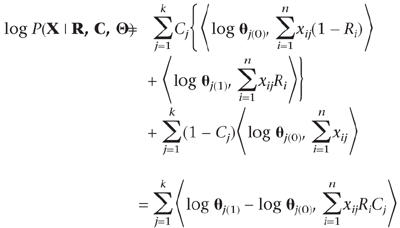 |
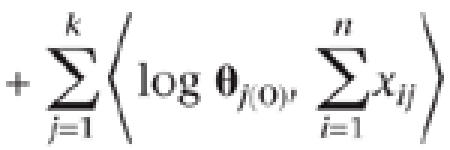 |
where 〈·, ·〉 denotes the inner product of two vectors. A prior Dirichlet(b) distribution is used for all the θs. Note that if R and C are given, we can easily obtain the corresponding posterior distributions. However, when the sequence partitioning and the pattern selection are unknown to us, the θs are not identifiable without imposing further model assumptions.
A Mixture Model for Query-Centric Partitioning
Given that sequence x1 is the query sequence, we want to assign the remaining sequences into either a query or a nonquery partition based on their similarity to x1. For notational simplicity, we assume in this subsection that every column contributes to the partitioning (i.e., Cj = 1 for all j). We let θj(0) ≡ θj = (θj,1,…,θj,20)T be the position-specific frequency vector for the nonquery partition and let θj(1) = (1 − α)θj + αδj be the modified frequency vector for the query cluster, where δj is another probability vector. Parameter α represents the small amount of “contamination” (or departure from the query sequence) allowed at each differentiating position of the query cluster. The prior distribution for α is β(a0, b0), where typically we let a0 = b0 = 1 (see below). Here we first take δj = x1,j, i.e., be identical to the query sequence. Then the data log-likelihood can be modified as
 |
It is of interest to partition according to this model.
Let us consider the contribution of a single column, say column j, to the overall likelihood. Suppose that the query residue at position j is x1,j ≡ x and that the partition indicator R is known. The likelihood of this column is:
 |
Here n1,x is the number of occurrences of residue type x in column j of the query partition, n0,x is that in the nonquery partition, n1,· is the total number of sequences in the query partition, and n·,1 is the count of residue type l in column j (for all the sequences). Thus, conditional on α and θ, it is easy to determine the effect of moving a sequence in or out of the query partition, which enables us to implement a Gibbs sampler.
Conditional on the partitioning, we can also introduce an indicator variable ξ = (ξij)n×k, where ξij = 1 and ξij = 0 imply that position i of sequence j comes from the query and the nonquery partition, respectively. Conditional on ξ and R, the posterior distribution of α is
 |
1 |
where |ξ| = ∑i∑jξij,and N1,· is the total number of residues in the query partition matching the corresponding query residue. The conditional distribution for θj is:
 |
2 |
where the prior for θj is Dirichlet(b) and |ξ·,j| is the total sum of ξij in the jth column. On the other hand, conditional on α and θj, we have
 |
3 |
The Gibbs sampling algorithm can be implemented as follows to cycle through R, ξ, α, and Θ:
- Conditional on the value of Θ and α, we cycle through all the sequences to assign them into either the query (Ri = 1) or nonquery (Ri = 0) partitions according to the following:

Conditional on R, α, and Θ, update the |ξ·,j| for each column according to (3).
Conditional on each |ξ·j|, update α according to (1) and update θj according to (2).
The Complete BPPS Model
Here we provide a more complete description of the model that addresses also the column (pattern) selection. Suppose that each column j is associated with a prior probability ρj for it to be either 1 (a differentiating column) or 0 (a dummy column). Then we have
 |
where θ = (1 − α)θj + αδj. A set of independent priors for α, Θ, C, and R are given as:
 |
 |
 |
 |
Hence, the logarithm of the joint distribution of all the variables is
 |
4 |
 |
Sampling Strategy
When C is given, the updates of the remaining parameters are identical to that in the previous section, except that all the operations in steps 1 to 3 are confined to those columns with Cj = 1. What we need now is the update of C conditional on everything else. Consider changing C to a new C‘ that differs from C only at the j-th column. Then, based on the distribution just described,
 |
5 |
 |
Hence, a simple Metropolis step can be used to update each Cj. Similarly, let R‘ differ from R only at Ri, then,
 |
6 |
In summary, we have the following Markov chain Monte Carlo (Liu 2001) sampling procedure:
For i = 1,…, n: • Propose to change Ri to 1 − Ri; • Draw U ∼ Uniform[0,1]; • Accept the proposal if log U is smaller than δR computed by (6), and leave Rj unchanged otherwise.
Same as the previous step 2.
Same as the previous step 3.
For j = 1,…, k: • Propose to change Cj to 1 − Cj; • Draw U ∼ Uniform[0,1]; • Accept the proposal if log U is smaller than δC computed by (5), and leave Cj unchanged otherwise.
Optimal Collapsing of Residues
The foregoing procedure models the pattern position frequency θj(1) as a mixture of the background frequency and a degenerate distribution concentrating on the query sequence residue. It is desirable, however, to use a more flexible model that allows for chemically related residues to be equally preferred at this position. In order to achieve this we implement a residue collapsing procedure. More precisely, we assume that the query partition pattern position frequency has the form θj(1) = αθj + (1 − α)δAj, where Aj is a subset of the 20 amino acids that includes the query residue type at position j along with zero or more “exchangeable” residue types, which we require to be positively related to the query residue according to the BLOSUM62 matrix. The relative frequencies of these residues in Aj are the same as that of θj. Mathematically, this can be represented as δAj ∝ θj ⊙ 1Aj, where the ‘⊙’ operator indicates multiplication of corresponding vector components. Hence, operationally, this model requires us to “merge” all these residue types into one residue and conduct the same Gibbs sampling algorithm.
Since the pattern sets Aj are unknown to us a priori, we need to estimate these from the aligned sequences. Conditional on all the other variables such as R, C, θj, and α, we can write down the probability of the observed residues in an aligned column. Since we are working on one column at a time, we suppress the column indicator j for a simple presentation; hence, the probability vector for a single column θ = (θ1,…,θ20) is given by:
 |
 |
where θA = Σk∈Aθk. Based on this formula, we can conduct the following Metropolis algorithm:
Randomly select one residue r that is positively related to the query residue; propose to change A to A‘ by either removing r from or adding r into A (as the case may be);
- Accept the proposal with probability
In order to further reduce the effect of relative frequencies for residues in A, we can also assume that the residues within A are equally likely, i.e., θk = θA/|A|, where |A| is the size of A. The above Metropolis algorithm can be modified accordingly.
The Significance of Pattern-Partition Pairs
To ensure that detected pattern-partition pairs are better than one would expect by chance, we compute a “net maximum a posteriori probability” (net-MAP). This involves first computing equation (4) for the particular pattern-partition pair of interest and then subtracting from this the value computed by equation (4) for a ‘null pattern-partition pair’, that is, one where the pattern contains only empty residue sets at all positions and where all of the sequences are assigned to the nonquery partition. This yields the log-probability ratio that compares the model for given pattern-partition pair to a model where the aligned sequences lack a distinct query-related partition sharing a conserved pattern with the query. Hence, given the conservative nature of our Bayesian formulation, when the aligned sequences are randomly shuffled within each column the net-MAP is expected to be negative.
Seed Patterns
Since it is biologically meaningful and computationally advantageous to focus only on residue positions that are “important,” we initialize the BPPS procedure with one or more distinct ‘seed patterns’, each of which is characteristic of a particular query-related subset of the main set. For example, when using a member of the Cdc42 subfamily of the Rho GTPases as the query, one seed pattern would correspond to the Rho GTPases and another to the FY-pivot GTPases. Seed patterns are obtained automatically using two procedures, one for finding simple patterns and another for merging these into more complex patterns.
Finding Simple Patterns
Seed patterns are obtained by first identifying ‘two-position’ patterns (defined as patterns having nonempty sets at only two positions) that the query shares with a statistically significant subset of the aligned sequences (i.e., the two positions are correlated). Because the sequence data is discrete, significance is based on adjusted P-values in a Fisher's exact test (Fisher 1925) for positive pairwise correlation, as follows. For all pairs of positions in the alignment and for all permissible query residue sets at those positions, we construct 2×2 contingency tables, each of which corresponds to a distinct two-position pattern (e.g., a phenylalanine or tyrosine at position 90 and a serine or threonine at position 96). Fisher's exact test gives the chance probability, P, of finding the observed number of or more sequences matching the pattern, given the numbers of sequences matching each residue set individually. Significant patterns are then defined as those for which P ≤ 0.001 after adjusting for the total number of patterns considered. Note, however, that when one or more residue sets at a given position are correlated with one or more residue sets at another position, we apply a standard optimum matching procedure to find the most correlated distinct pairs of residue sets at those positions. Only these pairs are further analyzed, as this avoids analysis of overlapping, nearly identical patterns.
Merging Patterns
Related two-position patterns are merged as follows. A graph is constructed with nodes corresponding to position-specific query residue sets and with edges corresponding only to the most significant of the patterns such that, given the number of nodes in the graph, no fully connected subgraph (i.e., clique) with more than three nodes is expected by chance based on the formula of Bollobas (1985). (Hence, the number of edges, and thus the number of patterns considered, is limited by this restriction.) Each clique of more than three nodes is identified (Bron and Kerbosch 1973), and its patterns are merged by combining corresponding residue sets at each position. Finally, cliques sharing a significant number of common nodes (based again on a Fisher's exact test with an adjusted P ≤ 0.0001) are combined, and their associated patterns merged. This last procedure is applied recursively on the resulting subgraphs until convergence.
Performance of the BPPS Procedure
We have implemented the BPPS and other CHAIN analysis procedures in the C++ programming language and have applied these procedures to various P-loop GTPases (as mentioned in the Results and Discussion) as well as to various protein kinases (N. Kannan and A. Neuwald, unpubl.). (Academic researchers interested in performing CHAIN analysis using these programs should contact the corresponding author.) Using the net-MAP to rank maxima and to provide a measure of the significance of the corresponding pattern-partition pairs, we found that typically the BPPS procedure essentially detects only a few local maxima. In the case of Ran, for instance, the BPPS procedure finds the Ran family itself, the FY-pivot GTPases, and a third class that includes both FY-pivot and non-FY-pivot GTPases sharing certain structural features in common (data not shown). We use the phrase ‘essentially detects’ because some classes are, in fact, detected as small clusters of nearly identical partitions that differ only by the inclusion or exclusion of a few sequences or pattern positions; these sequences presumably lack sufficient evidence to be unambiguously categorized either within or outside of that class. Switch I and Switch II residues conserved within Ras-like GTPases, many of which are well characterized (and for this reason are not discussed in the Results and Discussion), and well characterized residues within the cyclin-dependent and tyrosine protein kinases served as internal controls regarding the biological relevance and the performance of CHAIN analysis procedures.
The Choice of Tuning Parameters in Prior Distributions
Using representatives of these GTPase and protein kinase families, we explored how the choice of tuning parameters in prior distributions influences the performance of the BPPS procedure. For the BPPS model, we need to assign priors for all the θj (b), for α (a0 and b0), and priors on R (ρj) and C (ri). By default, we use uninformed priors, such that a0, b0 and the elements of vector b are each set equal to one residue pseudo-count, whereas the priors for R and C (the ri's and ρj's) are each set to 0.5. Since the priors for both R and C cancel out in our net-MAP equation, how these are chosen influences the rate of convergence but not the actual maxima in the probability landscape; we thus ignore the influence of these priors here. Essentially the same performance was observed whether we used the default uninformed priors for the θj or priors based on pseudo-counts that were skewed proportional to the amino acid frequencies typically observed in proteins. In the case of Ran, for example, choosing either of these priors for the θj identified the same three classes with very slight, if any, differences in the pattern-partition pairs.
By far, the greatest influence on the performance of the BPPS procedure relates to the choice of priors for α. In general, using priors such that a0 + b0 = 2 and α < 0.5 favors patterns that are less stringently conserved relative to those using the default prior. As a result, the maximal pattern-partition pairs tended to include more columns in the patterns and more atypical or marginally related sequences in the query partition. On the other hand, using priors such that a0 + b0 = 2 and α > 0.5 requires that the patterns be more stringently conserved relative to those using the default prior. As a result, the maximal pattern-partition pairs tended to include fewer columns in the patterns and fewer atypical or marginally related sequences in the query partition. The degree of variably, however, was fairly small. In the case of Ran with a range of priors such that a0 + b0 = 2 and 0.1 ≤ α ≤ 0.9, for example, the BPPS procedure detected the same three categories with the sequences included in or excluded from these categories varying by less than ±5%.
REFERENCES
Bollobas, B. 1985. Random Graphs. Chapter 11. Academic Press, London, UK.
Bron, C. and Kerbosch, J. 1973. Algorithm 457: Finding all cliques of an undirected graph. Communications of the A.C.M.16: 575–577.
Fisher, R.A. 1925. Statistical methods for research workers. Oliver and Boyd, Edinburgh, Scotland.
Henikoff, S. and Henikoff, J.G. 1992. Amino acid substitution matrices from protein blocks. Proc. Natl. Acad. Sci.89: 10915–10919.
Liu, J.S. 2001. Monte Carlo Strategies in Scientific Computing. Springer-Verlag, New York, NY.
E-MAIL neuwald@cshl.org; FAX: 516-367-8461.
Article and publication are at http://www.genome.org/cgi/doi/10.1101/gr.862303.
REFERENCES
- 1.Alberts B. 1998. The cell as a collection of protein machines: Preparing the next generation of molecular biologists. Cell 92: 291-294. [DOI] [PubMed] [Google Scholar]
- 2.Altschul S.F., Madden, T.L., Schaffer, A.A., Zhang, J., Zhang, Z., Miller, W., and Lipman, D.J. 1997. Gapped BLAST and PSI-BLAST: A new generation of protein database search programs. Nucleic Acids Res. 25: 3389-3402. [DOI] [PMC free article] [PubMed] [Google Scholar]
- 3.Andrade M.A. and Bork, P. 1995. HEAT repeats in the Huntington's disease protein. Nat. Genet. 11: 115-116. [DOI] [PubMed] [Google Scholar]
- 4.Baker E.N. and Hubbard, R.E. 1984. Hydrogen bonding in globular proteins. Prog. Biophys. Mol. Biol. 44: 97-179. [DOI] [PubMed] [Google Scholar]
- 5.Bar-Sagi D. and Hall, A. 2000. Ras and Rho GTPases: A family reunion. Cell 103: 227-238. [DOI] [PubMed] [Google Scholar]
- 6.Bischoff F.R. and Gorlich, D. 1997. RanBP1 is crucial for the release of RanGTP from importin β-related nuclear transport factors. FEBS Lett. 419: 249-254. [DOI] [PubMed] [Google Scholar]
- 7.Bischoff F.R., Krebber, H., Smirnova, E., Dong, W., and Ponstingl, H. 1995. Coactivation of RanGTPase and inhibition of GTP dissociation by Ran-GTP binding protein RanBP1. EMBO J. 14: 705-715. [DOI] [PMC free article] [PubMed] [Google Scholar]
- 8.Brown M., Hughey, R., Krogh, A., Mian, I.S., Sjolander, K., and Haussler, D. 1993. Using Dirichlet mixture priors to derive hidden Markov models for protein families. Proc. Int. Conf. Intell. Syst. Mol. Biol. 1: 47-55. [PubMed] [Google Scholar]
- 9.Burley S.K. and Petsko, G.A. 1985. Aromatic-aromatic interaction: A mechanism of protein structure stabilization. Science 229: 23-28. [DOI] [PubMed] [Google Scholar]
- 10.Chook Y.M. and Blobel, G. 1999. Structure of the nuclear transport complex karyopherin-β2-Ran × GppNHp. Nature 399: 230-237. [DOI] [PubMed] [Google Scholar]
- 11.Clarke P.R. and Zhang, C. 2001. Ran GTPase: A master regulator of nuclear structure and function during the eukaryotic cell division cycle? Trends Cell Biol. 11: 366-371. [DOI] [PubMed] [Google Scholar]
- 12.Crespo P. and Leon, J. 2000. Ras proteins in the control of the cell cycle and cell differentiation. Cell. Mol. Life Sci. 57: 1613-1636. [DOI] [PMC free article] [PubMed] [Google Scholar]
- 13.Dingwall C., Kandels-Lewis, S., and Seraphin, B. 1995. A family of Ran binding proteins that includes nucleoporins. Proc. Natl. Acad. Sci. 92: 7525-7529. [DOI] [PMC free article] [PubMed] [Google Scholar]
- 14.Hall A., 2000. GTPases. Oxford University Press, London, UK.
- 15.Hall A. and Self, A.J. 1986. The effect of Mg2+ on the guanine nucleotide exchange rate of p21N-ras. J. Biol. Chem. 261: 10963-10965. [PubMed] [Google Scholar]
- 16.Henikoff S. and Henikoff, J.G. 1994. Position-based sequence weights. J. Mol. Biol. 243: 574-578. [DOI] [PubMed] [Google Scholar]
- 17.John J., Frech, M., and Wittinghofer, A. 1988. Biochemical properties of Ha-ras encoded p21 mutants and mechanism of the autophosphorylation reaction. J. Biol. Chem. 263: 11792-11799. [PubMed] [Google Scholar]
- 18.Klebe C., Nishimoto, T., and Wittinghofer, F. 1993. Functional expression in Escherichia coli of the mitotic regulator proteins p24ran and p45rcc1 and fluorescence measurements of their interaction. Biochemistry 32: 11923-11928. [DOI] [PubMed] [Google Scholar]
- 19.Klebe C., Bischoff, F.R., Ponstingl, H., and Wittinghofer, A. 1995. Interaction of the nuclear GTP-binding protein Ran with its regulatory proteins RCC1 and RanGAP1. Biochemistry 34: 639-647. [DOI] [PubMed] [Google Scholar]
- 20.Lawrence C.E., Altschul, S.F., Boguski, M.S., Liu, J.S., Neuwald, A.F., and Wootton, J.C. 1993. Detecting subtle sequence signals: A Gibbs sampling strategy for multiple alignment. Science 262: 208-214. [DOI] [PubMed] [Google Scholar]
- 21.Lee B. and Richards, F.M. 1971. The interpretation of protein structures: Estimation of static accessibility. J. Mol. Biol. 55: 379-400. [DOI] [PubMed] [Google Scholar]
- 22.Leipe D.D., Wolf, Y.I., Koonin, E.V., and Aravind, L. 2002. Classification and evolution of P-loop GTPases and related ATPases. J. Mol. Biol. 317: 41-72. [DOI] [PubMed] [Google Scholar]
- 23.Liu J.S., 2001. Monte Carlo strategies in scientific computing. Springer-Verlag, New York, NY.
- 24.Liu J.S., Neuwald, A.F., and Lawrence, C.E. 1995. Bayesian models for multiple local sequence alignment and Gibbs sampling strategies. J. Am. Stat. Assoc. 90: 1156-1170. [Google Scholar]
- 25.Liu J.S., Neuwald, A.F., and Lawrence, C.E. 1999. Markovian structures in biological sequence alignments. J. Am. Stat. Assoc. 94: 1-15. [Google Scholar]
- 26.Melchior F. and Gerace, L. 1998. Two-way trafficking with Ran. Trends Cell Biol. 8: 175-179. [DOI] [PubMed] [Google Scholar]
- 27.Merkel J.S. and Regan, L. 1998. Aromatic rescue of glycine in β sheets. Fold. Des. 3: 449-455. [DOI] [PubMed] [Google Scholar]
- 28.Moore J.D. 2001. The Ran-GTPase and cell-cycle control. Bioessays 23: 77-85. [DOI] [PubMed] [Google Scholar]
- 29.Mueller L., Cordes, V.C., Bischoff, F.R., and Ponstingl, H. 1998. Human RanBP3, a group of nuclear RanGTP binding proteins. FEBS Lett. 427: 330-336. [DOI] [PubMed] [Google Scholar]
- 30.Neuwald A.F. and Hirano, T. 2000. HEAT repeats associated with condensins, cohesins, and other complexes involved in chromosome-related functions. Genome Res. 10: 1445-1452. [DOI] [PMC free article] [PubMed] [Google Scholar]
- 31.Neuwald A.F. and Poleksic, A. 2000. PSI-BLAST searches using hidden markov models of structural repeats: Prediction of an unusual sliding DNA clamp and of β-propellers in UV-damaged DNA-binding protein. Nucleic Acids Res. 28: 3570-3580. [DOI] [PMC free article] [PubMed] [Google Scholar]
- 32.Nicolas F.J., Moore, W.J., Zhang, C., and Clarke, P.R. 2001. XMog1, a nuclear ran-binding protein in Xenopus, is a functional homologue of Schizosaccharomyces pombe mog1p that cooperates with RanBP1 to control generation of Ran-GTP. J. Cell Sci. 114: 3013-3023. [DOI] [PubMed] [Google Scholar]
- 33.Noguchi E., Hayashi, N., Nakashima, N., and Nishimoto, T. 1997. Yrb2p, a Nup2p-related yeast protein, has a functional overlap with Rna1p, a yeast Ran-GTPase-activating protein. Mol. Cell. Biol. 17: 2235-2246. [DOI] [PMC free article] [PubMed] [Google Scholar]
- 34.Pfeffer S.R. 2001. Rab GTPases: Specifying and deciphering organelle identity and function. Trends Cell Biol. 11: 487-491. [DOI] [PubMed] [Google Scholar]
- 35.Presta L.G. and Rose, G.D. 1988. Helix signals in proteins. Science 240: 1632-1641. [DOI] [PubMed] [Google Scholar]
- 36.Renault L., Kuhlmann, J., Henkel, A., and Wittinghofer, A. 2001. Structural basis for guanine nucleotide exchange on Ran by the regulator of chromosome condensation (RCC1). Cell 105: 245-255. [DOI] [PubMed] [Google Scholar]
- 37.Rensland H., John, J., Linke, R., Simon, I., Schlichting, I., Wittinghofer, A., and Goody, R.S. 1995. Substrate and product structural requirements for binding of nucleotides to H-ras p21: The mechanism of discrimination between guanosine and adenosine nucleotides. Biochemistry 34: 593-599. [DOI] [PubMed] [Google Scholar]
- 38.Richards S.A., Lounsbury, K.M., and Macara, I.G. 1995. The C terminus of the nuclear RAN/TC4 GTPase stabilizes the GDP-bound state and mediates interactions with RCC1, RAN-GAP, and HTF9A/RANBP1. J. Biol. Chem. 270: 14405-14411. [DOI] [PubMed] [Google Scholar]
- 39.Richardson J.S. and Richardson, D.C. 1988. Amino acid preferences for specific locations at the ends of α helices. Science 240: 1648-1652. [DOI] [PubMed] [Google Scholar]
- 40.Sayle R.A. and Milner-White, E.J. 1995. RASMOL: Biomolecular graphics for all. Trends Biochem. Sci. 20: 374. [DOI] [PubMed] [Google Scholar]
- 41.Scheffzek K., Klebe, C., Fritz-Wolf, K., Kabsch, W., and Wittinghofer, A. 1995. Crystal structure of the nuclear Ras-related protein Ran in its GDP-bound form. Nature 374: 378-381. [DOI] [PubMed] [Google Scholar]
- 42.Shindyalov I.N. and Bourne, P.E. 2001. A database and tools for 3-D protein structure comparison and alignment using the Combinatorial Extension (CE) algorithm. Nucleic Acids Res. 29: 228-229. [DOI] [PMC free article] [PubMed] [Google Scholar]
- 43.Sigal I.S., Gibbs, J.B., D'Alonzo, J.S., Temeles, G.L., Wolanski, B.S., Socher, S.H., and Scolnick, E.M. 1986. Mutant ras-encoded proteins with altered nucleotide binding exert dominant biological effects. Proc. Natl. Acad. Sci. 83: 952-956. [DOI] [PMC free article] [PubMed] [Google Scholar]
- 44.Stenmark H. and Olkkonen, V.M. 2001. The Rab GTPase family. Genome Biol. 2: REVIEWS3007. [DOI] [PMC free article] [PubMed] [Google Scholar]
- 45.Stewart M., Kent, H.M., and McCoy, A.J. 1998a. Structural basis for molecular recognition between nuclear transport factor 2 (NTF2) and the GDP-bound form of the Ras-family GTPase Ran. J. Mol. Biol. 277: 635-646. [DOI] [PubMed] [Google Scholar]
- 46.Stewart M., Kent, H.M., and McCoy, A.J. 1998b. The structure of the Q69L mutant of GDP-Ran shows a major conformational change in the switch II loop that accounts for its failure to bind nuclear transport factor 2 (NTF2). J. Mol. Biol. 284: 1517-1527. [DOI] [PubMed] [Google Scholar]
- 47.Strom A.C. and Weis, K. 2001. Importin-β-like nuclear transport receptors. Genome Biol 2: REVIEWS3008.3001-3009. [DOI] [PMC free article] [PubMed] [Google Scholar]
- 48.Symons M. and Settleman, J. 2000. Rho family GTPases: More than simple switches. Trends Cell Biol. 10: 415-419. [DOI] [PubMed] [Google Scholar]
- 49.Takai Y., Sasaki, T., and Matozaki, T. 2001. Small GTP-binding proteins. Physiol. Rev. 81: 153-208. [DOI] [PubMed] [Google Scholar]
- 50.Toth G., Watts, C.R., Murphy, R.F., and Lovas, S. 2001. Significance of aromatic-backbone amide interactions in protein structure. Proteins 43: 373-381. [DOI] [PubMed] [Google Scholar]
- 51.Tuvim M.J., Adachi, R., Hoffenberg, S., and Dickey, B.F. 2001. Traffic control: Rab GTPases and the regulation of interorganellar transport. News Physiol. Sci. 16: 56-61. [DOI] [PubMed] [Google Scholar]
- 52.Valencia A., Chardin, P., Wittinghofer, A., and Sander, C. 1991. The ras protein family: Evolutionary tree and role of conserved amino acids. Biochemistry 30: 4637-4648. [DOI] [PubMed] [Google Scholar]
- 53.Vetter I.R., Arndt, A., Kutay, U., Gorlich, D., and Wittinghofer, A. 1999a. Structural view of the Ran-Importin β interaction at 2.3 A resolution. Cell 97: 635-646. [DOI] [PubMed] [Google Scholar]
- 54.Vetter I.R., Nowak, C., Nishimoto, T., Kuhlmann, J., and Wittinghofer, A. 1999b. Structure of a Ran-binding domain complexed with Ran bound to a GTP analogue: Implications for nuclear transport. Nature 398: 39-46. [DOI] [PubMed] [Google Scholar]
- 55.Vetter I.R. and Wittinghofer, A. 2001. The guanine nucleotide-binding switch in three dimensions. Science 294: 1299-1304. [DOI] [PubMed] [Google Scholar]
- 56.Wahl M.C. and Sundaralingam, M. 1997. C-H…O hydrogen bonding in biology. Trends Biochem. Sci. 22: 97-102. [DOI] [PubMed] [Google Scholar]
- 57.Weiss M.S., Brandl, M., Suhnel, J., Pal, D., and Hilgenfeld, R. 2001. More hydrogen bonds for the (structural) biologist. Trends Biochem. Sci. 26: 521-523. [DOI] [PubMed] [Google Scholar]
- 58.Wittinghofer A. 1999. The functioning of molecular switches in three dimensions. In GTPases (ed. A. Hall), pp. 244–310. Oxford University Press, Oxford, UK.
- 59.Word J.M., Lovell, S.C., Richardson, J.S., and Richardson, D.C. 1999. Asparagine and glutamine: Using hydrogen atom contacts in the choice of side-chain amide orientation. J. Mol. Biol. 285: 1735-1747. [DOI] [PubMed] [Google Scholar]
- 60.Ye K., Hurt, K.J., Wu, F.Y., Fang, M., Luo, H.R., Hong, J.J., Blackshaw, S., Ferris, C.D., and Snyder, S.H. 2000. Pike. A nuclear gtpase that enhances PI3kinase activity and is regulated by protein 4.1N. Cell 103: 919-930. [DOI] [PubMed] [Google Scholar]
- 61.Yokoyama N., Hayashi, N., Seki, T., Pante, N., Ohba, T., Nishii, K., Kuma, K., Hayashida, T., Miyata, T., Aebi, U., et al. 1995. A giant nucleopore protein that binds Ran/TC4. Nature 376: 184-188. [DOI] [PubMed] [Google Scholar]
- 62.Yu L. and Smith, T.F. 1999. Positional statistical significance in sequence alignment. J. Comput. Biol. 6: 253-259. [DOI] [PubMed] [Google Scholar]