

Abstract
Three important areas of data analysis for global gene expression analysis are class discovery, class prediction, and finding dysregulated genes (biomarkers). The clinical application of microarray data will require marker genes whose expression patterns are sufficiently well understood to allow accurate predictions on disease subclass membership. Commonly used methods of analysis include hierarchical clustering algorithms, t-, F-, and Z-tests, and machine learning approaches. We describe an approach called the maximum difference subset (MDSS) algorithm that combines classification algorithms, classical statistics, and elements of machine learning and provides a coherent framework. By integrating prediction accuracy, the MDSS algorithm learns the critical threshold of statistical significance (the α or P-value), eliminating the arbitrariness of setting a threshold of statistical significance and minimizing the effect of the normality assumptions. To reduce the false positive rate and to increase external validity of the predictive gene set, a jackknife step is used. This step identifies and removes genes in the initial MDSS with low combined predictive utility. The overall MDSS provides a prediction that is less dependent on an arbitrary study design (sample inclusion or exclusion) and should thus have high external validity. We demonstrate that this approach, unlike other published methods, identifies biomarkers capable of predicting the outcome of anthracycline-cytarabine chemotherapy in cases of acute myeloid leukemia. By incorporating two criteria—statistical significance and predictive utility—the approach learns the significance level relevant for a given data set. The MDSS approach can be used with any test and classifier operator pair.
Microarray technology permits the monitoring of relative gene expression values for thousands of genes in one experiment. This extremely powerful technology has revolutionized functional genomics by allowing the simultaneous cross-tissue comparisons of expression levels in thousands of genes (Schena et al. 1995; DeRisi et al. 1997). This has set the stage for an era of rapid developments in molecular medicine and pharmacogenomics. Transcription profiles from microarray experiments can provide molecular fingerprints of normal and aberrant (diseased) tissues. Gene expression patterns are thought to be different for all tissue types, at different stages of development, and unique in particular diseased tissues such as tumors. Subclasses or subtypes of diseases are beginning to emerge on the basis of the comparative analysis of gene expression profiles from diseased tissues of the same class, and highly resolved, highly accurate classification of known subtypes are expected to result from the comparative analysis of expression profiles among different subtypes. Microarray hybridization experiments are unveiling detail in the classification of cancers, including acute myeloid leukemia (AML) and acute lymphoid leukemia (ALL; Golub et al. 1999), breast cancer (Perou et al. 2000), melanomas (Bittner et al. 2000), colon cancer (Alon et al. 2000), ovarian cancer (Welsh et al. 2001), diffuse B-cell-type lymphomas (Alizadeh et al. 2000), lung cancers (Garber et al. 2001), and gastric cancers (Hippo et al. 2002). The lymphoma (Alizadeh et al. 2000) and lung cancer studies (Garber et al. 2001) provide especially clear examples of the discovery of new subtypes of cancers.
Every newly discovered high-resolution classification using molecular differences among previously unrecognized disease subtypes paves the way for refined clinical trials and the development of highly targeted therapies. Such classifications will allow fine-tuning of diagnosis and prognosis. An equally exciting application of transcription profiles will be fine-scale predictions of drug responses. Given an expression profile from a patient, available drugs will be prescribed with greater precision and with higher effectiveness through highly individualized treatments, removing much of the guesswork as to whether an individual will or will not respond to a particular treatment. Analyses of functional genomic data also promise to increase the rate at which new routes to treatments can be developed. Genes that show differential expression between diseased tissue and normal tissue and among disease subtypes or stages can be expected to suggest experimental therapies including gene therapy (e.g., replacing defective promoter sequences), genome therapy (drugs that enhance or suppress the transcription of particular sets of genes), and even oral replacement therapy, as in the case of the effects of oral replacement of guanylin on colon cancer rates in mice (Shailubhai et al. 2000). The route to discovery includes gene expression profiling of known types → identification of biomarkers (dysregulated genes) → identification of routes to treatment suggested by the biomarkers. The goal of finding dysregulated genes is thus motivated by two distinct applications: finding biomarkers for class prediction (Golub et al. 1999), and the biomarkers themselves tend to suggest further experimental routes to prevention or treatment.
Lasting discoveries require appropriate and useful methods of analysis. These are key to the success of individual studies in functional genomics and pharmacogenomics, and are thus essential for rapid discovery. Analyses and data-handling steps to insure data quality have been described and are fairly well characterized for each type of microarray technology (Brown et al. 2001; Wang et al. 2001). The goals of data analysis steps (after data collection and quality checking) fall into three broad categories: (1) class discovery (identification of subtypes from gene expression profiles), (2) class prediction (placing unknown samples into a preexisting classification), and (3) detecting differentially expressed genes (finding dysregulated genes that clearly delineate between subtypes within a classification). Important statistical considerations for each of these steps include the use of appropriate study design, which includes (a) not confounding tissue-of-origin differences or dye channel with pathological difference between normal and diseased tissues, (b) the use of an appropriate training set for machine-learning based approaches, and (c) the sampling of a sufficient number of each type of tissue, or measuring each with sufficient accuracy and precision to avoid outlier effects. Also important are the use of appropriate algorithms and statistics for each step in data analysis, including (a) the selection of reliable and justified classification methods, (b) the use of a valid and robust test for differential expression designed to allow differences for the variances in the two (or more) groups under study, and (c) avoiding over-training the test. Finally, in the class prediction step, consideration is needed to ensure that (d) the predictions made are accurate, which includes (e) ensuring that the sample for which a prediction is sought belongs within one of the subtypes in the existing classification and does not represent a unique subtype. Some classifiers will lead to a ‘call’ on any sample, so this is an important feature of a useful predictive classifier.
Approaches to data analysis are not uniform; indeed, almost every major paper reporting results from microarray experiments describes or applies a different set of methods or describes a novel approach to analysis. The lack of standardization is expected, but can be problematic; different research groups might come to very different conclusions about a disease given that different methods of analysis invoke different sets of assumptions. Hierarchical clustering algorithms have been widely applied to class discovery (classical ‘clustering’) and class prediction (‘classification’ proper; Eisen et al. 1998; Golub et al. 1999). Previously applied approaches for detecting differentially expressed genes include k-fold difference measures (DeRisi et al. 1997); a regression model (Thomas et al. 2001), simple t-tests for each gene and related approaches (Baggerly et al. 2001; Baldi and Long 2001; Thomas et al. 2001); projection methods such as principle component analysis (PCA), also known as singular value decomposition (Alter et al. 2000) and correspondence analysis (Fellenberg et al. 2001); machine learning approaches (e.g., support vector machine classification, Furey et al. 2000), binary classifiers such as weighted voting (Golub et al. 1999; Yeang et al. 2001), and mixed model approaches (Kerr et al. 2000; Wolfinger et al. 2001).
Important limitations exist even for simple methods. The use of fold-change difference ratios can be criticized on the grounds that because they do not take into account measurement error (variance), they will fail to find genes that show a highly reproducible but small difference in relative expression values. Basic t-tests and related approaches (F tests, z-tests; Thomas et al. 2001; Welsh et al. 2001) can be criticized on the grounds that they require distributional assumptions. Moreover, if the statistical tests are interpreted strictly, then straightforward interpretation can be muddled by the need for correction for multiple tests. Most importantly, the importance of accounting for variability within and across genes has been recognized by others concerned with developing methods for finding differentially expressed genes (Kerr et al. 2000; Wolfinger et al. 2001). As employed to date, the simple tests do not account for differences in the amount of variance between sample groups. Specifically, given two means m1, m2, from sample groups of size n1 and n2, and within-group variances s12 and s22, the error term in the simple Student t-test statistic
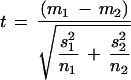 |
is inappropriate in this application when the sample groups are of different size, leading to differences in variance in expression values among samples of genes from different tissue types. Moreover, the two sample sets may be measured with different precision (due to dye-specific read efficiencies). Hedenfalk et al. (2001) attempted to circumvent the distributional assumption by using F- and t- permutation tests. Kerr et al. (2000) implemented a mixed model (ANOVA) in which these (and experimental) factors can be examined as independent factors.
Notably, intuitive dimension-reduction and projection methods such as (PCA) and correspondence analysis can be criticized on the grounds that their eigenvalues must be iteratively estimated and that they require that the number of eigenvalues to be used be selected. Because of this, the overall “broad pattern” results can be entry order-sensitive (Tausch et al. 1996). This is especially so if only a few major components are sought.
Eventually, the discoveries made using different methods should be formally compared. These very different approaches seldom identify the same subset of genes, resulting in a major potential bottleneck to discovery. When different methods report different gene sets as biomarkers (and therefore candidates for experiments leading to treatment or prevention), it would help to test the gene set to determine whether it can, in fact, accurately differentiate between the two groups in a predictive application of the method used for classification. Given the large number of options available for the analysis of microarray data, it may be tempting for researchers to use all available methods and look for consensus among them. An interesting but theoretically unjustified application of this type was conducted by Welsh et al. (2001), who created a composite score for each gene by summing the scores for three separate measures. One problem with such an approach is that some of the methods used may provide redundant results, and no objective criterion exists for weighting (or not weighting) the results of different methods. Second, different researchers may come to different conclusions depending on which methods they decide to include in their composite score. Third, the choice of tests to include in such approaches is somewhat arbitrary. Indeed, Yeang et al. (2001) used a combination of three different binary discriminant functions (k-nearest neighbors, weighted voting, and support vector machines) but in the end, selecting these three methods instead of the three methods selected by Welsh et al. (2001) is a subjective call.
Because the rate of discovery can be hampered by built-in artifacts and flaws in experimental design intrinsic to the current application of microarray technologies, mixed models to account for the limitations of microarray technologies and their applications have been described (Kerr et al. 2000; Wolfinger et al. 2001). These methods are currently useful due to channel-specific variabilities and the complete confounding of treatment effect with dyes. Moreover, their general form allows the testing for effects of any identifiable source of variability. This is at once a strength and a potential weakness; mixed-model approaches can be criticized on the grounds that they attempt to estimate too many parameters with sparse data (few studies replicate enough), and in the extreme can become curve-fitting exercises (such as fitting polynomial equations to explain cross-sample variability). Indeed, one factor that appears on the surface to present real problems is the specter of sequence-specific fluorescence intensity. Because reverse transcription and label incorporation may differ with the linear nucleotide sequence, a mixed model might be constructed to account for this effect, requiring as many parameters as sequences. This would be overkill, because the fluorescence intensities are compared across groups for each gene, which is based on the same sequence. Therefore, as long as one scales the measured between-group difference by the degree of variability, as in an appropriate test statistic, the sequence effect problem is not relevant for the problem of finding differentially expressed genes, as long as single probes are used and expression values are normalized within genes.
Eventually, advances in technology may permit simultaneous high-throughput monitoring of thousands of genes using laboratory techniques that either are or are not based on microarray technology but that do not result in the particular artifacts and confounding that these mixed models have been aptly adapted to study. Because of their ability to test for and report on problems with technology and experimental design when studied as factors, mixed models should remain an important tool for functional genomics and will serve to set standards for improvements. Technological fixes and appropriate experimental design can minimize the effects of such artifacts. In fact, labs, facilities, and bioinformatics research centers conducting microarray experiments are making good progress in developing both technological fixes and bioinformatics approaches for quality control, including spot location effects and dye effects (e.g., Brown et al. 2001; Wang et al. 2001; P. Tonellato, pers. comm.). Therefore, our statistical considerations are developed for application where experimental design has been appropriate (e.g., dye is not confounded with sample group), for example, with study design or with technology in which measurements are made without the complete confounding of treatment effect with other unwanted sources of variability.
Idiosyncratic differences among methods of analysis make comparisons difficult. A potential second bottleneck to discovery is the failure to understand and to capitalize on the relationships among the methods. For example, some of the approaches for finding differentially expressed genes have been described as ‘alternatives to’ or have been ‘compared to’ cluster analysis. Moreover, the performance efficiencies of the variety of approaches applied to date have not been objectively compared. Obviously, therefore, no objective criterion for selecting among the available methods has been widely adopted. Simple statistical approaches applied to date fail to incorporate classification accuracy as a criterion for finding biomarkers (Xiong et al. 2001). In this paper, we explore the possibility that cluster analysis in any form (e.g., hierarchical clustering or support vector machines) can be used in conjunction with any test (e.g., familiar classical statistical analyses) in a way that incorporates classification accuracy into the criterion for finding differentially expressed genes. We describe an approach to analysis that combines classification algorithms, classical (Neyman-Pearson) statistics (usually used for classical hypothesis testing), and elements of machine learning to provide a coherent framework for the analysis of genome-scale gene expression data sets. Our approach uses the combined criteria of (1) the ranking of gene by degree of significance of an appropriate (pooled variance) test statistic, and (2) classification accuracy for selecting biomarkers. Only genes with expression profiles that together provide 100% accurate prediction of group membership despite perturbation by sample jackknifing are included. The algorithm learns first at which statistical threshold such a gene set might exist, eliminating the arbitrariness associated with setting a threshold of statistical significance. This feature of the approach also minimizes the effect of the normality assumption of our t-test. This feature seems essential, given that the genome biology behind the data set should determine the number of genes that are in fact biologically important, instead of an arbitrary but usually accepted α level of, say, α = 0.05. Although the human genome is large (estimated to have ∼40,000 genes), the proportion of genes that will actually differ between any two tissue sample sets (true positives) will vary with the biological differences between the two sample sets. It seems unreasonable, therefore, to expect that researchers comparing very different tissue types will adopt a significance threshold that is the same as that adopted by researchers comparing very similar tissue types, for example, tissue-of-origin sample and precancerous neoplasm samples.
RESULTS
Predicting Chemotherapy Response in Acute Myeloid Leukemia
Acute myeloid leukemia (AML) can be readily distinguished from acute lymphoid leukemia (ALL) using gene expression patterns of 6817 genes (Golub et al. 1999). The Golub et al. (1999) classification of AML and ALL is easily reproducible with almost any method. Although the differentiation of AML and ALL is straightforward, cluster analysis of all the genes does not predict therapy outcome within AML samples only (success or failure) with the anthracycline-cytarabine chemotherapy regimen (Fig. 1). Golub et al. (1999) attempted an approach called “neighborhood analysis” in which genes with expression distributions between groups most closely matched (correlated) with the ideal cases, that is, (1,1,1,1,0,0,0,0) and (0,0,0,0,1,1,1,1). However, they reported a negative result in deriving a predictive classification of therapy outcome. They attributed this outcome in part to small sample size. More recently, Thomas et al. (2001) developed a Z-test approach that finds genes that are differentially expressed between two groups and applied it to both the AML/ALL dichotomy and the success and failure of chemotherapy among AML patients. Their statistical approach revealed 24 genes that are most differentially expressed between patients who positively responded to chemotherapy (successes) and those who did not (failures). However, this gene set does not constitute a predictive class of genes that can be used to predict therapy outcome via average linking cluster analysis when analyzed using the Pearson correlation coefficient, log-transformed or not (Fig. 2). Moreover, in a recent national competition that focused on the analysis of this data set, nearly all researchers reported the ability to distinguish ALL from AML samples, some with remarkably few genes. This is evidently due to the fact that all methods find one gene that clearly delineates ALL from AML. None, however, reported finding a gene subset that could predict therapy outcome (success vs. failure; see reports and outline of CAMDA ‘00 at http://bioinformatics.duke.edu/CAMDA/CAMDA00/abstracts.asp).
Figure 1.

Hierarchical clustering of AML samples using the full 6817 gene set. This classification does not predict success or failure of chemotherapy, and no published results to date have demonstrated that any gene subset can accurately predict the therapy outcome for these samples.
Figure 2.

Hierarchical clustering of AML samples using the gene set identified by Thomas et al. (2001) as those exhibiting the most significant difference between successes and failures (no transformation, distance = 1 − Pearson correlation coefficient). This gene set fails to distinguish between successes and failures when the data are log-transformed as well (not shown).
In the comparison of AML success versus AML failure, the largest initial MDSS contained the top 44 genes. The success group and failure group are clearly separated by a node on the average linkage clustering diagram using the top four to the top 44 genes as biomarkers. The overall maximum difference subset for the AML success/failure bipartition (after jackknifing the samples) consists of 12 genes (Jackknife Index = 100; Table 1). The resulting hierarchical classification of the AML samples with known therapy outcomes (seven successes and eight failures) shows failures and successes cleanly partitioned into two groups separated by a single internode (Fig. 3). The MDSS and the classification were derived using the Maximum Difference Subset Web Tool, part of the UMASS Lowell Bioinformatics Web Tool Collection (http://bioinformatics.duke.edu/CAMDA/CAMDA00/abstracts.asp). This tool calculates the Student’s test statistic with the pooled variance error term (Eq. 2) for each gene, ranks the genes according to the achieved significance level, and can provide a hierarchical cluster diagram based on Pearson's correlation coefficient (specifically, 1–r) for any specified number of genes. In the cluster analysis of the subset, the data are not further filtered, equal weights are assumed for both genes and samples, and both genes and samples are not normalized. The placement of all successes and all failures in the two separate groups demonstrates that predictions based on this set of diagnostic genes for each sample, if individually unknown, would be 100% correct (15/15). Only five of the genes in the top 24 reported by Thomas et al. (2001) are also found in our overall MDSS gene set (PIG-B, AUTOANTIGEN PM SCL, BPI Bactericidal/permeability increasing protein, HoxA9, and Caspase 8 [MACH α-2 protein]). All of the genes in our predictive gene set are significantly different between the two groups under the t-test, whereas the differences for only some of these were found to be significant by Thomas et al. (2001).
Table 1.
Overall MDSS Ranked by Jacknife Index
| LW Index Scorea | Therapy outcome negative mean | Therapy outcome positive mean | tb | Gene name |
| 100 | 1050 | 504 | 4.69891859 | GB_DEF_=_Homeodomain_protein_HoxA9_mRNA |
| 100 | 98.875 | 280.285714 | −4.4262314 | PIG-B |
| 100 | 11.625 | 162.285714 | −4.2729433 | MACH-alpha-2_protein |
| 100 | 240.875 | 42.5714286 | 4.07696448 | BPI_Bactericidal/permeability-increasing_protein |
| 100 | 198.625 | 394.857143 | −3.9910238 | AUTOANTIGEN_PM-SCL |
| 100 | 33.25 | −17.285714 | 3.87914326 | ERGIC-53_PROTEIN_PRECURSOR |
| 100 | 545.125 | 1052 | −3.8529096 | NUCLEAR_PORE_COMPLEX_PROTEIN_NUP214 |
| 100 | 1692.625 | 1013.14286 | 3.77170637 | GB_DEF_=_ODF2_(allele_2)_gene_for_outer_dense_fiber_protein |
| 100 | 189 | 480.857143 | −3.6855932 | D9_splice_variant_A_mRNA |
| 100 | −206.375 | 379.428571 | −3.6795036 | GB_DEF_=_5′_mRNA_of_PECAM-1_molecule |
| 100 | −18.625 | −314.57143 | 3.61274986 | Af-6_(Gb:U02478) |
| 100 | −3.125 | −69.857143 | 3.53211147 | MELANOMA-ASSOCIATED_ANTIGEN_XP |
| 93 | −11.875 | −62.428571 | 3.45936075 | RDX_Radixin |
| 80 | 349.125 | 76 | 3.43581421 | YPT3_mRNA |
| 80 | 802.25 | 303.142857 | 3.28595329 | Heat_shock_protein_HSP72_homolog_[human,_thyroid_associated_ ophthalmopathy_patient,_mRNA_Partial,_450_nt] |
| 80 | −70.625 | −156.28571 | 3.47358655 | Connexin_26_(GJB2)_mRNA |
| 33–66 | 16 genes | |||
| 26 | 16 genes | |||
| 13 | 16 genes | |||
| 6.66 | 177 genes |
Lyons-Weiler Jacknife Index is a simple jackknife score (CJ/NJ*100).
t is the studentized t-test with the pooled variance error term (Eqn 2).
CJ, # times the gene is found in the MDSS of size N.
NJ, # of jacknife iterations (# samples).
Figure 3.

Average-linkage hierarchical cluster diagram of the tumors associated with success and failure of chemotherapy using the 12 genes in the overall MDSS (no transformation, distance = 1 − Pearson correlation coefficient). This gene set fails to distinguish between successes and failures when the data are log-transformed (data not shown). The hierarchical classification shows a clear distinction between successes and failures.
DISCUSSION
Biological Significance of the Overall MDSS
It is remarkable that five of the overall MDSS genes in the overall MDSS encode proteins that modulate membrane transport. A number of the genes in the overall MDSS list that are involved in membrane transport also have functions that are highly relevant to leukemia. In this discussion, ‘-F’ symbolizes that the mean expression in the failure group was less than that found in the success group, and ‘+F’ means that the mean expression in the failure group was greater than that found in the success group.
HoxA9
A translocation associated with AML has been shown to fuse a nuclear pore complex gene (−F) and HoxA9 (+F; Borrow et al. 1996). Double HoxA9 (+F) knock-out mice show 30%–40% reductions in total leukocytes and lymphocytes and a reduced granulocytic response to granulocyte colony-stimulating factor (Lawrence et al. 1997). Overexpression of HoxA9 would presumably result in an overproduction of leukocytes and lymphocytes; indeed, the injection of retrovirally engineered primary bone marrow cells that overexpress both HoxA9 and Meis1 into mice induces AML within three months (Kroon et al. 1998). Golub et al. (1999) found that HoxA9 had the highest correlation to their ideal distribution, but did not find a gene set that could predict chemotherapy success and failure. Thomas et al. (2001) suspected that, out of all the genes in the original data, HoxA9 could predict success and failure of chemotherapy, but were confronted with a lack of statistical significance in their measure of the difference between successes and failures (P < 0.1). They also reported that class prediction using HoxA9 alone failed to achieve 100% accuracy.
PIG-B
PIG-B (phosphatidylinositol glycan complementation class B; −F) is involved in the transfer of the third mannose of the GPI anchor (Takahashi et al. 1996). Nocturnal hemoglobinuria is caused by a mutation at the PIG-A locus (Bessler et al. 1994), and 5%–15% of such patients develop leukemia, invariably AML (Harris et al. 1999). Underexpression of PIG-B would presumably result in low GPI anchor synthesis, and our results strongly suggest an important pharmacokinetic role for PIG-B.
BPI Protein
The BPI protein (+F) is produced within the granules of neutrophiles (polymorphonuclear leukocytes) of mammals (Beamer et al. 1997). Its sequence is identical to a 57-kD cationic antimicrobial protein (CAP57), which is found to be expressed as early as the promyelocyte (Pereira et al. 1990). Human polymorphonuclear leukocytes are used as a source of the antigen (Charles et al. 1989), and the BPI protein is a target of the antineutrophil cytoplasmic autoantibodies (Schultz et al. 2001). This means that an excess of BPI will saturate and neutralize available antineutrophil cytoplasmic autoantibodies, suggesting that the excess of BPI may be responsible for slowing the rate of immune system-regulated apoptosis, further increasing the number of excess leukocytes. The relative overexpression of autoantigen PM SCL (−F) in successes may in part compensate for any excess of BPI. This suggests that indirect modulation (modulation of regulators) could provide an effective route to treatment.
Caspase-8 (MACH α2)
Caspases are important factors in apoptosis (Grutter 2000; Dorrie et al. 2001; Ravandi et al. 2001) through the CD95 signaling pathway. Decrease in caspase-8 (−F) expression is associated with progression and resistance to apoptosis in neuroblastomas (Hopkins-Donaldson et al. 2000). Caspase-8 is involved in mitochondrially induced apoptosis and, like BPI, is important for membrane permeability. Apoptosis in AML and ALL may be delayed if caspases 1 and 3 are underexpressed (Faderl and Estrov 2001). Resveratrol, which modulates a related gene, caspase-9, and depolarizes the mitochondrial membrane (Dorrie et al. 2001), provides a possible alternative treatment for the patients whose prognosis with anthracyclines is negative. Our results suggest a combined therapy of Resveratrol and anthracycline.
Our results also suggest that factors involved in both the birth and death of leukocytes and lymphocytes that are responsible for the unbalanced budget of these cells, the very definition of leukemia, are important determinants not only for the diagnosis of the disease, but also for predictive prognosis. These results confirm the importance of these 12 genes for potential treatments via gene expression modulation. After further laboratory validation of these transcript biomarkers, randomized clinical studies of modulators of these genes are needed, especially given the high degree of correspondence of genes known to be significant to the development and treatment of AML through experimental results we have cited and those found in our predictive gene set.
Predictions Based on Samples of Unknown Outcome
Although a number of criteria for making predictions using potentially diagnostic gene sets have been proposed, no standard criterion for making predictions has emerged. We propose that predictions based on class label be used in the unambiguous case. An unambiguous prediction is made when a sample clusters within a particular class (i.e., where both internodes lead to nodes to which other members of that class are found). This simple, clearly defined prediction method allows one to use the very same test in the class prediction application that was used to discover the set of genes for the prediction. It also allows for cases to be identified where no prediction is to be made; for example, when an unknown clusters between and not within two distinct groups (e.g., drug responders vs. no effects or ill effects), the approach is said to decline on making a class prediction for that sample.
In the original study, the therapy outcomes of 10 additional samples in the original data set were unknown. We included all of the 10 remaining AML samples in a hierarchical clustering analysis to predict their response to the anthracycline-cytarabine chemotherapy regime. Class prediction using hierarchical clustering using only the 12 biomarkers we identified places all but two samples of unknown clinical outcome in a partition containing the successes (Fig. 4). The remaining two samples (AML60 and AML66) cluster between the success and failures (i.e., are not nested within either cluster). Thus, using this gene set, MDSS opts to not make a prediction for two of the 10 samples with unknown outcome. This type of outcome should be expected because some unknowns may not fall into one of two predefined classes. Some samples may be in transition between two predefined sample groups in the progression of a disease, whereas others may represent a third (undiscovered) class. In application, such samples would require further study for prognosis. It is notable that all unknowns cluster clearly within the successes when the MACH α2 protein gene is excluded.
Figure 4.

Predicted clinical outcome of the AML cases cited by Golub et al. (1999) as ‘unknowns’. Most cases cluster (average linkage) within the ‘therapy outcome = success’ sample group. The method opts to not make a prediction for two samples because they fall between the two classes and are not nested within either cluster. This important feature of the method will allow the identifications of cases that are outside of the classification problem, such as those that belong to a third, unidentified class.
Extending MDSS to the Multiple Classification Problem
Any method for detecting differentially expressed genes between two groups can be extended to the problem of finding genes with unique expression patterns given multiple types and subtypes. In fact, if a strictly binary classification is accepted, the two problems are equivalent; each group in a binary tree represents a bipartition. We note, however, that many studies make a comparison between all normal samples and all tumor samples. Tumor subtypes are not strictly hierarchically related; that is, in most cases, each tumor subtype derives directly and uniquely from normal tissue. In these instances, the most appropriate comparison is all normal samples versus all samples of one tumor subtype. This not only dramatically simplifies analysis and interpretation, it prevents an unnecessarily confounded analysis.
On the Utility of the Jackknife: Reducing Overfitting
Most methods approach the problem of finding important genes by looking for some attribute(s) in the distribution of relative expression values that seem to indicate that the gene could, in principle, be diagnostic (predictive). Methods that evidently succeed at making predictions with one data set may be susceptible to overfitting, that is, finding genes that predict well for the training data set—but which lack external validity (false positives). Overfitting is only really an absolute problem if the data, or much of the data, are random, that is, if there is no biological signal in the change in gene expression patterns. In the analysis of gene expression data, most of the thousands of genes may not be expressed differentially—but with low replication and with few samples, the possibility of overfitting seems high for all methods.
Overfitting is at one level a problem associated with false positives. One problem with the claim that a given method is subject to ‘overfitting’ stems from the fact that the measure of ‘overfitting’ itself relies on a negative (failed) outcome on independent prediction(s) made using the features identified as predictive. This is an impossible measure to make with empirical data when the true class membership is somewhat unknown (especially due to tissue heterogeneity).
The general idea of ‘overfitting’ is also made complex by the fact that it presumes that the classifier operator used is capable of making the right prediction given a set of informative features. It must be remembered that the method for finding informative features is often independent or in some way different from the method used as a classifier, and in reality all such methods have limitations in predictive utility.
In the usual application of ‘leave-one-out’ jackknife validation, samples are removed, one at a time, and the predictive features are found using a test applied to only the remaining n−1 samples. These features are then applied to make a prediction on the placement of the sample left out. The procedure is repeated for all samples, and a score (usually the proportion of correct predictions) is tallied. Leave-one-out validation uses n−1 samples as a training set, predicts on the sample left out, and the score of 1−P (correct inference) leads to a classification error rate. In our application of the jackknife, its use is turned around to identify those features (genes) whose inclusion in the ‘overall MDSS’ is dependent on which samples are included in the analysis. As in leave-one-out validation, samples are removed, one at a time, and the test is applied to the remaining n−1 samples. Instead of using the result to tally an error rate on the basis of correct predictions, this application of the jackknife compares the feature sets determined for each jackknife iteration. The features (genes) common to all n feature sets are taken as a group as the overall MDSS. The motivation for this application of the jackknife is to identify and remove as many false positives as possible, and to identify features that will provide the most accurate predictions for all samples for which predictions are sought. Procedures that divide a data set into a training set and a test set reduce the power of the test for differentially expressed genes, such as cross-fold validation, can be used to create conservative classification error estimates. Such approaches can nevertheless be applied to any test + classifier operator combination, used with or without MDSS.
MDSS helps reduce the probability of overfitting by the use of the jackknife—not for leave-one-out-validation, but to reduce, as much as possible, the false positive rate. The jackknife is used by MDSS to capitalize on information about the feature set (significant gene list) instead. By identifying genes whose predictive utility is sensitive to study design, our approach should find outliers and generally reduce the false positive rate. MDSS leads to a small but biologically important list of genes, that is, a partial but highly accurate glimpse of changes in gene expression.
In the analysis of the AML data, the initial MDSS (44 genes) was determined using all 15 of the AML samples with known therapy outcome. This initial gene set is the largest ranked gene set found with the highest correct placement of samples. When 44 is adopted as the cut-off number during the jackknife, this total number of genes found to be significant when each sample is left out, one at a time, is 240. The bulk of these genes (177) are included in the MDSS as a result of leaving one of the samples out, and are thus represented in the MDSS only once out of the 15 perturbations. The Jackknife Index aids immensely in identifying which potential biomarkers are immune to study design (which samples are included or excluded). Misleading but apparently useful biomarkers that rank high in one simple analysis (say, with all samples included) can be identified and excluded due to low general utility, revealed by the Jackknife Index. This step seems essential given that decreases in the number of false positive candidates going into the drug discovery pipeline would increase the rate at which useful treatments are discovered. We therefore recommend that the Jackknife Index be adopted as a standard step in determining differentially expressed genes, whichever of the myriad of measures is adopted.
Supervised versus Unsupervised MDSS
The MDSS approach can in principle be conducted either as a partially supervised or completely automated (unsupervised) approach. Specifically, researchers can search for the largest threshold value of the test measure for which a classification analysis returns a classification in which the sample groups are clearly delineated (TB) ‘manually’ (i.e., trial-and-error), or a program could search all classifications derived using M of M genes, M−1 genes, M−2 genes… until all levels were characterized. This should minimize the loss of true positives (increase sensitivity), and the jackknife should work to reduce false positives. This aspect of the problem is solved in linear time, and thus its computational cost is not unreasonable.
Simultaneous Use of Multiple Biomarkers
Information useful to prognosis and diagnosis on individual biomarkers is used by combining these markers in a single predictive set. There is an immense number of ways to combine the mutual information and covariation among sets of validated biomarkers, and an immense number of ways to make predictions using this information. The algorithms used in this report (t-test, pairwise distance calculation, and hierarchical clustering) only represent the simplest and most popular approaches. Much research is needed to find optimal algorithms for these inferences before any such approaches can be adopted for clinical use.
On Correcting for Multiple Comparisons
Under classical statistical inference, the acceptable false positive rate is equal to α. Our outcome-driven approach inverts the problem by incorporating classification accuracy into the determination of the MDSS. The approach thereby (incidentally) learns the significance level that returns the user-specified bipartition. Therefore, the problem of multiple comparisons is an undefined problem in our application. In fact, even if a researcher wished to perform a Bonferroni-type correction, this would in no way influence the outcome of the analysis. We therefore recommend that users of this approach report the number of genes in the gene set that exhibits accurate classification power instead of the associated t, α, or p.
METHODS
The MDSS Algorithm
Differences in expression measured by a test can be checked with a second criterion: the predictive utility of gene sets found to be different. The goal of the maximum difference subset (MDSS) algorithm is to find genes expression differences that are not only significant, but that also carry information useful to the classification applications. The MDSS algorithm employs the following steps, described in the general form (for any test and any classifier):
Calculate a test (e.g., test statistic or S:N ratio) for each gene (spot) in a comparison of sample groups A and B (e.g., normal vs. tumor).
Rank the genes in descending order according to the magnitude of that measure.
Find the largest threshold value of that measure for which a classification analysis returns a classification in which the sample groups are clearly delineated (TB). For example, if the test employed in Step 1 is a t-test, find the largest significance level (α) where the classifier succeeds in discriminating between the two sample groups. This gene set is called the ‘initial MDSS.’
Jackknife out individual samples and store the list of genes that are significant beyond threshold TB. Adjust the degrees of freedom due to the exclusion of one sample as needed. Each time a sample is removed, an individual MDSS list is created.
Identify the subset of genes common to all individual MDSSs. This gene set is comprised of genes that are not only significantly different between the two; they also pass, as a set, the criterion of predictive utility. This gene set is called the ‘overall MDSS’.
Verify that the overall MDSS returns the expected classification (e.g., a hierarchical cluster diagram with a bipartition between sample groups A and B). If this does not occur, adjust (increase or decrease) the threshold value set at Step 3 and begin again.
Each and any outcome is possible here; that is, the overall MDSS may contain all the genes in a data set, or, if no genes are both statistically different and predictive as a set, the MDSS set may be empty. If the MDSS fails to find a gene set that predicts perfectly on the samples, the conclusion is that the data are insufficient for the classification problem posed using the selected test and the selected classifier operator.
Fortunately, these steps are not terribly computationally complex. These steps, including the generation of a hierarchical classification, are automated in a simple Gene Expression Data Analysis web tool (http://bioinformatics.upmc.edu/GEDA.html). A number of options are available for clustering (pairwise distance, clustering algorithm) and for the test (nfold thresholding vs. t-test vs. Mann-Whitney U-test). Given means from two groups (m1, m2) of sample sizes n1 and n2 and variance s12, s22, the pooled variance test statistic
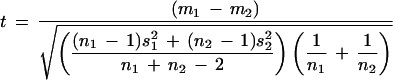 |
is appropriate when the sample sizes differ between groups. Nonparametric statistical analyses such as Spearman's rank correlation or the Mann-Whitney U-test could be used instead of the t-test; we prefer to use the parametric test given its simplicity and relative ease of implementation. A simulation study comparing these and other tests is underway.
WEB SITE REFERENCES
http://bioinformatics.upmc.edu/GEDA.html; A browser interface for the analysis of expression of global gene expression patterns.
http://www.camda.duke.edu/CAMDA00/abstracts.asp; A listing of abstracts for the papers presented at the CAMDA 2000 meeting (Critical Assessment of Microarray Data Analysis 2000, December 18–19, 2000 at Duke University in Durham, N.C.).
Acknowledgments
We thank Susan Braunhut, Kenneth Marx, Thomas Shea, Lee Jones, and Chris Hassett for useful discussions on the topics in this report, and two anonymous reviewers for their helpful comments. This research was supported by research funds from the University of Massachusetts, Lowell and from the Hassett Family. The support from Chris Hassett, Drs. Robert Tamarin, Robert Wagner, and William Hogan for the UMASS Lowell Bioinformatics Initiative and the UMASS Lowell Center for Bioinformatics and Computational Biology during the years 2000–2002 is deeply appreciated.
The publication costs of this article were defrayed in part by payment of page charges. This article must therefore be hereby marked “advertisement” in accordance with 18 USC section 1734 solely to indicate this fact.
E-MAIL lyonsweilerj@msx.upmc.edu; FAX (412) 647-5380.
Article and publication are at http://www.genome.org/cgi/doi/10.1101/gr.104003.
REFERENCES
- 1.Alizadeh A., Eisen, M., Davis, R.E., Ma, C., Sabet, H., Tran, T., Powell, J.I., Yang, L., Marti, G.E., Moore, D.T., et al. 2000. Distinct types of diffuse large B-cell lymphoma identified by gene expression profiling. Nature 403: 503-511. [DOI] [PubMed] [Google Scholar]
- 2.Alon U., Barkai, N., Notterman, D.A., Gish, K., Ybarra, S., Mack, D., and Levine, A.J. 2000. Broad patterns of gene expression revealed by clustering analysis of tumor and normal colon tissues probed by oligonucleotide arrays. Proc. Natl. Acad. Sci. 96: 6745-6750. [DOI] [PMC free article] [PubMed] [Google Scholar]
- 3.Alter O., Brown, P.O., and Botstein, D. 2000. Singular value decomposition for genome-wide expression data processing and modeling. Proc. Natl. Acad. Sci. 97: 10101-10106. [DOI] [PMC free article] [PubMed] [Google Scholar]
- 4.Baggerly K.A., Coombes, K.R., Hess, K.R., Stivers, D.S., Abruzzo, L.V., and Zhang, W. 2001. Identifying differentially expressed genes in cDNA microarray experiments. J. Comp. Biol. 8: 639-659. [DOI] [PubMed] [Google Scholar]
- 5.Baldi P. and Long, A.D. 2001. A Bayesian framework for the analysis of microarray expression data: Regularized t-test and statistical inferences of gene changes. Bioinformatics 17: 509-519. [DOI] [PubMed] [Google Scholar]
- 6.Beamer L.J., Carroll, S.F., and Eisenberg, D. 1997. Crystal structure of human BPI and two bound phospholipids at 2.4Å resolution. Science 276: 1861-1864. [DOI] [PubMed] [Google Scholar]
- 7.Bessler M., Mason, P.J., Hillmen, P., Miyata, T., Yamada, N., Takeda, J., Luzzatto, L., and Kinoshita, T. 1994. Paroxysmal nocturnal haemoglobinuria (PNH) is caused by somatic mutations in the PIG-A gene. EMBO J. 1: 110-117. [DOI] [PMC free article] [PubMed] [Google Scholar]
- 8.Bittner M., Meltzer, P., Chen, Y., Jiang, Y., Seftor, E., Hendrix, M., Radmacher, M., Simon, R., Yakhini, Z., Ben-Dor, A., et al. 2000. Molecular classification of cutaneous malignant melanoma by gene expression profiling. Nature 406: 536-540. [DOI] [PubMed] [Google Scholar]
- 9.Borrow J., Shearman, A.M., Stanton, V.P., Jr., Becher, R., Collins, T., Williams, A.J., Dube, I., Katz, F., Kwong, Y.L., Morris, C., et al. 1996. The t(7;11)(p15;p15) translocation in acute myeloid leukaemia fuses the genes for nucleoporin NUP98 and class I homeoprotein HoxA9. Nat. Genet. 12: 159-167. [DOI] [PubMed] [Google Scholar]
- 10.Brown C.S., Goodwin, P.C., and Sorger, P.K. 2001. Image metrics in the statistical analysis of DNA microarray data. Proc. Natl. Acad. Sci. 98: 8944-8949. [DOI] [PMC free article] [PubMed] [Google Scholar]
- 11.Charles L.A., Falk, R.J., and Jennette, J.C. 1989. Reactivity of antineutrophil cytoplasmic autoantibodies with HL-60 cells. Clin. Immunol. Immunopathol. 53: 243-253. [DOI] [PubMed] [Google Scholar]
- 12.DeRisi J.L., Iyer, V.R., and Brown, P.O. 1997. Exploring the metabolic and genetic control of gene expression on a genomic scale. Science 278: 680-686. [DOI] [PubMed] [Google Scholar]
- 13.Dorrie J., Gerauer, H., Wachter, Y., and Zunino, S.J. 2001. Resveratrol induces extensive apoptosis by depolarizing mitochondrial membranes and activating caspase-9 in acute lymphoblastic leukemia cells. Cancer Res. 61: 4731-4739. [PubMed] [Google Scholar]
- 14.Eisen M.B., Spellman, P.T., Brown, P.O., and Botstein, D. 1998. Cluster analysis and display of genome-wide expression patterns. Proc. Natl. Acad. Sci. 95: 14863-14868. [DOI] [PMC free article] [PubMed] [Google Scholar]
- 15.Faderl S. and Estrov, Z. 2001. The clinical significance of caspase regulation in acute leukemia. Leuk. Lymphoma 40: 471-481. [DOI] [PubMed] [Google Scholar]
- 16.Fellenberg K., Hauser, N.C., Brors, B., Neutzner, A., Hohheisel, J.D., and Vingron, M. 2001. Correspondence analysis applied to microarray data. Proc. Natl. Acad. Sci. 98: 10781-10786. [DOI] [PMC free article] [PubMed] [Google Scholar]
- 17.Furey T.S., Cristianini, N., Duffy, N., Bednarski, D.W., Schummer, M., and Haussler, D. 2000. Support vector machine classification and validation of cancer tissue samples using microarray expression data. Bioinformatics 16: 906-914. [DOI] [PubMed] [Google Scholar]
- 18.Garber M.E., Troyanskaya, O.G., Schluens, K., Petersen, S., Thaesler, Z., Pacyna-Gengelbach, M., van de Rijn, M., Rosen, G.D., Perou, C.M., Whyte, R.I., et al. 2001. Diversity of gene expression in adenocarcinoma of the lung. Proc. Natl. Acad. Sci. 98: 13784-13789. [DOI] [PMC free article] [PubMed] [Google Scholar]
- 19.Golub T.R., Slonim, D.K., Tamayo, P., Huard, C., Gaasenbeek, M., Mesirov, J.P., Coller, H., Loh, M.L., Downing, J.R., Caligiuri, M.A., et al. 1999. Molecular classification of cancer: Class discovery and class prediction by gene expression monitoring. Science 286: 531-537. [DOI] [PubMed] [Google Scholar]
- 20.Grutter M.G. 2000. Caspases: Key players in programmed cell death. Curr. Opin. Struct. Biol. 10: 649-655. [DOI] [PubMed] [Google Scholar]
- 21.Harris J.W., Koscick, R., Lazarus, H.M., Eshleman, J.R., and Medof, M.E. 1999. Leukemia arising out of paroxysmal nocturnal hemoglobinuria. Leuk. Lymphoma 32: 401-426. [DOI] [PubMed] [Google Scholar]
- 22.Hedenfalk I., Duggan, D., Chen, Y., Radmacher, M., Bittner, M., Simon, R., Meltzer, P., Gusterson, B., Esteller, M., Kallioniemi, O.P., et al. 2001. Gene-expression profiles in hereditary breast cancer. N. Engl. J. Med. 344: 601-602. [DOI] [PubMed] [Google Scholar]
- 23.Hippo Y., Taniguchi, H., Tsutsumi, S., Machida, N., Chong, J.M., Fukayama, M., Kodama, T., and Aburatani, H. 2002. Global gene expression analysis of gastric cancer by oligonucleotide microarrays. Cancer Res. 62: 233-240. [PubMed] [Google Scholar]
- 24.Hopkins-Donaldson S., Bodmer, J.L., Bourloud, K.B., Brognara, C.B., Tschopp, J., and Gross, N. 2000. Loss of caspase-8 expression in neuroblastoma is related to malignancy and resistance to TRAIL-induced apoptosis. Med. Pediatr. Oncol. 35: 608-611. [DOI] [PubMed] [Google Scholar]
- 25.Kerr M.K., Martin, M., and Churchill, G.A. 2000. Analysis of variance for gene expression microarray data. J. Comp. Biol. 7: 819-37. [DOI] [PubMed] [Google Scholar]
- 26.Kroon E., Krosl, J., Thorsteinsdottir, U., Baban, S., Buchberg, A.M., and Sauvageau, G. 1998. Hoxa9 transforms primary bone marrow cells through specific collaboration with Meis1α but not Pbx1β. EMBO J. 17: 3714-3725. [DOI] [PMC free article] [PubMed] [Google Scholar]
- 27.Lawrence H.J., Helgason, C.D., Sauvageau, G., Fong, S., Izon, D.J., Humphries, R.K., and Largman, C. 1997. Mice bearing a targeted interruption of the homeobox gene HoxA9 have defects in myeloid, erythroid, and lymphoid hematopoiesis. Blood 89: 1922-1930. [PubMed] [Google Scholar]
- 28.Pereira H.A., Spitznagel, J.K., Winton, E.F., Shafer, W.M., Martin, L.E., Guzman, G.S., Pohl, J., Scott, R.W., Marra, M.N., and Kinkade, J.M., Jr. 1990. The ontogeny of a 57-Kd cationic antimicrobial protein of human polymorphonuclear leukocytes: Localization to a novel granule population. Blood 76: 825-834. [PubMed] [Google Scholar]
- 29.Perou C.M., Sorlie, T., Eisen, M.B., van de Rijn, M., Jeffrey, S.S., Rees, C.A., Pollack, J.R., Ross, D.T., Johnsen, H., Akslen, L.A., et al. 2000. Molecular portraits of human breast tumours. Nature 406: 747-752. [DOI] [PubMed] [Google Scholar]
- 30.Ravandi F., Kantarjian, H.M., Talpaz, M., O'Brien, S., Faderl, S., Giles, F.J., Thomas, D., Cortes, J., Andreeff, M., Estrov, Z., et al. 2001. Expression of apoptosis proteins in chronic myelogenous leukemia: Associations and significance. Cancer 91: 1964-1972. [DOI] [PubMed] [Google Scholar]
- 31.Schena M., Shalon, D., Davis, R.W., and Brown, P.O. 1995. Quantitative monitoring of gene expression patterns with a complimentary DNA microarray. Science 270: 467-470. [DOI] [PubMed] [Google Scholar]
- 32.Schultz H., Weiss, J., Carroll, S.F., and Gross, W.L. 2001. The endotoxin-binding bactericidal/permeability-increasing protein (BPI): A target antigen of autoantibodies. J. Leukoc. Biol. 69: 505-512. [PubMed] [Google Scholar]
- 33.Shailubhai K., Yu, H.H., Karunanandaa, K., Wang, J.Y., Eber, S.L., Wang, Y., Joo, N.S., Kim, H.D., Miedema, B.W., Abbas, S.Z., et al. 2000. Uroguanylin treatment suppresses polyp formation in the Apc Min/1 mouse and induces apoptosis in human colon adenocarcinoma cells via cyclic GMP. Cancer Res. 60: 5151-5157. [PubMed] [Google Scholar]
- 34.Takahashi M., Inoue, N., Ohishi, K., Maeda, Y., Nakamura, N., Endo, Y., Fujita, T., Takeda, J., and Kinoshita, T. 1996. PIG-B, a membrane protein of the endoplasmic reticulum with a large lumenal domain, is involved in transferring the third mannose of the GPI anchor. EMBO J. 15: 4254-4261. [PMC free article] [PubMed] [Google Scholar]
- 35.Tausch R.J., Charlet, D.A., Weixelman, D.A., and Zamudio, D.C. 1996. Patterns of ordination and classification instability from changes in data input order. J. Veg. Sci. 6: 897-902. [Google Scholar]
- 36.Thomas J.G., Olson, J.M., Tapscott, S.J., and Zhao, L-P. 2001. An efficient and robust statistical modeling approach to discover differentially expressed genes using genomic expression profiles. Genome Res. 11: 1227-1236. [DOI] [PMC free article] [PubMed] [Google Scholar]
- 37.Wang X., Ghosh, S., and Guo, S-W. 2001. Quantitative quality control in microarray image processing and data acquisition. Nucleic Acids Res. 29: E75. [DOI] [PMC free article] [PubMed] [Google Scholar]
- 38.Welsh J.B., Zarrinker, P.P., Sapinoso, L.M., Kern, S.G., Behling, C.A., Monk, B.J., Lockhart, D.J., and Hampton, G.M. 2001. Analysis of gene expression profiles in normal and neoplastic ovarian tissue samples candidate molecular markers of epithelial ovarian cancer. Proc. Natl. Acad. Sci. 98: 1176-1181. [DOI] [PMC free article] [PubMed] [Google Scholar]
- 39.Wolfinger R.D., Gibson, G., Wolfinger, E.D., Bennett, L., Hamadeh, H., Bushel, P., Afshari, C., and Paules, R.S. 2001. Assessing gene significance from cDNA microarray expression data via mixed models. J. Comput. Biol. 8: 625-637. [DOI] [PubMed] [Google Scholar]
- 40.Xiong M., Fang, X., and Zhao, J. 2001. Biomarker identification by feature wrappers. Genome Res. 11: 1878-1887. [DOI] [PMC free article] [PubMed] [Google Scholar]
- 41.Yeang C-H., Ramaswamy, S., Tamayo, P., Mukherjee, S., Rifkin, R.M., Angelo, M., Reich, M., Lander, E., Mesirov, J., and Golub, T. 2001. Molecular classification of multiple tumor types. Bioinformatics 17: 316-322. [DOI] [PubMed] [Google Scholar]