Abstract
The gene predictions and accompanying functional assignments resulting from the sequencing and annotation of a genome represent hypotheses that can be tested and used to develop a more complete understanding of the organism and its biology. In the model plant Arabidopsis thaliana, we developed a novel approach to constructing whole-genome microarrays based on PCR amplification of the 3′ ends of each predicted gene from genomic DNA, and constructed an array representing more than 94% of the predicted genes and pseudogenes on chromosome 2. With this array, we examined various tissues and physiological conditions, providing expression-based validation for 84% of the gene predictions and providing clues as to the functions of many predicted genes. Further, by examining the distribution of expression along the physical chromosome, we were able to identify a region of repressed transcription that may represent a previously undescribed heterochromatic region.
[The sequence data from this study have been submitted to ArrayExpress under accession nos.: For the Array Design, A-TIGR-2. For the three subgroups of experiments: AbioticStress, E-TIGR-2; BioticStress, E-TIGR-3; Tissues, E-TIGR-4.]
The sequencing of the whole Arabidopsis genome by an international consortium, Arabidopsis Genome Initiative (AGI), began in 1996. Chromosomes 2 and 4 were published in December 1999 (Lin et al. 1999; Mayer et al. 1999), and the remainder of the genome, chromosomes 1, 3, and 5, was completed and published in the winter of 2000 (Arabidopsis Genome Initiative 2000; European Union Chromosome 3 Arabidopsis Sequencing Consortium 2000; Kazusa DNA Research Institute et al. 2000; Theologis et al. 2000). The goal of a genome project is not the collection of the organism's DNA sequence, but rather the identification of the genes encoded within. Consequently, as the Arabidopsis sequence became available, significant effort was devoted to gene prediction and sequence annotation. Gene identification in eukaryotes remains a significant challenge; various existing gene prediction programs frequently provide contradictory results, and consequently, their predictions are best viewed as models that must be confirmed by other data, including alignments to EST, gene, or protein sequences. In Arabidopsis, <50% of the annotated genes had strong EST support. Further, while nearly 69% of the annotated genes were assigned putative functions, only 9% had been previously characterized. Although recent cDNA sequencing efforts have provided additional support for some predictions (Seki et al. 2002), many of the annotated gene structures and functional assignments remain hypotheses that must be tested to evaluate the quality of the annotation and to refine annotation techniques.
Microarray expression analysis allows monitoring of gene expression patterns on a global scale and provides an opportunity to both validate the gene predictions and to develop experimental evidence for functional assignments. There are a number of approaches to constructing microarrays, including mechanical spotting of cDNA clones (Schena et al. 1995) or long oligonucleotides (Kane et al. 2000; Call et al. 2001) onto derivatized glass and the in situ synthesis of short oligonucleotide probes directly on a glass microarray surface (Chee et al. 1996). In Arabidopsis, however, each of these approaches suffers significant limitations. Publicly available cDNA clones even now represent <60% of the predicted genes (Seki et al. 2002), while oligomer-based approaches rely on accurate gene structure predictions to effectively select target regions.
To circumvent these limitations, we developed a novel approach in which we constructed arrays consisting of PCR-amplified genomic segments representing nearly the entirety of the annotated genes on Arabidopsis chromosome 2 spotted onto aminosaline-coated microscope slides. Using these arrays, we set out to evaluate the validity of genomic annotation and to place the predicted genes in a biological context. Our results demonstrate expression of at least 84% of the predicted genes under one or more of the conditions tested and allow us to identify genes expressed in stress response and in particular tissues. Further, we have identified a region that appears to be transcriptionally repressed; the composition of the genes in this region resembles known heterochromatic regions in the chromosome 4 and in other plant chromosomes.
RESULTS AND DISCUSSION
A Novel Approach to Construction of the Genomic Amplicon Microarrays
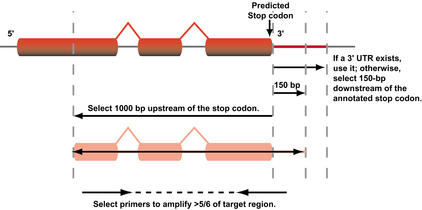
The lack of cDNA clones representing the majority of the predicted genes on chromosome 2, coupled with the inability of ab initio gene prediction programs to accurately deduce gene structures led us to develop a novel PCR-based approach targeting the 3′ ends of the predicted genes (Fig. 1). Briefly, starting at the 3′ end of the predicted transcribed region of each gene (Lin et al. 1999; available through http://www.tigr.org/tdb/e2k1/ath1/), we selected a 1000 base-pair region immediately upstream of the predicted stop codon. If an annotated 3′ untranslated region (UTR) existed, we added the complete UTR, otherwise, we included 150 base pairs of sequence downstream of the predicted stop. The selected target sequences provided with a minimum of 1150 base pairs for all predicted genes from which we designed PCR primers using Primer 3.0 (Whitehead Institute, http://www-genome.wi.mit.edu/genome_software) with optimized design parameters that can be used to amplify >5/6 of the target. The resulting PCR products are ∼1 kb in length, which is large enough to assure the presence of sufficient coding sequence in the target genomic region for efficient hybridization, while small enough not to contain multiple genes. Using this approach, we were able to design primers for 4437 of the 4442 predicted genes and pseudogenes identified on the chromosome 2 and have successfully amplified 4180 (94.2%) from genomic DNA using standardized amplification conditions, with approximately equal numbers either giving no clear amplification product or showing multiple bands (see http://atarrays.tigr.org/arabdata.shtml for primer sequences and amplification data, as well as the perl script used for primer selection). It should be noted that this represents a lower bound for representation on the arrays, as some of the products that gave no visible product on an agarose gel yielded good hybridization data; subsequent reanalysis suggests that the majority of these “undetected products” represent misloaded samples or samples at low concentrations. Purified PCR amplicons were spotted in duplicate at high density on aminosaline-coated microscope slides and the resulting microarrays used to assess gene expression in a wide range of tissues and physiological states.
Figure 1.
Primer design strategy for amplification of the 3′ ends of the annotated genes identified on the chromosome 2. Starting at the predicted stop codon of each annotated gene, we selected a region 1000 bp upstream and 150 bp, or the length of the annotated 3′ untranslated region if available and extracted it from the genomic sequence. Primer 3.0.9 from the Whitehead Institute was used to design primers spanning >5/6 the length of the selected region. Amplification success from genomic DNA was 94.2% using this approach.
Validation of the Gene Predictions on Arabidopsis Chromosome 2
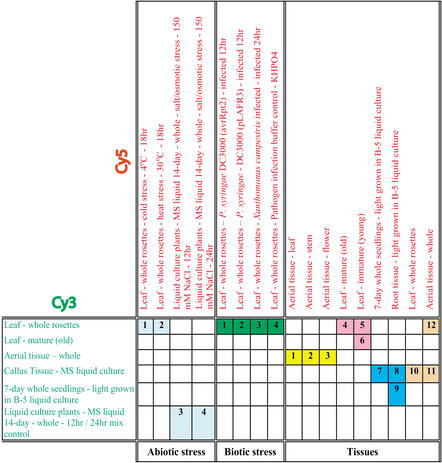
Of the 4437 genes for which we were able to design primers, 273 (6.2%) were previously known genes, 1807 (40.7%) were assigned putative functions based on protein sequence homology, 866 (19.5%) were classified as encoding unknown proteins as they shared similarity with other proteins of unknown function, 1094 (24.7%) were annotated as hypothetical indicating that they encode novel proteins of unknown function, and 397 (8.9%) were classified as pseudogenes. While the chromosome 2 microarrays represent nearly the entire complement of the genes on the chromosome, at any particular instant in time, a given tissue or physiological state is likely to express only a subset of the genes encoded within the genome. Consequently, we chose to survey a broad range of tissues and developmental stages, as well as plants challenged by biotic and abiotic stressors, in order to assess the validity of the gene predictions (Fig. 2).
Figure 2.
Paired Arabidopsis samples surveyed with microarrays in this study. A total of 19 samples were grouped into 20 hybridization pairs representing abiotic and biotic stressors and tissue-specific sets; subsets of experiments are color-coded as in Figures 6 and 8. mRNA from each plant sample was labeled with Cy3 or Cy5 fluorescent dye as indicated and the collection of hybridizations was replicated with dye labels reversed.
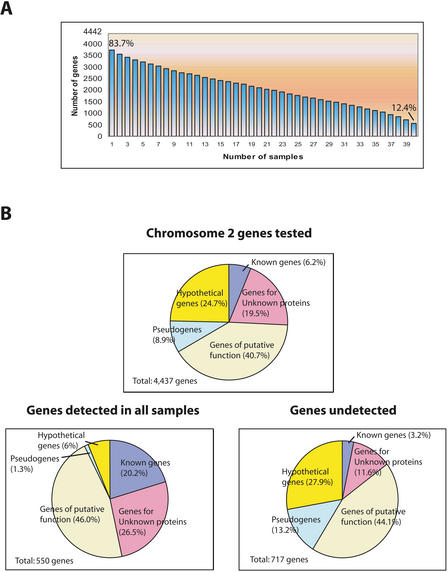
In total, 40 cohybridization assays were performed, representing 20 direct comparisons and dye-reversed replicas. As each gene on the chromosome was printed in duplicate, each pair of samples provides four opportunities to detect expression. We scored the genes “expressed” when they exhibited a measurable signal above background in at least two of these four replicas. Using this definition, we found 3720 (83.7%) of the 4442 genes on the chromosome to be expressed in at least one sample, providing transcriptional evidence for these predictions (Fig. 3A). We detected expression of 894 (81.7%) of the 1094 annotated hypothetical genes and 783 (90.4%) of the 866 genes encoding unknown proteins.
Figure 3.
Validation of gene predictions by expression as detected by microarray analysis. (A) Various levels of support can be inferred based on how often expression was detected in the 40 assays performed. Of 4437 genes surveyed, 83.7% provides evidence of expression in at least one assay, while 12.4% are expressed in all assays. (B) Genes assigned to functional classes, shown for the chromosome and for those genes that were expressed in every sample or that failed to be detected in any assay. Genes of previously known function are relatively overrepresented among those ubiquitously expressed and underrepresented among those not detected, while “hypothetical” genes display the opposite behavior.
A total of 550 genes (12.4%) were detected as expressed in all 40 hybridizations. These ubiquitously expressed genes include many of the known genes, as well as those unknown genes annotated based on their conservation in other species. Only 36 of the hypothetical genes, which were annotated solely on the basis of ab initio predictions, fell into this class. Only 717 (16.2%) genes were undetected in any of the assays performed; in this set, hypothetical genes were highly represented. Taken together, these data suggest, not surprisingly, that gene predictions without supporting EST or protein alignment evidence are most likely to be of questionable validity. These results are summarized in Figure 3; all expression data from this study can be found at http://atarrays.tigr.org/data/.
One interesting observation can be made by looking at the representation of known genes in various subsets of the data (Fig. 3B). For the entirety of chromosome 2, the known genes represent only 6.5% of the total 4437 annotated genes. However, when we examine the 550 genes that appear in all of the conditions surveyed in this study, we find that the known genes represent 20.2% of the total, while in the set of 717 genes that showed no discernable expression in any of our assays, the known genes represent only 3.2% of the total. What this suggests is subtle but profound for microarray studies. The “known genes” are likely known because they are nearly ubiquitously expressed and consequently more likely to be identified and assigned a functional role in standard biological experiments. In contrast, many genes of unknown function appear in only a small number of tissues or states or in response to specific stressors. This observation is important for microarray construction where the goal is to elucidate patterns of gene expression. Many people argue that arrays should be limited to genes of known function to facilitate interpretation of the data. This could, however, have the effect of eliminating from consideration the very genes that may well be important for a particular response in favor of genes that play a more general role in the cell.
Genes Responsive to Abiotic Stresses
Compared to validating expression of annotated genes, confirming functional role assignments for putative genes and determining functions for hypothetical and unknown genes is significantly more difficult. It often is not easy to find the proper conditions under which those genes are significantly regulated, and precise functional assignments generally require serial biochemical and genetic analyses to confirm a gene product's action. Nevertheless, microarray data provides information on patterns of gene expression that can be used to infer possible functions for these genes that can be further tested in directed studies.
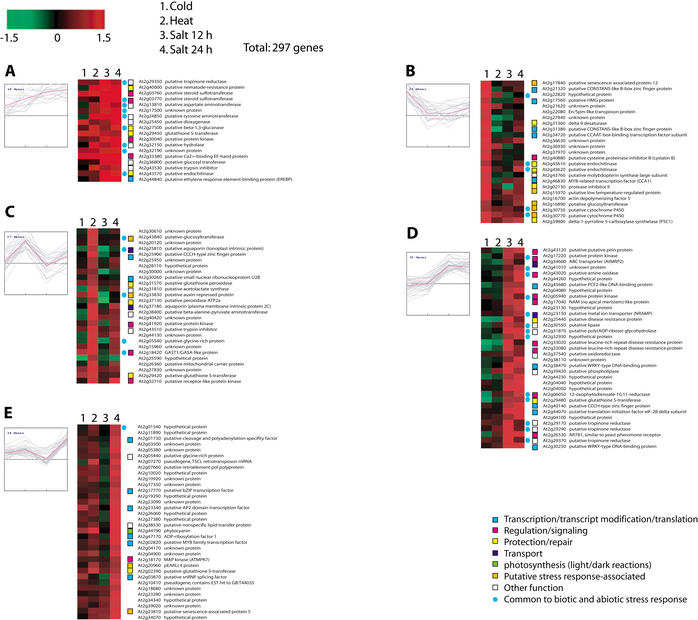
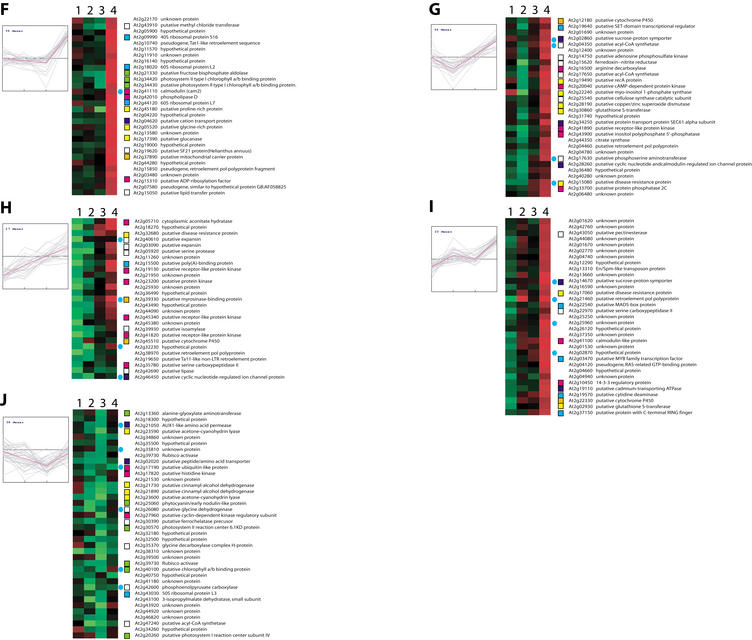
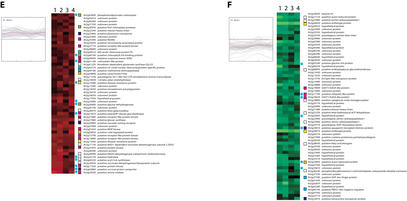
The conditions we surveyed included three independent abiotic stresses, heat, cold, and salt, with response to salt stress measured 12 and 24 h after exposure. Of the genes on chromosome 2, we were able to identify 497 that were differentially expressed at 95% confidence under one or more of the conditions. These included 43 that had been previously characterized; 247 were genes coding for putative functions, 106 genes encoded unknown proteins, 83 were hypothetical genes, and 18 had been annotated as pseudogenes. Figure 4 shows the 297 genes for which expression data were available in all four conditions organized into 10 clusters using k-means clustering with a Euclidean distance metric.
Figure 4.
Abiotic stress response gene expression. A total of 297 genes significantly regulated in response to cold, heat, and salt stresses were grouped using k-means clustering (k = 10; Euclidean distance). Predicted role categories are denoted by color-coded squares; genes also found to be significantly regulated in response to biotic stresses are denoted with blue circles.
Among the known genes were some previously associated with abiotic stress-response in plants, and these served as positive controls for our analysis. For example, a gene encoding a glutathione S-transferase (GST, At2g29450) was up-regulated in response to all stressors. GST enzymes are known to be involved in numerous biotic and abiotic stress responses including those assayed here (Marrs 1996; Edwards et al. 2000). Genes coding for cold-regulated protein cor15a precursor (At2g42540) and cold-regulated protein cor15b precursor (At2g42530) were up-regulated in response to cold stress, consistent with the involvement of these proteins in acclimation to cold stress (Wilhem and Thomashow 1993; Steponkus et al. 1998). Induction of actin depolymerizing factor (ADF, At2g16700) under cold stress is consistent with the previous observation that low temperatures induce the accumulation of an ADF protein in Gramineae species (Ouellet et al. 2001). A change in the abundance of ADF proteins is believed to lead to changes in the actin cytoskeletal architecture during low-temperature acclimation, and these modifications may be related to cell survival under freezing conditions (Staiger et al. 1997; Lappaleinen et al. 1998; Aon et al. 2000). Delta-9 desaturase (At2g31360) was specifically up-regulated under cold stress. Production of delta9 desaturase under cold stress may be a way to acclimate to the cold conditions. Transgenic tobacco plants expressing cyanobacterial delta-9 desaturase have been shown to have highly reduced level of saturated fatty acid in membrane lipids and exhibited a significant increase in chilling resistance (Ishizaki-Nishizawa et al. 1996). Delta-1-pyrroline 5-carboxylase synthetase (P5C1; At2g39800) was induced in response to cold and salt stresses. This enzyme is required for the synthesis of proline, which is known to play an important role as an osmoprotectant in plants subjected to hyperosmotic stresses such as cold, drought, and soil salinity (Delauney and Verma 1993; Hong et al. 2000).
Other genes with known and putative functions, which were found to be differentially expressed, can be used to generate hypotheses regarding the mechanism of stress response. Induction of a gene encoding a K+ transporter (AKT1; At2g26650) is intriguing because it is known that high concentrations of Na+ caused by salt stresses can cause K+ deficiency in the cell (Hanegawa et al. 2000). AKT1 is predominantly expressed in root cortex and root epidermis, and is responsible for inward rectifying K+ currents in these cells (Hirsch et al. 1998; Reintanz et al. 2002). Moreover, when 1 mM Na+ was applied in the presence of 30 mM K+ in the bath solution, inward K+ currents remained largely unaffected (Reintanz et al. 2002). Induction of this transporter may alleviate K+ deficiency caused by increased concentration of Na+ in the cell. Salt stress also induced expression of 12-oxophytodienoate-10, 11-reductase (At2g06050), which is required for jasmonate synthesis, suggesting that salt stresses result in the synthesis of this chemical. Nitric oxide signaling may also play a role in salt-stress response as cytoplasmic aconitate hydratase (At2g05710), which plays a role as a nitric oxide sensor, is up-regulated.
One of the values of the microarray data is that they provide support for the genes coding for proteins of putative function. The differentially expressed genes we identified include a number of genes encoding putative transcription factors and various proteins that may have roles in signal transduction pathways, and their patterns of expression provide the first experimental evidence for their assignments. For instance, a gene for a putative low-temperature–regulated protein (At2g15970) indeed was significantly and specifically induced under cold stress (Fig. 4B). At2g03760, which encodes a putative steroid sulfotransferase, was also up-regulated. Steroid sulfotransferases are the enzymes that inactivate steroid hormones and recently have been shown induced by salicylic acid in plant (Rouleau et al. 1999). These authors suggested that plants might respond to stresses by modulating steroid-dependent growth and developmental processes. We observed the induction of At2g47600 coding for a putative Na+/Ca2+ antiporter under salt stress. Although this is not a surprising response to the osmotic pressure induced by high salt, to our knowledge this is the first report of salt-induced expression of this transporter. Induction of putative amine oxidase (At2g43020) under salt stress suggests that reactive oxygen species (ROS) signaling may also play a role in the plant's response. This hypothesis is consistent with the induction of 12-oxophytodienoate-10, 11-reductase (At2g06050), which is a key enzyme for jasmonate synthesis and which is known to both be produced in response to ROS and to play a role in modulating oxidative signaling (Schaller et al. 1998; Rao et al. 2000). A putative inositol polyphosphate 5′-phosphatase (At2g43900) was also induced. These enzymes are known to be involved in abscisic acid (ABA) signaling, and it is known that ABA accumulates in vegetative cells in response to water deficit, salinity, cold temperature, and light variation, and it is thought to act as a signal for the initiation of acclimation to these stresses.
We also found 83 hypothetical and 106 “unknown” genes to be differentially regulated in response to abiotic stresses. This suggests that these genes may play a role in stress response, although with these limited data it is not possible to deduce precise functions. A more comprehensive expression analysis of stress response in combination with traditional genetic studies would help to refine the roles that these unknown genes might play.
Response to Biotic Stress
We also investigated plant response to bacterial infection. For this, we infiltrated Arabidopsis rosette leaves with buffer suspensions of Pseudomonas syringae pv. tomato (Pst) strain DC 3000 (Staskawicz et al. 1987) carrying either the avirulent gene avrRpt2 (Whalen et al. 1991; Mudgett and Staskawicz 1999; Chen et al. 2000) or the vector control (pLAFR3) for the gene construct (Staskawicz et al. 1987). The avrRpt2 gene encodes a virulence factor that is quickly detected by the Arabidopsis surveillance system and induces an avirulence response (Mudgett and Staskawicz 1999; Chen et al. 2000). We also challenged plants with Xanthomonas campestris pv.campestris, which causes black rot disease in both crucifers and some noncrucifers including Arabidopsis (Bent et al. 1992). Buffer without bacteria was used as a negative control.
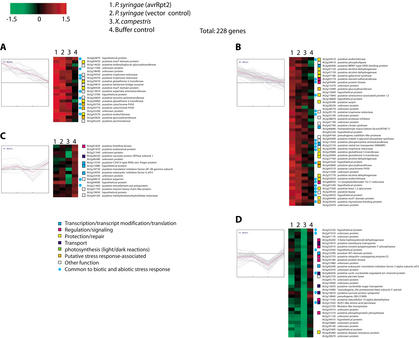
A total of 344 genes showed a significant response to at least one treatment (Fig. 5), of which 12 are of previously known function and some of which can serve as positive controls for our assays. At2g37040 codes for phenylalanine ammonia lyase (PAL1) was up-regulated in response to infiltration with P. syringae DC 3000 (avrRpt2), P. syringae DC 3000 (vector control), and buffer alone. This is consistent with the fact that PAL1 has been implicated in pathogen and wound response in plants (Logemann et al. 1995; Weisshaar and Jenkins 1998). Induction of At2g40940 coding for ethylene response sensor (ERS) and At2g06050 coding for 12-oxophytodienoate-10, 11-reductase, a key enzyme for jasmonate biosynthesis, is consistent with published observations that ethylene and jasmonate are involved in pathogen-responsive interactions (Pieterse and van Loon 1999). At2g14580, which encodes pathogenesis-related PR-1-like protein, was strongly induced in response to P. syringae DC 3000 (avrRpt2) but only weakly to P. syringae DC 3000 (vector control), suggesting the protein is expressed in response to the avrRpt2 product.
Figure 5.
Biotic stress-response gene expression. A total of 228 genes significantly regulated in response to Pseudomonas syringae DC3000 (avrRpt2), P. syringae DC3000 (vector control), Xanthomonas campestris, and buffer control were grouped using k-means clustering (k = 6; Euclidean distance). Predicted role categories are denoted by color-coded squares; genes also found to be significantly regulated in response to abiotic stresses are denoted with blue circles.
Of the 344 response genes we found to be differentially expressed in response to at least one treatment, 228 had measurable expression in all four. These were clustered using k-means (k = 6, Euclidean distance; Fig. 5). Clusters A and B contain genes that are highly up-regulated in response to P. syringae DC 3000 (avrRpt2) relative to other treatments. It is possible that many of these may be involved in avirulence responses to the avrRpt2 gene product. Clusters C and D include genes specifically down-regulated by X. campestris infection. Many of these are involved in gene expression and signal transduction and were up-regulated in response to salt and other abiotic stresses. This suggests that X. campestris may have a strategy to suppress host defense systems to effectively establish pathogenesis. Finally, we found 167 putative, 59 hypothetical, and 85 unknown genes significantly regulated in these biotic stress-response experiments, suggesting potential roles for these genes.
Gene Expression Profiles in Tissue Samples
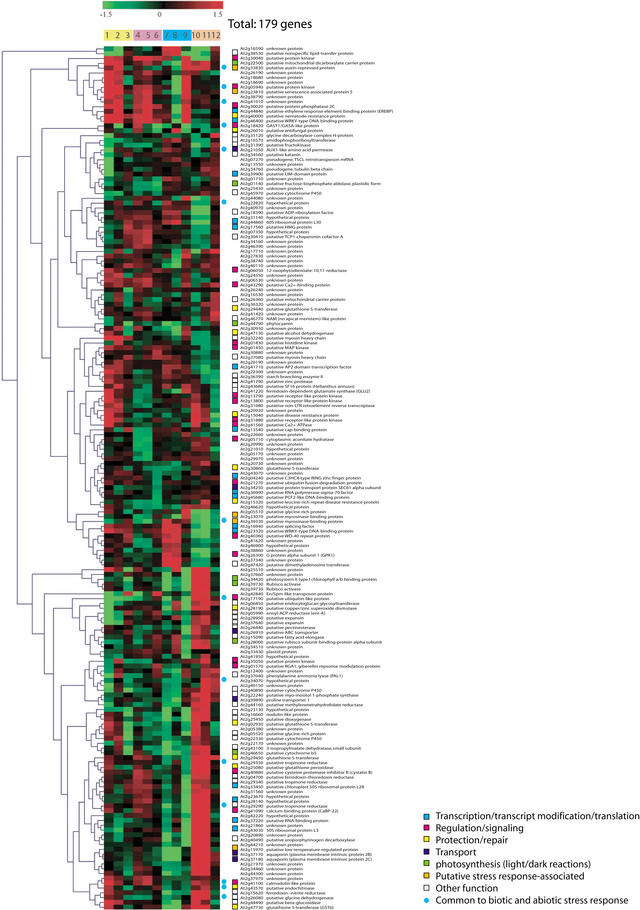
We also surveyed gene expression in a variety of paired tissues and whole seedlings (Fig. 2). We identified 738 genes differentially expressed in at least one pair of samples, of which 179 had measurable expression in all assays. Patterns of expression are shown in Figure 6. Although direct comparison between all assays are difficult because different reference samples were used for each pair, the dataset allows interesting observations to be made. For example, in comparison of flowers, stems, and leaves with whole aerial tissue, we observe distinct patterns of expression for each tissue. Among genes down-regulated in flowers are those associated with photosynthesis. A gene (At2g37040) encoding phenylalanine ammonia lyase (PAL1) (Weisshaar and Jenkins 1998) was up-regulated in stem but significantly down-regulated in leaves and flowers, implying the rapid cell wall synthesis (growth) in the stem. These suggest that our array approach coupled with detailed tissue and developmental sampling of tissues can lead to a better understanding of the genes that are specifically expressed in various tissues and in tissue differentiation.
Figure 6.
Gene expression in various tissues. A total of 179 genes that showed significant differences in expression compared to corresponding reference samples were subjected to average linkage hierarchical clustering with a Euclidean distance metric. Predicted role categories are denoted by color-coded squares; genes also found to be significantly regulated in response to both abiotic and biotic stresses are denoted with blue circles.
Functional Distribution of Differentially Expressed Genes
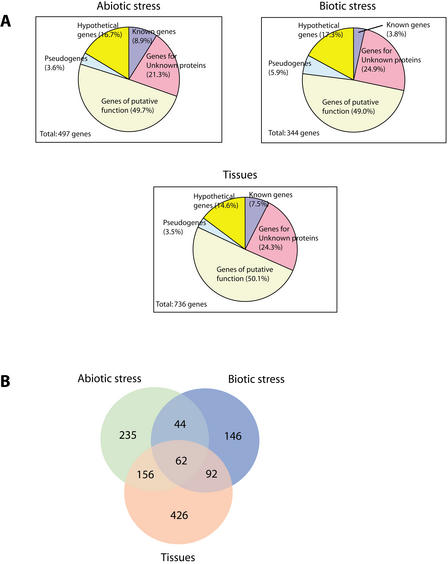
If one examines the functional distribution of genes differentially expressed in all three subsets of the samples we analyzed (Fig. 7A), it is apparent that hypothetical and pseudogenes are significantly underrepresented relative to the functional distribution of genes on the chromosome. While it is possible that the conditions that we surveyed are those in which these genes are not expressed, it is more likely that the pseudogenes are simply not expressed because of loss of their promoter sequences, and that many of the hypotheticals, predicted without support from ESTs or known proteins, are not real genes or are rarely transcribed and consequently do not appear in our assays.
Figure 7.
A comparison of genes found to be significantly regulated in the various experimental subsets. (A) Distribution of role categories for each of the biotic, abiotic, and tissue classes of assays. (B). Venn diagram analysis showing the number of significantly regulated genes overlapping between sets.
One other interesting observation is that there are a number of genes that are transcriptionally regulated in response to both biotic and abiotic stressors, as well as in a tissue-specific fashion (Fig. 7B). Many stress-responsive genes are known to be involved in normal physiology in plants. Moreover, it is not surprising that a range of stressors activate the same repair and protective mechanisms and signaling pathways. Many stressors also cause oxidative damage (Bowler and Fluhr 2000) and these result in production of antioxidants and scavenging enzymes, as we have seen induction of the GST genes.
Despite considerable overlap between many stress signaling pathways, our data also provides clear evidence for stress-specific responses. Examples include the Na+/Ca2+ antiporter and K+ channel we observed up-regulated in response to salt stress (Fig. 4). These can be important for the salt stress response, however may not be as important for other stresses that do not involve ionic stress.
Chromosomal Organization and Gene Expression
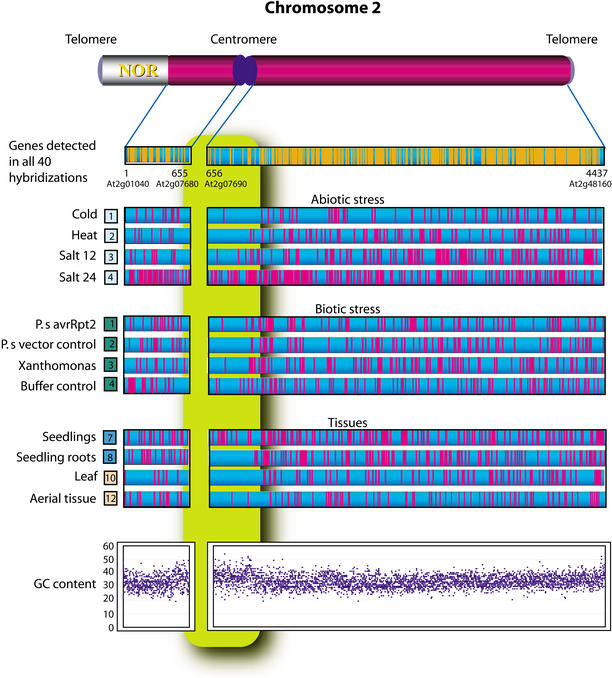
One particular application of gene expression analysis that is not possible without a comprehensive survey of the genome of an organism (or its chromosomes) is the analysis of chromosomal position effects on patterns of gene expression (Fig. 8). While it has been known that such effects exist (Fransz et al. 2000; McCombie et al. 2000), the whole chromosome 2 Arabidopsis microarray represents the first opportunity to directly study this in a comprehensive way in a higher eukaryote.
Figure 8.
Spatial distribution of expressed genes along the chromosome for those genes detected in all assays as well as those significantly up- or down-regulated in particular assays. In each graph, genes are arranged in the order they appear along the chromosome starting from the nucleolar organizer region on the short arm. Also shown is a plot of the average GC content 1 kb upstream of each gene. Note that gene expression appears repressed in the region of the centromere and telomeres, areas in which the average GC content increases. Note that a similar increase is not observed in the other repressed regions apparent on the long arm.
Our expression data reveals a region near the centromere, delimited approximately by At2g06400 and At2g14850, containing more than 600 genes (∼14% of the total), where gene expression appears generally repressed relative to other regions. In this region, only plants subject to salt stress and seedling tissue demonstrate any significant expression. As reported previously (Copenhaver et al. 1999), this region contains a relatively large number of genes (∼300) associated with transposons, retroelements, and retroelement-like pseudogenes. These repetitive DNA elements are consistent with heterochromatic regions described in Arabidopsis chromosome 4 (Fransz et al. 2000; McCombie et al. 2000), suggesting this region is also heterochromatic in nature and in which most genes are silenced. An analysis of a region 1 kb upstream of each of the genes also indicates an increased average guanine-cytosine (GC) content for these centromeric genes, as well as for those falling near the telomeres, further supporting the observation that these regions are heterochromatic. Some genes appear to escape silencing under specific conditions (early development and salt stress) consistent with the fact that heterochromatin stability can change during development (Preuss 1999; Meyer 2000) and that some activators are known to overcome heterochromatin silencing (Ahmad and Henikoff 2001).
Finally, one should note that there are additional regions on the long arm of chromosome 2 that also appear to be transcriptionally repressed. Extensive analysis of the genes in these regions, including their functional roles, GC content, and the presence of repetitive sequences, failed to yield any clues as to what sets these regions apart. The apparent silencing of these regions remains an open question that must be further validated and explored.
Conclusions
The sequencing and annotation of a genome is a starting point for a holistic analysis of the organism under study. However, the gene predictions and their functional assignments represent hypotheses that must be experimentally tested. We developed a novel approach to constructing whole chromosome arrays using genomic DNA amplicons and have demonstrated their utility in providing validation for the gene predictions and their potential for shedding light on important biological processes and genome-scale patterns of expression. The gene expression profiles we have observed in this study are consistent with previous observations and suggest new relationships between genes that can be tested with further directed analyses. In addition, we have provided additional validation for putative functional assignments by demonstrating that many of these predicted genes behave as one might expect based on sequence homology. We have also provided clues as to potential functions for many genes annotated as hypothetical or unknown. Our discovery of spatial effects in the patterns of gene expression further suggests that whole chromosome analysis, and ultimately whole-genome analysis, may reveal new features and provide new insights on gene regulation in higher eukaryotes. Based on the successful demonstration of the utility of this amplicon array approach, we have expanded our efforts to the creation of a whole-genome microarray representing the entire nuclear, chloroplast, and mitochondrial genomes of Arabidopsis and anticipate the first results from expression analysis using those arrays to be available shortly. All data from this study and validated primer pair sequences for chromosome 2 and the entire nuclear, chloroplast, and mitochondrial genomes are available at http://atarrays.tigr.org. We hope that this approach and these reagents become a valuable research tool for the community.
METHODS
Microarray Construction
The protocols used for this study were adapted from those we developed for the analysis of human microarrays (Hegde et al. 2000) with minor modifications (see http://atarrays.tigr.org/protocols.shtml). Briefly, PCR amplicons were purified using Millipore 96 well size exclusion vacuum filter plates. Purified products were resuspended in water and combined 1:1 with DMSO for microarray spotting. These products were spotted in duplicate at high density on Telechem Superamine aminosilane coated microscope slides using a high precision spotting robot developed by Intelligent Automation Systems. Spotted samples were allowed to dry at room temperature and bound to the slides by ultraviolet crosslinking at 450 mJ in a Stratalinker (Stratagene). Slides were stored in a bench-top dessicator until use.
Plant Culture and Stress Treatments
A. thaliana Columbia plants were grown at 23°C under constant blue-white light either in liquid media or in soil. Liquid cultured plants or callus tissues (see Fig. 2) were grown in 100 mL of 0.5× Murashige and Skoog (MS), pH 5.7 (Murashige and Skoog 1962), or Gamborg's B5 medium (Gamborg et al. 1968) for 7-days or 14-days with constant shaking at 100 rpm. For salt stress treatments, NaCl was added to the flasks of plant cultures to the final concentration of 150 mM, and whole plants were collected after 12 and 24 hours. Plants were grown in soil to the preaerial stage (8–12 leaves) for bacterial infection experiment. P. syringae DC3000 (avrRpt2) (Whalen et al. 1991; Mudgett and Staskawicz 1999; Chen et al. 2000), P. syringae DC3000 (pLAFR3) (Staskawicz et al. 1987), and X. campestris (Bent et al. 1992) were applied to the underside of leaves in a KHPO4 buffer using a syringe, and leaf samples were collected after 12 h. Temperature-stressed leaves were collected after 18 h of exposure to 4°C (cold) or to 37°C (heat). For young and mature leaf comparisons, young leaves were determined as the ones ≤3 cm and the mature ones as ≥4.5 cm. To obtain the aerial tissues including flowers, plants were grown more than a month.
RNA Preparation and Labeling
Tissues from plant samples of interest were flash frozen in liquid nitrogen and powdered using a cold mortar and pestle. Total RNA was extracted using Trizol (Invitrogen Corp.), and poly(A+) RNA was prepared using Dynabeads oligo (dT)25 (Dynal Biotech Inc.) following the manufacturer's protocol. Fluorescently labeled probes were prepared by direct incorporation of Cy3– or Cy5-labeled dUTP (Amersham-Pharmacia) during oligo(dT) (Invitrogen Corp.) primed first-strand cDNA synthesis using Superscript II reverse transcriptase (Invitrogen Corp.). Probes were cleaned using GFX columns (Amersham-Pharmacia) using the instructions provided by the manufacturer.
Slide Hybridization, Scanning, and Image Analysis
To block nonspecific background during hybridization, slides were first prehybridized in 5×SSC, 0.1% SDS, and 1% bovine serum albumin at 42°C for 45 min. as previously described (Hegde et al. 2000). Slides were then washed in water and isopropanol (Sigma) and dried before hybridization. Fluorescent probes were dried after purification and resuspended in hybridization buffer containing 50% formamide, 5×SSC, and 0.1% SDS. Cy-3 and Cy-5 labeled probes were combined and hybridized to the slides overnight at 42°C in a humid chamber. Following hybridization, slides were washed sequentially in 2×SSC and 0.1% SDS at 42°C for 5 min., in 0.1×SSC and 0.1% SDS at room temperature for 5 min., and twice in 0.1×SSC at room temperature for 2.5 min., and air dried. Hybridized slides were scanned using the Axon GenePix 4000 microarray scanner, and the independent TIFF images from each channel were analyzed using TIGR Spotfinder (http://www.tigr.org/softlab, TIGR) to assess relative expression levels. Data from TIGR Spotfinder were stored in AGED, a relational database designed to effectively capture microarray data.
Data Normalization and Analysis
Normalization is necessary to adjust for differences in labeling and detection efficiencies of the fluorescent labels and for differences in the quantity of starting RNA. Data was normalized using a local regression technique, LOWESS (LOcally WEighted Scatterplot Smoothing), using the MIDAS software tool (http://www.tigr.org/softlab, TIGR), and the resulting data were averaged over duplicate genes on each array and over duplicate arrays for each experiment.
All calculated gene expression ratios were log2-transformed, and differentially expressed genes at the 95% confidence level for each reference set were determined by assuming the log2 ratios for each data set form a normal distribution, and selecting genes with log2 (ratio) values >1.96 standard deviations from the mean. This filtration of the significantly expressed genes was conducted using MIDAS, and the resulting lists of the genes were examined further by cross comparison between experiments using TIGR MeV (http://www.tigr.org/softlab, TIGR).
Data Availability
All data generated by this project, including PCR primer sequences and amplification data, as well as all primary and normalized hybridization intensities and specific gene lists can be found at http://atarrays.tigr.org/data/.
WEB SITE REFERENCES
http://www.tigr.org/tdb/e2k1/ath1/; hosts the TIGR Arabidopsis thaliana database, which contains gene predictions and annotation for the complete Arabidopsis genome.
http://www-genome.wi.mit.edu/genome_software; contains software for genomic applications, including Primer3, which was used in this study.
http://atarrays.tigr.org; is the homepage for the NSF-funded project that generated the data presented here.
http://atarrays.tigr.org/arabdata.shtml; includes links to all of the data used in this analysis as well as a list of all of the primer sequences and validation scores for amplicon arrays created for the entire Arabidopsis nuclear, chloroplast, and mitochondrial genomes.
http://atarrays.tigr.org/protocols.shtml; has links to all of the laboratory protocols used for constructing the amplicon arrays.
http://www.tigr.org/software/; includes genomic analysis software developed at TIGR, including the MADAM, Spotfinder, MIDAS, and MeV tools used for the analysis presented here.
Acknowledgments
We thank J. White, V. Sharov, A.I. Saeed, J. Li, and W. Liang for bioinformatics support for the microarray work. We also thank M. Heaney and S. Lo for database support, and V. Sapiro, B. Lee, J. Shao, S. Gregory, C. Irwin, J. Neubrech, R. Kramchedu, M. Sengamalay, and E. Arnold for computer system support. We thank T. Vantoai, N.H. Lee, L. Linford, L. Moy, I. Yang, S. Wang, Y. Wang, H. Wang, K. Kwong, and J. Hasseman for technical assistance and valuable comments. This work was supported by a grant to JQ (NSF 9975920) from the U.S. National Science Foundation.
The publication costs of this article were defrayed in part by payment of page charges. This article must therefore be hereby marked “advertisement” in accordance with 18 USC section 1734 solely to indicate this fact.
E-MAIL johnq@tigr.org; FAX (301) 838-0208.
Article and publication are at http://www.genome.org/cgi/doi/10.1101/gr.552003.
REFERENCES
- 1.Ahmad K. and Henikof, S. 2001. Modulation of a transcription factor counteracts heterochromatic gene silencing in Drosophila. Cell 104: 839-847. [DOI] [PubMed] [Google Scholar]
- 2.Aon M.A., Cortassa, S., Gomez, C.D.F., and Iglesias, A.A. 2000. Effects of stress on cellular infrastructure and metabolic organization in plant cells. Int. Rev. Cytol. 194: 239-273. [DOI] [PubMed] [Google Scholar]
- 3.The Arabidopsis Genome Initiative 2000. Analysis of the genome sequence of the flowering plant Arabidopsis thaliana. Nature 408: 796-815. [DOI] [PubMed] [Google Scholar]
- 4.Bent A.F., Innes, R.W., Ecker, J.R., and Staskawicz, B.J. 1992. Disease development in ethylene-insensitive Arabidopsis thaliana infected with virulent and avirulent Pseudomonas and Xanthomonas pathogens. Mol. Plant Microbe. Interact. 5: 372-378. [DOI] [PubMed] [Google Scholar]
- 5.Bowler C. and Fluhr, R. 2000. The role of calcium and activated oxygens as signals for controlling cross-tolerance. Trends Plant Sci. 5: 241-246. [DOI] [PubMed] [Google Scholar]
- 6.Call D.R., Chandler, D.P., and Brockman, F. 2001. Fabrication of DNA microarrays using unmodified oligonucleotide probes. BioTechniques 30: 368-372. [DOI] [PubMed] [Google Scholar]
- 7.Chee M., Yang, R., Hubbell, E., Berno, A., Huang, X.C., Stern, D., Winkler, J., Lockhart, D.J., Morris, M.S., and Fodor, S.P. 1996. Accessing genetic information with high-density DNA arrays. Science 274: 610-614. [DOI] [PubMed] [Google Scholar]
- 8.Chen Z., Kloek, A.P., Boch, J., Katagiri, F., and Kunkel, B.N. 2000. The Pseudomonas syringae avirRpt2 gene product promotes pathogen virulence from inside plant cells. Mol. Plant-Microbe Interact. 13: 1312-1321. [DOI] [PubMed] [Google Scholar]
- 9.Copenhaver G.P., Nickel, K., Kuromori, T., Benito, M.-I., Kaul, S., Lin, X., Bevan, M., Murphy, G., Harris, B., Parnell, L.D., et al. 1999. Genetic definition and sequence analysis of Arabidopsis centromeres. Science 286: 2468-2474. [DOI] [PubMed] [Google Scholar]
- 10.Delauney A.J. and Verma, D.P.S. 1993. Proline biosynthesis and osmoregulation in plants. Plant J. 4: 215-223. [Google Scholar]
- 11.Edwards R., Dixon, D.P., and Walbot, V. 2000. Plant glutathione S-transferases: Enzymes with multiple functions in sickness and in health. Trends Plant Sci. 5: 193-198. [DOI] [PubMed] [Google Scholar]
- 12.European Union Chromosome 3 Arabidopsis Sequencing ConsortiumThe Institute for Genomic Research and Kazusa DNA Research Institute 2000. Sequence and analysis of chromosome 3 of the plant Arabidopsis thaliana.. Nature 408: 820-823. [Google Scholar]
- 13.Fransz P.F., Armstrong, S., de Long, J.H., Parnell, L.D., van Drunen, C., Dean, C., Zabel, P., Bisseling, T., and Jones, G.H. 2000. Integrated cytogenetic map of chromosome arm 4S of A. thaliana: Structural organization of heterochromatic knob and centromere region. Cell 100: 367-376. [DOI] [PubMed] [Google Scholar]
- 14.Gamborg O.L., Miller, R.A., and Ojima, K. 1968. Nutrient requirements of suspension cultures of soybean root cells. Exp. Cell Res. 50: 151-158. [DOI] [PubMed] [Google Scholar]
- 15.Hanegawa P.M., Bressan, R.A., Zhu, J.K., and Bohnert, H.J. 2000. Plant cellular and molecular responses to high salinity. Annu. Rev. Plant. Mol. Plant Physiol. 51: 463-499. [DOI] [PubMed] [Google Scholar]
- 16.Hegde P., Qi, R., Abernathy, R., Gay, C., Dharap, S., Gaspard, R., EarleHughes, J., Snesrud, E., Lee, N.H., and Quackenbush, J. 2000. A concise guide to cDNA microarray analysis. BioTechniques 29: 548-562. [DOI] [PubMed] [Google Scholar]
- 17.Hirsch R.E., Lewis, B.D., Spalding, E.P., and Sussman, M.R. 1998. A role for the AKT1 potassium channel in plant nutrition. Science 280: 918-920. [DOI] [PubMed] [Google Scholar]
- 18.Hong Z., Lakkineni, K., Zhang, Z., and Verma, D.P.S. 2000. Removal of feedback inhibition of Δ1-Pyrroline-5-carboxylate synthetase results in increased proline accumulation and protection of plants from osmotic stress. Plant Physiol. 122: 1129-1136. [DOI] [PMC free article] [PubMed] [Google Scholar]
- 19.Ishizaki-Nishizawa O., Fujii, T., Azuma, M., Sekiguchi, K., Murata, N., Ohtani, T., and Toguri, T. 1996. Low-temperature resistance of higher plants is significantly enhanced by a nonspecific cyanobacterial desaturase. Nat. Biotechnol. 14: 1003-1006. [DOI] [PubMed] [Google Scholar]
- 20.Kane M.D., Jatkoe, T.A., Stumpf, C.R., Lu, J., Thomas, J.D., and Madore, S.J. 2000. Assessment of the sensitivity and specificity of oligonucleotide (50mer) microarrays. Nucleic Acids Res. 28: 4552-4557. [DOI] [PMC free article] [PubMed] [Google Scholar]
- 21.Kazusa DNA Research InstituteThe Cold Spring Harbor and Washington University Sequencing ConsortiumThe European Union Arabidopsis Genome Sequencing ConsortiumInstitute of Plant Genetics and Crop Research (IPK) 2000. Sequence and analysis of chromosome 5 of the plant Arabidopsis thaliana. Nature 408: 823-826. [Google Scholar]
- 22.Lappaleinen P., Kessels, M.M., Cope, M.J.T.V., and Drubin, D. 1998. The ADF homology (ADF-H) domain: A highly exploited actin-binding module. Mol. Biol. Cell 9: 1951-1959. [DOI] [PMC free article] [PubMed] [Google Scholar]
- 23.Lin X., Kaul, S., Rounsley, S., Shea, T.P., Benito, M.I., Town, C.D., Fujii, C.Y., Mason, T., Bowman, C.L., Barnstead, M., et al. 1999. Sequence and analysis of chromosome 2 of Arabidopsis thaliana. Nature 402: 761-768. [DOI] [PubMed] [Google Scholar]
- 24.Logemann E., Parniske, M., and Hahlbrock, K. 1995. Modes of expression and common structural features of the complete phenylalanine ammonia-lyase gene family in parsley. Proc. Natl. Acad. Sci. 92: 5905-5909. [DOI] [PMC free article] [PubMed] [Google Scholar]
- 25.Marrs K.A. 1996. The functions and regulation of glutathione S-transferases in plants. Annu. Rev. Plant Physiol. Plant Mol. Biol. 47: 127-158. [DOI] [PubMed] [Google Scholar]
- 26.Mayer K., Schuller, C., Wambutt, R., Murphy, G., Volckaert, G., Pohl, T., Dusterhoft, A., Stiekema, W., Entian, K.D., Terryn, N., et al. 1999. Sequence and analysis of chromosome 4 of Arabidopsis thaliana. Nature 402: 769-777. [DOI] [PubMed] [Google Scholar]
- 27.Meyer P. 2000. Transcriptional transgene silencing and chromatin components. Plant Mol. Biol. 43: 221-234. [DOI] [PubMed] [Google Scholar]
- 28.McCombie W.R., de la Bastide, M., Habermann, K., Parnell, L.D., Dedhia, N., Gnoj, L., Schutz, K., Huang, E., Spiegel, L., Yordan, C., et al. 2000. The complete sequence of a heterochromatic island from a higher eukaryote. Cell 100: 377-386. [Google Scholar]
- 29.Mudgett M.B. and Staskawicz, B.J. 1999. Characterization of the Pseudomonas syringae pv. tomato AvrRpt2 protein: Demonstration of secretion and processing during bacterial pathogenesis. Mol. Microbiol. 32: 927-941. [DOI] [PubMed] [Google Scholar]
- 30.Murashige T. and Skoog, F. 1962. A revised medium for rapid growth and bioassays with tobacco tissue culture. Physiol. Plant 15: 473-497. [Google Scholar]
- 31.Ouellet F., Carpentier, E., Cope, M.J.T.V., Monroy, A.F., and Sarhan, F. 2001. Regulation of a wheat actin-depolymerizing factor during cold acclimation. Plant Physiol. 125: 360-368. [DOI] [PMC free article] [PubMed] [Google Scholar]
- 32.Pieterse C.M.J. and van Loon, L.C. 1999. Salicylic acid-independent plant defense pathways. Trends Plant Sci. 4: 52-58. [DOI] [PubMed] [Google Scholar]
- 33.Preuss D. 1999. Chromatin silencing and Arabidopsis development: A role for polycomb protein. Plant Cell. 11: 765-767. [DOI] [PMC free article] [PubMed] [Google Scholar]
- 34.Rao M.V., Lee, H.-I., Creelman, R.A., Mullet, J.E., and Davis, K.R. 2000. Jasmonaic acid signaling modulates ozone-induced hypersensitive cell death. Plant Cell. 12: 1633-1646. [DOI] [PMC free article] [PubMed] [Google Scholar]
- 35.Reintanz B., Szyroki, A., Ivashikina, N., Ache, P., Godde, M., Becker, D., Palme, K., and Hedrich, R. 2002. AtKC1, a silent Arabidopsis potassium channel α-subunit modulates root hair K+ influx. Proc. Natl. Acad. Sci. 99: 4079-4084. [DOI] [PMC free article] [PubMed] [Google Scholar]
- 36.Rouleau M., Marsolais, F., Richard, M., Nicolle, L., Voigt, B., Adam, G., and Varin, L. 1999. Inactivation of brassinosteroid biological activity by a salicylate-inducible steroid sulfotransferase from Brassica napus. J. Biol. Chem. 274: 20925-20930. [DOI] [PubMed] [Google Scholar]
- 37.Schaller F., Henning, P., and Weiler, E.W. 1998. 12-oxophytodienoate-10,11-reductase: Occurrence of two isoenzymes of different specificity against stereoisomers of 12-oxophytodienoic acid. Plant Physiol. 118: 1345-1351. [DOI] [PMC free article] [PubMed] [Google Scholar]
- 38.Schena M., Shalon, D., Davis, R.W., and Brown, P.O. 1995. Quantitative monitoring of gene expression patterns with complementary DNA microarray. Science 270: 467-470. [DOI] [PubMed] [Google Scholar]
- 39.Seki M., Narusaka, M., Kamiya, A., Ishida, J., Satou, M., Sakurai, T., Nakajima, M., Enju, A., Akiyama, K., Oono, Y., et al. 2002. Functional annotation of a full-length Arabidopsis cDNA collection. Science 296: 141-145. [DOI] [PubMed] [Google Scholar]
- 40.Staiger C.J., Gibbson, B.C., Kovar, D.R., and Zonia, L.E. 1997. Profilin and actin-depolymerizing factor: Modulators of actin organization in plants. Trends Plant Sci. 2: 275-281. [Google Scholar]
- 41.Staskawicz B., Dahlbeck, D., Keen, N., and Napoli, C. 1987. Molecular characterization of cloned avirulence genes from race 0 and race 1 of Pseudomonas syringae pv. glycinea. J. Bacteriol. 169: 5789-5794. [DOI] [PMC free article] [PubMed] [Google Scholar]
- 42.Stenponkus P.L., Uemura, M., Joseph, R.A., Gilmour, S.J., and Thomashow, M.F. 1998. Mode of action of the COR15a gene on the freezing tolerance of Arabidopsis thaliana. Proc. Natl. Acad. Sci. 95: 14570-14575. [DOI] [PMC free article] [PubMed] [Google Scholar]
- 43.Theologis A., Ecker, J.R., Palm, C.J., Federspiel, N.A., Kaul, S., White, O., Alonso, J., Altafi, H., Araujo, R., Bowman, C.L., et al. 2000. Chromosome 1 of Arabidopsis thaliana. Nature 408: 816-820. [DOI] [PubMed] [Google Scholar]
- 44.Weisshaar B. and Jenkins, G.I. 1998. Phenylpropanoid biosynthesis and its regulation. Curr. Opin. Plant Biol. 1: 251-257. [DOI] [PubMed] [Google Scholar]
- 45.Whalen M., Innes, R., Bent, A., and Staskawicz, B. 1991. Identification of Pseudomonas syringae pathogens of Arabidopsis thaliana and a bacterial gene determining avirulence on both Arabidopsis and soybean. Plant Cell. 3: 49-59. [DOI] [PMC free article] [PubMed] [Google Scholar]
- 46.Wilhem K.S. and Thomashow, M.F. 1993. Arabidopsis thaliana cor15b, an apparent homologue of cor15a, is strongly responsive to cold and ABA, but not drought. Plant Mol. Biol. 23: 1073-1077. [DOI] [PubMed] [Google Scholar]
Associated Data
This section collects any data citations, data availability statements, or supplementary materials included in this article.
Data Availability Statement
All data generated by this project, including PCR primer sequences and amplification data, as well as all primary and normalized hybridization intensities and specific gene lists can be found at http://atarrays.tigr.org/data/.


