

Abstract
Accumulating evidence, obtained largely in vitro, indicates that opioids regulate the genesis of neurons and glia and their precursors in the nervous system. Despite this evidence, few studies have assessed opioid receptor expression in identified cells within germinal zones or examined opioid effects on gliogenesis in vivo. To address this question, the role of opioids was explored in the subventricular zone (SVZ) and/or striatum of 2-5 day-old and/or adult ICR mice. The results showed that subpopulations of neurons, astrocytes, and oligodendrocytes in the SVZ and striatum differentially express μ, δ, and/or κ receptor immunoreactivity in a cell-type-specific and developmentally regulated manner. In addition, DNA synthesis was assessed by examining 5-bromo-2′-deoxyuridine (BrdU) incorporation into glial and non-glial precursors. In GFAP+ cells, morphine (a preferential μ agonist) significantly decreased BrdU-labeled astroglia compared to controls or mice co-treated with naltrexone plus morphine. Alternatively, in S100β+ cells, morphine did not significantly decrease BrdU incorporation; however, significant differences were noted between morphine and morphine plus naltrexone-treated mice. The majority of cells were non-GFAP+/non-S100β+. When BrdU incorporation was assessed within the total population (glia and non-glia), morphine had no net effect but naltrexone alone markedly increased BrdU incorporation. This suggests DNA synthesis in non-GFAP+/non-S100β+ cells is tonically suppressed by endogenous opioids. Assuming S100β and GFAP, respectively, distinguish among younger and older astroglia, this implies that astroglial replication becomes increasingly sensitive to morphine during maturation, and suggests that opioids differentially regulate the development of distinct subpopulations of glia and glial precursors.
Keywords: astrocytes, oligodendrocytes, cell division, subventricular zone, striatum, μ opioid receptors, δ opioid receptors, κ opioid receptors, central nervous system development, opiate drug abuse, glial fibrillary acidic protein, S100β, drug abuse
Introduction
There is abundant evidence that μ (OP2), δ (OP1), and κ (OP3) opioid receptors are present in the developing central nervous system (CNS) (Petrillo et al., 1987; Rothman et al., 1990; Barg and Simantov, 1991; Leslie and Loughlin, 1992; Leslie et al., 1998; Zhu and Pintar, 1998). These opioid binding sites appear to increase in number during postnatal development in both mice and rats (Tavani et al., 1985; Petrillo et al., 1987; Rothman et al., 1990). In vitro cultures of newborn rodent CNS cells have shown that heterogeneous subpopulations of astrocytes can express one or more opioid receptor types (Bunn et al., 1985; Maderspach and Solomonia, 1988; Eriksson et al., 1990; Stiene-Martin and Hauser, 1991; Eriksson et al., 1992; Ruzick et al., 1995; Stiene-Martin et al., 1998). Protein and/or mRNA for μ, δ, and/or κ receptors has been found in astrocyte cultures derived from different regions of the rat CNS (Ruzicka et al., 1995). Astrocytes, oligodendrocytes and/or microglia in the rat CNS in vivo and/or in vitro express κ receptors (Gurwell et al., 1996; Chao et al., 1996; Knapp et al., 1998; Tryoen-Toth et al., 1998). Investigations of mouse prenatal brain for opioid receptor mRNA found both μ and κ mRNA in the basal ganglia and mid brain by E11.5 with extension into other brain regions by mid to late gestation, whereas δ receptor mRNA expression was detectable but low during the late gestational period (Zhu et al., 1998). Little μ and no δ receptor mRNA was found in regions of neuronal proliferation prior to birth, but κ receptor mRNA was widely expressed in midbrain germinal centers (Leslie et al., 1998). Alternatively, subsets of germinal cells in the E16 mouse neocortical germinal zone possessed μ and/or κ receptor immunoreactivity while the distribution of δ receptor immunoreactivity among cells was more diffuse and less intense. Functional changes in the cell cycle were also seen following exposure to μ, δ, or κ agonists or naloxone, suggesting opioids were directly or indirectly affecting growth (Reznikov et al., 1999).
Based largely on cell culture studies, we and others have found that subpopulations of neurons and glia respond developmentally to μ, δ, and κ opioid receptor activation. More importantly, the pattern of opioid receptor expression and developmental response is cell-type specific. For example, astrocytes and oligodendrocytes both express μ receptors; however, in astrocytes μ receptor activation inhibits cell division, while μ receptor stimulation in oligodendrocytes is mitogenic (Stiene-Martin and Hauser, 1991; Hauser et al., 1996; Knapp et al., 1998). Depending on the particular cell target, opioids have been shown to enhance or restrict growth (Vértes et al., 1982; Dodge Miller et al., 1982; Zagon and McLaughlin, 1983; Kornblum, et al., 1987; Hauser et al., 1989; Stiene-Martin and Hauser, 1990; Bartolome et al., 1997) and this may result in part from the direct activation of mitogen-activated protein (MAP) kinase pathways via specific phosphotyrosine signaling events (Mangoura and Dawson, 1993; Wilson et al., 1997; Polakiewicz et al., 1998; Bohn et al., 2000a, b). Although expression of opioid receptors by glia in culture has been well documented, whether similar patterns of expression occur in vivo remains unclear. Glial fibrillary acidic protein (GFAP) has been a frequently used marker for differentiated type 1 astrocytes (Lee et al., 2000). S100β is a Ca2+ binding protein that preferentially labels astrocytes (Donato, 1999) but may additionally label limited numbers of neurons (Rickmann and Wolff, 1995), oligodendrocytes and Schwann cells (Brennan et al., 2000; Huttunen et al., 2000) and microglia (Adami et al., 2001). A potential advantage of S100β is that it may label astrocyte precursors that may be GFAP negative (Barger et al., 1992; Seifert et al., 1997). The purpose of this study was fourfold: (1) to assess whether μ, δ and κ opioid receptors are present in the immature murine subventricular zone (SVZ) and striatum; (2) to assess the ubiquity of opioid receptor expression in astrocytes (GFAP), oligodendrocytes (O4), or neurons (NeuN); (3) to compare patterns of receptor expression in immature and adult brains; and (4) to evaluate the effects of morphine on DNA synthesis in astrocytes.
Materials and Methods
Materials
Primary antibodies to δ, μ and κ receptors were obtained as follows: Rabbit anti δ opioid receptor was purchased from Chemicon, Inc., Temecula, CA. Rabbit anti μ opioid receptor (a gift from Dr. R. Elde) was generated against a synthetic peptide (NHQLENLEAETAPLP) corresponding to amino acids 384-398 of the cloned rat μ receptor (Arvidsson et al., 1995). Rabbit antibodies generated against the amino terminal region of the rat κ opioid receptor was obtained from PharMingen International. Anti-glial fibrillary acidic protein (GFAP) monoclonal mouse antibody was obtained from Boehringer-Mannheim, GmbH, Mannheim, Germany. A polyclonal anti GFAP made in rabbit was obtained from Chemicon International in Temecula, CA (AB5040). O4 rat IgM monoclonal antibody was a gift from Dr. M. Schachner. This antibody reacts almost exclusively with a sulfated galactolipid expressed specifically on the surface of oligodendrocytes and myelin (Bansal et al., 1989). Guinea pig anti-glutamate transporter, GLT-1 (GLAST) polyclonal antibody, mouse anti-neuronal nuclei (NeuN) monoclonal antibody, as well as mouse IgG1 anti-5-bromo-2′-deoxyuridine (BrdU) monoclonal antibody were all obtained from Chemicon International (Temecula, CA). Goat polyclonal anti S100β chain antibody was obtained from Santa Cruz Biotechnology, Inc (Santa Cruz, CA).
Secondary antibodies included Cy2 and Cy3 conjugates and biotinylated antibodies obtained from Jackson ImmunoResearch Laboratories (West Grove, PA). Anti-rabbit IgG in goat conjugated to Alexa ™488 fluorochrome, and streptavidins conjugated to either Alexa™ 350 or to Alexa™488 were all obtained from Molecular Probes, Eugene, OR.
Both morphine sulfate and 5-bromo-2′-deoxy uridine (BrdU) were obtained from Sigma (St. Louis, MO); and, naltrexone HCl was purchased from Research Biochemicals International (Natick, MA). The polyethylene glycol resin embedding media (ProLong™) was obtained from Sakura Finitek USA (Torrence, CA).
Opioid Drug Effects on DNA Synthesis
Postnatal day (P) 4-5 mouse pups from the same litter were arbitrarily assigned to a saline control, morphine (20 mg/kg), morphine (20 mg/kg) + naltrexone (60 mg/kg), or naltrexone (60 mg/kg) treatment group. Pups were weighed and injected subcutaneously with the above opioid drugs (dissolved in 200-μl saline) using a 30-gauge needle (Hamilton). Pups receiving morphine + naltrexone were pretreated with naltrexone 30 min before morphine injection. Pups were then returned to their home cage and mother. 3.5 h following opioid drug exposure, pups were reweighed, injected with BrdU (75-mg/kg i.p.) using a 30-gauge syringe, and allowed to recover for 1 h. Following 1 h of BrdU exposure (4.5 h following opioid drug exposure), pups were euthanized by inhalation of ether vapor followed by intracardiac perfusion as described below.
To minimize the inherent variability among animals and in histochemical procedures, the above design was repeated across pups from the same litter and in identically processed tissue sections. The above design was repeated six times (n = 6).
Tissue Preparation
P2-5 ICR mouse pups and 8 month old adult ICR mice (Harlan Sprague Dawley, IN) were euthanized by exposure to ether vapors according to NIH and IACUC guidelines and perfused through the heart with Zamboni's fixative (Zamboni et al., 1967) containing 4% paraformaldehyde. After perfusion, the brains were removed and placed in Zamboni's fixative for 18-24 h at 4° C (pH 7.2). The brains were washed in four changes of phosphate buffered saline (PBS) over 6 h and then placed into 10% sucrose overnight at 4° C. This was followed by another 2-4 h wash in PBS.
Brains were cut at the midline on a sagittal plane and right and left-brains were embedded in polyethylene glycol and resins. The embedded tissue was quick-frozen on dry ice and maintained at -80° C until sectioned.
One side of the brain was used for all sections stained with GFAP whereas the opposite side was used for all sections stained with S100β chain. Frozen serial sections (16 μm thick) were cut using a cryostat and thaw-mounted onto SuperFrost (Fisher Scientific, Pittsburgh PA) slides (4-6 sections per slide). Serial sections were treated sequentially for μ-, δ-, or κ-immunocytochemistry or stained with cresyl violet so that no section was more than 32 μm from its cresyl-violet stained counterpart. Cresyl-violet stained sections were examined light microscopically to verify anatomic position and to select the best slides for immunofluorescence.
Immunocytochemistry
Co-localization of opioid receptors and GFAP or O4
Slides (controls are described separately) were post-fixed in Zamboni's fixative for 35 min and washed four times in PBS on a rotator (125 rpm). 1.5% goat serum and 0.1% bovine serum albumin (BSA) in PBS with 0.1% Triton-X-100 was used to reduce nonspecific binding. The primary antibodies against the δ-, κ-, and μ-opioid receptors were diluted 1:1000, 1:500 and 1:2000 respectively. Sections were incubated with primary antibodies overnight at 4° C. Secondary antibodies consisting of anti-rabbit IgG in goat conjugated to Alexa™488 (1:250 dilution) were placed over the sections for 45 min. The sections were then incubated for at least 1 hour in either anti-GFAP monoclonal antibodies (1:600 dilution), or monoclonal rat IgM antibodies against O4 (1:2 dilution). The secondary antibody for GFAP was an anti-mouse IgG in goat conjugated to Cy3 fluorochrome (1:250 dilution) and incubated for 45 minutes at room temperature. The secondary antibodies for O4 were anti rat IgM in goat conjugated to Cy3 fluorochrome (1:250 dilution) also incubated for 45 minutes at room temperature.
Combined detection of opioid receptors, NeuN and glutamate transporter (GLAST)
Tissue sections were initially treated as described to detect opioid receptors (controls will be described separately). To detect GLAST, sections were incubated in guinea pig anti GLAST polyclonal antibodies (1:4000 dilution) overnight at 4° C. Sections were then covered with biotinylated goat anti guinea pig IgG (1:250 dilution) for 1 h at room temperature. The reaction was visualized using streptavidin, Alexa™350 conjugate (10 μg/ml) for 1 h at room temperature. To detect NeuN, sections were incubated with mouse anti-neuronal nuclei (NeuN) monoclonal antibodies (1:100 dilution) for at least 1 h at room temperature. Anti mouse IgG conjugated to Cy3 fluorochrome (1:250 dilution, 1 h at room temperature) was used to visualize NeuN antigenicity.
Combined detection of BrdU, with GFAP, or S100β and Cell Nuclei
Sections were incubated for at least four hours in ice-cold 70% ethanol. After washing, the DNA was denatured by incubating the sections for 30 min in 2N HCl followed by three 3 min washes in 0.1 M borate buffer (pH 8.5) and three 10 min washes in PBS with 0.1% Triton-X-100. Sections were covered with a 1:100 dilution of mouse anti BrdU and incubated overnight at 4° C. The secondary antibody was a 1:200 dilution of anti-mouse in goat (or donkey) conjugated to Cy3. Astrocyte labeling consisted of a 1:500 dilution of anti-GFAP polyclonal antibodies in rabbit overnight at 4° C. The secondary antibody was a 1:200 dilution of biotinylated anti-rabbit IgG in goat for 45 min and the antibody-antigen reaction was visualized with streptavidin conjugated to Alexa™488. Goat anti-S100β antisera (1:10 dilution) was used to detect immature astrocytes. Donkey anti-goat IgG (1:100 dilution) conjugated to Cy2 was used to visualize S100β immunoproduct. Nuclear labeling (Hoechst 33342) was diluted to 15 μg/ml and the sections were incubated for 15 min after which they were rinsed.
After the final wash, the slides were air dried in the dark and coverslipped with ProLong™ antifade mounting media. They were maintained in the dark until examined.
Immunocytochemical Controls
All batches of immunocytochemical stains were accompanied by slides of tissue sections on which each of the primary antibodies was omitted. These were included to assure specificity of each antibody and to evaluate background staining. The opioid receptor antibodies were originally characterized by Western blot analysis, by examining immunoreactivity in known (positive and negative) opioid-receptor expressing regions throughout the brain and/or by co-localization with other markers in chimeric receptors transfected into test cells (Arvidsson et al., 1995; Stiene-Martin et al., 1998).
Quantitative Determinations
Opioid Receptor Localization in Neurons and Glia
Sections were examined using both a Nikon fluorescent inverted microscope with attached digital camera (Spot 2; Diagnostic Instruments, Inc.) and a confocal microscope (Leica, Model TCS SP). Nissl stained slides were used to aid in locating the structures. Three or four adjacent areas of 100 square μm, each containing 30-100 cells per area, were sampled in each of 6 sections from the SVZ (four fields adjacent to the lateral ventricle and four fields 200 μm in from the lateral ventricle) and striatum (200 μm from the corpus callosum) per animal. Thus, a total of about 1000 cells were sampled for each marker in the SVZ and 600 cells per marker in the striatum. The mean ± SEM were calculated from three or typically four mice.
BrdU Detection in Astrocytes
Sections were examined using a Nikon Microphot-SA fluorescent microscope with a stage micro-coder (Boeckeler Instruments) and digital camera (Carl Zeiss, Inc). Nissl (cresyl violet) stained slides were used to aid in locating the structures. Computer-aided image analysis was used to define a 100 μm2 sampling area and record/track the x, y & z-axis positions of individual cells. Hoechst positive nuclei were counted for the total number of cells per field. BrdU positive nuclei, GFAP positive cells and S100β positive cells were counted. Percentages of total cells as well as the percentage of GFAP or S100β positive cells that were also BrdU positive were reported. Four fields each from the SVZ and striatum were arbitrarily sampled in 3-4 sections per mouse. The total number of cells sampled was about 1000 cells in the SVZ and 800 in the striatum per mouse. Four to six mice were analyzed per group.
Statistical Analysis
To minimize the inherent variability in the immunohistochemical procedures, comparisons between treatments were made between pups from the same litter and in tissue sections that had been processed simultaneously.
Data were reported as the mean ± SEM. Significant overall differences among experimental groups were assessed using ANOVA. When overall differences were noted by ANOVA (P<0.05), individual group differences were compared post hoc using Newman-Keuls test.
Results
Opioid Receptor Localization in Astroglia and Oligodendroglia of P5 Animals
SVZ
In the SVZ, 4.6% ± 0.3 of the cells possessed GFAP (Fig.1) and 7.7% ± 1.4 expressed O4 immunoreactivity (Fig.2). When opioid phenotype was considered for all SVZ cells (glia and non-glia), μ opioid receptors were the most abundant opioid receptor type (37.8% ± 1.6), whereas δ and κ receptors were present in less than 3% of the cells (Table 1). Glia in the SVZ did not display δ or κ opioid receptor immunoreactivity, although a few glia possessed μ receptor immunoreactivity. 14.2% ± 3.0 of GFAP+ cells coexpressed μ opioid receptor immunofluorescence (Table 2), while 37.5 % ± 5.0 of O4+ cells coexpressed μ receptors (Table 3).
Figure 1.

Photomicrographs showing combined glial fibrillary acidic protein (GFAP) and μ or κ receptor immunofluorescent cells in postnatal day 5 mice. Subpopulations of immature astrocytes (GFAP, red immunofluorescence) within the subventricular zone (SVZ) co-express μ (Mu, green immunofluorescence) (A) or κ (Kappa, green immunofluorescence) (B) opioid receptor immunoreactivity (arrows). Similarly, subpopulations of striatal astrocytes co-express μ (C, E) or κ (D, F) immunofluorescence (arrows). E & F are confocal images, while the images in A-D were obtained by standard fluorescence microscopy. Scale bar in A = 25 μm. A-D and F are the same magnification. Scale bar in E = 50μm
Figure 2.
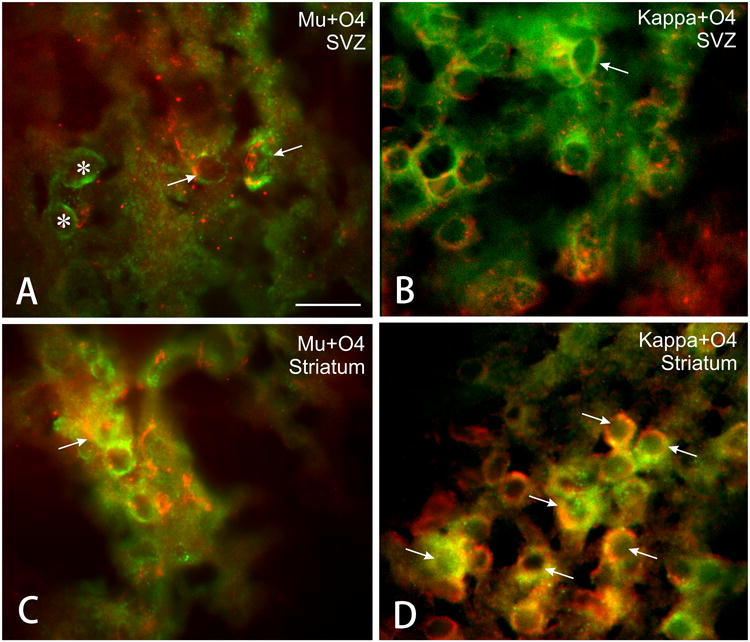
Photomicrographs showing combined O4 and either μ or κ-opioid receptor immunofluorescence in cells from postnatal day 5 mice. Arrows indicate examples of immature oligodendrocytes (O4 positive, red fluorescence) that express μ or κ opioid receptors (green fluorescence), while other non-oligodendroglial cells types are positive for μ opioid receptors (asterisks) Scale bar = 25 μm.
Table 1. Cells in immature (P5) and adult (8mo.) murine brains expressing opioid receptors in SVZ and Striatum. Expressed as percent of total cells ± S.E.M.
| P5 | Adult | |
|---|---|---|
| SVZ | ||
| μ-receptor | 37.8 ± 1.6* | 8.3 ± 3.8 |
| δ-receptor | 2.9 ± 1.0* | 7.9 ± 1.6 |
| κ-receptor | 2.0 ± 1.2§ | 17.7 ± 6.1 |
| Striatum | ||
| μ-receptor | 22.7 ± 4.9 | 11.3 ± 2.3 |
| δ-receptor | 4.6 ± 1.8 | 10.2 ± 1.0 |
| κ-receptor | 10.2 ± 3.7 | 24.6 ± 7.4 |
P< 0.05 versus adult, t test;
P<0.05 versus adult, Mann-Whitney U test
Table 2. Percentage of differentiated astroglia (GFAP+ cells) in immature (P5) and adult (8 mo) murine brains expressing opioid receptors ± S.E.M.
| P5 | Adult | |
|---|---|---|
| SVZ | ||
| μ-receptor | 14.2 ± 3.0* | 2.1 ± 2.0 |
| δ-receptor | 2.5 ± 2.5* | 20.7 ± 1.9 |
| κ-receptor | 3.3 ± 3.0* | 21.5 ± 4.3 |
| Striatum | ||
| μ-receptor | 39.3 ± 13.5 | 4.3 ± 4.0 |
| δ-receptor | 6.2 ± 3.3* | 25.9 ± 5.6 |
| κ-receptor | 34.7 ± 16.4 | 43.4 ± 6.6 |
P <0.05 versus adult, t test
Table 3. Percentage of Oligodendroglia (O4+ cells) in immature (P5) and adult (8 mo) murine brains expressing opioid receptors ± S.E.M.
| P5 | Adult | |
|---|---|---|
| SVZ | ||
| μ-receptor | 37.5 ± 5.1 | 44.0 ± 8.0 |
| δ-receptor | 10.0 ± 8.0 | 26.0 ± 8.0 |
| κ-receptor | 29.3 ± 11.0 | 37.0 ± 5.01 |
| Striatum | ||
| μ-receptor | 46.0 ± 10.0 | 35.0 ± 4.7 |
| δ-receptor | 13.2 ± 11.0 | 26.7 ± 7.1 |
| κ-receptor | 33.0 ± 10.7 | 17.7 ± 5.1 |
Striatum
μ-Opioid receptors were also the most abundant opioid receptor type in striatal cells; however, the percentage was about one half of that seen in the SVZ (Table 1). Expression of δ and κ receptors was slightly greater in the striatum than the SVZ. The δ receptor, however, was present in less than 5% of cells, while only about 10% of cells expressed κ receptors. There was more than a two-fold increase in total GFAP positive cells (12.3% ± 1.9) and almost a twofold increase in total O4 positive cells (13.0% ± 1.5) when compared to the SVZ. Co-labeling with GFAP was also increased in the striatum compared to the SVZ. 39.3 ± 13.5% of GFAP+ cells co-expressed μ receptors, 34.7% ± 16.4 co-expressed κ receptors, and 6.2% ± 3.3 co-expressed δ receptors (Table 2). There was little difference in oligodendrocyte colabeling between the two areas (Table 3).
Opioid Receptor Localization in Neurons and GLAST-Immunoreactive Cells
SVZ
Neurons could be detected adjacent to the few interspersed GLAST positive cells (Fig. 3). About 30% of all cells were labeled with μ receptor and 3-5% exhibited GLAST positivity. μ-Receptors could be found in both GLAST and NeuN immunoreactive cells, while δ or κ receptor-positive cells were not apparent.
Figure 3.

(A-C) Photomicrographs showing combined neuronal nuclear (NeuN), glutamate transporter (GLAST) and μ-opioid receptor immunofluorescence. Subpopulations of both neurons (red nuclear fluorescence) and astroglia (blue fluorescence) express μ receptors (green fluorescence). Arrows show μ receptor immunoreactive neurons, while the asterisk indicates a GLAST positive cell that lacks μ receptors. Panel A is a low power view (scale bar = 20 μm). The dashed lines in A represent the borders of the lateral ventricle. Panel D shows combined BrdU immunofluorescence (red), GFAP immunofluorescence (green), and nuclear counterstaining using Hoechst 33342 (blue). Arrows indicate GFAP positive astrocytes labeled with BrdU (the dashed line is for orientation and parallels the lateral ventricle). Panel E shows combined BrdU immunofluorescence (red), S100β immunofluorescence (green) and nuclear counterstaining (blue). Arrows indicate S100β positive astrocytes labeled with BrdU. Panels B through E are the same magnification; scale bar in B = 25 μm.
Striatum
Almost 80% of the cells were NeuN positive neurons, while about 10% of cells were GLAST positive. Because GLAST may be particularly ambiguous as an astroglial marker (Domercq et al., 1999; Weickert et al., 2000; Lee et al., 2000; Plachez et al., 2000), we limited further assessment of this marker.
Effects of Opioids on DNA Synthesis in Astroglia
DNA synthesis was assessed by determining the proportion of cells incorporating BrdU (BrdU labeling index). BrdU labeled nuclei were counted both as a percentage of total cells and as a percentage of either GFAP or S100β immunoreactive astroglia. The data from the SVZ and striatum were compressed into a single value, because similar trends were noted in both regions and to increase the sample size (Fig. 5). The results indicate that opioids alter DNA synthesis in astroglial as well as non-astroglial cells. Morphine tended to have an inhibitory effect on BrdU incorporation into S100β labeled cells (Fig. 5). Naltrexone administration alone significantly increased the percentage of BrdU positive cells when all cells were considered together. A significant difference was observed between morphine and naltrexone treated animals (P< 0.01).
Figure 5.

Effect of morphine and/or naltrexone on bromodeoxyuridine (BrdU) incorporation in glial fibrillary acidic protein (GFAP) and S100β expressing cells in postnatal day 5 mouse brain. Panel A indicates the percentage of S100β-expressing cells that were co-labeled with BrdU. Morphine exposure significantly decreased the proportion of S100β+ cells compared to morphine plus naltrexone treated mice (#P<0.05). Panel B indicates the percentage of GFAP+ cells that were co-labeled with BrdU. Morphine treatment caused a significant decrease in GFAP+ astrocytes incorporating BrdU compared to vehicle-treated controls (*P<0.05) or mice treated with naltrexone (#P<0.05)
In our hands, there were some differences between GFAP and S100β markers. S100β seemingly detected slightly more immature astrocytes than GFAP, since the BrdU labeling index tended to be higher in S100β compared to GFAP+ cells in control mice (Fig.5).
Morphine caused a significant decrease in the percentage of BrdU positive GFAP+ cells (P<0.005 versus saline-injected controls) (Fig 5). There was a decrease in the percentage of BrdU positive cells that were S100β+ (astrocytes and their precursors) in morphine treated mice (P< 0.005 versus animals treated with both morphine and naltrexone) (Fig 5).
Last, neither acute morphine nor naltrexone exposure affected the total percentage of GFAP positive cells. The proportion of GFAP positive cells was 8.0 ± 1.2 in control mice, 5.8 ± 2.0 in morphine treated mice, 8.4 ± 1.2 in naltrexone treated mice, and 8.6 ± 1.2 in animals treated with both naltrexone and morphine. Likewise, the total percentage of S100β cells was not significantly different following acute opioid treatments. The percent of S100β positive cells was 7.5 ± 0.8 in control mice, 7.2 ± 0.3% in morphine treated mice, 6.9 ± 0.4% in naltrexone treated animals, and 6.5 ± 0.4% in animals receiving both naltrexone and morphine. This was important because it indicated that acute (4-5 h) opioid exposure did not affect GFAP or S100β expression, which would potentially confound our ability to count cells expressing those markers. It is assumed that with more prolonged exposure; opioid induced changes in cell cycle would eventually be manifested as changes in cell numbers.
Opioid Receptor Localization in Mature Astroglia
In general, the proportion of cells displaying μ receptors in the SVZ and striatum declined in adults compared to P5 mice (Table 1). Similarly, the proportion of GFAP+ astrocytes possessing μ receptors in the SVZ of P5 mice (14.2% ± 2.1) declined significantly in adults (2.1% ± 3.0) (Table 2) whereas oligodendrocytes possessing μ receptors remained essentially the same in the SVZ between P5 and adult animals (Table 3). Significant age-related changes in the proportion of μ receptor-expressing astroglia or oligodendroglia were not detected in the striatum. The considerable variability in measurements at P5 suggests, perhaps, that P5 is a critical period of dramatic change in the expression of this receptor type. Unlike μ receptors, the proportion of δ or κ expressing cells in the SVZ tended to increase with maturation and this trend was noted in both astrocytes and oligodendrocytes. Alternately, the proportion of κ opioid receptor-immunofluorescent astrocytes did not change significantly in the striatum and κ expressing oligodendrocytes decreased slightly in the striatum (Tables 2 and 3). Because their overall numbers are small, opioid receptor immunoreactive astrocytes and oligodendrocytes represent a relatively small proportion of total cells in the SVZ and striatum.
Discussion
The results indicate that μ, δ, and κ opioid receptor immunoreactivity is present in subpopulations of neurons, astrocytes and oligodendrocytes in vivo. Moreover, pharmacological manipulation of the opioid system affected DNA synthesis in replicating cells including astroglia, suggesting that opioid receptor immunoreactivity identifies functional receptors that are coupled to cellular development. In these studies, morphine and/or naltrexone exposure differentially affected BrdU incorporation in populations of GFAP- or S100β- expressing cells, as well as in cells lacking the astrocytic markers. The diversity of opioid peptides and receptor types, and the unique temporal patterns of expression by subsets of proliferating glial precursors, may strategically position the opioid system to coordinate the development of these heterogeneous cell types.
Our in vivo data suggest that μ receptors are expressed by less mature cells in the SVZ, while cells in the striatum tended to express κ receptors. Although this may reflect regional differences, cell culture studies suggest the differences are related to maturation. In vitro, oligodendrocytes initially express μ receptors that are coupled to mitogenic signaling events, but later express κ receptors that influence oligodendrocyte differentiation (Knapp et al., 1998; Tryoen-Toth et al, 1998). Moreover, the expression of μ receptor mRNA by oligodendrocytes is developmentally regulated and declines with progressive maturation in vitro (Tryoen-Toth et al., 2000). Likewise, cultured oligodendrocytes uniformly expressed μ and later κ receptors, but failed to express δ receptors at any time in vitro (Knapp et al., 1998). These in vivo studies do not show significant decreases in oligodendrocyte μ receptors with age and although only a few oligodendrocytes expressed δ receptors in the immature animal, the percentage of oligodendroglia expressing δ opioid receptors tended to increase in the adult. The differences between these results and previous in vitro studies may be a result of one or more of the following: 1) the specific areas examined in vivo may not correlate totally with the sources of oligodendrocytes in culture; 2) the fact that relatively few oligodendrocytes in this study were sampled compared to neurons and astrocytes, whereas culture conditions are frequently manipulated to select oligodendrocytes; or 3) the local environmental milieu lost in vitro might influence opioid receptor expression by oligodendrocytes.
Our data additionally provide novel evidence that opiates regulate DNA synthesis in both GFAP- and S100β-immunoreactive astroglia in vivo. Previous studies have showed that opiates inhibit [3H]-thymidine incorporation in brain regions and/or at stages of development in which the proliferating cells are predominately glia, but failed to positively identify the particular glial type that was responding (Schmahl et al., 1989; Zagon and McLaughlin, 1991). With the discovery that oligodendrocytes express μ receptors, and realization that opioids increase DNA synthesis nearly 3-fold in oligodendroglia, but inhibit mitosis in cultured astrocytes (Stiene-Martin and Hauser, 1991; Knapp et al, 1998), it became imperative to identify the particular cell types responding to opioids in vivo. Our data further suggest that endogenous opioids are present that can tonically inhibit DNA synthesis in GFAP-immunoreactive astroglia, since significant differences were noted between morphine and naltrexone-treated groups but not in mice treated with morphine alone. Numerous earlier studies have found that tonic blockade of endogenous opioid-receptors is sufficient to affect development, (e.g., Zagon and McLaughlin, 1983; Hauser et al., 1989; Hauser and Stiene-Martin, 1993). Moreover, the influence of tonically acting, endogenous opioids was even more evident in the non-GFAP-expressing population of SVZ cells since naltrexone alone increased DNA synthesis, while morphine had no effect on BrdU incorporation in these cells. The identity of these cells needs to be investigated in future studies.
In the present study, substantial numbers of cells demonstrated μ receptors in the proliferating area of the SVZ, whereas the percentages decreased by almost half between the SVZ and the more differentiated striatum. Moreover, there was a decline in the proportion of μ receptor-expressing cells in adult mice compared to younger animals (Table 1). The μ receptor has been associated with the regulation of the proliferation of cultured neurons (Bartolome et al., 1994; Hauser et al., 2000) and glia (Barg et al., 1994; Hauser et al., 1996; Knapp et al., 1998). Furthermore, it has long been reported that opioid drugs of abuse, which are typically preferential μ receptor agonists, can interfere with neural cell division (Hauser and Stiene-Martin, 1993; Eisch et al., 2000). In contrast to the role of μ opioid receptors in cell replication, κ receptors show a very different pattern of spatial and temporal maturation. This suggests that μ and κ receptors influence different aspects of development. There is considerable evidence that κ receptors affect cell proliferation, differentiation and/or neuroprotection differently from μ receptors (Tortella and DeCoster, 1994; Knapp et al., 1998; Boutin et al., 1999; Hauser et al., 1999; Chao et al., 2000), and that in many instances μ and κ opioid receptors mediate opposing actions in developing neural cells (Pan et al., 1998).
Only a very small fraction of cells within the subventricular zone of the P5 animal possess δ receptors and the fraction remains small in the striatum. This was surprising because δ opioid receptor agonists, such as Met- and Leu-enkephalin, have been reported to inhibit the proliferation of astroglia isolated from the cerebral forebrain (Stiene-Martin and Hauser, 1990; Zagon and McLaughlin, 1991). We did find significantly higher numbers of δ expressing cells in the adult animal. Several studies show that δ opioid receptors appear relatively late during development compared to μ or κ receptors (Spain et al., 1985; Volterra el al., 1986; Petrillo et al., 1987; Kornblum et al., 1987; Hurlbut et al., 1987). In fact, weaning at P21 appears to significantly increase δ opioid binding in the rat brain (Kelly et al., 1998). Importantly, detailed spatiotemporal patterns of δ receptor expression are just beginning to be systematically described in the germinative zones. (Leslie et al., 1998; Zhu et al., 1998b).
The significance of the diversity of opioid receptor expression among the various cell types is unclear. Based on findings that opioid receptor activation can regulate cellular development, it seems probable that the varied patterns of opioid receptor and peptide expression within diverse cell types permit the simultaneous and coordinated control of development within heterologous subpopulations of cells. Moreover, findings that many neural precursors likely express μ receptors and that morphine acutely alters astroglial development, prompt speculation that chronic opiate drug exposure might cause lasting changes in neural function by disrupting gliogenesis. Interestingly, infant rats made tolerant and dependent to fentanyl from P14-P17, but not exposed thereafter, show lasting tolerance to morphine as juveniles and young adults (Thornton and Smith, 1998). These novel findings suggest that brief exposure to opiate drugs at critical periods during development permanently alter the CNS. Equally interesting, Nestler and coworkers provide compelling evidence that opioid control of neurogenesis may not be limited to the developing nervous system (Eisch et al., 2000). These provocative studies show that chronic heroin or morphine inhibit neurogenesis in the adult hippocampus and suggests that the brain remains highly plastic and modifiable by opioids throughout life.
Figure 4.

Effect of morphine and/or naltrexone on bromodeoxyuridine (BrdU) incorporation in total cells within the postnatal day 5-mouse brain. BrdU-labeling indices were assessed in cells in which BrdU and Hoechst 33342 were co-localized. BrdU labeled cells are expressed as a percentage of total cells (BrdU plus non-BrdU-labeled cells). There was a significant difference in BrdU labeling between morphine treated and naltrexone treated mice (*P<0.01).
References
- Adami C, Sorci G, Blasi E, Egneletti AL, Bistoni F, Donato R. S100β expression in and effects on microglia. Glia. 2001;33:131–142. [PubMed] [Google Scholar]
- Arvidsson U, Riedl M, Chakrabarti S, Lee JH, Nakano AH, Dado RJ, Loh HH, Law PY, Wessendorf MW, Elde R. Distribution and targeting of a μ-opioid receptor (MOR1) in brain and spinal cord. J Neurosci. 1995;15:3328–3341. doi: 10.1523/JNEUROSCI.15-05-03328.1995. [DOI] [PMC free article] [PubMed] [Google Scholar]
- Bansal R, Warrington A, Gard A, Ranscht B, Pfeiffer S. Multiple and novel specificities of monoclonal antibodies O1, O4, and R-mab used in the analysis of oligodendrocyte development. J Neurosci Res. 1989;24:548–557. doi: 10.1002/jnr.490240413. [DOI] [PubMed] [Google Scholar]
- Barg J, Belcheva M, McHale R, Levy R, Vogel Z, Coscia CJ. Beta-endorphin is a potent inhibitor of thymidine incorporation into DNA via mu- and kappa-opioid receptors in fetal rat brain cell aggregates in culture. J Neurochem. 1993;60:765–767. doi: 10.1111/j.1471-4159.1993.tb03214.x. [DOI] [PMC free article] [PubMed] [Google Scholar]
- Barg J, Belcheva MM, Zimlichman R, Levy R, Saya D, Mchale RJ, Johnson FE, Coscia CJ, Vogel Z. Opioids inhibit endothelin-mediated DNA synthesis, phosphoinositide turnover, and Ca2+ mobilization in rat C6 glioma cells. J Neurosci. 1994;14:5858–5864. doi: 10.1523/JNEUROSCI.14-10-05858.1994. [DOI] [PMC free article] [PubMed] [Google Scholar]
- Barg J, Simantov R. Transient expression of opioid receptors in defined regions of developing brain: Are embryonic receptors selective. J Neurochem. 1991;57:1978–1984. doi: 10.1111/j.1471-4159.1991.tb06412.x. [DOI] [PubMed] [Google Scholar]
- Bartolome JV, Alicke B, Bartolome MB. Central administration of morphine inhibits brain and liver ornithine decarboxylase activity in neonatal rats: involvement of transcription- and non-transcription-dependent mechanisms. Eur J Pharmacol. 1997;331:145–153. doi: 10.1016/s0014-2999(97)01045-5. [DOI] [PubMed] [Google Scholar]
- Bartolome JV, Lorber BA, Bartolome MB. Brain cholecystokinin and β-endorphin systems may antagonistically interact to regulate tissue DNA synthesis in rat pups. Brain Res. 1994;661:19–24. doi: 10.1016/0006-8993(94)91175-4. [DOI] [PubMed] [Google Scholar]
- Bohn LM, Belcheva MM, Coscia CJ. Mitogenic signaling via endogenous kappa-opioid receptors in C6 glioma cells: evidence for the involvement of protein kinase C and the mitogen-activated protein kinase signaling cascade. J Neurochem. 2000a;74:564–573. doi: 10.1046/j.1471-4159.2000.740564.x. [DOI] [PMC free article] [PubMed] [Google Scholar]
- Bohn LM, Belcheva MM, Coscia CJ. Mu-opioid agonist inhibition of kappa-opioid receptor-stimulated extracellular signal-regulated kinase phosphorylation is dynamin-dependent in C6 glioma cells. J Neurochem. 2000b;74:574–581. doi: 10.1046/j.1471-4159.2000.740574.x. [DOI] [PMC free article] [PubMed] [Google Scholar]
- Boutin H, Dauphin F, MacKenzie ET, Jauzac P, Koehler RC. Differential Time-Course Decreases in Nonselective, micro-, delta-, and kappa-Opioid Receptors After Focal Cerebral Ischemia in Mice. Stroke. 1999;30:1271–1278. doi: 10.1161/01.str.30.6.1271. [DOI] [PubMed] [Google Scholar]
- Brennan A, Dean CH, Zhang AL, Cass DT, Mirsky R, Jessen KR. Endothelins control the timing of Schwann cell generation in vitro and in vivo. Dev Biol. 2000;227:545–577. doi: 10.1006/dbio.2000.9887. [DOI] [PubMed] [Google Scholar]
- Bunn SJ, Hanley MR, Wilkin GP. Evidence for a kappa-opioid receptor on pituitary astrocytes: an autoradiographic study. Neurosci Lett. 1985;55:317–323. doi: 10.1016/0304-3940(85)90455-0. [DOI] [PubMed] [Google Scholar]
- Chao CC, Gekker G, Hu S, Sheng WS, Shark KB, Bu DF, Archer S, Bidlack JM, Peterson PK. kappa opioid receptors in human microglia downregulate human immunodeficiency virus 1 expression. Proc Natl Acad Sci USA. 1996;93:8051–8056. doi: 10.1073/pnas.93.15.8051. [DOI] [PMC free article] [PubMed] [Google Scholar]
- Chao CC, Hu S, Gekker G, Lokensgard JR, Heyes MP, Peterson PK. U50,488 protection against HIV-1-related neurotoxicity: involvement of quinolinic acid suppression. Neuropharmacology. 2000;39:150–160. doi: 10.1016/s0028-3908(99)00063-5. [DOI] [PubMed] [Google Scholar]
- Davila-Garcia MI, Azmitia EC. Effects of acute and chronic administration of leu-enkephalin on cultured serotonergic neurons: evidence for opioids as inhibitory neuronal growth factors. Dev Brain Res. 1989;49:97–103. doi: 10.1016/0165-3806(89)90062-x. [DOI] [PubMed] [Google Scholar]
- Dodge Miller CR, O'Steen WK, Deadwyler SA. Effect of morphine on 3H-thymidine incorporation in the subependyma of the rat: an autoradiographic study. J Comp Neurol. 1982;208:209–214. doi: 10.1002/cne.902080209. [DOI] [PubMed] [Google Scholar]
- Domercq M, Sanchez-Gomez MV, Areso P, Matute C. Expression of glutamate transporters in rat optic nerve oligodendrocytes. Eur J Neurosci. 1999;11:2226–2236. doi: 10.1046/j.1460-9568.1999.00639.x. [DOI] [PubMed] [Google Scholar]
- Donato R. Functional roles of S100 proteins, calcium binding proteins of the EF-hand type. Biochim Biophys Acta. 1999;1450:191–231. doi: 10.1016/s0167-4889(99)00058-0. [DOI] [PubMed] [Google Scholar]
- Eisch AJ, Barrot M, Schad CA, Self DW, Nestler EJ. Opiates inhibit neurogenesis in the adult rat hippocampus. Proc Natl Acad Sci USA. 2000;97:7579–7584. doi: 10.1073/pnas.120552597. [DOI] [PMC free article] [PubMed] [Google Scholar]
- Eriksson PS, Hansson E, Rönnbäck L. δ and kappa opiate receptors in primary astroglial cultures from rat cerebral cortex. Neurochem Res. 1990;15:1123–1126. doi: 10.1007/BF01101714. [DOI] [PubMed] [Google Scholar]
- Eriksson PS, Hansson E, Rönnbäck L. δ and kappa opiate receptors in primary astroglial cultures. Part II: Receptor sets in cultures from various brain regions and interactions with b-receptor activated cyclic AMP. Neurochem Res. 1992;17:545–551. doi: 10.1007/BF00968781. [DOI] [PubMed] [Google Scholar]
- George SR, Zastawny RL, Briones-Urbina R, Cheng R, Nguyen T, Heiber M, Kouvelas A, Chan AS, O'Dowd BF. Distinct distributions of mu, delta and kappa opioid receptor mRNA in rat brain. Biochem Biophys Res Commun. 1994;205:1438–1444. doi: 10.1006/bbrc.1994.2826. [DOI] [PubMed] [Google Scholar]
- Gurwell JA, Duncan MJ, Maderspach K, Stiene-Martin A, Elde RP, Hauser KF. κ-Opioid receptor expression defines a phenotypically distinct subpopulation of astroglia: relationship to Ca2+ mobilization, development, and the antiproliferative effect of opioids. Brain Res. 1996;737:175–187. doi: 10.1016/0006-8993(96)00728-7. [DOI] [PMC free article] [PubMed] [Google Scholar]
- Hauser KF, Foldes JK, Turbek CS. Dynorphin A (1-13) neurotoxicity in vitro: Opioid and non-opioid mechanisms in spinal cord neurodegeneration. Exp Neurol. 1999;160:361–375. doi: 10.1006/exnr.1999.7235. [DOI] [PMC free article] [PubMed] [Google Scholar]
- Hauser KF, Houdi AA, Turbek CS, Elde RP, Maxson W., III Opioids intrinsically inhibit the genesis of mouse cerebellar granule cell precursors in vitro: Differential impact of m and d receptor activation on proliferation and neurite elongation. Eur J Neurosci. 2000;12:1282–1295. doi: 10.1046/j.1460-9568.2000.01015.x. [DOI] [PMC free article] [PubMed] [Google Scholar]
- Hauser KF, McLaughlin PJ, Zagon IS. Endogenous opioid systems and the regulation of dendritic growth and spine formation. J Comp Neurol. 1989;281:13–22. doi: 10.1002/cne.902810103. [DOI] [PubMed] [Google Scholar]
- Hauser KF, Stiene-Martin A. Opiates and the regulation of nervous system development: Evidence from in vitro studies. In: Hammer RP Jr, editor. Neurobiology of Opiates. Boca Raton, Florida: CRC Press; 1993. pp. 23–61. [Google Scholar]
- Hauser KF, Stiene-Martin A, Mattson MP, Elde RP, Ryan SE, Godleske CC. μ-Opioid receptor-induced Ca2+ mobilization and astroglial development: Morphine inhibits DNA synthesis and stimulates cellular hypertrophy through a Ca2+-dependent mechanism. Brain Res. 1996;720:191–203. doi: 10.1016/0006-8993(96)00103-5. [DOI] [PMC free article] [PubMed] [Google Scholar]
- Heizmann CW. Ca2+ binding S100 proteins in the central nervous system. Neurochem Res. 1999;24:1097. doi: 10.1023/a:1020700117665. [DOI] [PubMed] [Google Scholar]
- Hurlbut DE, Evans CJ, Barchas JD, Leslie FM. Pharmacological properties of a proenkephalin A-derived opioid peptide: BAM 18. Eur J Pharmacol. 1987;138:359–366. doi: 10.1016/0014-2999(87)90474-2. [DOI] [PubMed] [Google Scholar]
- Kelly MD, Hill RG, Borsodi A, Toth G, Kitchen I. Weaning-induced development of delta-opioid receptors in rat brain: differential effects of guanine nucleotides and sodium upon ligand- receptor recognition. Br J Pharmacol. 1998;125:979–986. doi: 10.1038/sj.bjp.0702142. [DOI] [PMC free article] [PubMed] [Google Scholar]
- Knapp PE, Maderspach K, Hauser KF. Endogenous opioid system in developing normal and jimpy oligodendrocytes: μ and κ opioid receptors mediate differential mitogenic and growth responses. Glia. 1998;22:189–201. doi: 10.1002/(sici)1098-1136(199802)22:2<189::aid-glia10>3.0.co;2-u. [DOI] [PubMed] [Google Scholar]
- Kornblum HI, Hurlbut DE, Leslie FM. Postnatal development of multiple opioid receptors in rat brain. Dev Brain Res. 1987;37:21–21. doi: 10.1016/0165-3806(87)90226-4. [DOI] [PubMed] [Google Scholar]
- Kornblum HI, Loughlin SE, Leslie FM. Effects of morphine on DNA synthesis in neonatal rat brain. Dev Brain Res. 1987;31:45–52. doi: 10.1016/0165-3806(87)90081-2. [DOI] [PubMed] [Google Scholar]
- Lee JC, Mayer-Proschel M, Rao MS. Gliogenesis in the central nervous system. Glia. 2000;30:105–121. doi: 10.1002/(sici)1098-1136(200004)30:2<105::aid-glia1>3.0.co;2-h. [DOI] [PubMed] [Google Scholar]
- Leslie FM, Chen Y, Winzer-Serhan UH. Opioid receptor and peptide mRNA expression in proliferative zones of fetal rat central nervous system. Can J Physiol Pharmacol. 1998;76:284–293. [PubMed] [Google Scholar]
- Leslie FM, Loughlin SE. Development of multiple opioid receptors. In: Miller MW, editor. Development of the Nervous System: Effects of Alcohol and Opiates. New York: Wiley-Liss; 1992. [Google Scholar]
- Maderspach K, Solomonia R. Glial and neuronal opioid receptors: apparent positive cooperativity observed in intact cultured cells. Brain Res. 1988;441:41–47. doi: 10.1016/0006-8993(88)91381-9. [DOI] [PubMed] [Google Scholar]
- Mangoura D, Dawson G. Opioid peptides activate phospholipase D and protein kinase C-e in chicken embryo neuron cultures. Proc Natl Acad Sci USA. 1993;90:2915–2919. doi: 10.1073/pnas.90.7.2915. [DOI] [PMC free article] [PubMed] [Google Scholar]
- Pan YX, Xu J, Wan BL, Zuckerman A, Pasternak GW. Identification and differential regional expression of KOR-3/ORL-1 gene splice variants in mouse brain. FEBS Lett. 1998;435:65–68. doi: 10.1016/s0014-5793(98)01039-4. [DOI] [PubMed] [Google Scholar]
- Peckys D, Landwehrmeyer GB. Expression of mu, kappa, and delta opioid receptor messenger RNA in the human CNS: a 33P in situ hybridization study. Neuroscience. 1999;88:1093–1135. doi: 10.1016/s0306-4522(98)00251-6. [DOI] [PubMed] [Google Scholar]
- Petrillo P, Tavani A, Verotta D, Robson LE, Kosterlitz HW. Differential postnatal development of m-, d- and kappa-opioid binding sites in rat brain. Dev Brain Res. 1987;31:53–58. doi: 10.1016/0165-3806(87)90082-4. [DOI] [PubMed] [Google Scholar]
- Plachez C, Danbolt NC, Recasens M. Transient expression of the glial glutamate transporters GLAST and GLT in hippocampal neurons in primary culture. J Neurosci Res. 2000;59:587–593. doi: 10.1002/(SICI)1097-4547(20000301)59:5<587::AID-JNR1>3.0.CO;2-L. [DOI] [PubMed] [Google Scholar]
- Polakiewicz RD, Schieferl SM, Gingras AC, Sonenberg N, Comb MJ. mu-Opioid receptor activates signaling pathways implicated in cell survival and translational control. J Biol Chem. 1998;273:23534–23541. doi: 10.1074/jbc.273.36.23534. [DOI] [PubMed] [Google Scholar]
- Reznikov K, Hauser KF, Nazarevskaja G, Trunova Y, Derjabin V, Bakalkin G. Opioids modulate cell division in the germinal zone of the late embryonic neocortex. Eur J Neurosci. 1999;11:2711–2719. doi: 10.1046/j.1460-9568.1999.00680.x. [DOI] [PubMed] [Google Scholar]
- Rickmann M, Wolff JR. S100 protein expression in subpopulations of neurons of rat brain. Neuroscience. 1995;67:977–991. doi: 10.1016/0306-4522(94)00615-c. [DOI] [PubMed] [Google Scholar]
- Rothman RB, Bykov V, De Costa BR, Jacobson AE, Rice KC, Brady LS. Evidence for four opioid kappa binding sites in guinea pig brain. Prog Clin Biol Res. 1990;328:9–12. [PubMed] [Google Scholar]
- Ruzicka BB, Fox CA, Thompson RC, Meng F, Watson SJ, Akil H. Primary astroglial cultures derived from several rat brain regions differentially express m, d and kappa opioid receptor mRNA. Mol Brain Res. 1995;34:209–220. doi: 10.1016/0169-328x(95)00165-o. [DOI] [PubMed] [Google Scholar]
- Schmahl W, Funk R, Miaskowski U, Plendl J. Long-lasting effects of naltrexone, an opioid receptor antagonist, on cell proliferation in developing rat forebrain. Brain Res. 1989;486:297–300. doi: 10.1016/0006-8993(89)90515-5. [DOI] [PubMed] [Google Scholar]
- Seifert G, Zhou M, Steinhäuser C. Analysis of AMPA receptor properties during postnatal development of mouse hippocampal astrocytes. J Neurophysiol. 1997;78:2916–2933. doi: 10.1152/jn.1997.78.6.2916. [DOI] [PubMed] [Google Scholar]
- Spain JW, Roth BL, Coscia CJ. Differential ontogeny of multiple opioid receptors (mu, delta and kappa) J Neurosci. 1985;5:584–588. doi: 10.1523/JNEUROSCI.05-03-00584.1985. [DOI] [PMC free article] [PubMed] [Google Scholar]
- Stiene-Martin A, Hauser KF. Opioid-dependent growth of glial cultures: Suppression of astrocyte DNA synthesis by Met-enkephalin. Life Sci. 1990;46:91–98. doi: 10.1016/0024-3205(90)90041-o. [DOI] [PubMed] [Google Scholar]
- Stiene-Martin A, Hauser KF. Glial growth is regulated by agonists selective for multiple opioid receptor types in vitro. J Neurosci Res. 1991;29:538–548. doi: 10.1002/jnr.490290415. [DOI] [PMC free article] [PubMed] [Google Scholar]
- Stiene-Martin A, Zhou R, Hauser KF. Regional, developmental, and cell cycle-dependent differences in μ, δ, and κ opioid receptor expression among cultured mouse astrocytes. Glia. 1998;22:249–259. [PMC free article] [PubMed] [Google Scholar]
- Tavani A, Robson LE, Kosterlitz HW. Differential postnatal development of μ, δ and κ-opioid binding sites in mouse brain. Dev Brain Res. 1985;23:306–309. doi: 10.1016/0165-3806(85)90056-2. [DOI] [PubMed] [Google Scholar]
- Thornton SR, Smith FL. Long-term alterations in opiate antinociception resulting from infant fentanyl tolerance and dependence. Eur J Pharmacol. 1998;363:113–119. doi: 10.1016/s0014-2999(98)00783-3. [DOI] [PubMed] [Google Scholar]
- Tortella FC, DeCoster MA. Kappa opioids: therapeutic considerations in epilepsy and CNS injury. Clin Neuropharmacol. 1994;17:403–416. [PubMed] [Google Scholar]
- Tryoen-Toth P, Gaveriaux-Ruff C, Labourdette G. Down-regulation of mu-opioid receptor expression in rat oligodendrocytes during their development in vitro. J Neurosci Res. 2000;60:10–20. doi: 10.1002/(SICI)1097-4547(20000401)60:1<10::AID-JNR2>3.0.CO;2-O. [DOI] [PubMed] [Google Scholar]
- Tryoen-Toth P, Gaveriaux-Ruff C, Maderspach K, Labourdette G. Regulation of kappa-opioid receptor mRNA level by cyclic AMP and growth factors in cultured rat glial cells. Mol Brain Res. 1998;55:141–150. doi: 10.1016/s0169-328x(97)00373-2. [DOI] [PubMed] [Google Scholar]
- Vértes Z, Melegh G, Vértes M, Kovács S. Effect of naloxone and D-Met2-Pro5-enkephalinamide treatment on the DNA synthesis in the developing rat brain. Life Sci. 1982;31:119–126. doi: 10.1016/0024-3205(82)90423-4. [DOI] [PubMed] [Google Scholar]
- Weickert CS, Webster MJ, Colvin SM, Herman MM, Hyde TM, Weinberger DR, Kleinman JE. Localization of epidermal growth factor receptors and putative neuroblasts in human subependymal zone. J Comp Neurol. 2000;423:359–372. doi: 10.1002/1096-9861(20000731)423:3<359::aid-cne1>3.0.co;2-0. [DOI] [PubMed] [Google Scholar]
- Wilson MA, Burt AR, Milligan G, Anderson NG. Mitogenic signalling by delta opioid receptors expressed in rat-1 fibroblasts involves activation of the p70s6k/p85s6k S6 kinase. Biochem J. 1997;325:217–222. doi: 10.1042/bj3250217. [DOI] [PMC free article] [PubMed] [Google Scholar]
- Zagon IS, McLaughlin PJ. Increased brain size and cellular content in infant rats treated with an opioid antagonist. Science. 1983;221:1179–1180. doi: 10.1126/science.6612331. [DOI] [PubMed] [Google Scholar]
- Zagon IS, McLaughlin PJ. Identification of opioid peptides regulating proliferation of neurons and glia in the developing nervous system. Brain Res. 1991;542:318–323. doi: 10.1016/0006-8993(91)91585-o. [DOI] [PubMed] [Google Scholar]
- Zamboni L, De Martino C. Buffered picric acid formaldehyde: a new rapid fixative for electron microscopy. J Cell Biol. 1967;35:148A. [Google Scholar]
- Zhu Y, Hsu MS, Pintar JE. Developmental expression of the mu, kappa, and delta opioid receptor mRNAs in mouse. J Neurosci. 1998;18:2538–2549. doi: 10.1523/JNEUROSCI.18-07-02538.1998. [DOI] [PMC free article] [PubMed] [Google Scholar]
- Zhu Y, Pintar JE. Expression of opioid receptors and ligands in pregnant mouse uterus and placenta. Biol Reprod. 1998;59:925–932. doi: 10.1095/biolreprod59.4.925. [DOI] [PubMed] [Google Scholar]