

Abstract
Copper is a required trace element that plays key roles in a number of human enzymes, such that copper deficiency or genetic defects in copper transport lead to serious or fatal disease. Rae, et al., had famously predicted that free copper ion levels in the cell cytoplasm were extremely low, typically too low to be observable. We recently developed a variant of human apocarbonic anhydrase II for sensing metal ions that exhibits 25-fold better selectivity for Cu(II) over Zn(II) than the wild type protein, enabling us to accurately measure Cu(II) in the presence of ordinary cellular (picomolar) concentrations of free zinc. We inserted a fluorescent labeled Cu(II)-specific variant of human apocarbonic anhydrase into PC-12 cells and found that the levels are indeed extremely low (in the femtomolar range). We imaged the free Cu(II) levels in living cells by means of frequency-domain fluorescence lifetime microscopy. Implications of this finding are discussed.
Keywords: Copper, Cu(II), FLIM, fluorescence lifetime imaging microscopy, PC-12 cells
Introduction
Copper is of increasing interest in biology, not only for its known physiological functions as an enzyme cofactor, but also for the role(s) it may play in pathological disease states such as Alzheimer's Disease and schizophrenia(1-6). Copper uptake and distribution within the cell are evidently tightly controlled, with a series of chaperone proteins acting to carry Cu(I) from transporters in the cell membrane to designated cellular enzymes such as superoxide dismutase and cytochrome c oxidase(7, 8) (9) The chaperone system allows the free copper ion concentrations in the cell to be maintained at an absolute minimum. Rae, et al., famously predicted on the basis of the high affinity of a yeast copper chaperone (KD ~ fM) that on the average, no free copper ion would be found in those cells (10). This seems sensible in light of the high binding affinity of copper ions compared to other transition metals for many binding sites, and the propensity of Cu(I) to promote the formation of toxic reactive oxygen species such as hydroxyl radical (OH·) via Fenton-like reactions (11) with hydrogen peroxide:
| (1) |
Additionally, if some intracellular process re-reduces the Cu(II) to Cu(I), many cycles of hydroxyl radical formation can occur when peroxide is present. The reducing environment of a typical eukaryotic cell would tend to maintain Cu(I) in the reduced state, but the rapid oxidation of Cu(I) in air-equilibrated water (t1/2 of seconds ) suggests that oxidation of Cu(I) in cells is also possible, depending strongly on ligation state (12). In the absence of a reducing process, presumably Cu(II) would tend to accumulate and bind to available ligands, such as lipoic acid-containing enzymes, metallothionein, and other sites ordinarily occupied by Zn(II) or other transition metals. Cu(II) can bind with high affinity to most sites capable of binding zinc ion, such as the active site in carbonic anhydrase (13), and indeed competition with other cellular metal ions is suspected of being a main avenue of copper toxicity in cells. While bacteria and other microorganisms grown in the presence of toxic heavy metals are well known to express transporters capable of jettisoning the toxic metal ions (14, 15) and the biology of distributing copper to enzymes within the cell has been illuminated by a series of elegant studies ( reviewed in (16) ) the mechanism(s) in animals such as humans which control dietary copper uptake, copper's distribution to needy cells, and excretion of excess copper in the bile and their role(s) in disease are still being elucidated (reviewed in (17-19) (20)). Most evidence indicates that copper is transported and mainly found in the form of Cu(I) in the cell, but is transiently present as Cu(II) during redox cycling of enzymes such as cytochrome oxidase and superoxide dismutase. In a few cases such as amine oxidases, Cu(II) is the active form of the metal and does not redox cycle during catalysis (21, 22). Thus it seemed possible that Cu(II) might be present at low levels in some cells and be capable of determination by a sufficiently sensitive and selective sensor.
While most recent effort on fluorescent Cu sensors for intracellular use has focused on sensors for Cu(I) (23, 24) (25), very innovative Cu(II) sensors have recently been described using FRET in a thermoexpanding polymer format (26) and a ratiometric phosphorescent Ir complex(27). We have previously demonstrated that suitably fluorescent-labeled human apocarbonic anhydrase II (hCA II) can determine free Cu(II) at subpicomolar levels in media as complex as seawater (28, 29). The principle of the indicator system is illustrated in Figure 1 (30-32). Briefly, a fluorescent label capable of reacting with cysteine is conjugated to hCA II at a site close to the metal binding site of apocarbonic anhydrase, in this case by site-directed mutagenesis to replace leucine-198 with cysteine . The site and fluorophore are chosen such that when Cu(II) binds to the site it partially quenches the fluorescent label's emission by Förster resonance energy transfer (FRET) and other proximity-dependent process(es), reducing the fluorescence intensity and lifetime of the Cu(II) -bound form. The overlap of the label emission with the copper complex absorption is modest, so they must be placed close to one another; thus other quenching processes such as spin-orbit coupling from the copper to induce intersystem crossing of the label to the triplet manifold are also possible and may contribute to the quenching. We note that classical collisional quenching of the label by free copper ion is probably negligible due to the low (nM and below) free Cu(II) concentration and the nanosecond lifetime of the label.
Figure 1.

Principle of fluorescence lifetime-based Cu(II) indicator. Oregon Green-labeled apo-carbonic anhydrase II in the absence of metal ions exhibits little or no quenching nor reduction in lifetime; when Cu(II) binds, the label emission is quenched by FRET with concomitant reduction in intensity and lifetime.
Because of the difficulty in accurately measuring and calibrating intensity changes, lifetime changes are followed instead; in our case, we use the frequency domain fluorescence lifetime technique (phase/modulation fluorometry (33, 34)) to measure lifetimes. In the frequency domain approach, if a fluorophore exhibiting a single exponential decay is excited by light amplitude-modulated at high frequency (1 -100 MHz is typical), its emission will be modulated at the same frequency, but phase shifted by an angle Φ and demodulated by a factor m, which are both simple functions of the fluorescence lifetime:
| (2) |
| (3) |
where f is the modulation frequency. For a single exponential m equals cos(Φ) at any frequency and the lifetime calculated each way is the same; if multiple lifetimes are present the measured m is less than cos(Φ) at any frequency and the lifetime calculated from the phase measurement (Eq. 2) is less than the lifetime calculated from the modulation (Eq. 3). Thus as the metal ion binds to the site, an increasing proportion of the shorter, quenched lifetime is observed, which can be simply related to the free metal ion concentration . For the case of Oregon Green maleimide-conjugated TAT-L198C-Q92A-apo-hCA II the free and Cu(II)-bound forms of the protein exhibit nearly monoexponential decays of 4.2 and 0.8 nanoseconds, respectively, and commensurate declines in intensity; these lifetime changes are similar to other labeled CA variants we have used(35) (28) . Thus we plan to measure Cu(II) levels in the cell by imaging differences in fluorescence lifetime by time resolved fluorometry in the microscope, a technique termed fluorescence lifetime imaging microscopy, or FLIM. The use of fluorescence lifetime measurements as an analytical tool and fluorescence lifetime imaging microscopy have been reviewed (36-38) . For lifetime imaging in the microscope it is difficult to present the fractions and lifetimes of individual pixels if the decay is multiexponential. For complex intensity decays as are often observed for FLIM images, it is more convenient to present frequency domain data as a phasor diagram as described by Redford and Clegg (39). In this method the measured modulation m and phase angle φ of a given pixel at a particular modulation frequency are plotted as a point on an X-Y plane as the endpoint of a vector whose length equals m and which makes an angle with the x-axis equal to the phase angle. Thus x = m cos φ (denoted as G in the figures) and y = m sin φ (labeled as S in the figures). Pixels exhibiting monoexponential decays where m = cos φ map along the semicircular arc in Figure 2; the endpoints of the arc at G=0, S=0, and G=1, S=0 at any frequency correspond to infinite and zero lifetimes, respectively. Further details and interpretation of the phasor plot are given in the Supplementary Material. FLIM data for an homogenous solution of a fluorophore exhibiting monoexponential decay (Coumarin 6 at 60 MHz; τ = 2.6 nsec) is shown in Figure 2. The phasor diagram (lower panel) shows a plot of all the pixels in the image field; evidently nearly all fall on or near the semicircular arc. The image in the upper left panel highlights all the pixels (in purple) whose G,S values fall within the small purple circle. As expected, the phases and modulations at 40 MHz of most of the pixels in the image field fall within the small purple circle; more important, their distribution appears homogenous in the image (upper left panel), indicating that there are no optical artifacts that change the apparent decay in different portions of the image field. The fact that the pixels (at all frequencies) map on the semicircular arc indicates a largely monoexponential decay. By comparison, the phase and modulation of pixels exhibiting multiexponential decays would fall underneath the semicircular arc (see below). Pixels mapping outside the semicircular arc would only be observed if an excited state reaction had taken place (40). Of course, the accuracy of the measurement depends in part on using appropriate modulation frequencies for the lifetime(s) in question (See Supplemental Material). The software (ISS VistaVision) also permits one to fit the multifrequency data for each pixel , as well as binned pixels and selected region of interest, to multiexponential intensity decays.
Figure 2.

Phasor plot of a monoexponential decay. Phases and modulations of individual pixels (blue points) measured at differing modulation frequencies map onto the semicircular arc (bottom panel): from the right, counterclockwise, 20, 40, 60, 80, and 100 MHz. The derived lifetime distribution from the phase and modulation data (upper right panel) is narrow, indicating a largely monoexponential decay centered at 2.61 ± 0.07 nsec. The uniform distribution of pixels in the microscope image of the homogenous Coumarin 6 solution (upper left panel), whose phases and modulations fall within the small purple circle in the lower panel, indicates that the optical system introduces little phase or modulation error across the visual field.
Thus, we employed the phasor plot for analysis of FLIM images of the free Cu(II) concentration in the cytosol of living PC-12 rat pheochromocytoma cells using a Cu(II)-selective variant of human carbonic anhydrase II.
Experimental
Cell Culture
PC-12 cells (ATCC, Rockville, MD) were cultured on Neurobasal medium(41) plus 2% B-27 Supplement (Invitrogen), 1% Penicillin-streptomycin, and 0.5 mM L-glutamine, on 35 mm dishes (World Precision Instruments) with cover slip bottoms as previously described (42). The serum-free formula for Neurobasal does not list copper as an ingredient per se, but likely small amounts of copper are present as a contaminant.
Fluorescence Lifetime Imaging Microscopy
FLIM was performed on PC-12 cells using an ISS Alba frequency domain confocal FLIM microscope. The microscope optics included a 60× 1.2 NA water immersion objective mounted in a Nikon TE-2000V inverted microscope. Excitation was from a 473 nm diode laser amplitude modulated at 20, 40, 60, 80, 100, 120 and 140 MHz and fluorescence emission was detected using TTL avalanche photodiodes. Confocal scanning optics were an ISS proprietary design. Regions of interest comprising about 500 pixels each within the images of twenty cells each in multiple fields of each copper concentration at seven frequencies were collected and analyzed as described in Results and Discussion. Non-imaging phase and modulation data were acquired using an ISS K2 phase fluorometer and an externally modulated HeCd laser, essentially as previously described (43).
Biosensor transducer
The gene for the C206S L198C Q92A hCA II variant had an oligo coding for a six histidine residue tag and the TAT cell uptake peptide (44) fused to its N-terminus, and was expressed and the protein purified essentially as previously described (42). The cationic TAT peptide promotes rapid uptake of the fluorescent-labeled apoprotein into most mammalian cells; other investigators have used TAT tags to introduce other proteins, other macromolecules, and nanoparticles into cells. Following dialysis into pH 7.5 HEPES buffer and 1 hour reduction with tris(chloroethyl)phosphine, the single reactive cysteine was conjugated with Oregon Green maleimide (Invitrogen); the conjugate was purified by column chromatography, and stripped of the native zinc ion, all essentially as previously described (42). A minimum concentration of apoprotein was introduced into the cells by twenty minute incubation of the cells in a minimum volume of protein solution after a wash with metal ion-free buffer; uptake was observed by fluorescence microscopy of the cells (42). Metal ion buffers were formulated using MINEQL+ software (Environmental Research Software, Hallowell, ME) based on an artificial cerebrospinal fluid using NTA as metal ion buffer, as previously described (42). Pyrithione (2-thiopyridine N-oxide) was used as an ionophore for the Cu(II) ion (45).
Results and Discussion
Cu-selective biosensor
For measuring free intracellular Cu(II) concentrations we used a variant of human carbonic anhydrase II (hCA II) with high selectivity for Cu(II) over Zn(II) to avoid interference by the picomolar levels of free Zn(II) known to be present in cells (42, 46-48). Small molecule fluorescent indicators are expected on the basis of the Irving –Williams series to exhibit higher affinity for Cu(II) than Zn(II), and in the few cases where these affinities have been measured (49, 50), they are indeed slightly higher for Cu(II) than for Zn(II). For the newer Cu(II) sensors discussed above and others with high Cu(II) affinities, their utility in studying intracellular levels is thus unclear until their zinc affinities are also known. For wild type human apocarbonic anhydrase II, the affinity for Cu(II) is only sixty-fold tighter than the picomolar affinity for Zn(II), and thus the Zn(II) ordinarily present in cells would be expected to interfere substantially. Therefore we modified hCA II by replacing one of the residues (Glutamine 92) which hydrogen bonds to one of the three histidine metal ligands, with an alanine residue (51). While replacement of the direct zinc-liganding histidine residues merely reduces the metal ion affinity (dramatically), we have shown that mutagenesis of the few “second-shell ligands” such as Q92 or T199 produces important changes in selectivity and metal binding kinetics as well as affinity (reviewed in (52, 53)). Verification of the desired performance requires actual measurement of the affinities. The Q92A variant exhibits twenty five -fold better selectivity for Cu(II) over Zn(II) than the wild type (e.g., the KD at physiological pH and ionic strength is > 103 -fold tighter for Cu(II) than for Zn(II)), which makes it capable of measuring subpicomolar levels of free Cu(II) in the presence of almost nanomolar free zinc concentrations. This selectivity is illustrated in Figure 3, which depicts the Cu(II)-dependent phase and modulation response of the wild type and Q92A-based sensors at 84 MHz in the presence and absence of a much higher concentration of free zinc ion (1.5 nM) than is physiological in most mammalian cells.
Figure 3.

Cu(II)-dependent phase angles (left panels) and modulations (right panels) at 84 MHz for wild type L198C-Oregon Green apo CAII (upper panels) and Q92A-L198C-Oregon Green apoCAII (lower panels) in the presence of 1.5 nM free Zn(II) (open squares) and with no added zinc (filled circles).
As expected, this elevated Zn(II) concentration substantially competes with the Cu(II) for the wild type CA II binding site (upper panels), creating large differences in both the measured phase (left) and modulation (right) data between those measured in the presence and absence of zinc; by comparison, the Cu(II)-selective Q92A variant gives nearly superimposable data sets in the presence or absence of the interfering Zn(II) (lower panels). Thus physiological free Zn(II) will not interfere in measurements made with Q92A. We note that zinc ion interferes with the copper measurement using the wild type CA (Figure 3, upper panels) by competing with Cu(II) for the binding site) even though zinc ion itself does not induce a change in intensity (or lifetime) of the fluorescent label upon binding (results not shown). Thus, widely used tests for fluorescent indicator specificity that rely on the potential interferent alone changing the fluorescence of the indicator would have failed to detect the interference shown by the large changes depicted in the upper panels of Figure 3. Furthermore, the affinities of CA II for Co(II), Cd(II) and Ni(II) are significantly lower than estimated physiological concentrations (54) and therefore unlikely to perturb the measurement, and Ca(II) at levels as high as 10 mM and Mg(II) at 50 mM do not appear to interfere. Under these ideal conditions with Q92A the detection limit is close to 1 fM, but in cells that is unlikely to be realized.
Calibration of the Biosensor
In a manner similar to the Alexa Fluor 660-labeled wild type apocarbonic anhydrase we had used previously (28) , the Oregon Green-labeled L198C Q92A apoprotein exhibited substantial changes in its lifetime in the presence and absence of Cu(II). In particular, the apo-form exhibits frequency -dependent phases and modulations that are well fit by a monoexponential decay of 4.2 nsec (χR2 = 9.3) whereas the Cu(II)-saturated form exhibits a nearly monoexponential lifetime of 0.82 nsec (χR2 = 0.9) (Figure 4); two component fits of either did not substantially improve χR2 although there are some indications that a second Cu(II) ion may be binding with reduced affinity, as we had observed previously with another variant (55). In view of the substantial lifetime changes and consequent large differences in phase angle (~ 40 degrees) and modulation (>25 percent) at 84 MHz between the copper-free and –bound forms (Figures 3 and 4), we believe the system is capable of quantifying free Cu(II) levels at subpicomolar levels without interference from physiologically relevant zinc ion concentrations.
Figure 4.

Frequency-dependent phase shifts (open symbols) and modulations (filled symbols) for L198CQ92A-Oregon Green apoCA in the presence of 0.001 pM (squares), 0.1 pM (circles) and 50 pM (triangles) free Cu(II).
In situ Calibration
We calibrated the response of the indicator both in solution with known Cu(II) concentrations (Figure 4), and in situ by immersing cells in known (buffered) free Cu(II) concentration media, together with a Cu(II) ionophore, pyrithione (45). We found that the Cu(II) concentration equilibrated relatively quickly outside and within the cell using the ionophore, and that the response of the fluorescent –labeled Q92A apoCA II indicator to copper was similar inside the cell and out, although the label lifetime was significantly reduced compared with measurements in solution. A set of cell and phasor images at 40 MHz in media buffered at 0.9 fM, 10 pM, and 70 nM free Cu(II) are depicted in Figure 5.
Figure 5.

Phasor plot at 40 MHz (lower panel) of phases and modulations of cell image pixels from in situ calibration using live cells and Cu ionophore: pixels falling within the (a) beige circle (0.9 fM free Cu(II)); (b) purple circle (10 pM); and (c) blue circle (70 nM) are indicated in the respective micrographs with the same colors.
The cell images include pixels whose phase and modulation values fall within the circled areas in the phasor diagrams, and it can be seen that the pixels fall relatively uniformly within the cytoplasm of the cells. Essentially all the pixels map within the semicircular arc, indicating significant heterogeneity in the decays even when there is little Cu(II) bound or the copper binding site is saturated. This is not unexpected for fluorophores in cells measured by FLIM. We attribute the marked asymmetry of the measured points in the phasor plot in Figure 5 compared with those of the reference compound in Figure 2 to microheterogeneity in the cellular environments in which the label is present; this behavior has been widely observed. While the frequency-dependent phases and modulations can be fit to two components corresponding to the free and Cu-bound forms of the sensor (Table I, Supplemental Information), it is more convenient to depict the lifetime properties of the images as average(mean) lifetimes () calculated from the lifetimes and preexponential factors (Equation (4)) derived from the multifrequency phase and modulation data for each pixel:
| (4) |
The average lifetimes for each pixel corresponding to cells (e.g., not background) in the three Cu(II) concentrations are plotted in Figure 6:
Figure 6.

Distributions of average lifetimes calculated for image pixels of cells immersed in 70 nM, 10 pM, and 0.9 fM free Cu(II) concentration buffers with an ionophore.
As expected, the average lifetimes decline significantly with increasing Cu(II) concentration; notable is the decline in apparent variation as shown by the narrowing of the distribution at higher Cu(II) concentration. Also note that the lifetime distribution in all cases is much broader than that observed for the monoexponential fluorophore in homogenous solution (Figure 2), which is unsurprising in view of the cellular environment. We can compare images color-coded for mean lifetime (e.g., the color of the pixels corresponds to their mean lifetime with simple intensity images of the same cells; this is shown for cells in 0.9 fM, 10 pM, and 70 nM free Cu(II) in Figure 7:
Figure 7.

Intensity (upper) and average lifetime (lower) images of cells in buffers with varying concentration of free Cu (II): 70 nM (a), 10 pM (b) and 0.9 fM (c).
It is immediately apparent that although the intensity varies substantially within cells, particularly in the 70 nM and 10 pM copper concentrations, the average lifetimes appear more uniform throughout the cytoplasm of the cells at the higher concentrations; by comparison, the low concentration shows more heterogeneity, with centers of some cells exhibiting mean lifetimes greater than 2 nsec. This greater heterogeneity was reflected in the histogram of pixel average lifetimes (Figure 6). The uniformity of the lifetime images at higher copper concentration suggests that the copper concentrations therein are also relatively uniform. We note that this in situ calibration spans a large range of copper concentration which limits its precision, but the method is clearly capable of mapping variations of free Cu(II) within cells.
There seemed to be little background fluorescence under these conditions from unstained cells (< 5%) and no correction was applied. Toxicity or other effects of these copper-buffered media on the cells were not examined beyond the few hours of experiment duration; the cells appeared normal under brightfield illumination, with no apparent rounding up, blebbing or other obvious morphological changes associated with cell death.
We measured the apo- and holo (Zn-bound)-protein in the cells in Neurobasal plus B27 with no added copper ion; the formula for Neurobasal contains no added copper (41), but a low level of contaminating copper from impurities in the ingredients or leaching from the glass containers may be present . We expect the apo protein to equilibrate with whatever free Cu(II) is available in the cell while the Zn-bound holoprotein should exchange with Cu(II) negligibly due to its very slow off-rate (0.001 hr-1). Fluorescence intensity and average lifetime images of cells containing apo- and holoprotein, and a histogram of average lifetimes of cell pixels are depicted in Figure 8:
Figure 8.

Fluorescence intensity (upper images) and average lifetimes (lower panels) of living cells with apo (A) and holoprotein (B), together with their respective lifetime distributions (C)
Again, while the fluorescence intensities varied more than 3-fold within the cells, the average lifetimes of the two appeared similar, although there was more variation in the lifetimes of the apo- than the holoprotein. This can be seen in the histograms of the average lifetimes (Figure 8 C). It is equally apparent that the peak of the average lifetime distribution of the apo- form (1.81 ± 0.31 nsec FWHM) is only slightly lower than the peak of the holoprotein (1.91 ± 0.24 nsec). Furthermore, the apo-CA peak average lifetime differs only slightly from that of the 0.9 fM calibration image (1.89 ± 0.19 nsec; Figure 6), and they exhibited similar broad distributions of average lifetime, indicating that under these conditions, the ordinary free Cu(II) concentration is not distinguishable from femtomolar . 0.9 pM Cu(II) exhibits a slightly lower average lifetime (1.65 ± 0.13 nsec; Figure 9) , so the ordinary level is probably below picomolar. We conclude that the ordinary cellular level of free Cu(II) is very low, in the femtomolar range.
Figure 9.
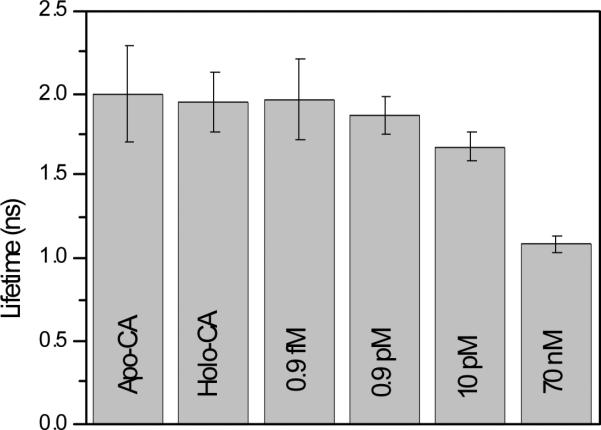
Peak average lifetimes and halfwidths for cells containing apoCA, holoCA, and immersed in buffers of the indicated free Cu(II) concentrations.
We also performed two component fits of data at all frequencies from multiple regions of interest from these data sets (Supplemental Table I); as expected, one sees nearly constant lifetimes within our experimental error (except at the highest Cu(II) concentration, see below), but monotonic declines in the proportion (α) of the long lived component as the copper concentration increases and corresponding increases in the short component. The significant decline in the lifetime of the long component at the highest concentration of Cu(II) (70 nM, well above KD)may be attributable to Cu(II) binding to a second, weaker site on the protein and further quenching the fluorescence and reducing the lifetime, as we had observed earlier with a similar variant(56).
Thus our results are in broad accord with the prediction of Rae, et al., that essentially no free Cu(II) is to be found in ordinary resting cells. Note that free ion levels in the femtomolar range equate to single ions (averaged over time) in the volume of the cell (10), underscoring the very low chemical potential of Cu(II) in these cells. In view of the rather different geometry of protein Cu(I) binding sites compared with Cu(II) sites, it seems unlikely that the Q92A variant will bind Cu(I) with nearly the same affinity as Cu(II), and Cu(I) is unlikely to interfere.
These images suggest that it will be generally useful to employ probes of this type in studying the biology of copper in tissues and intact organisms as well as isolated cells. For instance, it is widely reported that ceruloplasmin, the principal copper protein found in serum, acts as a ferroxidase (1), but it remains unclear how copper ion is incorporated therein, or why it is relatively abundant. Similarly, about 40% of total human copper is found in the skeleton, but the form it takes and its role(s) there remain cryptic (1) The total concentration of copper in cerebrospinal fluid is rather high (~ 80 μM )(1) in comparison to serum (12 – 24 μM), particularly in view of the low protein concentration in CSF; its function there remains unclear . In view of copper's importance as a toxic environmental pollutant (57) in addition to its physiological roles, it may be of particular interest to study copper uptake in living organisms such as the blue mussel (Mytilus edulis), which along with other shellfish is highly sensitive to free copper ion.
The ability to detect such low concentrations of free Cu(II) (picomolar) seems anomalous in view of the nanomolar concentrations of the fluorescent apoCA indicator that must be present. The explanation is that in the same way that free Zn(II) is buffered, Cu(II) ion is also strongly buffered by the ligands present in the cell mentioned above, and that the apoCA II is a strong ligand itself and competes effectively for the exchangeable Cu(II) present (58) . Effectively the added apoCA changes the distribution (speciation) of the copper amongst the ligands present. In this sense it necessarily perturbs the speciation and therefore does not provide a perfectly accurate value. Krezel and Maret (46) very cleverly corrected for this effect in measuring cellular free zinc by extrapolating measurements to zero indicator concentration, but inasmuch as the signal to noise ratio shrinks as the indicator intensity drops in comparison to the background, the results closest to zero indicator concentration are necessarily the least precise. We have similarly attempted to minimize the amounts of our sensor present, but can only estimate them based on fluorescence intensity. More accurate measurements of free Cu(II) in cells probably await the use of point indicators such as quantum dots or PEBBLES (59) that do not suffuse the entire cytoplasm, but report analyte concentrations within small voxels inside the cell.
We anticipate that results with this new probe will complement data and images obtained with recently developed Cu(I) probes (23-25); enabling investigators to study the biology of copper in either ionic form.
Supplementary Material
Acknowledgments
The authors wish to thank the National institutes of Health for support: ( RO1 EB03924-06 (RBT, CAF, BJM, HHZ, AKS) and RC1 GM-091081-01 (JRL, HS, RBT) ) and ISS and Ben Barbieri for the use of the Alba confocal fluorescence lifetime imaging microscope.
Footnotes
Dedication: This manuscript is dedicated to the late Dr. Robert M. Clegg of the University of Illinois at Urbana Champaign, a pioneer in the application of fluorescence techniques to biological problems.
References
- 1.Linder MC. In: Biochemistry of Copper. Frieden E, editor. Plenum; New York: 1991. [Google Scholar]
- 2.O'Halloran TV. Transition metals in control of gene expression. Science. 1993;261(715-725) doi: 10.1126/science.8342038. [DOI] [PubMed] [Google Scholar]
- 3.Wolf TL, Kotun J, Meador-Woodruff JH. Plasma copper, iron, ceruloplasmin, and Ferroxidase activity in schizophrenia. Schizophr Res. 2006;86:167–71. doi: 10.1016/j.schres.2006.05.027. [DOI] [PubMed] [Google Scholar]
- 4.Donnelly PS, Xiao Z, Wedd AG. Copper and Alzheimer's disease. Current Opinion in Chemical Biology. 2007;11:128–33. doi: 10.1016/j.cbpa.2007.01.678. [DOI] [PubMed] [Google Scholar]
- 5.Turski ML, Thiele DJ. New roles for copper metabolism in cell proliferation, signaling, and disease. Journal of Biological Chemistry. 2009;284(2):717–21. doi: 10.1074/jbc.R800055200. [DOI] [PMC free article] [PubMed] [Google Scholar]
- 6.Hung YH, Bush AI, Cherny RA. Copper in the brain and Alzheimer's disease. Journal of Biological Inorganic Chemistry. [review] 2010;15:61–76. doi: 10.1007/s00775-009-0600-y. [DOI] [PubMed] [Google Scholar]
- 7.Rosenzweig AC. Metallochaperones: Bind and deliver. Chemistry and Biology. 2002;9:673–7. doi: 10.1016/s1074-5521(02)00156-4. [DOI] [PubMed] [Google Scholar]
- 8.Lutsenko S, Barnes N, Bartee MY, Dmitriev OY. Function and regulation of human copper-transporting ATPases. Physiological Reviews. 2007;87:1011–46. doi: 10.1152/physrev.00004.2006. [DOI] [PubMed] [Google Scholar]
- 9.Robinson NJ, Winge DR. Copper metallochaperones. In: Kornberg RD, Raetz CRH, Rothman JE, Thorner JW, editors. Annual Review of Biochemistry. Annual Reviews, Inc.; Palo Alto: 2010. pp. 537–62. [DOI] [PMC free article] [PubMed] [Google Scholar]
- 10.Rae TD, Schmidt PJ, Pufahl RA, Culotta VC, O'Halloran TV. Undetectable intracellular free copper: the requirement of a copper chaperone for superoxide dismutase. Science. 1999;284:805–8. doi: 10.1126/science.284.5415.805. [DOI] [PubMed] [Google Scholar]
- 11.Fenton HJH. Oxidation of tartaric acid in the presence of iron. Journal of the Chemical Society. 1894;65:899–910. [Google Scholar]
- 12.Cotton FA, Wilkinson G. Advanced Inorganic Chemistry. 5th ed. New York: Wiley-Interscience. 1988 [Google Scholar]
- 13.Lindskog S, Nyman PO. Metal-binding properties of human erythrocyte carbonic anhydrases. Biochim Biophys Acta. 1964;85:462–74. doi: 10.1016/0926-6569(64)90310-4. [DOI] [PubMed] [Google Scholar]
- 14.Rensing C, Sun Y, Mitra B, Rosen BP. Pb(II)-translocating P-type ATPases. Journal of Biological Chemistry. 1998;273:32614–7. doi: 10.1074/jbc.273.49.32614. [DOI] [PubMed] [Google Scholar]
- 15.Nies DH, Silver S, editors. Molecular Microbiology of Heavy Metals. Springer; Berlin: 2007. [Google Scholar]
- 16.Boal AK, Rosenzweig AC. Structural Biology of Copper Trafficking. Chemical Reviews. 2009;109(10):4760–79. doi: 10.1021/cr900104z. 2009/10/14. [DOI] [PMC free article] [PubMed] [Google Scholar]
- 17.Maryon E, Molloy S, Zimnicka A, Kaplan J. Copper entry into human cells: progress and unanswered questions. Biometals. 2007;20(3-4):355–64. doi: 10.1007/s10534-006-9066-3. 2007/06/01. [DOI] [PubMed] [Google Scholar]
- 18.Crisponi G, Nurchi VM, Fanni D, Gerosa C, Nemolato S, Faa G. Copper-related diseases: From chemistry to molecular pathology. Coordination Chemistry Reviews. 2010;254(7–8):876–89. [Google Scholar]
- 19.Festa RA, Thiele DJ. Copper: An essential metal in biology. Current Biology. 2011;21(21):R877–R83. doi: 10.1016/j.cub.2011.09.040. [DOI] [PMC free article] [PubMed] [Google Scholar]
- 20.Nevitt T, Öhrvik H, Thiele DJ. Charting the travels of copper in eukaryotes from yeast to mammals. Biochimica et Biophysica Acta (BBA) - Molecular Cell Research. 2012;1823(9):1580–93. doi: 10.1016/j.bbamcr.2012.02.011. [DOI] [PMC free article] [PubMed] [Google Scholar]
- 21.Mills SA, Klinman JP. Evidence Against Reduction of Cu2+ to Cu+ during Dioxygen Activation in a Copper Amine Oxidase from Yeast. Journal of the American Chemical Society. 2000;122(41):9897–904. 2000/10/01. [Google Scholar]
- 22.Klinman JP. The multi-functional topa-quinone copper amine oxidases. Biochimica et Biophysica Acta (BBA) - Proteins and Proteomics. 2003;1647(1–2):131–7. doi: 10.1016/s1570-9639(03)00077-3. [DOI] [PubMed] [Google Scholar]
- 23.Yang L, McRae R, Henary MM, Patel R, Lai B, Vogt S, et al. Imaging of the intracellular topography of copper with a fluorescent sensor and by synchrotron x-ray fluorescence microscopy. Proc Natl Acad Sci U S A. 2005;102(32):11179–84. doi: 10.1073/pnas.0406547102. [DOI] [PMC free article] [PubMed] [Google Scholar]
- 24.Domaille DW, Zeng L, Chang CJ. Visualizing ascorbate-triggered release of labile copper within living cells using a ratiometric fluorescence sensor. Journal of the American Chemical Society. 2010;132:1194–5. doi: 10.1021/ja907778b. [DOI] [PMC free article] [PubMed] [Google Scholar]
- 25.Hirayama T, Van de Bittner GC, Gray LW, Lutsenko S, Chang CJ. Near-infrared fluorescent sensor for in vivo copper imaging in a murine Wilson disease model. Proceedings of the National Academy of Sciences. 2012 Feb 14;109(7):2228–33. doi: 10.1073/pnas.1113729109. 2012. [DOI] [PMC free article] [PubMed] [Google Scholar]
- 26.Osambo J, Seitz W, Kennedy D, Planalp R, Jones A, Jackson R, et al. Fluorescent Ratiometric Indicators Based on Cu(II)-Induced Changes in Poly(NIPAM) Microparticle Volume. Sensors. 2013;13(1):1341–52. doi: 10.3390/s130101341. [DOI] [PMC free article] [PubMed] [Google Scholar]
- 27.You Y, Han Y, Lee Y-M, Park SY, Nam W, Lippard SJ. Phosphorescent Sensor for Robust Quantification of Copper(II) Ion. Journal of the American Chemical Society. 2011;133(30):11488–91. doi: 10.1021/ja204997c. 2011/08/03. [DOI] [PMC free article] [PubMed] [Google Scholar]
- 28.Zeng HH, Thompson RB, Maliwal BP, Fones GR, Moffett JW, Fierke CA. Real-time determination of picomolar free Cu(II) in seawater using a fluorescence-based fiber optic biosensor. Anal Chem. 2003;75(24):6807–12. doi: 10.1021/ac0345401. [DOI] [PubMed] [Google Scholar]
- 29.Bozym R, Hurst TK, Westerberg N, Stoddard A, Fierke CA, Frederickson CJ, et al. Determination of zinc using carbonic anhydrase-based fluorescence biosensors. In: Brand L, Johnson M, editors. Fluorescence Spectroscopy. Academic Press; San Diego: 2008. pp. 287–309. [DOI] [PubMed] [Google Scholar]
- 30.Thompson RB, Ge Z, Patchan MW, Fierke CA, editors. SPIE Conference on Advances in Fluorescence Sensing Technology II. SPIE; San Jose, CA: 1995. Energy transfer-based fiber optic metal ion biosensor. [Google Scholar]
- 31.Thompson RB, Ge Z, Patchan MW, Huang C-c, Fierke CA. Fiber optic biosensor for Co(II) and Cu(II) based on fluorescence energy transfer with an enzyme transducer. Biosensors and Bioelectronics. 1996;11(6):557–64. [Google Scholar]
- 32.Thompson RB, Maliwal BP, Feliccia VL, Fierke CA, McCall K. Determination of picomolar concentrations of metal ions using fluorescence anisotropy: biosensing with a “reagentless” enzyme transducer. Anal Chem. 1998;70(22):4717–23. doi: 10.1021/ac980864r. [DOI] [PubMed] [Google Scholar]
- 33.Gaviola Z. Ein fluorometer, apparat zur messung von fluoreszenzabklingungszeiten [A fluorometer for measuring fluorescence lifetime]. Zeitschrift fur Physik. 1926;42:853–61. [Google Scholar]
- 34.Spencer RD, Weber G. Measurements of subnanosecond fluorescence lifetimes with a cross-correlation phase fluorometer. Annals of the New York Academy of Sciences. 1969;158:361–76. [Google Scholar]
- 35.Thompson RB, Zeng H-H, Loetz M, Fierke CA, editors. SPIE Conference on Advanced Materials and Optical Systems for Chemical and Biological Detection. Society of Photooptical Instrumentation Engineers; Boston, MA: 1999. Improved response of a fluorescence-based metal ion biosensor using engineered carbonic anhydrase variants. 1999. [Google Scholar]
- 36.Szmacinski H, Lakowicz JR, Johnson ML. Fluorescence lifetime imaging microscopy: homodyne technique using high-speed gated image intensifier. In: Johnson ML, Brand L, editors. Numerical Computer Methods. Academic Press; New York: 1994. pp. 723–48. [DOI] [PMC free article] [PubMed] [Google Scholar]
- 37.Thompson RB. Fluorescence lifetime biosensing: Entering the mainstream. In: Ligler FS, Taitt CR, editors. Optical Biosensors: Today and Tomorrow. second ed. Elsevier; Amsterdam: 2008. pp. 287–315. [Google Scholar]
- 38.Periasami A, Day RN, editors. Molecular Imaging: FRET Microscopy and Spectroscopy. American Physiological Society/Oxford University Press; Oxford: 2005. [Google Scholar]
- 39.Redford GI, Clegg RM. Polar plot representation for frequency-domain analysis of fluorescence lifetimes. Journal of Fluorescence. 2005;15(5):805–15. doi: 10.1007/s10895-005-2990-8. [DOI] [PubMed] [Google Scholar]
- 40.Lakowicz JR. Principles of Fluorescence Spectroscopy. Plenum Press; New York: 1983. [Google Scholar]
- 41.Price PJ, Brewer GJ. Serum-free media for neural cell cultures. In: Federoff S, Richardson A, editors. Protocols for Neural Cell Culture. Third ed. Humana Press; Totowa, NJ: 2001. pp. 255–64. [Google Scholar]
- 42.Bozym RA, Thompson RB, Stoddard AK, Fierke CA. Measuring Picomolar Intracellular Exchangeable Zinc in PC-12 Cells Using a Ratiometric Fluorescence Biosensor. ACS Chem Biol. 2006 Mar 17;1(2):103–11. doi: 10.1021/cb500043a. 2006. [DOI] [PubMed] [Google Scholar]
- 43.Thompson RB, Gratton E. Phase fluorimetric measurement for determination of standard lifetimes. Anal Chem. 1988;60:670–4. doi: 10.1021/ac00158a014. [DOI] [PubMed] [Google Scholar]
- 44.Schwarze SR, Ho A, Vocero-Akbani A, Dowdy SF. In vivo protein transduction: Delivery of a biologically active protein into the mouse. Science. 1999;285:1569–72. doi: 10.1126/science.285.5433.1569. [DOI] [PubMed] [Google Scholar]
- 45.Ding W-Q, Lind SE. Metal ionophores – An emerging class of anticancer drugs. IUBMB Life. 2009;61(11):1013–8. doi: 10.1002/iub.253. [DOI] [PubMed] [Google Scholar]
- 46.Krezel A, Maret W. Zinc-buffering capacity of a eukaryotic cell at physiological pZn. Journal of Biological Inorganic Chemistry. 2006;11:1049–62. doi: 10.1007/s00775-006-0150-5. [DOI] [PubMed] [Google Scholar]
- 47.Dongen EMWMv, Evers TH, Dekkers LM, Meijer EW, Klomp LWJ, Merkx M. Variation of linker length in ratiometric fluorescent sensor proteins allows rational tuning of Zn(II) affinity in the picomolar to femtomolar range. Journal of the American Chemical Society. 2007;129:3494–5. doi: 10.1021/ja069105d. [DOI] [PubMed] [Google Scholar]
- 48.Qin Y, Dittmer PJ, Park JG, Jansen KB, Palmer AE. Measuring steady-state and dynamic endoplasmic reticulum and Golgi Zn2+ with genetically encoded sensors. Proceedings of the National Academy of Sciences. 2011 doi: 10.1073/pnas.1015686108. 2011. [DOI] [PMC free article] [PubMed] [Google Scholar]
- 49.Thompson RB, Peterson D, Mahoney W, Cramer M, Maliwal BP, Suh SW, et al. Fluorescent zinc indicators for neurobiology. Journal of Neuroscience Methods. 2002;118:63–75. doi: 10.1016/s0165-0270(02)00144-9. [DOI] [PubMed] [Google Scholar]
- 50.Zhao J, Bertoglio BA, Devinney MJ, DInely KE, Kay AR. The interaction of biological and noxious transition metals with the zinc probes FluoZin-3 and Newport Green. Anal Biochem. 2009;384:34–41. doi: 10.1016/j.ab.2008.09.019. [DOI] [PMC free article] [PubMed] [Google Scholar]
- 51.Kiefer LL, Paterno SA, Fierke CA. Hydrogen bond network in the metal binding site of carbonic anhydrase enhances zinc affinity and catalytic efficiency. Journal of the American Chemical Society. 1995;117:6831–7. [Google Scholar]
- 52.Fierke CA, Thompson RB. Fluorescence-based biosensing of zinc using carbonic anhydrase. Biometals. Sep-Dec. 2001;14(3-4):205–22. doi: 10.1023/a:1012980628412. [DOI] [PubMed] [Google Scholar]
- 53.Hurst TK, Wang D, Thompson RB, Fierke CA. Carbonic anhydrase II-based metal ion sensing: Advances and new perspectives. Biochimica et Biophysica Acta (BBA) - Proteins & Proteomics. 2010;1804(2):393–403. doi: 10.1016/j.bbapap.2009.09.031. [DOI] [PMC free article] [PubMed] [Google Scholar]
- 54.McCall KA, Fierke CA. Probing determinants of the metal ion selectivity in carbonic anhydrase using mutagenesis. Biochemistry. 2004;43:3979–86. doi: 10.1021/bi0498914. [DOI] [PubMed] [Google Scholar]
- 55.Thompson RB, Maliwal BP, Fierke CA. Selectivity and sensitivity of fluorescence lifetime-based metal ion biosensing using a carbonic anhydrase transducer. Anal Biochem. 1999;267:185–95. doi: 10.1006/abio.1998.2991. [DOI] [PubMed] [Google Scholar]
- 56.Thompson RB, Maliwal BP, Fierke CA, editors. SPIE Conference on Advances in Fluorescence Sensing Technology IV. SPIE; San Jose, CA: Bellingham, WA.: 1999. Fluorescence-based sensing of transition metal ions by a carbonic anhydrase transducer with a tethered fluorophore. 1999. [Google Scholar]
- 57.Thursby G. U. S. Environmental protection Agency Environmental Research laboratory; Narragansett, Rhode Island: Apr 14, 1995. Ambient water quality criteria: saltwater copper addendum. 1995. [Google Scholar]
- 58.Dinely KE, Malaiyandi LM, Reynolds IJ. A reevaluation of neuronal zinc measurements: artifacts associated with high intracellular dye concentration. Molecular Pharmacology. 2002;62(3):618–27. doi: 10.1124/mol.62.3.618. [DOI] [PubMed] [Google Scholar]
- 59.Monson E, Brasuel M, Philbert MA, Kopelman R. PEBBLE nanosensors for in vitro bioanalysis. In: Vo-Dinh T, editor. Biomedical Photonics Handbook. CRC Press; Boca Raton, FL: 2003. pp. 1–14. [Google Scholar]
- 60.Szmacinski H, Lakowicz JR. Lifetime-based sensing. In: Lakowicz JR, editor. Topics in Fluorescence Spectroscopy Vol 4: Probe Design and Chemical Sensing. Plenum; New York: 1994. pp. 295–334. [Google Scholar]
- 61.Shen H, Wang F, Zhang Y, Xu J, Long J, Qin H, et al. Zinc Distribution and Expression Pattern of ZnT3 in Mouse Brain. Biological trace element research. 2007;119(2):166–74. doi: 10.1007/s12011-007-0056-2. [DOI] [PubMed] [Google Scholar]
- 62.Verkman AS. Development and biological applications of chloride-sensitive fluorescent indicators. American Journal of Physiology. 1990;253:C375–C88. doi: 10.1152/ajpcell.1990.259.3.C375. [DOI] [PubMed] [Google Scholar]
- 63.Demas JN, DeGraff BA. Applications of luminescent transition platinum group metal complexes to sensor technology and molecular probes. Coordination Chemistry Reviews. 2001;211:317–51. [Google Scholar]
- 64.Szmacinski H, Lakowicz JR. Optical measurements of pH using fluorescence lifetimes and phase-modulation fluorometry. Anal Chem. 1993;65:1668–74. doi: 10.1021/ac00061a007. [DOI] [PMC free article] [PubMed] [Google Scholar]
- 65.Ozinskas A, Malak H, Joshi J, Szmacinski H, Britz J, Thompson RB, et al. Homogenous model immunoassay of thyroxine by phase modulation fluorescence spectroscopy. Anal Biochem. 1993;213:264–70. doi: 10.1006/abio.1993.1419. [DOI] [PubMed] [Google Scholar]
- 66.Thompson RB, Patchan MW. Lifetime-based fluorescence energy transfer biosensing of zinc. Anal Biochem. 1995;227:123–8. doi: 10.1006/abio.1995.1260. [DOI] [PubMed] [Google Scholar]
- 67.Gratton E, Limkeman M, Lakowicz JR, Maliwal BP, Cherek H, Laczko G. Resolution of Mixtures of Fluorophores Using Variable-Frequency Phase and Modulation Data. Biophysical Journal. 1984;46:479–86. doi: 10.1016/S0006-3495(84)84044-8. [DOI] [PMC free article] [PubMed] [Google Scholar]
Associated Data
This section collects any data citations, data availability statements, or supplementary materials included in this article.