

Abstract
Background
Fetuin‐A may be involved in the etiology of coronary heart disease (CHD) through opposing pathways (ie, promoting insulin resistance and inhibiting ectopic calcification). We aimed to explicitly examine whether systemic inflammation, a factor leading to elevated vascular calcification, may modify the association between fetuin‐A and CHD risk.
Method and Results
During 16 years of follow‐up (1990–2006), we prospectively identified and confirmed 466 incident fatal or nonfatal CHD case in the Nurses' Health Study. For each case, 1 healthy control was selected using risk‐set sampling from 26 245 eligible participants. Cases and controls were matched for age, smoking status, fasting status, and date of blood draw. After multivariate adjustment for lifestyle factors, body mass index, diet, and blood lipids, fetuin‐A levels were not associated with CHD risk in the whole population: odds ratio (OR) (95% CI) comparing extreme quintiles of fetuin‐A was 0.79 (0.44 to 1.40). However, a significant inverse association was observed among participants with higher C‐reactive protein levels (Pinteraction=0.04). The OR (95% CI) comparing highest versus lowest quintiles of fetuin‐A was 0.50 (0.26 to 0.97; Ptrend=0.004) when C‐reactive protein levels were above population median (0.20 mg/dL), whereas among the remainder of the participants, the corresponding OR (95% CI) was 1.09 (0.58 to 2.05; Ptrend=0.75).
Conclusions
In this population of US women, fetuin‐A levels were associated with lower CHD risk when C‐reactive protein levels were high, but null association was observed among participants with lower C‐reactive protein levels. This divergent pattern of association needs replication in future studies.
Keywords: coronary heart disease, fetuin‐A, inflammation
Introduction
Accumulating evidence has suggested the role of ectopic vascular calcification in the etiology of cardiovascular disease (CVD) through increased aortic rigidity, impaired stability of atherosclerotic plaque, and valve dysfunction.1 Observational human studies have consistently documented a clear association between vascular calcification and risk of CVD or mortality,2 and such an association is particularly strong among patients with chronic kidney disease (CKD) or diabetes,2–3 who typically suffer the most severe vascular calcification. Under physiological conditions, calcium precipitation in the vascular system is a tightly regulated process that involves multiple factors to prevent lethal vascular calcification.4 Of these factors, fetuin‐A (ie, α2‐HS‐glycoprotein) has been identified as the primary inhibitor of tissue calcification and may account for half of the capacity to inhibit salt precipitation in circulation.5–6 In line with this function, higher fetuin‐A concentrations were consistently associated with less severe vascular calcification,7–9 better survival,10–11 and lower CVD incidence or death11–14 among CKD patients. However, thus far, 3 prospective studies conducted among healthy people generated mixed results regarding fetuin‐A levels in relation to CVD risk.15–17
The inconsistent findings observed in general populations versus CKD patients may be explained by the diverse functions of fetuin‐A. In addition to inhibiting calcium precipitation, fetuin‐A inhibits the insulin receptor and results in impaired insulin sensitivity18–19 and an elevated diabetes risk.20–23 The associations between fetuin‐A levels and CVD risk may thus depend on the baseline risk profiles of study participants that may amplify fetuin‐A's effects through one pathway over the other. This notion has been supported by evidence from recent prospective investigations.15–16 In the current analysis, we extended this line of research by evaluating the associations between fetuin‐A levels and coronary heart disease (CHD) and explicitly examining whether inflammation, a process closely involved in ectopic vascular calcification,1 modifies the associations of interest among generally healthy US women in the Nurses' Health Study (NHS).
Methods
Study Population
The NHS is an ongoing prospective study consisting of 121 700 female registered nurses aged 30 to 55 years who were enrolled in 1976 and have been continuously followed through biennial questionnaires.24 In 1989–1990, 32 826 NHS participants provided blood samples that were sent via an overnight courier to a central biorepository, and the majority (97%) of the samples arrived within 26 hours of blood draw. On arrival, these samples were centrifuged and aliquoted into cryotubes as plasma, buffy coat, and erythrocytes, and they were then stored in the vapor phase of liquid nitrogen freezers at a temperature ≤−130°C until analysis. Among these participants who provided blood samples, a high response rate (>94%) has been maintained.
Ascertainment of CHD
On the baseline and all biennial follow‐up questionnaires, participants are queried about the occurrence of physician‐diagnosed CHD events and other diseases. We then request permission to access medical records of those who report having a nonfatal myocardial infarction (MI). Exposure‐blinded study physicians review all medical records and confirm or refute the self‐reports of nonfatal MI using the World Health Organization criteria, which require typical symptoms plus either diagnostic electrocardiographic findings or elevated cardiac enzyme levels.25 Deaths were identified by reports from next of kin or postal authorities or by searching the National Death Index. At least 98% of deaths among the NHS participants were identified using these approaches.26 We identify fatal CHD cases if CHD is listed as the cause of death in autopsy reports, hospital records, or death certificates, and these cases are confirmed if there is a previous report of CHD and no other more plausible cause of death. Unconfirmed CHD deaths were excluded from the present study. In the current analysis, we included both nonfatal MI and fatal CHD cases.
Prospective Case‐Control Study Design
Among 26 245 participants who provided blood samples and were free of cancer and CVD at blood collection, 466 incident cases of nonfatal MI and fatal CHD were identified and confirmed from the date of blood draw through June 2006. A risk‐set sampling scheme was used to randomly select 1 control for each case from the rest of the population who remained free of CHD events when the CHD case occurred. We matched cases and controls for age at blood draw (±1 year) and smoking status (never, past, and current) to control for confounding. In addition, fasting status at blood draw (fasting for 10 hours or not) and date of blood draw were matched to minimize extraneous variation in biomarker distribution between cases and controls. Of note, to preserve statistical power, we also included 6 additional controls matched to cases whose diagnoses were initially confirmed by participants themselves through telephone interview or letter correspondence but were later disconfirmed by medical record review.
The study protocol was approved by the institutional review board of the Brigham and Women's Hospital and the Human Subjects Committee Review Board of Harvard School of Public Health.
Measurement of Plasma Levels of Fetuin‐A and Other Biomarkers
Samples of the case‐control pairs were shipped in the same batch and analyzed in the same run. Within each batch, samples of each pair were assayed by the same technicians in a random sequence under identical conditions to minimize systematic biases. Fetuin‐A levels were measured by an enzyme immunoassay (EIA) from R & D Systems (Minneapolis, MN).22 In addition, plasma levels of total cholesterol (TC), high‐density lipoprotein cholesterol (HDL‐C), and low‐density lipoprotein cholesterol (LDL‐C), fasting triacylglycerol (TG), high‐sensitivity C‐reactive protein (hsCRP), total adiponectin, and creatinine, as well as erythrocyte hemoglobin A1c (HbA1c) levels, were also measured among the study participants. In a smaller sample (total n=387~404), plasma levels of interleukin‐6 (IL‐6) and tumor necrosis factor receptor (TNF‐R) 1 and 2 were also measured. Details of the methodology of these assays were published elsewhere.27–29 Quality control samples (n=84) were run along with the case‐control samples. Based on the measurements of these samples, the average intra‐assay coefficient of variation (CV) was 11.8% for fetuin‐A. The CVs were 3.9% for hsCRP, 10.6% for creatinine, 5.0% for TC, 4.7% for HDL‐C, 4.9% for LDL‐C, 6.2% for TG, 10.3% for total adiponectin, 0.8% for HbA1c, 21.8% for IL‐6, and 9.2% for TNF‐R1 and TNF‐R2.
Assessment of Covariates
In the NHS questionnaires, information on medical history, lifestyle, body weight and height, family history of MI, menopausal status, and postmenopausal hormone use has been collected since baseline and updated biennially. We calculated body mass index (BMI) as weight divided by height squared (kg/m2). Diet has been assessed using a validated semiquantitative food frequency questionnaire30 every 2 to 4 years since 1980. Covariates assessed using the 1990 questionnaire were considered in the analysis as the majority of our participants provided blood samples in 1989–1990. To represent long‐term diet, cumulative averages of dietary variables were calculated through 1990.31 The estimated glomerular filtration rate (eGFR) was calculated using the Chronic Kidney Disease Epidemiology Collaboration (CKD‐EPI) equation.32 An eGFR <60 mL/min per 1.73 m2 was used to define kidney dysfunction.
Statistical Analysis
Associations of plasma fetuin‐A levels with blood lipids, inflammatory markers, and other CHD risk markers were evaluated using generalized linear regression to calculate least‐squares means of the biomarkers by quintiles of fetuin‐A levels among controls. The least‐squares means were adjusted for age at blood draw, BMI, smoking status, postmenopausal status and hormone use, alcohol use, and fasting status.
The study population was categorized into quintiles according to the distribution of fetuin‐A levels among controls for the examination of the association between fetuin‐A and CHD risk using conditional logistic regression.33 In multivariate analysis, we controlled for all matching factors, as well as established anthropometric (ie, BMI), lifestyle (ie, physical activity and use of aspirin), dietary (ie, alcohol use and alternative Healthy Eating Index score [summarizing higher intakes of vegetables, fruit, nuts, soy, and cereal fiber, higher ratios of chicken plus fish to red meat and polyunsaturated to saturated fat, lower intake of trans fat, and multivitamin use of ≥5 years]34), or clinical (ie, postmenopausal status and hormone use, parental history of MI before age 65 years, history of hypercholesterolemia, hypertension, or diabetes, and total:HDL‐C ratio) risk factors of CHD. We estimated P values for linear trend by modeling log‐transformed fetuin‐A levels in the multivariate models. We also evaluated the linear relationship by modeling the associations for each 1‐SD increment of log‐transformed fetuin‐A levels. Furthermore, we used Rosner et al's method to correct for random measurement error,35 the extent of which was measured by within‐person stability of fetuin‐A levels (an intraclass correlation of 0.88 of fetuin‐A levels was estimated between samples collected 1 to 2 years apart).22
To examine interactions between fetuin‐A levels and other variables, we first constructed an interaction term between log‐transformed fetuin‐A levels (μg/mL) and the interacting variable (eg, high versus low hsCRP levels) at issue and then modeled the significance of the interaction term using conditional logistic regression. We used unconditional logistic regression in stratified analyses to preserve statistical power as much as possible since matched cases and controls were not necessarily in the same strata. To model the dose–response relationship, we used restricted cubic spline regressions with 3 knots to examine possible nonlinear relationships between fetuin‐A levels and CHD risk. Tests for nonlinearity were based on the likelihood ratio test, comparing the model with only the linear term to the model with the linear and the cubic spline terms. To minimize the impact of outliers, we excluded participants in the highest and lowest 1% of fetuin‐A levels.
All P values were 2‐sided, and 95% CIs were calculated for ORs. Data were analyzed with use of the Statistical Analysis Systems software package, version 9.3 (SAS Institute).
Results
Demographic and lifestyle characteristics assessed at blood draw are shown in Table 1. The matching factors had similar distributions between cases and controls. As expected, cases otherwise had generally high‐risk profiles than did controls. For example, cases had higher BMI, lower alcohol intake, and higher probability of having a history of cardiometabolic diseases or family history of MI than did controls. In terms of the distribution of CHD risk markers, cases and controls had similar levels of fetuin‐A and TC, although levels of other lipid parameters, hsCRP, HbA1c, and total adiponectin, were different between the 2 groups. Among controls, fetuin‐A levels were significantly associated with the levels of total:HDL‐C ratio and TG (Table 2) and were associated with lower total adiponectin levels with borderline significance. Of note, there was no clear association between fetuin‐A levels and eGFR among the controls.
Table 1.
Baseline Characteristics of Coronary Heart Disease Patients and Controls in 1989–1990, the Nurses' Health Study
| Characteristics* | Cases (N=466) | Controls (N=470) | P Value* |
|---|---|---|---|
| Age, y* | 59.5±6.6 | 59.4±6.6 | 0.88 |
| Body mass index, kg/m2 | 26.4±5.2 | 25.2±4.3 | 0.0001 |
| Physical activity, MET‐h/wk | 16.8±17.8 | 18.1±17.1 | 0.29 |
| Alternate Healthy Eating Index score | 37.8±8.1 | 38.4±8.7 | 0.31 |
| Alcohol, g/day | 5.5±8.8 | 6.8±9.7 | 0.03 |
| Smoking status, %* | 0.85 | ||
| Current smoker | 25.3 | 24.1 | |
| Former smoker | 37.8 | 38.3 | |
| Never smoked | 36.9 | 37.7 | |
| Medical history | |||
| Diabetes, % | 13.7 | 5.1 | <0.0001 |
| Hypertension, % | 48.3 | 26.2 | <0.0001 |
| Hypercholesterolemia, % | 53.2 | 40.6 | 0.0001 |
| Parental MI before age 65 years, % | 32.2 | 19.6 | <0.0001 |
| Fasting status, %* | 70.6 | 70.4 | 0.95 |
| Postmenopausal status, % | 0.52 | ||
| Pre‐menopause | 11.2 | 13.2 | |
| Post‐menopause, current hormone users | 35.8 | 38.5 | |
| Post‐menopause, past hormone users | 18.2 | 16.4 | |
| Post‐menopause, never used hormone | 34.8 | 31.9 | |
| Use of aspirin, % | 60.5 | 63.8 | 0.30 |
| Biomarkers* | |||
| Fetuin‐A, μg/mL | 457.0±108.3 | 455.4±119.4 | 0.83 |
| TC, mg/dL | 232.8±41.8 | 228.2±42.8 | 0.10 |
| LDL‐C, mg/dL | 143.7±38.4 | 137.6±39.3 | 0.02 |
| HDL‐C, mg/dL | 52.9±15.2 | 59.4±16.5 | <0.0001 |
| TG, mg/dL | 142.5±84.7 | 118.5±62.9 | <0.0001 |
| hsCRP, mg/dL | 0.48±0.77 | 0.30±0.44 | <0.0001 |
| HbA1c, % | 5.9±1.4 | 5.5±0.6 | <0.0001 |
| Adiponectin, μg/mL | 8.1±4.0 | 9.2±3.8 | <0.0001 |
HbA1c indicates hemoglobin A1c; HDL‐C, high‐density lipoprotein cholesterol; hsCRP, high‐sensitivity C‐reactive protein; LDL‐C, low‐density lipoprotein cholesterol; MET‐hr, metabolic equivalent‐hours; MI, myocardial infarction; TC, total cholesterol; TG, triacylglycerol.
Plus‐minus values are mean±standard deviation. Percentages are based on nonmissing data.
P value estimates are based on Student t test for variables expressed as mean±standard deviation or Pearson χ2 test for variables expressed as percentages.
Matching factors.
Data of hsCRP were missing for 20 participants, and this figure was 12 for TC and HDL‐C, 22 for LDL‐C, 60 for fasting TG, 14 for adiponectin, and 146 for HbA1c.
Table 2.
Least‐Squares Means* (Standard Error) of Cardiovascular Risk Markers by Levels of Fetuin‐A Among Controls,* the Nurses' Health Study
| Quintiles of Fetuin‐A (μg/mL) | P for Trend | |||||
|---|---|---|---|---|---|---|
| 1 (Lowest) | 2 | 3 | 4 | 5 (Highest) | ||
| Median, range | 326.1 (83.0 to 368.6) | 398.8 (369.0 to 423.2) | 448.4 (425.1 to 472.0) | 494.4 (472.2 to 536.3) | 590.3 (536.8 to 1589.7) | |
| Biomarkers | ||||||
| TC, mg/dL | 222.8 (4.4) | 234.9 (4.5) | 226.2 (4.4) | 227.0 (4.4) | 230.1 (4.4) | 0.55 |
| LDL‐C, mg/dL | 133.3 (4.0) | 145.9 (4.1) | 136.7 (4.0) | 135.3 (4.0) | 137.3 (4.0) | 0.96 |
| HDL‐C, mg/dL | 60.4 (1.6) | 59.3 (1.6) | 59.6 (1.6) | 60.8 (1.6) | 56.7 (1.6) | 0.19 |
| Total:HDL‐C ratio | 3.9 (0.1) | 4.3 (0.1) | 4.0 (0.1) | 4.0 (0.1) | 4.4 (0.1) | 0.02 |
| TG mg/dL | 111.5 (6.2) | 112.7 (6.3) | 110.0 (6.2) | 115.1 (6.3) | 144.7 (6.5) | 0.0004 |
| hsCRP, mg/dL | 0.29 (0.04) | 0.24 (0.04) | 0.30 (0.04) | 0.34 (0.04) | 0.35 (0.04) | 0.19 |
| HbA1c, % | 5.5 (0.1) | 5.4 (0.1) | 5.6 (0.1) | 5.3 (0.1) | 5.6 (0.1) | 0.47 |
| Adiponectin, μg/mL | 9.8 (0.4) | 9.2 (0.4) | 9.4 (0.4) | 9.2 (0.4) | 8.7 (0.4) | 0.06 |
| eGFR, mL/min per 1.73 m2 | 86.9 (1.5) | 83.7 (1.5) | 84.1 (1.5) | 82.3 (1.5) | 83.9 (1.5) | 0.16 |
eGFR indicates estimated glomerular filtration rate; HbA1c, hemoglobin A1c; HDL‐C, high‐density lipoprotein cholesterol; hsCRP, high‐sensitivity C‐reactive protein; LDL‐C, low‐density lipoprotein cholesterol; TC, total cholesterol; TG, triacylglycerol.
Adjusted for age at blood draw (year), body mass index (kg/m2), smoking status (current smoker, past smoker, nonsmoker), postmenopausal status (yes, no), hormone use (current user, past user, and nonuser), alcohol use (nondrinker, <5.0, 5.0 to 14.9, 15.0 to 29.9, and ≥30.0 g/day), and fasting status (yes, no).
N=463 for TC, HDL‐C, TC:HDL‐C ratio, and eGFR, n=459 for LDL‐C and hsCRP, n=439 for TG, n=461 for adiponectin, and n=396 for HbA1c.
Table 3 presents the associations between quintiles of fetuin‐A levels and risk of developing CHD. In a crude model in which matching factors were adjusted, fetuin‐A levels were associated with a nonsignificant, increased risk of CHD. Further adjustment for BMI, lifestyle factors, medical history, diet, and total:HDL‐C ratio reversed this association, although none of the ORs of the quintiles reached statistical significance. In secondary analyses, additional adjustment for eGFR, TG, hsCRP, or total adiponectin did not change the association (Model 4), although the 95% CIs were wider because of decreased sample size.
Table 3.
Relative Risk (95% CI) of Coronary Heart Disease by Levels of Fetuin‐A, the Nurses' Health Study
| Quintiles of Biomarker Levels | P for Trend | |||||
|---|---|---|---|---|---|---|
| 1 (Lowest) | 2 | 3 | 4 | 5 (Highest) | ||
| Fetuin‐A, μg/mL | ||||||
| Median, range | 322.5 (83.0 to 369.0) | 397.7 (369.0 to 424.3) | 448.9 (425.1 to 472.0) | 496.4 (472.2 to 536.7) | 590.4 (536.8 to 1589.7) | |
| Case‐control | 95/94 | 87/94 | 77/94 | 100/94 | 107/94 | |
| Model 1* | 1.0 | 0.94 (0.60 to 1.47) | 0.82 (0.51 to 1.31) | 1.08 (0.69 to 1.70) | 1.22 (0.76 to 1.97) | 0.59 |
| Model 2* | 1.0 | 0.74 (0.44 to 1.24) | 0.69 (0.40 to 1.19) | 0.82 (0.48 to 1.39) | 0.95 (0.54 to 1.66) | 0.64 |
| Model 3* | 1.0 | 0.69 (0.41 to 1.17) | 0.61 (0.35 to 1.06) | 0.76 (0.44 to 1.30) | 0.79 (0.44 to 1.40) | 0.34 |
| Model 4* | 1.0 | 0.72 (0.41 to 1.25) | 0.65 (0.36 to 1.18) | 0.78 (0.44 to 1.39) | 0.78 (0.42 to 1.45) | 0.43 |
eGFR indicates estimated glomerular filtration rate; HDL‐C, high‐density lipoprotein cholesterol; MET‐hr, metabolic equivalent‐hours; MI, myocardial infarction.
Model 1 was adjusted for the matching factors, including age at blood draw, smoking status (never, past, current), fasting status (yes, no), and time of blood drawing.
Based on model 1, model 2 was further adjusted for body mass index (kg/m2), postmenopausal status (yes, no), hormone use (current user, past user, and nonuser), physical activity (METs‐h/wk; in tertiles), alcohol use (nondrinker, <5.0, 5.0 to 14.9, 15.0 to 29.9, and ≥30.0 g/day), parental history of MI before age 65 years (yes, no), history of hypercholesterolemia, hypertension, or diabetes (yes, no), use of aspirin (yes, no), and alternate Healthy Eating Index score.
Based on model 2, model 3 was further adjusted for levels of total:HDL‐C ratio.
Based on model 3, model 4 was further adjusted for levels of fasting triacylglycerol (mg/dL), high‐sensitivity C‐reactive protein (mg/L), eGFR (mL/min per 1.73 m2), and total adiponectin (μg/mL).
We explicitly evaluated the potential interaction between hsCRP, a biomarker of systematic inflammation, and fetuin‐A levels on the associations with CHD. Among participants who had higher hsCRP levels (hsCRP ≥0.20 mg/dL, the population median), fetuin‐A levels were significantly associated with a lower risk of developing CHD (Figure 1). In contrast, we observed a nonsignificant positive association among participants with lower hsCRP levels (Pinteraction=0.04). Comparing extreme quintiles of fetuin‐A levels, the ORs (95% CIs) were 0.50 (0.26 to 0.97; Ptrend=0.004) when hsCRP levels were high and 1.09 (0.58 to 2.05; Ptrend=0.75) otherwise. When we used a higher hsCRP cut‐off point (≥0.50 mg/dL; 22.3% of total population) to categorize participants, we observed a similar pattern of associations, although neither these associations nor the test for interaction reached significance level primarily because of diminished power: the corresponding ORs (95% CIs) were 0.41 (0.14 to 1.19) and 0.91 (0.55 to 1.52). Consistently, in spline regression analysis, we observed a monotonic, inverse association between fetuin‐A levels and CHD risk among participants with high CRP levels (Plinearity=0.04 and Pcurvature=0.56) but not among the rest of participants (Figure 2). We further estimated that for each 1‐SD increment of log‐transformed fetuin‐A levels, the CHD risk was 28% lower (95% CI 10% to 43%) among participants with high hsCRP levels. After correction for random measurement error, this reduction of CHD risk was strengthened to 34% (95% CI 12% to 51%).
Figure 1.
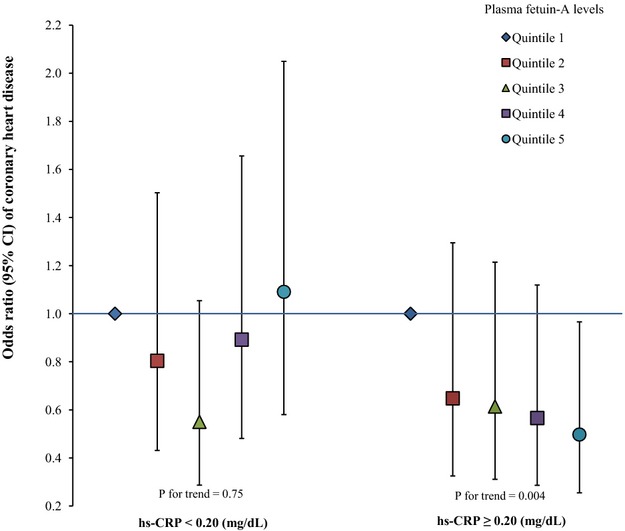
Odds ratio (95% CI) of coronary heart disease for plasma fetuin‐A levels by high‐sensitivity C‐reactive protein concentrations. Multivariate logistic regression models were adjusted for the same set of covariates for model 3 in Table 3, as well as matching factors. P for interaction=0.04.
Figure 2.
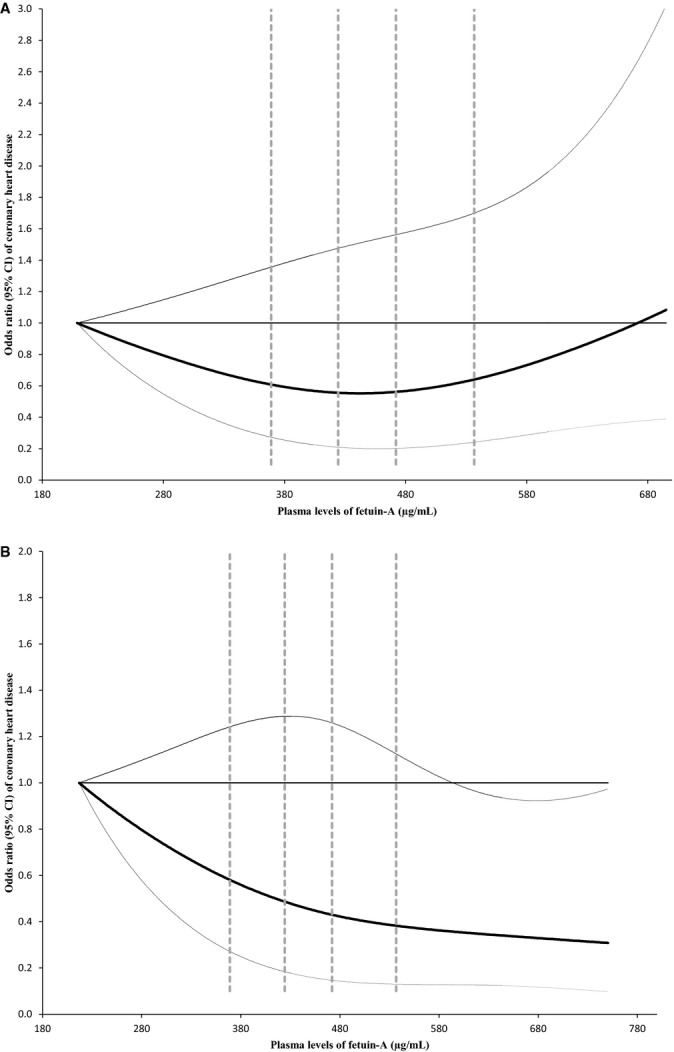
Dose‐response relationship between fetuin‐A levels and CHD risk stratified by plasma hsCRP levels. Study participants with the lowest and highest 1% of fetuin‐A were excluded to minimize potential impact of outliers. Multivariate logistic regression models were adjusted for the same set of covariates for model 3 in Table 3, as well as matching factors. Solid lines are ORs and dashed lines are 95% CIs. The horizontal line is the reference line, and the dotted vertical lines are cut‐off points for making quintiles. A, hsCRP levels below median (0.20 mg/dL); (B) hsCRP levels above median. CHD indicates coronary heart disease; hsCRP, high‐sensitivity C‐reactive protein; ORs, odds ratio.
Using existing data on several other inflammatory markers, including IL‐6, TNF‐R1, and TNF‐R2, that were measured among a subset of the study participants, we explored interactions between fetuin‐A levels and these inflammatory markers (Figure 3). In general, we observed inverse associations of fetuin‐A levels when levels of these inflammatory markers were higher than the median: the ORs (95% CIs) comparing extreme quintiles of fetuin‐A were 0.49 (0.13 to 1.82) for IL‐6, 0.84 (0.20 to 3.44) for TNF‐R1, and 0.49 (0.13 to 1.89) for TNF‐R2. We further defined an elevated‐inflammation status as the levels of all 4 inflammatory markers (hsCRP, IL‐6, TNF‐R1, and TNF‐R2) were above their medians, and we examined the interaction by this inflammation status. In this underpowered analysis (n=379), we observed a nonsignificant interaction (Pinteraction=0.15): among participants with elevated levels of all inflammatory markers, the OR (95% CI) was 0.35 (0.14 to 0.89) for each 1‐SD increment of log‐transformed fetuin‐A levels, whereas among the rest of participants, the corresponding figures were 1.14 (0.83 to 1.58). The measurement error–corrected ORs (95% CIs) were 0.16 (0.03 to 0.87) and 1.20 (0.77 to 1.88), respectively.
Figure 3.
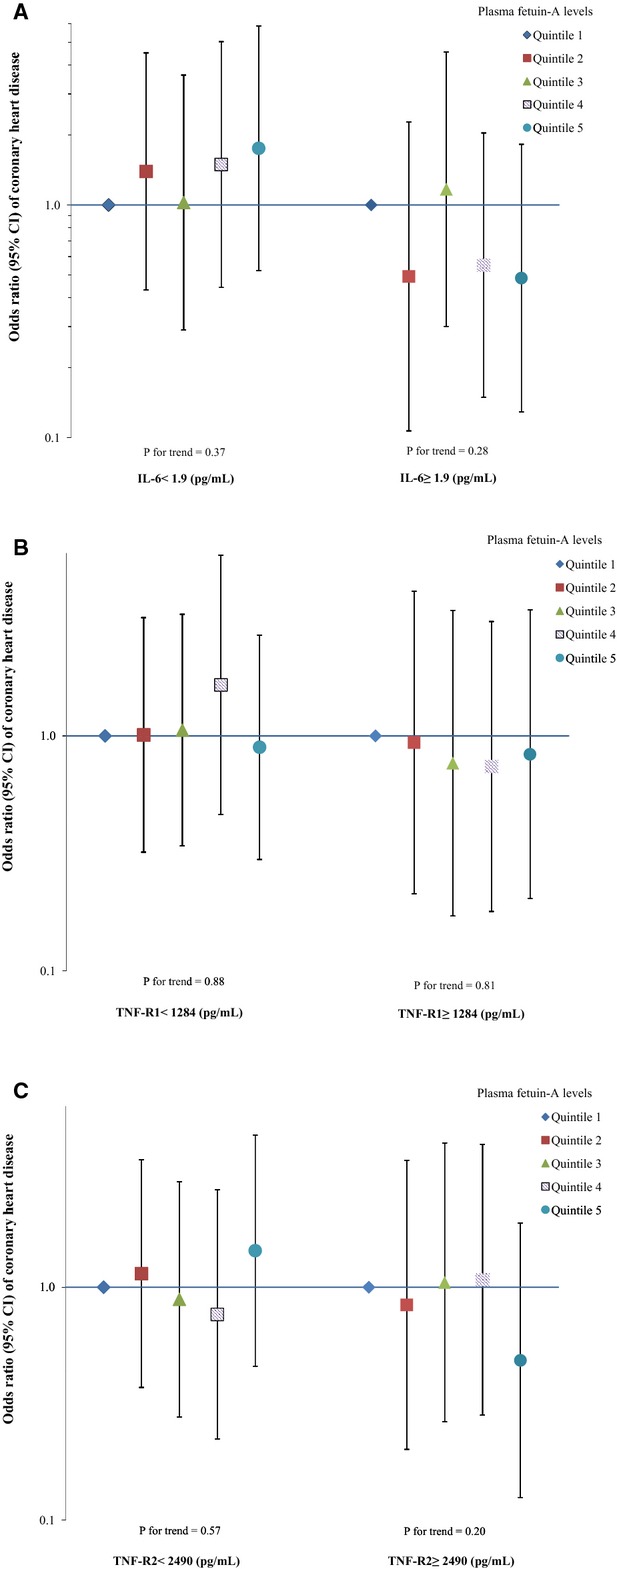
Odds ratio (95% CI) of coronary heart disease for plasma fetuin‐A levels by other inflammatory marker concentrations. Multivariate logistic regression models were adjusted for the same set of covariates for model 3 in Table 3, as well as matching factors. The Y axis was on log scale. A, interleukin‐6 (IL‐6), n=387; (B) tumor necrosis factor, receptor 1 (TNF‐R1), n=404; (C) tumor necrosis factor, receptor 2 (TNF‐R2), n=404.
Given the interactions between fetuin‐A levels and existing diabetes status observed in previous studies,15–16 we also evaluated potential effect modifications by diabetes status, HbA1c levels, and adiposity on the associations of interest (Figure 4). We did not find any interaction by these risk factors; the P values for interaction were 0.94, 0.24, and 0.10, respectively. We did not observe any significant interaction by the presence of kidney dysfunction (eGFR <60 mL/min per 1.73 m2), although among participants with impaired kidney function (6.5% of total population), fetuin‐A levels were nonsignificantly associated with a lower CHD risk (Figure 5).
Figure 4.
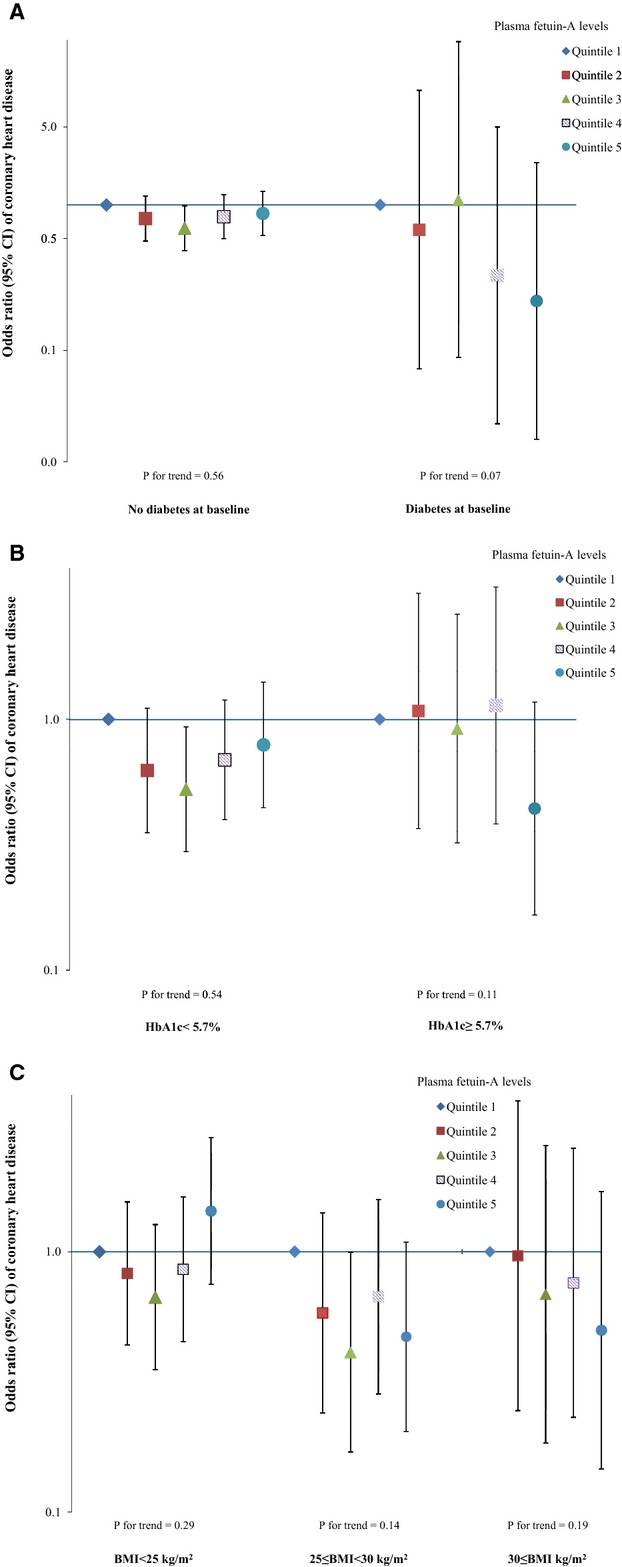
Odds ratio (95% CI) of coronary heart disease for plasma fetuin‐A levels by diabetes status, hemoglobin A1c levels, or body mass index at baseline. Multivariate logistic regression models were adjusted for the same set of covariates for model 3 in Table 3, as well as matching factors. The Y axis was on log scale. A, diabetes status at baseline; (B) hemoglobin A1c. (C) body mass index.
Figure 5.
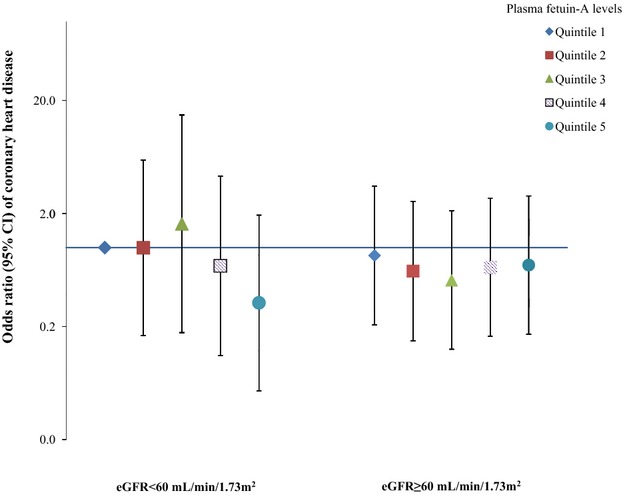
Odds ratio (95% CI) of coronary heart disease for joint categories of plasma fetuin‐A levels and estimated glomerular filtration rate. Multivariate logistic regression models were adjusted for the same set of covariates for model 3 in Table 3. The Y axis was on log scale.
Discussion
In this largely healthy population of US women, baseline plasma fetuin‐A levels were not associated with the risk of developing CHD during 16 years of follow‐up. However, this association may depend on the status of chronic systematic inflammation in that fetuin‐A levels were associated with lower CHD risk among women with high CRP levels, whereas among the remainder of the women, no association was observed. A similar interaction by inflammation was observed when we combined the data on other inflammatory markers to define an elevated inflammatory status. These observations were independent of established risk factors for CHD, including BMI, lifestyle, diet, and blood lipids.
In comparison to evidence suggesting robust, favorable associations between fetuin‐A levels and CVD outcomes among CKD patients,10–14 results from prospective studies conducted among general populations are inconsistent.15–17 In the first prospective investigation, Weikert et al found a positive association between fetuin‐A levels and risk of developing MI and stroke in the EPIC‐Potsdam study.17 The positive association persisted among subgroups of study participants categorized by various baseline characteristics, including diabetes status and CRP levels. In contrast, in the other 2 prospective cohort studies conducted among general populations, fetuin‐A levels were associated with a lower CVD incidence or mortality among nondiabetic participants, but the opposite was observed among diabetic patients.15–16 The current study of CHD risk contributes to this complexity of existing evidence by demonstrating a novel interaction by inflammatory markers. These heterogeneous findings may be potentially explained by the fact that a spectrum of CVD outcomes was considered in the prior studies, which may have distinct etiology with various relevance to fetuin‐A's biology. Of note, in the NHS, plasma fetuin‐A levels were not associated with incident ischemic stroke risk.36 Other sources of heterogeneity may include the differential distribution of sex, age, prevalence of existing diseases, and other factors that determine the background CHD risk profiles of study participants. Moreover, in these studies fetuin‐A levels were measured using various immunoassays with different sensitivity and specificity in measuring the true fetuin‐A levels,37 and none of these studies, including ours, were able to distinguish bound and free fetuin‐A in the circulation.38 On the other hand, evidence regarding associations between fetuin‐A levels and incident diabetes risk is remarkably consistent despite the different assays used in the studies.20–23 Future studies are warranted to further explore the sources of the heterogeneity specific to the associations of fetuin‐A with CVD outcomes.
The findings regarding effect modification by inflammatory markers are supported by evidence from animal experiments and human studies. Two functions of fetuin‐A have been extensively examined and consistently demonstrated in animal models: fetuin‐A inhibits both calcium precipitation and insulin receptors' activity at the tyrosine kinase level.5–6,5–19 While fetuin‐A's detrimental effects on insulin sensitivity might dictate and explain the robust associations with type 2 diabetes, its dual functions may compete with each other in determining the net effects on CVD in a specific population. For example, in CKD patients who develop severe intravascular calcification and have substantially increased risk of CVD,2 the effect of fetuin‐A on inhibiting ectopic calcification may outweigh the effect on impairing insulin resistance, leading to an inverse association with CVD mortality. In the general population, subclinical coronary artery calcification can be detected among more than half of middle‐aged or older asymptomatic people.9,39 While inflammation has been established as a key promoter of vascular calcification,40–41 the association between inflammatory markers and vascular calcification is somewhat inconclusive in general population.42 Meanwhile, in a recent prospective investigation, a composite score of inflammation constituted of multiple inflammatory markers was strongly associated with the progression of coronary artery calcification.43 Nonetheless, it is likely that among people with the procalcification inflammatory status, fetuin‐A's beneficial effects on inhibiting ectopic calcification are more pronounced. This notion is supported by a similar interaction by CRP levels on the associations of fetuin‐A with mortality among dialysis patients.44–45
The current study has several limitations that deserve discussion. First, although the homogeneity in sex, ethnicity, and profession of our study participants facilitates control of confounding, the generalizability of the results is also limited by these factors. Second, we did not correct for multiple comparisons for testing a priori hypothesis. We cannot exclude the possibility that the findings, especially the effect modification by inflammatory markers, are due to chance. While further research is needed to replicate this observation, this interaction is biologically plausible. In addition, we found a stronger, inverse association of fetuin‐A when other inflammatory markers were also elevated. Third, data on vascular calcification status are not available in the current investigation. Therefore, we are unable to explore the inter‐relationships among inflammation markers, vascular calcification, fetuin‐A, and CHD risk. Fourth, although we controlled for an array of CHD risk factors, we cannot exclude the role of residual or unmeasured confounding in the observed associations. Fifth, random measurement errors as reflected by the relatively high CV% of fetuin‐A assay in comparison to other studies might attenuate the true associations of interest. Last, although we measured fetuin‐A levels at only one time‐point, the high within‐person stability of fetuin‐A levels within 1 to 3 years suggests that a single measurement may reasonably reflect levels of fetuin‐A within a few years. Moreover, a stability ICC of 0.5236 was found between fetuin‐A levels in blood samples collected 10 years apart, further corroborating the relatively small variation of fetuin‐A levels over time.
In summary, among largely healthy US women, higher plasma fetuin‐A levels were associated with a lower risk of developing CHD when systematic inflammation levels were high, whereas no association was observed between fetuin‐A levels and CHD risk for participants with lower inflammation levels. Although the current study provides new, biologically plausible evidence linking fetuin‐A and inflammation with CHD risk, future studies are needed to replicate the findings and to evaluate the clinical significance of these findings in CHD risk prediction.
Sources of Funding
This study was supported by research grants CA87969, HL34594, HL35464, CA55075, HL088521, and DK43051 from the National Institutes of Health. Dr. Sun is supported by a career development award R00HL098459 from the National Heart, Lung, and Blood Institute.
Disclosures
None.
References
- 1.Sage AP, Tintut Y, Demer LL. Regulatory mechanisms in vascular calcification. Nat Rev Cardiol. 2010; 7:528-536. [DOI] [PMC free article] [PubMed] [Google Scholar]
- 2.Rennenberg RJ, Kessels AG, Schurgers LJ, van Engelshoven JM, de Leeuw PW, Kroon AA. Vascular calcifications as a marker of increased cardiovascular risk: a meta‐analysis. Vasc Health Risk Manag. 2009; 5:185-197. [DOI] [PMC free article] [PubMed] [Google Scholar]
- 3.Kramer CK, Zinman B, Gross JL, Canani LH, Rodrigues TC, Azevedo MJ, Retnakaran R. Coronary artery calcium score prediction of all cause mortality and cardiovascular events in people with type 2 diabetes: systematic review and meta‐analysis. BMJ. 2013; 346:f1654. [DOI] [PubMed] [Google Scholar]
- 4.Jahnen‐Dechent W, Heiss A, Schafer C, Ketteler M. Fetuin‐A regulation of calcified matrix metabolism. Circ Res. 2011; 108:1494-1509. [DOI] [PubMed] [Google Scholar]
- 5.Jahnen‐Dechent W, Schinke T, Trindl A, Muller‐Esterl W, Sablitzky F, Kaiser S, Blessing M. Cloning and targeted deletion of the mouse fetuin gene. J Biol Chem. 1997; 272:31496-31503. [DOI] [PubMed] [Google Scholar]
- 6.Schinke T, Amendt C, Trindl A, Poschke O, Muller‐Esterl W, Jahnen‐Dechent W. The serum protein alpha2‐HS glycoprotein/fetuin inhibits apatite formation in vitro and in mineralizing calvaria cells. A possible role in mineralization and calcium homeostasis. J Biol Chem. 1996; 271:20789-20796. [DOI] [PubMed] [Google Scholar]
- 7.El‐Shehaby AM, Zakaria A, El‐Khatib M, Mostafa N. Association of fetuin‐A and cardiac calcification and inflammation levels in hemodialysis patients. Scand J Clin Lab Invest. 2010; 70:575-582. [DOI] [PubMed] [Google Scholar]
- 8.Cozzolino M, Galassi A, Biondi ML, Turri O, Papagni S, Mongelli N, Civita L, Gallieni M, Brancaccio D. Serum fetuin‐A levels link inflammation and cardiovascular calcification in hemodialysis patients. Am J Nephrol. 2006; 26:423-429. [DOI] [PubMed] [Google Scholar]
- 9.Wang AY, Woo J, Lam CW, Wang M, Chan IH, Gao P, Lui SF, Li PK, Sanderson JE. Associations of serum fetuin‐A with malnutrition, inflammation, atherosclerosis and valvular calcification syndrome and outcome in peritoneal dialysis patients. Nephrol Dial Transplant. 2005; 20:1676-1685. [DOI] [PubMed] [Google Scholar]
- 10.Hermans MM, Brandenburg V, Ketteler M, Kooman JP, van der Sande FM, Boeschoten EW, Leunissen KM, Krediet RT, Dekker FW. Association of serum fetuin‐A levels with mortality in dialysis patients. Kidney Int. 2007; 72:202-207. [DOI] [PubMed] [Google Scholar]
- 11.Ketteler M, Bongartz P, Westenfeld R, Wildberger JE, Mahnken AH, Bohm R, Metzger T, Wanner C, Jahnen‐Dechent W, Floege J. Association of low fetuin‐A (AHSG) concentrations in serum with cardiovascular mortality in patients on dialysis: a cross‐sectional study. Lancet. 2003; 361:827-833. [DOI] [PubMed] [Google Scholar]
- 12.Roos M, Oikonomou D, von Eynatten M, Luppa PB, Heemann U, Lutz J, Baumann M, Nawroth PP, Bierhaus A, Humpert PM. Associations of fetuin‐A levels with vascular disease in type 2 diabetes patients with early diabetic nephropathy. Cardiovasc Diabetol. 2010; 9:48. [DOI] [PMC free article] [PubMed] [Google Scholar]
- 13.Chen HY, Chiu YL, Hsu SP, Pai MF, Yang JY, Peng YS. Low serum fetuin A levels and incident stroke in patients with maintenance haemodialysis. Eur J Clin Invest. 2013; 43:387-396. [DOI] [PubMed] [Google Scholar]
- 14.Stenvinkel P, Wang K, Qureshi AR, Axelsson J, Pecoits‐Filho R, Gao P, Barany P, Lindholm B, Jogestrand T, Heimburger O, Holmes C, Schalling M, Nordfors L. Low fetuin‐A levels are associated with cardiovascular death: impact of variations in the gene encoding fetuin. Kidney Int. 2005; 67:2383-2392. [DOI] [PubMed] [Google Scholar]
- 15.Jensen MK, Bartz TM, Mukamal KJ, Djousse L, Kizer JR, Tracy RP, Zieman SJ, Rimm EB, Siscovick DS, Shlipak M, Ix JH. Fetuin‐A, type 2 diabetes, and risk of cardiovascular disease in older adults: the Cardiovascular Health Study. Diabetes Care. 2013; 36:1222-1228. [DOI] [PMC free article] [PubMed] [Google Scholar]
- 16.Laughlin GA, Cummins KM, Wassel CL, Daniels LB, Ix JH. The association of fetuin‐A with cardiovascular disease mortality in older community‐dwelling adults: the Rancho Bernardo Study. J Am Coll Cardiol. 2012; 59:1688-1696. [DOI] [PMC free article] [PubMed] [Google Scholar]
- 17.Weikert C, Stefan N, Schulze MB, Pischon T, Berger K, Joost HG, Haring HU, Boeing H, Fritsche A. Plasma fetuin‐A levels and the risk of myocardial infarction and ischemic stroke. Circulation. 2008; 118:2555-2562. [DOI] [PubMed] [Google Scholar]
- 18.Auberger P, Falquerho L, Contreres JO, Pages G, Le Cam G, Rossi B, Le Cam A. Characterization of a natural inhibitor of the insulin receptor tyrosine kinase: CDNA cloning, purification, and anti‐mitogenic activity. Cell. 1989; 58:631-640. [DOI] [PubMed] [Google Scholar]
- 19.Mathews ST, Singh GP, Ranalletta M, Cintron VJ, Qiang X, Goustin AS, Jen KL, Charron MJ, Jahnen‐Dechent W, Grunberger G. Improved insulin sensitivity and resistance to weight gain in mice null for the Ahsg gene. Diabetes. 2002; 51:2450-2458. [DOI] [PubMed] [Google Scholar]
- 20.Ix JH, Wassel CL, Kanaya AM, Vittinghoff E, Johnson KC, Koster A, Cauley JA, Harris TB, Cummings SR, Shlipak MG. Fetuin‐A and incident diabetes mellitus in older persons. JAMA. 2008; 300:182-188. [DOI] [PMC free article] [PubMed] [Google Scholar]
- 21.Stefan N, Fritsche A, Weikert C, Boeing H, Joost HG, Haring HU, Schulze MB. Plasma fetuin‐A levels and the risk of type 2 diabetes. Diabetes. 2008; 57:2762-2767. [DOI] [PMC free article] [PubMed] [Google Scholar]
- 22.Sun Q, Cornelis MC, Manson JE, Hu FB. Plasma levels of fetuin‐A and hepatic enzymes and risk of type 2 diabetes in women in the U.S. Diabetes. 2013; 62:49-55. [DOI] [PMC free article] [PubMed] [Google Scholar]
- 23.Ix JH, Biggs ML, Mukamal KJ, Kizer JR, Zieman SJ, Siscovick DS, Mozzaffarian D, Jensen MK, Nelson L, Ruderman N, Djousse L. Association of fetuin‐A with incident diabetes mellitus in community‐living older adults: the Cardiovascular Health Study. Circulation. 2012; 125:2316-2322. [DOI] [PMC free article] [PubMed] [Google Scholar]
- 24.Colditz GA, Manson JE, Hankinson SE. The Nurses' Health Study: 20‐year contribution to the understanding of health among women. J Womens Health. 1997; 6:49-62. [DOI] [PubMed] [Google Scholar]
- 25.Rose G, Blackburn H. Cardiovascular Survey Method. 1982Geneva, Switzerland: World Health Organization; [PubMed] [Google Scholar]
- 26.Stampfer MJ, Willett WC, Speizer FE, Dysert DC, Lipnick R, Rosner B, Hennekens CH. Test of the national death index. Am J Epidemiol. 1984; 119:837-839. [DOI] [PubMed] [Google Scholar]
- 27.Heidemann C, Sun Q, van Dam RM, Meigs JB, Zhang C, Tworoger SS, Mantzoros CS, Hu FB. Total and high‐molecular‐weight adiponectin and resistin in relation to the risk for type 2 diabetes in women. Ann Intern Med. 2008; 149:307-316. [DOI] [PMC free article] [PubMed] [Google Scholar]
- 28.Hu FB, Meigs JB, Li TY, Rifai N, Manson JE. Inflammatory markers and risk of developing type 2 diabetes in women. Diabetes. 2004; 53:693-700. [DOI] [PubMed] [Google Scholar]
- 29.Sun Q, Ma J, Campos H, Hankinson SE, Manson JE, Stampfer MJ, Rexrode KM, Willett WC, Hu FB. A prospective study of trans fatty acids in erythrocytes and risk of coronary heart disease. Circulation. 2007; 115:1858-1865. [DOI] [PubMed] [Google Scholar]
- 30.Willett WC, Sampson L, Stampfer MJ, Rosner B, Bain C, Witschi J, Hennekens CH, Speizer FE. Reproducibility and validity of a semiquantitative food frequency questionnaire. Am J Epidemiol. 1985; 122:51-65. [DOI] [PubMed] [Google Scholar]
- 31.Hu FB, Stampfer MJ, Rimm E, Ascherio A, Rosner BA, Spiegelman D, Willett WC. Dietary fat and coronary heart disease: a comparison of approaches for adjusting for total energy intake and modeling repeated dietary measurements. Am J Epidemiol. 1999; 149:531-540. [DOI] [PubMed] [Google Scholar]
- 32.Levey AS, Stevens LA, Schmid CH, Zhang YL, Castro AF, III, Feldman HI, Kusek JW, Eggers P, Van Lente F, Greene T, Coresh J. A new equation to estimate glomerular filtration rate. Ann Intern Med. 2009; 150:604-612. [DOI] [PMC free article] [PubMed] [Google Scholar]
- 33.Rothman KJ, Greenland S. Modern Epidemiology. 1998Philadelphia: Lippincott Williams & Wilkins [Google Scholar]
- 34.Chiuve SE, Fung TT, Rimm EB, Hu FB, McCullough ML, Wang M, Stampfer MJ, Willett WC. Alternative dietary indices both strongly predict risk of chronic disease. J Nutr. 2012; 142:1009-1018. [DOI] [PMC free article] [PubMed] [Google Scholar]
- 35.Rosner B, Spiegelman D, Willett WC. Correction of logistic regression relative risk estimates and confidence intervals for random within‐person measurement error. Am J Epidemiol. 1992; 136:1400-1413. [DOI] [PubMed] [Google Scholar]
- 36.Jimenez MC, Sun Q, Schurks M, Hu FB, Manson JE, Rexrode KM. Circulating fetuin‐A and risk of ischemic stroke in women. Clin Chem. 2014; 60:165-173. [DOI] [PMC free article] [PubMed] [Google Scholar]
- 37.Smith ER, Ford ML, Tomlinson LA, Rocks BF, Rajkumar C, Holt SG. Poor agreement between commercial ELISAs for plasma fetuin‐A: an effect of protein glycosylation? Clin Chim Acta. 2010; 411:1367-1370. [DOI] [PubMed] [Google Scholar]
- 38.Hamano T, Matsui I, Mikami S, Tomida K, Fujii N, Imai E, Rakugi H, Isaka Y. Fetuin‐mineral complex reflects extraosseous calcification stress in CKD. J Am Soc Nephrol. 2010; 21:1998-2007. [DOI] [PMC free article] [PubMed] [Google Scholar]
- 39.Kronmal RA, McClelland RL, Detrano R, Shea S, Lima JA, Cushman M, Bild DE, Burke GL. Risk factors for the progression of coronary artery calcification in asymptomatic subjects: results from the Multi‐Ethnic Study of Atherosclerosis (MESA). Circulation. 2007; 115:2722-2730. [DOI] [PubMed] [Google Scholar]
- 40.Shao JS, Cheng SL, Sadhu J, Towler DA. Inflammation and the osteogenic regulation of vascular calcification: a review and perspective. Hypertension. 2010; 55:579-592. [DOI] [PMC free article] [PubMed] [Google Scholar]
- 41.New SE, Aikawa E. Cardiovascular calcification: an inflammatory disease. Circ J. 2011; 75:1305-1313. [DOI] [PubMed] [Google Scholar]
- 42.Hamirani YS, Pandey S, Rivera JJ, Ndumele C, Budoff MJ, Blumenthal RS, Nasir K. Markers of inflammation and coronary artery calcification: a systematic review. Atherosclerosis. 2008; 201:1-7. [DOI] [PubMed] [Google Scholar]
- 43.Alman AC, Kinney GL, Tracy RP, Maahs DM, Hokanson JE, Rewers MJ, Snell‐Bergeon JK. Prospective association between inflammatory markers and progression of coronary artery calcification in adults with and without type 1 diabetes. Diabetes Care. 2013; 36:1967-1973. [DOI] [PMC free article] [PubMed] [Google Scholar]
- 44.Metry G, Stenvinkel P, Qureshi AR, Carrero JJ, Yilmaz MI, Barany P, Snaedal S, Heimburger O, Lindholm B, Suliman ME. Low serum fetuin‐A concentration predicts poor outcome only in the presence of inflammation in prevalent haemodialysis patients. Eur J Clin Invest. 2008; 38:804-811. [DOI] [PubMed] [Google Scholar]
- 45.Verduijn M, Prein RA, Stenvinkel P, Carrero JJ, le Cessie S, Witasp A, Nordfors L, Krediet RT, Boeschoten EW, Dekker FW. Is fetuin‐A a mortality risk factor in dialysis patients or a mere risk marker? A Mendelian randomization approach. Nephrol Dial Transplant. 2011; 26:239-245. [DOI] [PubMed] [Google Scholar]