

Abstract
ZBTB4 is a transcriptional repressor and examination of publically-available microarray data sets demonstrated an inverse relationship in the prognostic value and expression of ZBTB4 and the histone methyltransferase EZH2 in tumors from breast cancer patients. The possibility of functional interactions between EZH2 and ZBTB4 was investigated in breast cancer cells and the results showed that EZH2 is directly suppressed by ZBTB4 which in turn is regulated (suppressed) by miR-106b and other paralogues from the miR-17-92, miR-106b-25 and miR-106a-363 clusters that are highly expressed in breast and other tumors. ZBTB4 also acts a suppressor of specificity protein (Sp) transcription factors Sp1, Sp3 and Sp4, and RNA interference studies show that Sp proteins are required for EZH2 expression. The prediction analysis results from breast cancer patient array data sets confirm an association of Sp1-dependent EZH2 gene signature with decreased survival of breast cancer patients. Disruption of oncogenic miR-ZBTB4 signaling axis by anticancer agent such as betulinic acid that induce down-regulation of Sp proteins in breast cancer cells resulted in inhibition of tumor growth and colonization of breast cancer cells in a mouse model. Thus, EZH2 is reciprocally regulated by a novel signaling network consisting of Sp proteins, oncogenic miRs and ZBTB4, and modulation of this gene network is a novel therapeutic approach for treatment of breast cancer and possibly other cancers.
Abbreviations: Sp, Specificity protein; ZBTB4, Zinc finger BTB domain protein 4; miR, microRNA; BA, Betulinic acid; EMSA, Electrophoretic mobility shift assay; Chip, Chromatin immunoprecipitation assay
Introduction
Sp transcription factors are highly expressed in multiple tumors and cancer cell lines and represent an example of non-oncogene addiction by cancers since Sp1, Sp3 and Sp4 regulate expression of genes that maintain the oncogenic phenotype of cancer cells without having any mutational phenotype [1], [2], [3], [4], [5], [6], [7], [8], [9]. Down-regulation of Sp1, Sp3 and Sp4 factors by specific drugs or by RNA interference confirms that Sp-regulated genes play a critical role in cancer cell growth (cyclin D1, epidermal growth factor receptor, hepatocyte growth factor receptor), survival (bcl-2, survivin), angiogenesis (vascular endothelial growth factor and its receptors), and inflammation (NFκBp65) [1], [2], [3], [4], [5], [6], [7], [8], [9]. Most of these genes contribute to the cancer phenotype and are themselves individual drug targets. The high expression of Sp1, Sp3 and Sp4 in breast and other cancer cell lines has been investigated and it was initially reported that microRNA-27a (miR-27a)-mediated inhibition of ZBTB10, a Sp repressor, played a role in the high expression of Sp transcription factors [10]. A miR-27a antagomir induced ZBTB10 which resulted in down-regulation of Sp1, Sp3 and Sp4 and similar results were observed by overexpression of ZBTB10 in breast cancer cells or after treatment with drugs that down-regulate miR-27a [10].
Like ZBTB10, ZBTB4 is also a transcriptional repressor that inactivates genes through binding their respective GC-rich promoters [8], [10], and ZBTB4 levels are suppressed in breast cancer cells due to binding miR-20a, miR-17-5p and related paralogs. miR antagomirs or ZBTB4 overexpression decreases Sp1, Sp3 and Sp4 expression in breast cancer cells [11], which is mediated through competition to GC-rich binding site. It was also observed that ZBTB4 but not ZBTB10 was a significant prognostic factor in breast cancer where high expression in patients was correlated with increased relapse free survival of breast cancer patients [11].
Examination of publically available breast cancer patient mRNA expression data for genes inversely correlated with ZBTB4 identified EZH2 which is a negative prognostic factor for breast cancer patient survival. We further investigated functional interactions between oncogenic miR/ZBTB4 signaling axis and EZH2 and show that high expression of EZH2 is also dependent on Sp transcription factors which in turn are regulated by miR-20a and related paralogs through their inactivation of ZBTB4. This report demonstrates that overexpression of pro-oncogenic EZH2 in breast cancer is Sp-dependent and due to disruption of miR-mediated suppression of ZBTB4 and that EZH2 can be targeted by drugs such as betulinic acid (BA) that down-regulate these pro-oncogenic miRs derived from miR-106b-93 and other paralogue clusters.
Materials and Methods
Cell lines, Reagents and Chemicals
MDA-MB-231 and MCF-7 cells were purchased from the American Type Culture Collection (ATCC, Manassas, VA) and were not further tested or authenticated by the authors. Cell lines were maintained DMEM medium supplemented with 10% fetal bovine serum (FBS) and 1% penicillin/streptomycin solution (Sigma Aldrich, St Louis) and maintained at 37°C in the presence of 5% CO2. Cells (2.5 × 10⁴ per well) were seeded, either transfected with siRNAs or betulinic acid (BA), and then counted using a Coulter Z1 cell counter at the designated time points. Small interfering RNAs for Sp1 and EZH2 were obtained from Sigma Aldrich (MISSION siRNA), and antisense microRNA for miR-106a, miR-106b and miR-20a were purchased from Dharmacon (Chicago, IL).
Cell Proliferation and Boyden Chamber Invasion Assay
Cells (2.5 × 10⁴ per well) were seeded either transfected with siRNAs or treated with betulinic acid (BA), and then counted using a Coulter Z1 cell counter at the designated time points. For invasion assay, a 24-well chamber of 8.0-μm pore size (Costar, Cambridge, MA) were coated with Matrigel (BD Bioscience, San Jose, CA) and then used for measuring tumor cell invasion after cells were transfected with siRNAs using Lipofectamine 2000 (Invitrogen). After 24 hr, the chamber was removed and fixed with methanol. Cell invasion was measured by counting the attached cells to the lower chamber surface.
Western Blotting and Quantitative Real-Time PCR
Whole cellular lysates were harvested and analyzed by western blots as previously described using β-actin as a loading control [10]. Antibodies for Sp1, Sp3 and Sp4 were purchased from Santa Cruz Biotechnology (Santa Cruz, CA). ZBTB4 and EZH2 antibodies were purchased from Aviva Systems Biology (San Diego, CA) and Active Motif (Carlsbad, CA), respectively. Total RNA was extracted; cDNAs were amplified and quantitative real-time PCR was performed as previously described [11] and normalized to TBP. The following primers for EZH2, Sp1, Sp3, Sp4 and TBP were purchased from Integrated DNA Technologies: EZH2 (forward), 5′-TTC ATG CAA CAC CCA ACA CT-3′; EZH2 (reverse), 5′-GAG AGC AGC AGC AAA CTC CT-3′; Sp1 (forward), 5′-TGC AGC AGA ATT GAG TCA CC-3′; Sp1 (reverse), 5′-TTG GTA CTG CTG CCA CTC TG-3′; Sp3 (forward), 5′-TCC AGT CAG CAG ATG GTC AG-3′; Sp3 (reverse), 5′-TTG GGT TTG ACC AGG AAA AG-3′. Sp4 (forward), 5′-AAA CAT GTC AAA ACG CAC CA-3′; Sp4 (reverse), 5′-TTG AGA AAT GGC TGC AAC TG-3′. TBP (forward), 5′-TGC ACA GGA GCC AAG AGT GAA-3′; TBP (reverse), 5′-CAC ATC ACA GCT CCC CAC CA-3′.
Luciferase Assay
The reporter luciferase construct containing EZH2 gene promoter region (− 1095/+ 48) was kindly provided by Dr. Helin (University of Copenhagen, Copenhagen, Denmark). Transfected cells were lysed, and luciferase activity normalized to β-galactosidase activity was determined as described [11].
Chromatin Immunoprecipitation Assay
The chromatin immunoprecipitation (ChIP) assay was carried out using ChiP-IT Express Magnetic Chromatin Immunoprecipitation Kit (Active Motif, Carlsbad, CA) according to manufacturer's protocol. The Chip primer sets used for Chip assay: Primer I (forward: − 1558), 5′-TTG CCA CAT GAA GCA ATA GG-3′, Primer I (reverse: − 1090), 5′-CAG ACC CTT CCA CTG TTC GT-3′; Primer II (forward: − 458), 5′-CTG GTT CAA ACT TGG CTT CC-3′, Primer II (reverse: − 214), 5′-CTC CAC TGC CTT CTG AGT CC-3′; Primer III (forward: + 607), 5′-AGT CCG CAC TCA GAC AAA GG-3′, Primer III (reverse: + 1189) 5′-CAA GTT GGC CAA AAC AGC TT-3′. The positive (GAPDH) and negative primer (CNAP1) sequences were previously described [10], [11]. Chip-PCR was performed using the 7300HT Real-Time PCR System with a 96-well block module (Applied Biosystems) with Primer II. Cycling conditions were 56°C for 30 min and 95°C for 10 min, followed by 50 cycles of 95°C for 25 s and 60°C for 60 s.
In Vitro Translation and Gel Shift Assay
ZBTB4 cDNA was cloned into pCDNA vector (Invitrogen, Carlsbad, CA) vector and then in vitro translated using T7 quick coupled Transcriptional Translation system according to the manufacturer's protocol (Promega, Madison, WI). Sp1 recombinant protein was purchased from Promega (Madison, WI). The DNA binding of Sp1 and ZBTB4 to GC-rich oligos derived from EZH2 gene promoter was measured using an Universal EZ-TFA transcription factor assay Chemiluminescent kit (Upstate Biotechnology, Inc., Lake Placid, NY) according to the manufacturer's protocol, and the oligo nucleotide sequences (wild type and mutated) derived from EZH2 gene promoter are illustrated (Supplementary Figure 3). The biotin-conjugated GC-rich oligos and the competitive oligonucleotides were purchased from Intergrated DNA Technology. The detailed method was previously described [11].
Xenograft Study
Female athymic nude mice were purchased from the Harlan Laboratories (Indianapolis, IN), and MDA-MB-231 cells (1×10⁶) mixed with matrigel (BD Biosciences, San Jose, CA) were implanted subcutaneously into the either flank of each mouse. When the tumors were palpable, mice were divided into two groups of 6 animals and dosed by oral gavage with corn oil or 30 mg/kg of BA every other day for 21 days. The mice were weighed and their tumor sizes were measured at the indicated time with calipers. After mice were sacrificed, the tissue lysates were collected and analyzed for measuring protein and microRNA levels.
Tail Vein Injection Metastasis Assay
MDA-MB-231 cancer cells (106 cells) were introduced through tail-vein injection. After 7 days, 20 mg/kg of BA or corn oil (control) was administered to mice by oral gavage every other day for 28 days. Mice were euthanized and lungs were analyzed for metastatic tumors. Three mice not injected were also used as controls.
Microarray, Breast Cancer Patient Gene Profiling Data Sets, and Statistical Analysis
MDA-MB-231 cells were transiently transfected with siRNA for EZH2, Sp1 and control and after 48 hr, total RNA from these cells was extracted from the indicated cell lines using a mirVana RNA Isolation Labeling kit (Ambion, Inc.). Five hundred nanograms of total RNA were used for amplification, labeling and hybridization according to the manufacturer's protocols (Illumina Inc., San Diego, CA). The data analysis was performed as previously described [11], [12]. Breast cancer patient gene expression data from four independent breast cancer patient cohorts were used for analysis. Normalized gene expression data from NKI, UNC and IJB cohorts were obtained as previously described [12], [13]. All gene expression data were deposited in Gene expression Omnibus (GEO) as GSE48979. Student's t-test (two sided) was applied to determine statistical significance. Biometric Research Branch (BRB) ArrayTools (National Cancer Institute, Bethesda, MD) was used for prediction of patient survival as previously described [12], [14]. Kaplan-Meier patient survival analysis (log-rank test) was applied to predict patient survival and DAVID (The Database for Annotation, Visualization and Integrated Discovery) analysis was used for functional annotation of genes [15].
Results
Identification of EZH2 as a Downstream Target of ZBTB4
ZBTB4 is a transcriptional repressor, and high expression of this gene is a favorable prognostic factor for relapse free survival of breast cancer patients [11]: however, the identities of downstream genes repressed by ZBTB4 have not been determined. In order to identify novel downstream repressed genes, we first performed Pierson's correlation analysis using two breast cancer patient genomic data sets and identified 34 genes that were highly inversely correlated with ZBTB4 expression (cut-off value of Pearson's correlation coefficient r > − 0.45 and P > .001) . Figure 1A shows that among 152 and 108 genes inversely correlated with ZBTB4 expression in tumors from two different data sets of breast cancer patients [12], [13] and 34 genes are common to both groups (Suppl. Table 1). Previous studies showed that Specificity protein1 (Sp1) mutually competes with ZBTB4 for binding to GC-rich cis promoter element [11], and therefore, by comparing a list of Sp1 regulated genes, determined by Sp1 knockdown and control RNA lysates of MDA-MB-231 cells (514 genes, > 1.5 fold change, P > .001), we identified only three genes that were also regulated by Sp1 among 34 genes (Figure 1A). These three genes, including EZH2, RRM2 and CDC2, would be putative ZBTB4 downstream target genes that are likely regulated positively by Sp1, but negatively by ZBTB4. Survival curves for patients expressing high and low levels of ZBTB4 and EZH2 also illustrate their inverse relationship as prognostic factors for disease-free survival in two independent breast cancer patient data sets [12], [13](Figure 1B). The relative expression of EZH2, Sp1 and ZBTB4 in normal breast tissue vs. breast tumor was also determined in two additional data sets (Supplementary Figure 1) and show that expression of ZBTB4 is inversely associated with Sp1 and EZH2 in normal breast vs. invasive breast carcinoma.
Figure 1.
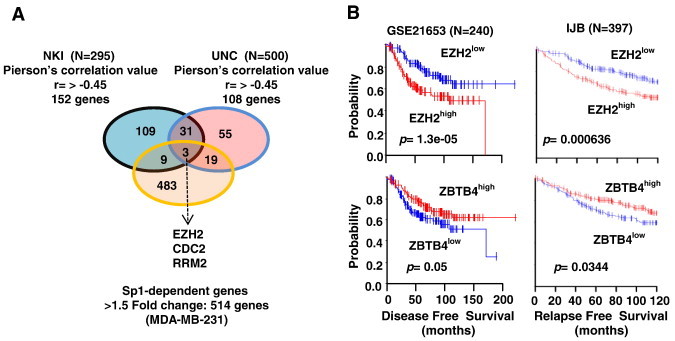
Identification of EZH2 as a novel target of oncogenic-miR/ZBTB4 signaling axis. (A) Venn diagram showing that 34 genes were inversely correlated with ZBTB4 in two gene data sets. Among 34 genes, only 3 genes are Sp1-regulated genes. (B) Kaplan-Meier survival analysis exhibit dichotomized survival curves in an opposite manner for patients expressing high or low ZBTB4 and EZH2.
ZBTB4-Mediated EZH2 Repression
A possible functional relationship between ZBTB4 and EZH2 was investigated in MCF-7 and MDA-MB-231 cells by overexpression of ZBTB4 and this resulted in down-regulation of EZH2 protein (Figure 2A) and mRNA (Figure 2B) levels in both cell lines. Moreover, overexpression of ZBTB4 was also accompanied by decreased expression of Sp1, Sp3 and Sp4 protein and mRNA levels (Figure 2A and B) and this was consistent with previous studies showing that ZBTB4 decreased expression of Sp transcription factors [11]. By using TRANSFAC program searching for potential transcription factor binding sites [16], we identified two consensus Sp1 binding sites in 5′ proximal region of EZH2 gene promoter (Figure 2C). Luciferase activity was decreased after overexpression of ZBTB4 in MDA-MB-231 and MCF-7 cells transfected with the pEZH2-luc construct which contains GC-rich motifs that can bind ZBTB4 (Figure 2C). Effects of EZH2 knockdown on MDA-MB-231 cell growth and invasion in a Boyden Chamber assay was shown (Supplementary Figure 2) and these results were similar to the effects of ZBTB4 overexpression in the same cell lines [11].
Figure 2.
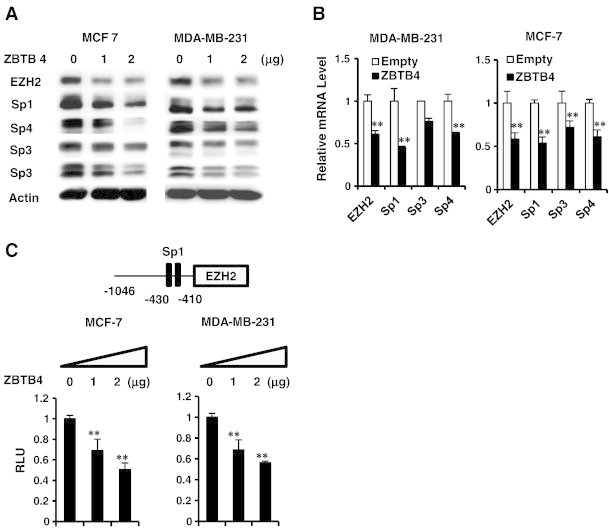
ZBTB4 decreases expression of Sp transcription factors and EZH2 in breast cancer cells. (A) MCF-7 and MDA-MB-231 cells were transfected with ZBTB4 expression plasmid and decreased protein expression was determined by western blots of whole cell lysates. (B) The effects of ZBTB4 overexpression of levels of EZH2, Sp1, Sp3 and Sp4 mRNA levels were determined in MDA-M-231 and MCF-7 cells by real time PCR. (C) Luciferase activity was determined in breast cancer cells transfected with ZBTB4 expression plasmid and pEZH2, a construct containing the − 1046 to + 48 region of the EZH2 promoter.
Sp Transcription Factors Regulate EZH2 Expression
Transfection of MDA-MB-231 with oligonucleotides targeted to Sp1 (iSp1), Sp3 (iSp3), and Sp4 (iSp4) decreased expression of the corresponding Sp proteins, and EZH2 expression was decreased by iSp1 and iSp4 but not iSp3 (Figure 3A). In contrast, iSp1, iSp3 and iSp4 all decreased EZH2 protein in MCF-7 cells demonstrating that EZH2 was regulated by Sp transcription factors and the relative contributions of Sp1, Sp3 and Sp4 were cell context-dependent. Knockdown of Sp transcription factors by RNAi also decreased luciferase activity in MDA-MB-231 and MCF-7 cells transfected with the pEZH2-luc construct (Figure 3B) and these data correlated with the effects of Sp knockdown on EZH2 protein expression (Figure 3A). Incubation of recombinant Sp1 with the GC-rich sequence from the EZH2 promoter resulted in formation of a retarded band and the intensity of this band was decreased upon coincubation with 100-fold excess of a GC-rich competitor, whereas Sp1 did not bind the EZH2 oligonuclectide mutated in the GC-rich site (Figure 3C). In a parallel gel shift experiment, we showed that binding of recombinant Sp1 to the GC-rich EZH2 promoter was decreased when coincubated with in vitro translated recombinant ZBTB4 protein (Supplementary Figure 4). A ChIP assay and three sets of primers were used to show that Sp1 was constitutively bound to the GC-rich region of the EZH2 promoter (primer 2) but not distant promoter region (> 1 kb: primers 1 and 3) using two different Sp1 antibodies (Figure 3C). Mithramycin is a drug that specifically binds GC-rich promoter elements and GAL4-Sp1 DBD only contains DNA binding domain of Sp1, and both act as dominant negative inhibitors of Sp transcription factors [17], [18]. Both mithramycin D and GAL4 constructs containing Sp1 DBD domain inhibit luciferase activity in MD-MB-231 and MCF-7 cells transfected with the pEZH2-luc construct whereas overexpression of Sp1 induced luciferase activity (Figure 3D). These data confirm that EZH2 is regulated by Sp transcription factors and the effects of ZBT4 overexpression on decreased expression of EZH2 (Figure 2) are due, in part, to down-regulation of Sp1, Sp3 and Sp4.
Figure 3.
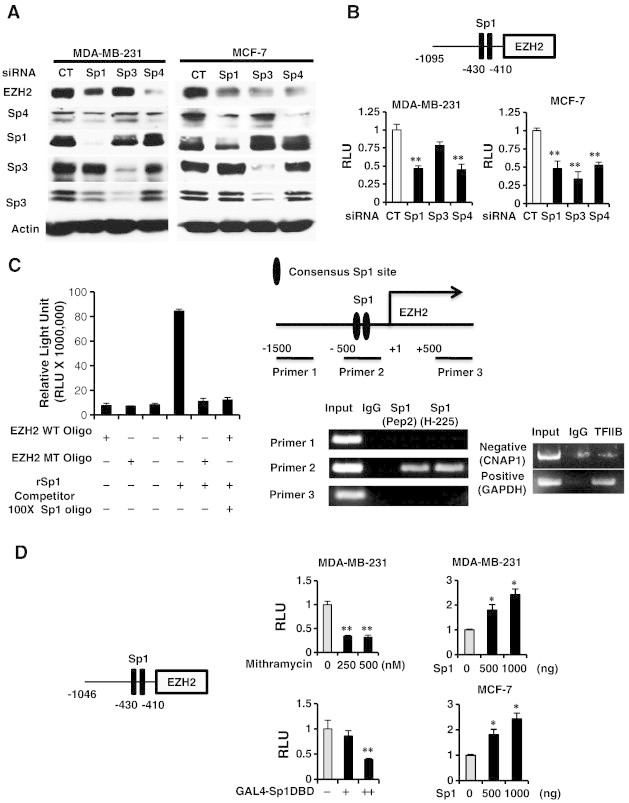
Role of Sp transcription factors in regulation of EZH2. (A) MDA-MB-231 and MCF-7 cells were transfected with small inhibitory RNAs (siRNAs) targeting Sp1, Sp3 and Sp4, and whole cell lysates were analyzed by western blots. (B) The same oligonucleotides and the pEZH2 construct were also transfected, and luciferase activity was determined. (C) Binding of recombinant Sp1 to wild-type and mutant oligonucleotides (containing the EZH2 GC-rich sites) was determined using a Universal EZ-TA transcription factor chemluminescent assay kit and binding of Sp1 to the GC-rich EZH2 gene promoter was determined in a ChIP assay. (D) MDA-MB-231 and MCF-7 cells were transfected with pEZH2 and cells were either treated with mithramycin or transfected with an Sp1 expression plasmid, and luciferase activity was determined. Results are expressed as means ± SE for at least 3 replicated determinations (Figures 3B–D). Significantly (P < .05) increased (*) or decreased (**) activity is indicated.
Regulation of EZH2 Expression by Oncogenic-miR/ZBTB4 Signaling Axis
MiR-20a, miR-106a and miR-106b have common seed sequences and are components of the miR-17-92, miR-106a-363 and miR-106b-25 clusters respectively [19]. These miRs are overexpressed in breast tumors [19], [20] and also bind to and decrease expression of ZBTB4 [11]. Transfection of MDA-MB-231 and MCF-7 cells with miR-106a, miR-106b and miR-20a antagomirs decreased levels of EZH2, Sp1, Sp3 and Sp4 proteins but increased ZBTB4 expression (Supplementary Figure 5) in both cell lines, although the miR-106a antagomir was not effective likely due to relatively low endogenous expression level of miR-106a (Figure 4A and Supplementary Figure 6). Decreased luciferase activity was also observed in cells transfected with the pEZH2-luc construct and the miR antagomirs and again miR-106a antagomir was the least effective antagomir (Figure 4B).
Figure 4.
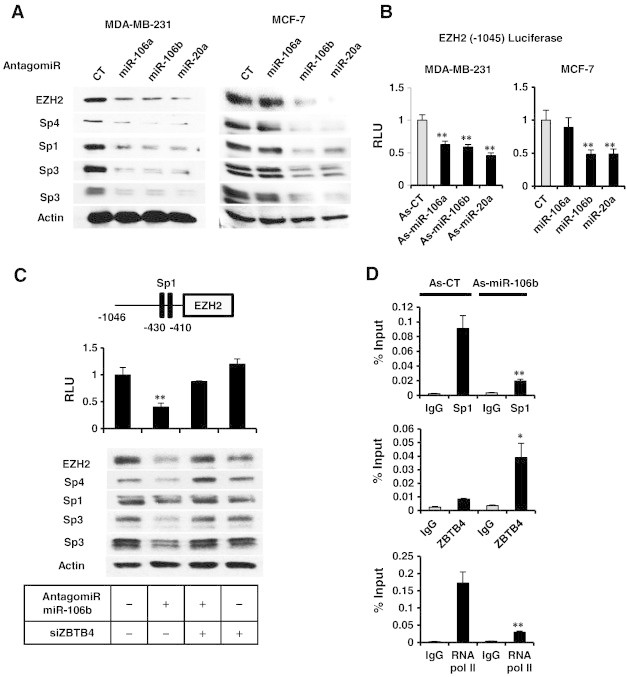
Antagomirs to miR-106a, miR-106b and miR-20a decrease Sp1, Sp3, Sp4 and EZH2 in breast cancer cells. (A) Antagomirs were transfected into MDA-MB-231 and MCF-7 cells, and whole cell lysates were analyzed by western blots. (B) Antagomirs and the pEZH2 construct were transfected into breast cancer cells, and luciferase activity was determined. (C) miR-106b and pEZH2 were transfected into MDA-MB-231 cells in the presence or absence of siZBTB4 (knockdown), and both luciferase activity and western blot analyses were carried out in separate experiments. (D) MDA-MB-231 cells were transfected with a control oligonucleotide (As-CT) or the antagomiR-106b, and binding of Sp1 or ZBTB4 to the GC-rich region of the EZH2 promoter was determined in a ChIP assay. Results are means ± SE for at least 3 replicated determinations, and significantly (P < .05) increased/attenuated (*) or decreased (**) responses are indicated.
The critical role of ZBTB4 in mediating the effects of the antagomirs was further investigated in MDA-MB-231 cells using antagomir-106b as a model. Transfection of MDA-MB-231 cells with the antagomir alone or in combination with siZBTB4 showed that down-regulation of EZH2, Sp1, Sp3 and Sp4 by antagomir-106b was potentially reversed after knockdown of ZBTB4 (Figure 4C). Antagomir-106b also increased ZBTB4 and decreased Sp1 binding to the GC-rich region of the EZH2 promoter (Figure 4D) in a ChIP assay, confirming the important role of miR-dependent suppression of ZBTB4 in maintaining high levels of EZH2 (and Sp proteins) in breast cancer cells. Furthermore, the results from Pierson's correlation analysis using NCI60 cell line miR & mRNA array data showed positive relationship between oncogenic miRs and EZH2 expression [21](Supplementary Figure 7).
A Clinical Significance of Sp1-Depedent EZH2 Gene Signature in Breast Cancer
Since high expression of both Sp1 and EZH2 are observed in invasive breast carcinoma (Figure 1C) and Sp1 regulates EZH2 expression (Figure 3), we investigated whether a common gene signature obtained by comparing gene expression signatures after Sp1 and EZH2 knockdown in MDA-MB-231 cells possess any clinical predictive value. The Venn diagram (Figure 5A) shows that 163 genes (Suppl. Table 2) are commonly regulated by both Sp1 and by EZH2 knockdown. Next, gene ontology of the common 163 genes was analyzed using DAVID [15] and the analysis shows (Figure 5B) that major biological pathways regulated by Sp1 and EZH2 are related to cell proliferation, cell cycle and cell death (Suppl. Table 3). In order to test the clinical importance of the 163 gene signature, prediction models using multiple algorithms classifiers were employed [12], and the patients were split into Sp1-KO (KD) or control (CT) groups based on similarity to the gene signature in the former group. By using NKI breast cancer patient data set [12], Relapse - free survival of breast cancer patients in Sp1-KO and CT groups was analyzed using 7 different classifiers, including one nearest neighbor (1NN), three nearest neighbors (3NN), nearest centroid (NC), support vector machines (SVM), Bayesian compound predictor (BCC), compound covariate predictor, and linear discriminator analysis. The results (Figure 5C) show that the common gene signature after knockdown of EZH2 or Sp1 significantly predicted relapse free patient survival by four different classifiers, including 1NN, 3NN. NC and SVM (Suppl. Table 4) and is consistent with the functional pro-oncogenic activity of Sp1 and EZH2.
Figure 5.
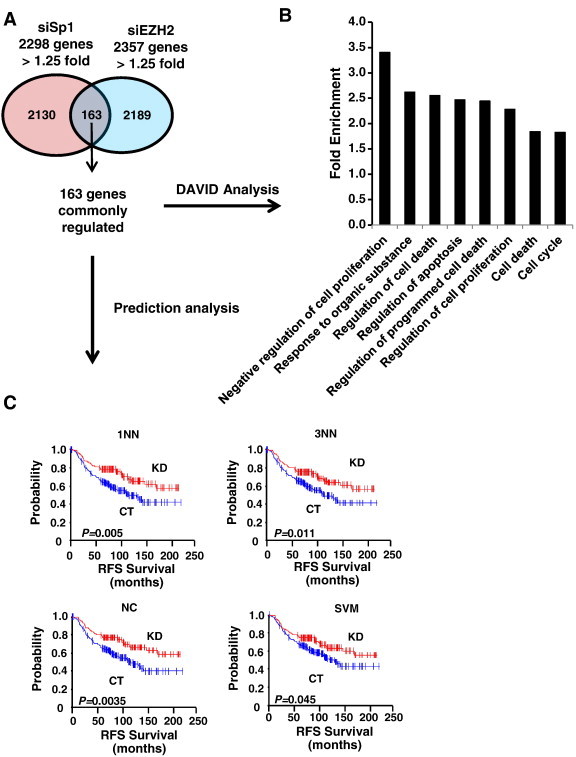
The shared gene signature between Sp1 and EZH2 knockdown genes in MDA-MB-321 cells. (A) The 163 genes commonly down-regulated (> 1.25-fold). (B) Gene ontology of the 163 commonly down-regulated genes using DAVID analysis. (C) Release-free survival (RFS) of breast cancer patients (NKI cohort, N = 295) were predicted by means of the Sp1- knockdown gene expression signature common to EZH2-knockdown gene signature as a classifier in the Kaplan-Meier plots (log-rank test). This common gene expression signature sets up the series of classifiers that assesses the probability of similarity between the expression pattern of a particular breast cancer patient and the common gene signature. The patient who possesses the similar gene expression pattern to control (CT) vs. to Sp1 knockdown (KD). 1NN, one nearest neighbor, 3NN, three nearest neighbors; NC, nearest centroid; SVM, support vector machines; BAS, Bayesian; CCP, compound covariate predictor; and LDA, linear discriminator analysis.
A Therapeutic Potential of Sp/EZH2 Oncogenic Signaling Axis in Breast Cancer
Several anticancer drugs, including betulinic acid (BA), down-regulate Sp1, Sp3 and Sp4 through multiple pathways [1], [2], [3], [4], [5], [6], [7], [8], [9]. Results in Figure 6A show that 15 μM BA induced a time-dependent induction of ZBTB4 and down-regulation of Sp1, Sp3, Sp4, EZH2, miR-106a, miR-106b and miR-20a, and inhibition of MDA-MB-231 cell proliferation (Supplementary Figure 8), demonstrating that BA disrupted miR-ZBTB4 interactions. In vivo administration of BA to athymic nude mice bearing MDA-MB-231 cells as xenografts inhibited tumor growth, and H&E staining showed a more diffused and disorganized staining pattern in tumors from corn oil (solvent)-treated control animals compared to BA-treated animals (Figure 6B). Lung tissue from these animals was stained with H&E to determine lung metastasis of the breast tumors and compared to corn oil-treated controls, and the results showed that BA inhibited colonization potential of MDA-MB-231 cells to lung and this was quantitated using foci in BA-treated and control lungs (Figure 6B). Moreover, BA also decrease expression of EZH2, Sp1, Sp3 and Sp4 proteins in tumors and this was accompanied by decreased expression of miR-106a, miR-106b and miR20a (Figure 6C) and these data complemented results of in vitro studies and establish that EZH2 is regulated by Sp transcription factors which are themselves regulated by a miR-ZBTB4 axis.
Figure 6.
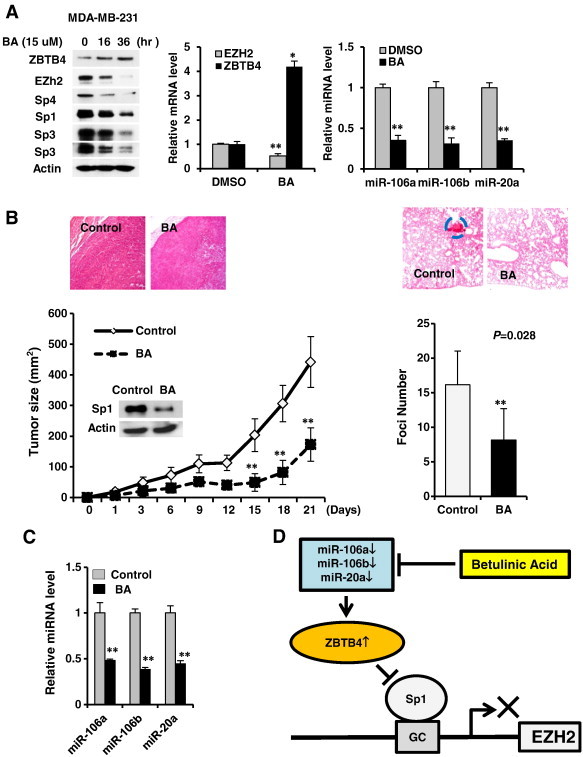
Betulinic acid (BA) disrupts miR-ZBTB4 and inhibits tumor growth. (A) Treatment of MDA-MB-231 cells with BA decreases expression of EZH2, Sp1, Sp3 and Sp4 proteins, induces ZBTB4, decreases EZH2 mRNA levels, and decreases miR-106a, mir-106b and miR-20a. (B) BA (15 mg/kg per day) decreases tumor growth (size) (right panel) or lung foci (left panels) in athymic nude mice bearing MDA-MB-231 cells as xenografts or administered by tail vein injection, respectively. (C) BA also decreases expression of miRs in tumors as determined by real time PCR. (D) Regulation of EZH2 expression by oncogenic-miR/ZBTB4 vs. Sp protein signaling axis and its disruption by BA in breast cancer cells.
Discussion
The Polycomb Repressive Complex 2 (PRC2) exhibits histone methyltransferase (HMT) activity that catalyzes methylation of histone lysine residues, and PRC2-dependent gene silencing in cancer cells and tumors results in enhanced cancer cell proliferation, survival and metastasis [22], [23], [24], [25], [26]. The PRC2 complex contains three major components: Enhancer of Zeste Homolog 2 (EZH2); Embryonic Ectoderm Development (EED); and Suppressor Zeste 12 (SUZ12). EZH2 is the catalytic subunit of this complex and contains domains for binding EED and SUZ12 and HMTase activity [25], [26]. EZH2 catalyzes methylation of lysine-27 of histone H3 (H3K27), and the predominant trimethylated form (me3) is associated with gene silencing.
EZH2 overexpression has been observed in multiple types of cancer (reviewed in [27)], and in epidemiological studies EZH2 is associated with highly aggressive tumors and poor patient prognosis [28], [29], [30], [31], [32], [33]. For example, in breast cancer cells transfected with siRNA against EZH2 (siEZH2), there was decreased cell and tumor growth, G0/G1 to S phase cell cycle arrest, and induction of apoptosis, and this was accompanied by alterations in histone methylation status [32], [33], [34]. Similar results were observed in other cancer cell types with some differences with respect to siEZH2-dependent inhibition of G0/G1 to S phase progression in breast cancer cells vs. G2/M arrest in transformed fibroblasts [35]. EZH2 also promotes expansion of breast tumor initiating cells, leading to enhanced β-catenin signaling [36].
EZH2 expression is regulated by multiple transcription factors; for example, p53 suppresses EZH2 through direct interactions with the EZH2 promoter [37]. E2F transcription factors activate EZH2 and bind to the EZH2 promoter and this is due to retinoblastoma protein (Rb) and its regulation of the E2F pathway [38], [39]. EZH2 is also directly targeted by microRNAs-26a (miR-26a) and miR-101 and loss of these miRs is correlated with high expression of EZH2 [39], [40], [41], [42]. However, it is clear from this study that knockdown of Sp1, Sp3 and Sp4 proteins by RNAi decreases EZH2 protein and mRNA levels not only in estrogen receptor (ER)-positive MCF-7 and but also in highly aggressive ER-negative MDA-MB-231 breast cancer cells (Figure 3A and B). Moreover, EMSA and ChIP assays confirm that Sp1 binds the GC-rich regions of the EZH2 promoter, and agents such as mithramycin and a dominant negative construct (GAL4-Sp1 DBD) that inactivate transcription from GC-rich motifs also inhibit EZH2 expression in breast cancer cells (Figure 3). BA is an anticancer drug that decreases expression of Sp transcription factors through both transcriptional (inhibition) and degradation pathways [1], [2], [5] and in this study, BA also down-regulated Sp1, Sp3, Sp4 and EZH2 in tumors (xenografts) and MDA-MB-231 cells (Figure 6). Results of RNAi, gel mobility shift and ChIP assays, and transfection with antagomirs and ZBTB4 demonstrate for the first time that EZH2 is an Sp-regulated gene in breast cancer.
ZBTB4 expression in breast cancer patients is a prognostic factor for increased patient survival [11] (Figure 1B). EZH2 is one of 34 genes whose expression is inversely correlated with ZBTB4 and, not surprisingly, high EZH2 expression is a negative prognostic factor for relapse- free survival of breast cancer patients (Figure 1B) [10]. Since EZH2 is an Sp-regulated gene and ZBTB4 is an “Sp repressor” [10], we further investigated the role of ZBTB4 as an “EZH2 repressor” and regulation of ZBTB4-EZH2 interactions by miR-106b and other paralogues such as miR-20a and miR-106a that are overexpressed in breast cancer patients [19], [20] and target (repress) ZBTB4 [10]. Of note, Pearson's correlation analysis showed that EZH2 expression was inversely correlated with ZBTB4 expression, suggesting that they possible mutual regulation of expression, which is consistent with results illustrated in Figures 2A, 6A and Supplementary Figure 9.
Members of the miR-17-92, miR-106a-363 and miR-106b-25 clusters such as miR-20a, miR-106a and miR-106b have identical seed sequence, and previous studies in this laboratory show that ZBTB4 is suppressed by these miRs in breast cancer cells [10]. Since miR-dependent suppression of ZBTB4 facilitates high expression of Sp1, Sp3 and Sp4, it is not surprising that both overexpression of ZBTB4 or miR-20a, miR-106a and miR-106b antagomirs all decrease expression of EZH2 in breast cancer cells (Figures 4 and 5) and this suppression is associated with recruitment of ZBTB4 and loss of Sp1 on the EZH2 promoter (Figure 4D). Our results also show that knockdown of Sp1 and Sp4 (or overexpression of ZBTB4) decreases miR-20a, miR-106a and miR-106b levels in MDA-MB-231 cells (Figure 5C). Betulinic acid also decreases EZH2, Sp1, Sp3 and Sp4 expression in breast cancer cells and this is consistent with the decrease of Sp transcription factors by betulinic acid in other cancer cell lines [1], [2], [5], [43], [44], [45]. Betulinic acid-induced disruption of the miR-ZBTB4 interactions (Figure 6A and C) suggest that mechanism of action primarily involves transcriptional repression (Figure 6D). The inverse relationship between ZBTB4 and EZH2 in terms of prognosis for disease-free survival and expression patterns (Figures 1C and 4D) also correlates with their different functional activities in breast cancer [11], [30], [31], [32], [33], [34], [35], [36]. Since Sp1 regulates EZH2 expression, we also examined the prognostic significance and association of Sp1 and EZH2 in gene profiling studies and show by RNAi that Sp1 and EZH2 regulate expression of 163 genes in common which in turn are primarily involved in cell proliferation and cell death pathways (Figure 5B and Supplementary Table 3). Moreover, the prognostic importance of the shared Sp1/EZH2-dependent 163 gene expression signature using seven different algorithm prediction analyses [12] show that this common gene signature is significantly associated with relapse-free survival of breast cancer patients when assessed at least by four different classifiers (Figure 5C). This is consistent with our functional studies showing that Sp transcription factors potentially represent an important class of non-oncogenes that are essential for maintaining the breast tumor phenotype without exhibiting any mutational phenotype [46], [47], [48].
In summary, our results demonstrate that expression of EZH2 in breast cancer is regulated by both Sp transcription factors (expression) and ZBTB4 (repression) (Figures 2 and 3). The breast cancer phenotype which features high expression of Sp1, Sp3, Sp4, EZH2 and other Sp-regulated genes is maintained by miR-dependent suppression of ZBTB4, and drugs such as BA that target miR downregulation inhibit tumor growth, in part, through increasing ZBTB4/Sp ratios. Previous studies show that miR-27a-dependent suppression of the Sp repressor ZBTB10 also contributes to high expression of Sp transcription factors in breast cancer [10], [44], [45], and miR-27a:ZBTB10 interactions would also contribute to the pathways illustrated in Figure 6D. However, in contrast to ZBTB4, ZBTB10 expression is not a significant prognostic factor and is not inversely correlated with EZH2 expression in breast tumors, suggesting that ZBTB4 may regulates a distinct set of genes compared to ZBTB10. Moreover, using both EZH2 and ZBTB4 expression as double prognostic markers shows the combined marker (EZH2highZBTB4low vs. EZH2lowZBTB4high groups) was more effective as a prognostic indicator than either ZBTB4 or EZH2 alone (Supplementary Figure 10). Our future studies are focused not only on miR-ZBTB (repressor)-dependent regulation of EZH2 but also on the function of the PRC2 complex and PRC2-regulated genes. We are also developing drugs such as betulinic acid that target the PRC2 complex in cancer cells and tumors, since this would be a novel therapeutic approach for combination therapies with radiation and other chemotherapeutic agents.
Footnotes
Funding: This research was supported by Cincinnati Cancer Center Pilot Grant Program, National Institutes of Health and Texas AgriLife (UC P30-S11229, R01CA136571 and TAMU P30-ES023512).
Disclosure of Conflicts of Interest: None.
Supplementary data to this article can be found online at http://dx.doi.org/10.1016/j.neo.2014.09.011.
Appendix A. Supplementary Data
Supplementary Material
References
- 1.Chintharlapalli S., Papineni S., Ramaiah S.K., Safe S. Betulinic acid inhibits prostate cancer growth through inhibition of specificity protein transcription factors. Cancer Res. 2007;67:2816–2823. doi: 10.1158/0008-5472.CAN-06-3735. [DOI] [PubMed] [Google Scholar]
- 2.Chintharlapalli S., Papineni S., Lei P., Pathi S., Safe S. Betulinic acid inhibits colon cancer cell and tumor growth and induces proteasome-dependent and -independent downregulation of specificity proteins (Sp) transcription factors. BMC Cancer. 2011;11:371. doi: 10.1186/1471-2407-11-371. [DOI] [PMC free article] [PubMed] [Google Scholar]
- 3.Chintharlapalli S., Papineni S., Abdelrahim M., Abudayyeh A., Jutooru I., Chadalapaka G. Oncogenic microRNA-27a is a target for anticancer agent methyl 2-cyano-3,11-dioxo-18beta-olean-1,12-dien-30-oate in colon cancer cells. Int J Cancer. 2009;125:1965–1974. doi: 10.1002/ijc.24530. [DOI] [PMC free article] [PubMed] [Google Scholar]
- 4.Jutooru I., Chadalapaka G., Abdelrahim M., Basha M.R., Samudio I., Konopleva M. Methyl 2-cyano-3,12-dioxooleana-1,9-dien-28-oate decreases specificity protein transcription factors and inhibits pancreatic tumor growth: role of microRNA-27a. Mol Pharmacol. 2010;78:226–236. doi: 10.1124/mol.110.064451. [DOI] [PMC free article] [PubMed] [Google Scholar]
- 5.Chadalapaka G., Jutooru I., Burghardt R., Safe S. Drugs that target specificity proteins downregulate epidermal growth factor receptor in bladder cancer cells. Mol Cancer Res. 2010;8:739–750. doi: 10.1158/1541-7786.MCR-09-0493. [DOI] [PMC free article] [PubMed] [Google Scholar]
- 6.Chadalapaka G., Jutooru I., Chintharlapalli S., Papineni S., Smith R., III, Li X. Curcumin decreases specificity protein expression in bladder cancer cells. Cancer Res. 2008;68:5345–5354. doi: 10.1158/0008-5472.CAN-07-6805. [DOI] [PMC free article] [PubMed] [Google Scholar]
- 7.Abdelrahim M., Baker C.H., Abbruzzese J.L., Safe S. Tolfenamic acid and pancreatic cancer growth, angiogenesis, and Sp protein degradation. J Natl Cancer Inst. 2006;98:855–868. doi: 10.1093/jnci/djj232. [DOI] [PubMed] [Google Scholar]
- 8.Pathi S.S., Jutooru I., Chadalapaka G., Sreevalsan S., Anand S., Thatcher G.R. GT-094, a NO-NSAID, inhibits colon cancer cell growth by activation of a reactive oxygen species - microRNA-27a: ZBTB10-specificity protein pathway. Mol Cancer Res. 2011;9:195–202. doi: 10.1158/1541-7786.MCR-10-0363. [DOI] [PMC free article] [PubMed] [Google Scholar]
- 9.Jutooru I., Guthrie A.S., Chadalapaka G., Pathi S., Kim K. Mechanism of action of phenethylisothiocyanate and other reactive oxygen species-inducing anticancer agents. Mol Cell Biol. 2014;34(13):2382–2395. doi: 10.1128/MCB.01602-13. [DOI] [PMC free article] [PubMed] [Google Scholar]
- 10.Mertens-Talcott S.U., Chintharlapalli S., Li X., Safe S. The oncogenic microRNA-27a targets genes that regulate specificity protein transcription factors and the G2-M checkpoint in MDA-MB-231 breast cancer cells. Cancer Res. 2007;67:11001–11011. doi: 10.1158/0008-5472.CAN-07-2416. [DOI] [PubMed] [Google Scholar]
- 11.Kim K., Chadalapaka G., Lee S.O., Yamada D., Sastre-Garau X., Defossez P.A. Identification of oncogenic microRNA-17-92/ZBTB4/specificity protein axis in breast cancer. Oncogene. 2012;31:1034–1044. doi: 10.1038/onc.2011.296. [DOI] [PMC free article] [PubMed] [Google Scholar]
- 12.Park Y.Y., Kim K., Kim S.B., Hennessy B.T., Kim S.M., Park E.S. Reconstruction of nuclear receptor network reveals that NR2E3 is a novel upstream regulator of ESR1 in breast cancer. EMBO Mol Med. 2012;4:52–67. doi: 10.1002/emmm.201100187. [DOI] [PMC free article] [PubMed] [Google Scholar]
- 13.Sabatier R., Finetti P., Cervera N., Lambaudie E., Esterni B., Mamessier E. A gene expression signature identifies two prognostic subgroups of basal breast cancer. Breast Cancer Res Treat. 2011;126:407–420. doi: 10.1007/s10549-010-0897-9. [DOI] [PubMed] [Google Scholar]
- 14.Xu X., Zhao Y., Simon R. Gene set expression comparison kit for BRB-array tools. Bioinformatics. 2008;24:137–139. doi: 10.1093/bioinformatics/btm541. [DOI] [PubMed] [Google Scholar]
- 15.Huang da W., Sherman B.T., Lempicki R.A. Systematic and integrative analysis of large gene lists using DAVID bioinformatics resources. Nat Protoc. 2009;4:44–57. doi: 10.1038/nprot.2008.211. [DOI] [PubMed] [Google Scholar]
- 16.Wingender E., Chen X., Hehl R., Karas H., Liebich I., Matys V. TRANSFAC: an Integrated system for gene expression regulation. Nucleic Acids Res. 2000;28:316–319. doi: 10.1093/nar/28.1.316. [DOI] [PMC free article] [PubMed] [Google Scholar]
- 17.Jia Z., Zhang J., Wei D., Wang L., Yuan P., Le X. Molecular basis of the synergistic antiangiogenic activity of bevacizumab and mithramycin A. Cancer Res. 2007;67:4878–4885. doi: 10.1158/0008-5472.CAN-06-3494. [DOI] [PubMed] [Google Scholar]
- 18.Kim K., Barhoumi R., Burghardt R., Safe S. Analysis of estrogen receptor alpha-Sp1 interactions in breast cancer cells by fluorescence resonance energy transfer. Mol Endocrinol. 2005;19:843–854. doi: 10.1210/me.2004-0326. [DOI] [PubMed] [Google Scholar]
- 19.Mendell J.T. miRiad roles for the miR-17–92 cluster in development and disease. Cell. 2008;133:217–222. doi: 10.1016/j.cell.2008.04.001. [DOI] [PMC free article] [PubMed] [Google Scholar]
- 20.Blenkiron C., Goldstein L.D., Thorne N.P., Spiteri I., Chin S.F., Dunning M.J. MicroRNA expression profiling of human breast cancer identifies new markers of tumor subtype. Genome Biol. 2007;8:R214. doi: 10.1186/gb-2007-8-10-r214. [DOI] [PMC free article] [PubMed] [Google Scholar]
- 21.Reinhold W.C., Sunshine M., Liu H., Varma S., Kohn K.W., Morris J., Doroshow J., Pommier Y. Cell Miner: a web-based suite of genomic and pharmacologic tools to explore transcript and drug patterns in the NCI-60 cell line set. Cancer Res. 2012;72(14):3499–3511. doi: 10.1158/0008-5472.CAN-12-1370. [DOI] [PMC free article] [PubMed] [Google Scholar]
- 22.Farazi T.A., Horlings H.M., Ten Hoeve J.J., Mihailovic A., Halfwerk H., Morozov P. MicroRNA sequence and expression analysis in breast tumors by deep sequencing. Cancer Res. 2011;71:4443–4453. doi: 10.1158/0008-5472.CAN-11-0608. [DOI] [PMC free article] [PubMed] [Google Scholar]
- 23.Sparmann A., van Lohuizen M. Polycomb silencers control cell fate, development and cancer. Nat Rev Cancer. 2006;6:846–856. doi: 10.1038/nrc1991. [DOI] [PubMed] [Google Scholar]
- 24.Fraga M.F., Ballestar E., Villar-Garea A., Boix-Chornet M., Espada J., Schotta G. Loss of acetylation at Lys16 and trimethylation at Lys20 of histone H4 is a common hallmark of human cancer. Nat Genet. 2005;37:391–400. doi: 10.1038/ng1531. [DOI] [PubMed] [Google Scholar]
- 25.Cao R., Wang L., Wang H., Xia L., Erdjument-Bromage H., Tempst P. Role of histone H3 lysine 27 methylation in Polycomb-group silencing. Science. 2002;298:1039–1043. doi: 10.1126/science.1076997. [DOI] [PubMed] [Google Scholar]
- 26.Kuzmichev A., Nishioka K., Erdjument-Bromage H., Tempst P., Reinberg D. Histone methyltransferase activity associated with a human multiprotein complex containing the Enhancer of Zeste protein. Genes Dev. 2002;16:2893–2905. doi: 10.1101/gad.1035902. [DOI] [PMC free article] [PubMed] [Google Scholar]
- 27.Rea S., Eisenhaber F., O'Carroll D., Strahl B.D., Sun Z.W., Schmid M. Regulation of chromatinstructure by site-specific histone H3 methyltransferases. Nature. 2000;406:593–599. doi: 10.1038/35020506. [DOI] [PubMed] [Google Scholar]
- 28.Simon J.A., Lange C.A. Roles of the EZH2 histone methyltransferase in cancer epigenetics. Mutat Res. 2008;647:21–29. doi: 10.1016/j.mrfmmm.2008.07.010. [DOI] [PubMed] [Google Scholar]
- 29.Collett K., Eide G.E., Arnes J., Stefansson I.M., Eide J., Braaten A. Expression of enhancer of zeste homologue 2 is significantly associated with increased tumor cell proliferation and is a marker of aggressive breast cancer. Clin Cancer Res. 2006;12:1168–1174. doi: 10.1158/1078-0432.CCR-05-1533. [DOI] [PubMed] [Google Scholar]
- 30.Bachmann I.M., Halvorsen O.J., Collett K., Stefansson I.M., Straume O., Haukaas S.A. EZH2 expression is associated with high proliferation rate and aggressive tumor subgroups in cutaneous melanoma and cancers of the endometrium, prostate, and breast. J Clin Oncol. 2006;24:268–273. doi: 10.1200/JCO.2005.01.5180. [DOI] [PubMed] [Google Scholar]
- 31.Kleer C.G., Cao Q., Varambally S., Shen R., Ota I., Tomlins S.A. EZH2 is a marker of aggressive breast cancer and promotes neoplastic transformation of breast epithelial cells. Proc Natl Acad Sci U S A. 2003;100:11606–11611. doi: 10.1073/pnas.1933744100. [DOI] [PMC free article] [PubMed] [Google Scholar]
- 32.Ding L., Erdmann C., Chinnaiyan A.M., Merajver S.D., Kleer C.G. Identification of EZH2 as a molecular marker for a precancerous state in morphologically normal breast tissues. Cancer Res. 2006;66:4095–4099. doi: 10.1158/0008-5472.CAN-05-4300. [DOI] [PubMed] [Google Scholar]
- 33.Raaphorst F.M., Meijer C.J., Fieret E., Blokzijl T., Mommers E., Buerger H. Poorly differentiated breast carcinoma is associated with increased expression of the human polycomb group EZH2 gene. Neoplasia. 2003;5:481–488. doi: 10.1016/s1476-5586(03)80032-5. [DOI] [PMC free article] [PubMed] [Google Scholar]
- 34.Bracken A.P., Pasini D., Capra M., Prosperini E., Colli E., Helin K. EZH2 is downstream of the pRB-E2F pathway, essential for proliferation and amplified in cancer. EMBO J. 2003;22:5323–5335. doi: 10.1093/emboj/cdg542. [DOI] [PMC free article] [PubMed] [Google Scholar]
- 35.Tan J., Yang X., Zhuang L., Jiang X., Chen W., Lee P.L. Pharmacologic disruption of Polycomb-repressive complex 2-mediated gene repression selectively induces apoptosis in cancer cells. Genes Dev. 2007;21:1050–1063. doi: 10.1101/gad.1524107. [DOI] [PMC free article] [PubMed] [Google Scholar]
- 36.Gonzalez M.E., Li X., Toy K., DuPrie M., Ventura A.C., Banerjee M. Downregulation of EZH2 decreases growth of estrogen receptor-negative invasive breast carcinoma and requires BRCA1. Oncogene. 2009;28:843–853. doi: 10.1038/onc.2008.433. [DOI] [PMC free article] [PubMed] [Google Scholar]
- 37.Chang C.J., Yang J.Y., Xia W., Chen C.T., Xie X., Chao C.H. EZH2 promotes expansion of breast tumor initiating cells through activation of RAF1-beta-catenin signaling. Cancer Cell. 2011;19:86–100. doi: 10.1016/j.ccr.2010.10.035. [DOI] [PMC free article] [PubMed] [Google Scholar]
- 38.Tang X., Milyavsky M., Shats I., Erez N., Goldfinger N., Rotter V. Activated p53 suppresses the histone methyltransferase EZH2 gene. Oncogene. 2004;23:5759–5769. doi: 10.1038/sj.onc.1207706. [DOI] [PubMed] [Google Scholar]
- 39.Muller H., Bracken A.P., Vernell R., Moroni M.C., Christians F., Grassilli E. E2Fs regulate the expression of genes involved in differentiation, development, proliferation, and apoptosis. Genes Dev. 2001;15:267–285. doi: 10.1101/gad.864201. [DOI] [PMC free article] [PubMed] [Google Scholar]
- 40.Wong C.F., Tellam R.L. MicroRNA-26a targets the histone methyltransferase Enhancer of Zeste homolog 2 during myogenesis. J Biol Chem. 2008;283:9836–9843. doi: 10.1074/jbc.M709614200. [DOI] [PubMed] [Google Scholar]
- 41.Zhang B., Liu X.X., He J.R., Zhou C.X., Guo M., He M. Pathologically decreased miR-26a antagonizes apoptosis and facilitates carcinogenesis by targeting MTDH and EZH2 in breast cancer. Carcinogenesis. 2011;32:2–9. doi: 10.1093/carcin/bgq209. [DOI] [PubMed] [Google Scholar]
- 42.Varambally S., Cao Q., Mani R.S., Shankar S., Wang X., Ateeq B. Genomic loss of microRNA-101 leads to overexpression of histone methyltransferase EZH2 in cancer. Science. 2008;322:1695–1699. doi: 10.1126/science.1165395. [DOI] [PMC free article] [PubMed] [Google Scholar]
- 43.Friedman J.M., Liang G., Liu C.C., Wolff E.M., Tsai Y.C., Ye W. The putative tumor suppressor microRNA-101 modulates the cancer epigenome by repressing the polycomb group protein EZH2. Cancer Res. 2009;69:2623–2629. doi: 10.1158/0008-5472.CAN-08-3114. [DOI] [PubMed] [Google Scholar]
- 44.Hua W.F., Fu Y.S., Liao Y.J., Xia W.J., Chen Y.C., Zeng Y.X. Curcumin induces down- regulation of EZH2 expression through the MAPK pathway in MDA-MB-435 human breast cancer cells. Eur J Pharmacol. 2010;637:16–21. doi: 10.1016/j.ejphar.2010.03.051. [DOI] [PubMed] [Google Scholar]
- 45.Mertens-Talcott S.U., Noratto G.D., Li X., Angel-Morales G., Bertoldi M.C., Safe S. Betulinic acid decreases ER-negative breast cancer cell growth in vitro and in vivo: Role of Sp transcription factors and microRNA-27a:ZBTB10. Mol Carcinog. 2013;52:591–602. doi: 10.1002/mc.21893. [DOI] [PMC free article] [PubMed] [Google Scholar]
- 46.Liu X., Jutooru I., Lei P., Kim K., Lee S.O., Brents L.K. Betulinic acid targets YY1 and ErbB2 through cannabinoid receptor-dependent disruption of MicroRNA-27a:ZBTB10 in breast cancer. Mol Cancer Ther. 2012;11:1421–1431. doi: 10.1158/1535-7163.MCT-12-0026. [DOI] [PMC free article] [PubMed] [Google Scholar]
- 47.Luo J., Solimini N.L., Elledge S.J. Principles of cancer therapy: oncogene and non-oncogene addiction. Cell. 2009;136:823–837. doi: 10.1016/j.cell.2009.02.024. [DOI] [PMC free article] [PubMed] [Google Scholar]
- 48.Chen D.Y., Liu H., Takeda S., Tu H.C., Sasagawa S., Van Tine B.A. Taspase1 functions as a non-oncogene addiction protease that coordinates cancer cell proliferation and apoptosis. Cancer Res. 2010;70:5358–5367. doi: 10.1158/0008-5472.CAN-10-0027. [DOI] [PMC free article] [PubMed] [Google Scholar]
Associated Data
This section collects any data citations, data availability statements, or supplementary materials included in this article.
Supplementary Materials
Supplementary Material