Abstract
The availability of the assembled mouse genome makes possible, for the first time, an alignment and comparison of two large vertebrate genomes. We investigated different strategies of alignment for the subsequent analysis of conservation of genomes that are effective for assemblies of different quality. These strategies were applied to the comparison of the working draft of the human genome with the Mouse Genome Sequencing Consortium assembly, as well as other intermediate mouse assemblies. Our methods are fast and the resulting alignments exhibit a high degree of sensitivity, covering more than 90% of known coding exons in the human genome. We obtained such coverage while preserving specificity. With a view towards the end user, we developed a suite of tools and Web sites for automatically aligning and subsequently browsing and working with whole-genome comparisons. We describe the use of these tools to identify conserved non-coding regions between the human and mouse genomes, some of which have not been identified by other methods.
The expectation behind the sequencing of the mouse genome is to gain a deeper understanding of the human genome through comparative analysis. Comparative genomic studies of selected regions have already resulted in interesting biological discoveries; from many examples we mention here the discovery of new genes (Dehal et al. 2001; Pennacchio et al. 2001) and the identification of conserved non-coding sequences with regulatory functions (Hardison et al. 1997; Oeltjen et al. 1997; Hardison 2000; Loots et al. 2000; Krivan and Wasserman 2001). These comparative genomic studies were based on sequence alignments and were successful because the evolutionary distance between mouse and human appears to be small enough so that genes and other functional elements have been conserved in both sequence (Hardison et al. 1997; Batzoglou et al. 2000) and function (Huxley 1997). On the other hand, sufficient time has elapsed so that nonfunctional sequence has diverged enough to yield a good “signal to noise” ratio.
Alignments of whole genomes have been undertaken for complete genomic sequences of various bacterial species (Tatusov et al. 1997; Delcher et al. 1999; Florea et al. 2000), and that was feasible due to the small genomic size of these organisms (up to 4 Mb). The recently published Fugu genome (Aparicio et al. 2002) was aligned to the human genome using the BLAST program (Aetshul et al. 1990), but the complexity of the problem was mitigated by the small size of the Fugu genome and its relatively simple repeat structure. A similar local alignment approach was applied to the mouse genome by the BLASTZ group (Schwartz et al. 2003).
Aligning large vertebrate genomes that are structurally complex poses a variety of problems not encountered on smaller scales. Such genomes are rich in repetitive elements (∼50% in the human genome, International Human Genome Sequencing Consortium 2001; Venter et al. 2001) and contain multiple segmental duplications (the human genome seems likely to contain about 5% segmental duplication, with most of this sequence in large blocks greater than 10 kb; Bailey et al. 2002). The sizes of the sequences is perhaps the biggest hurdle, since many alignment algorithms were designed for comparing single proteins and are extremely inefficient when processing large genomic intervals (Miller 2001). The complexity of vertebrate genomes also increases the difficulty of identifying true orthologous DNA segments in alignments. Taking into account that there are sometimes near perfect matches between paralogous DNA regions, it is necessary to statistically assess the identification of the most likely orthologous DNA segments, while minimizing the rate of misaligned regions.
In this paper we describe our strategies and results for the human and mouse genomes. We integrated both local and global alignment programs, and our study provides the first quantitative analysis of how such strategies perform in tandem. The resulting implementation allows rapid and specific whole-genome alignments and comparisons.
The ultimate goal of genome alignment is to facilitate biological discovery, and with this in mind we also integrated in the computational system a variety of browsing and analysis tools. We present visualization tools for browsing the alignments, as well as a Web server that allows users to align their own sequences against completed genome assemblies.
METHODS
Algorithms
Finding the orthologous regions between two species computationally is a nontrivial task that has never been explored on a whole-genome scale for vertebrate genomes.
Local alignment tools find many high-scoring matching segments, in particular the orthologous segments, but in addition they identify many paralogous relationships, or even false-positive alignments resulting from simple sequence repeats and other sequence artifacts (Chen et al. 2001). BLAST was successfully utilized in the study by Gibbs and coauthors (Chen et al. 2001) where high-quality rat WGS reads (covering 7.5% of the rat genome) were compared with the GoldenPath human genome assembly. Those authors investigated statistical significance of BLAST search results and parameters, but they did not focus on finding ‘true’ orthologs and were mostly interested in higher sensitivity of alignment and completeness of coverage of coding exons. When compared with the human assembly, more than 47.3% of all aligned reads produced between two and 12 hits (which correspond to medium represented elements), and 7.6% had more than 12 hits (likely containing repetitive elements).
Unlike local alignment, global alignment methods require aligned features to be conserved in both order and orientation, and are therefore appropriate for aligning orthologous regions in the domain where this assumption applies. But whole-genome rearrangements, duplications, inversions, and other evolutionary events restrict the resolution at which the order and orientation assumption of global alignment applies. In the case of the human and mouse genomes, it appears that this assumption applies, on average, to regions less than eight megabases in length (Mural et al. 2002).
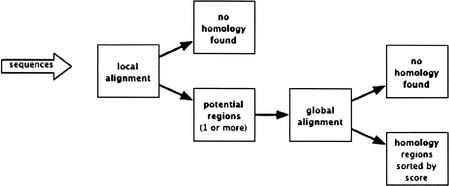
Our strategy is to use a fast local alignment method to find anchors on the base genome to identify regions of possible homology for a query sequence. The key element is then to be able to postprocess these anchors in order to delimit a region of homology where the order and orientation seem conserved. These regions are then globally aligned. In the work presented here, we used BLAT (Kent 2002) to find anchors and AVID (version 2.0 at http://bio.math.berkeley.edu/avid; Bray et al. 2003) to generate global alignments (see Fig. 1 for an overview of the pipeline and how they were combined). BLAT was designed for cDNA/DNA alignment and first used in Intronerator (Kent and Zahler 2000). BLAT is not optimized for cross-species alignments (Kent 2002), but we chose this program because our tests demonstrated that it performed very well as an anchoring tool in our computational scheme. It is also about 500 times faster than other existing alignment tools.
Figure 1.
General scheme of the pipeline. The pipeline processes individual contigs, supercontigs, or long fragments of assemblies.
Heuristic for Selecting Candidate Regions for Global Aligning (Postprocessing of Anchors)
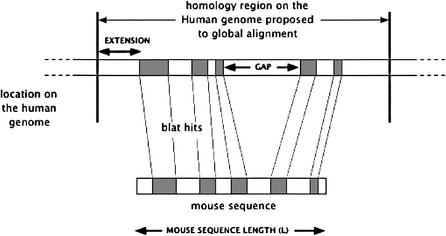
For each sequence, BLAT matches are sorted by score, and regions of possible homology are selected around the strongest matches which serve as anchors. All BLAT hits at most L bases apart are grouped together (here L is the length of the region being aligned). For groups smaller than L/4, the regions were then extended out by min(50k, L/2-–G) where G is the length of the group. For groups with G greater than L/4, the regions were extended out by min(50k,L/4). The groups obtained are compared and the ones with less than 30% of the score of the best group are rejected at this stage (see Fig. 2). Various parameters for these heuristics were explored in order to obtain a method that would work for different sizes of sequences.
Figure 2.
Heuristic for selecting anchors to determinate candidate regions for global alignment.
This heuristic may identify multiple regions of possible homology of different size and score in the base genome. These regions are proposed as candidates to the alignment program. The score obtained by the global alignment is used to make the decision about which alignments to report or to reject.
Strategies for Different Types of Analyzed Sequence
Different sequencing strategies, coupled with the various assembly methods used to build contigs and scaffolds, result in genomic sequence at different stages of completion and of different quality. There is a significant number of BAC-size finished contigs particularly suitable for higher-quality comparative analysis (Mardis et al. 2002), whereas whole-genome shotgun-generated assemblies result in shorter contigs and scaffolds. We developed different strategies for aligning sequences at different stages of completion by taking into account all available information, such as the scaffold or the map information. Table 1 summarizes the computational schemes we developed for different types of sequences.
Table 1.
Alignment Strategies for Different Types of Assemblies
| Method | Scheme of alignment | Examples |
| Contigs | Individual contigs | Finished BACs |
| Scaffold | Contigs can be reoriented and reordered | Arachne October 2001 Phusion November 2001 |
| Chopped pieces | Mouse chromosomes are chopped in 250 kb and aligned to the Human Genome | Celera chromosome 16 MGSC v3 |
In the case of finished BACs or individual sequences submitted by the user through the pipeline interface, no other information is available and we use a ‘contig’ scheme where mapping is based solely on the found anchors, followed by the global alignment stage with its scoring. When we align an assembly with the scaffold information available, anchors obtained for different contigs in a scaffold are analyzed together to select candidate positions. We map the whole scaffold, but have the flexibility to reorient and reorder each of the contigs in the scaffold at the alignment stage if necessary. The algorithm also allows us to break the scaffold by selecting more than one candidate region, so that some of the contigs can be aligned to a different place. These last two features allow our alignment to be tolerant to scaffold assembly errors.
For an advanced assembly, scaffold information is very reliable. In MGSCv3, the quality of assembly was high enough that contigs and scaffolds were mapped to the mouse chromosomes (Waterston et al. 2002). For such cases we chopped the mouse chromosomes into large sections before aligning them. The chromosomes were chopped around the contig boundaries in order not to split them. We tested different sizes and found that fragments averaging 250 kbp in length give us the best sensitivity.
RESULTS
Here we present the results of alignment of the Mouse Genome Sequencing Consortium assembly MGSCv3 with the June 2002 Human Genome freeze (NCBI build 30). Alignments on this freeze as well as the December 2001 freeze are available at http://pipeline.lbl.gov. The human genome sequence was soft-masked, so that repeats were not considered at the anchoring level, although the global alignments generated at later stages do extend into repeats.
Sensitivity
For the final alignment we calculated the level of coverage on known coding and non-coding functional features of the human genome (Table 2). The alignments were scored according to the procedure described in the paper on the mouse genome (Waterston et al. 2002). Three different evolutionary models were selected for scoring the alignments. For coding regions, a high stringency and high penalty for indels was chosen. In order to assess performance on less-conserved regulatory regions, we also applied less stringent filters. The overall coverage was computed, as well as the coverage of the RefSeq exons, upstream (100, 200, and 500 bp) and downstream (200 bp) regions, and UTR.
Table 2.
Percentage of Base Pairs Covered for Known Coding and Non-Coding Functional Features of the Human Genome
| Matrix loose threshold = 2500 | Matrix medium threshold = 2500 | Matrix loose threshold = 3400 | |
| Overall coverage | 22.15% | 7.26% | 4.48% |
| Feature coverage | |||
| Exons | 90.93% | 88.19% | 85.76% |
| UTR | 72.21% | 34.43% | 23.96% |
| Upstream 500 | 56.08% | 23.35% | 15.19% |
| Upstream 200 | 65.94% | 33.01% | 22.61% |
| Upstream 100 | 70.83% | 38.94% | 27.38% |
| Downstream 200 | 53.42% | 17.62% | 10.85% |
About 2% of aligned base pairs of the human genome were covered by more than one mouse sequence fragment. Figure 3 shows an example of a chromosome 3 location where several copies of the mouse pseudogene of Laminin B receptor (LAMR1) from different chromosomes was aligned (laminin B receptor has multiple pseudogenes, http://www.ncbi.nlm.nih.gov/LocusLink/).
Figure 3.
Location at chr3:38787874–38793594 on the human genome, June 2002 (hg12/ncbi30) where LAMR1 gene is covered by the alignments of sequences from different mouse chromosomes.
Our alignment showed more than one million regions conserved at higher than 70% conservation over the 100-bp level. These features cover about 217 million base pairs. Only 61.6% of them are covered by at least one base pair of a BLAT hit. This means that about two-fifths of the conserved features are found only at the global alignment stage. This result is critical because it proves that a local aligner such as BLAT, set up with parameters for which its sensitivity is not optimal, but its speed is, can nevertheless be used as an anchoring system because the global alignment retrieves many additional conserved regions outside the anchors (Fig. 4). The amount of conserved non-coding sequence was extraordinarily high. At least 5.82% of the bases in the genome are conserved at the 70%/100-bp threshold but do not overlap annotated RefSeq, mRNA, Genscan predictions, or ESTs. Our scheme has the flexibility to align a query sequence to multiple regions in the genome. Among the conserved features (70% over 100 bp), 6.6% of the total conserved sequences came from secondary hits. These conserved regions may arise from genomic rearrangements or duplications.
Figure 4.
The global alignment of the mouse finished sequence NT_002570 against the region found by BLAT anchors revealed conserved coding and non-coding elements not found by the BLAT program. The anchoring scheme is sensitive enough to provide the global alignment with the correct homology candidate. The location found for this mouse finished contig on the human genome, June 2002 (hg12/ncbi30) is chr20:42974590–42993423.
Specificity
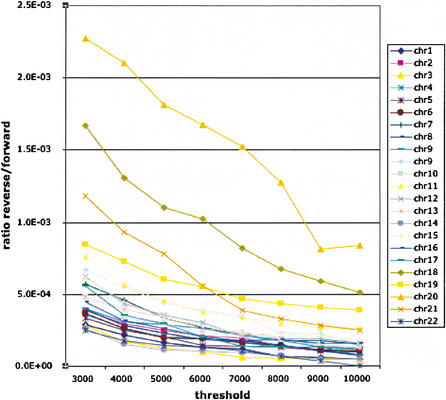
Measuring the specificity, that is, how much alignments are correct, is considerably more difficult than measuring the sensitivity. To test the specificity of our method, we aligned a “random” mouse genome obtained by reversing (not complementing) the mouse sequences (as proposed by A. Smit, pers. comm.). Figure 5 presents the ratio of the number of nucleotides on each human chromosome covered by alignments of the random mouse sequence and the number of nucleotides covered by the real one for each chromosome. Alignments were filtered out at different thresholds. For most of the chromosomes, this ratio is below 0.0005, meaning that less than 0.05% of the mouse versus human alignments can be accounted for by random sequence alignments even at low thresholds. This number is higher for certain chromosomes, especially short ones, partly because of numerical instability caused by the very small amount of alignment obtained on these chromosomes.
Figure 5.
The ratio of the number of nucleotides on each human chromosome covered by alignments of the random mouse sequence and the number of nucleotides covered by the real mouse sequence for each chromosome. Threshold definition is described in the alignment section of Waterston et al. (2002).
Another test to estimate specificity is to measure the total coverage of the human chromosome 20 by alignments of sequences from all mouse chromosomes with the exception of chromosome 2. The human chromosome 20 being entirely syntenic with the mouse chromosome 2, we should expect to have, for example, only a few percentage of nonsyntenic coverage coming from pseudogenes. We found a coverage of only 5.6% for exons, with the tight filter, and 0.43% for upstream 100, with the medium filter (Table 3). It is interesting to note that most of these are covered more than once.
Table 3.
Specificity Test: Coverage on Human Chromosome 20 Only By All the Mouse Chromosomes Except Chromosome 2
| Matrix loose threshold = 2500 | Matrix medium threshold = 2500 | Matrix tight threshold = 3400 | |
| Overall coverage | 0.49% | 0.29% | 0.22% |
| Features coverage | |||
| Exons | 5.57% | 5.36% | 5.06% |
| UTR | 3.85% | 2.71% | 1.84% |
| Upstream 500 | 0.10% | 0.09% | 0.08% |
| Upstream 200 | 0.24% | 0.22% | 0.19% |
| Upstream 100 | 0.46% | 0.43% | 0.35% |
| Downstream 200 | 1.59% | 0.91% | 0.23% |
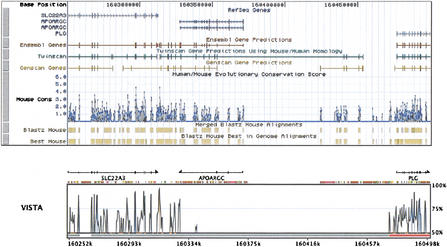
An interesting example is the case of the Apolipoprotein(a) region. The expressed gene is confined to a subset of primates, as most mammals lack apo(a). Only hedgehogs produce an apo(a)-like protein (Lawn et al. 1997). Figure 6 shows the coverage in this region by the mouse sequence utilizing two methods: BLASTZ (Schwartz et al. 2003) and the method presented here. Our method is the only one to predict that apo(a) has no homology in the mouse, as has been shown experimentally. This example is interesting because it uniquely demonstrates the importance of specificity.
Figure 6.
Apolipoprotein(a) region. The expressed gene is confined to a subset of primates, as most mammals lack apo(a). Shown are the coverage in this region by the mouse sequence utilizing Blastz and that obtained by the method presented here. Our method is the only one to predict that apo(a) has no homology in the mouse, as has been shown experimentally.
We set up a database of conserved elements obtained by three different groups using different methods of genome alignment (local and global) and the same conservation cutoff (available at http://pipeline.lbl.gov/cgi-bin/cnc). The most interesting result of comparing the three different sets of conserved non-coding sequences is that the sets overlap by no more than 80%. This suggests that a combination of strategies and methods could lead to a better overall whole-genome alignment; this is similar to the situation that has been observed in gene finding (Rogic et al. 2002). An analysis of conservation was performed, and every conserved region was classified as coding, noncoding, intronic, repetitive element, or UTR based on annotations associated with the human genome assembly. The alignments of the human and mouse sequences have revealed a significant number of conserved coding and non-coding elements. In addition to deciphering the coding component of the genome, the discovery of conserved non-coding sequences (CNCs) for their potential role in gene regulation is of particular interest. The identification of all such regions is complicated by the high level of conservation between as yet un-annotated coding regions (which can be viewed as non-coding false positives) and the variation in underlying mutation rates throughout the genome. As in the mouse genome paper (Waterston et al. 2002), we believe the annotation of the genome is not missing vast numbers of genes, which suggests that most of the CNC bases identified do not code for proteins.
Conserved sequences for the whole genome were calculated by identifying all regions at least 100-bp long conserved at greater than 70% identity. In many cases, this scheme has allowed for retrieving important regulatory sequences (Henkel et al. 1992; Loots et al. 2000). Alternatively, more sophisticated methods for retrieving “significant” conserved non-coding regions can be selected by the user, such as regions identified by scoring with evolutionary model-based matrices (Waterston et al. 2002).
Implementation
Database and Software
The pipeline was built on a MySQL database platform selected for its compatibility with major sources of annotation data such as Ensembl (Hubbard et al. 2002) and the UCSC Genome Browser (http://genome.ucsc.edu; Kent et al. 2002). The tables contain all the input sequences (format, draft, or finished), and all the data generated by the pipeline, repeat regions, anchors, alignments, and regions of high conservation (both coding and noncoding). The pipeline software consists of a combination of Perl, C, and Java programs. It includes a scheduler that gets control data from the database, builds a queue of jobs, and dispatches them to the computation nodes of the cluster for execution, and the main program that processes individual sequences. A Perl library acts as an interface between the database and the above programs. The use of a separate library allows the programs to function independently of the database schema. The library also improves on the standard Perl MySQL database interface package by providing auto-reconnect functionality and improved error handling.
One of the main features of the pipeline is its modular design, which allows us to be relatively independent of the specific choice of integrated programs; with slight modifications of input and output scripts, other alignment and visualization tools can substitute for the ones mentioned above. The code source is available at http://pipeline.lbl.gov/downloads.shtml.
Performance
The whole alignment of the mouse and the human genomes presented here took 17 h on a cluster of 16 2.2GHz Pentium IV CPUs (20 CPU d). For comparison, the Blastz alignment took an order of magnitude longer time (Waterston et al. 2002; Supp. Mat.). Our generated alignments represent 7.5GB of data, stored in binary format in a MySQL database, available for download in AXT format at http://pipeline.lbl.gov/downloads.shtml.
Data Presentation
Two schemes of data presentation on the whole genome scale are available to the user: the VISTA Genome Browser and the Text browser, both synchronized with the pipeline database. They can be accessed at the gateway site http://pipeline.lbl.gov.
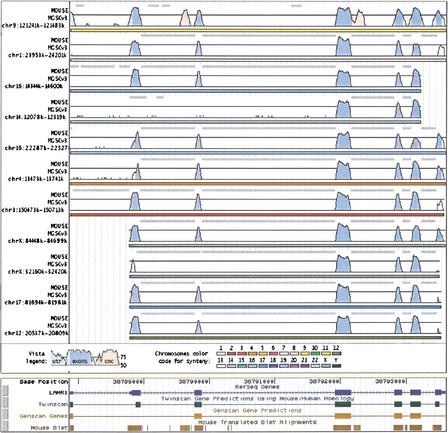
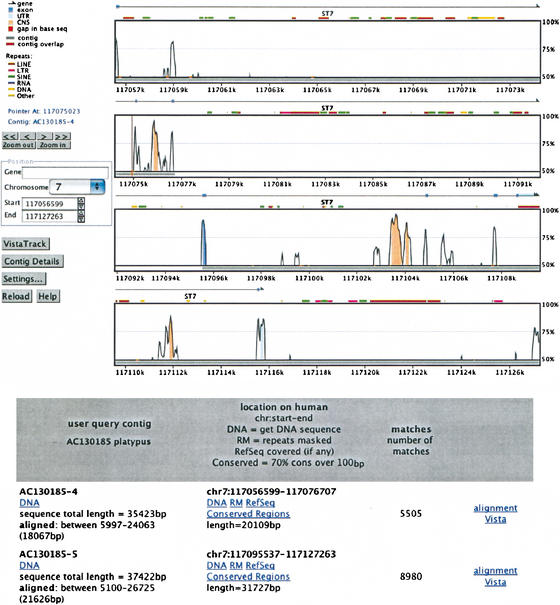
VISTA Genome Browser is a Java applet for interactively visualizing results of comparative sequence analysis in a VISTA format (Mayor et al. 2000) on the scale of whole chromosomes. It has a number of options, such as zoom, extraction of a region to be displayed, user-defined parameters for conservation level, and options for selecting sequence elements to study (Fig. 7). VISTA Genome Browser is realized as a dynamic Web-interface synchronized with the central MySQL.
Figure 7.
Results of an on-line submission of a draft unannotated platypus sequence to the genome alignment Web server. The gene has been correctly identified. Note the general lack of conservation in non-coding regions, except for a few highly conserved islands. The submission was done directly with the GenBank accession number (AC130185) and was completed in less than 30 sec.
The Text browser is the most direct front end to the central MySQL database. It allows a user to examine detailed information about each mouse sequence aligned to the selected region on the human genome. For each aligned region, the exact location of alignments on the human and mouse genomes, the sequences, alignments, coordinates of conserved regions, and much other information is easily retrieved.
The pipeline annotation of conserved regions is DAS-compatible (Distributed Annotation System, Dowell et al. 2001; Fumoto et al. 2002) and can be viewed through the Ensembl browser at http://www.ensembl.org (step-by-step instructions for viewing the data are available at http://pipeline.lbl.gov/das.shtml).
Web-Based Server To Align and Compare User-Submitted Sequences With a Base Genome
As described above, we developed alignment methods for sequences of different quality and length against the whole-genome assembly. Our computational system is open for user queries through a Web interface accessible from http://pipeline.lbl.gov. Comparative analysis can be done against the base human or mouse genomes. This server accepts sequences in either finished or draft format. Contigs in draft sequences are ordered and oriented according to their alignment with the base genome (Fig. 7). The server also accepts GenBank accession numbers and connects automatically to GenBank to retrieve the sequence. The user is provided with detailed results of the comparative analysis, including the alignments, VISTA pictures, and the ability to interactively navigate the Vista Genome Browser. A typical query sequence of up to a few hundred kilobases is processed in seconds. Based on current usage (5000 requests/month), we determined that the average query size is 150 kb.
DISCUSSION
As we mentioned above, an alignment of the whole human and mouse genomes represents an algorithmic challenge and yet holds the promise of significant biological understanding. We expect that the methodology for aligning the human and mouse genomes will change over time, eventually leading to a “true” alignment of the genomes which correctly identifies orthologous relationships between genes and nucleotides, and in which parologous genes and duplications within genomes are correctly handled. It seems to us that a dramatic improvement in the alignment of the human and mouse genomes will be possible with more genomes available.
Significant initial results from the alignment of the human and mouse genomes are that coding regions are highly conserved as expected, but an additional large portion of the genome (roughly as much sequence as is coding) is highly conserved with unknown function. This conserved sequence is arguably not coding and cannot all be explained by neutral evolution (Waterston et al. 2002). It is interesting to note that comparisons of three species (Dubchak et al. 2000) show that many human-mouse conserved regions are also present in the dog, suggesting that they may indeed be functional. Unfortunately, current methods for predicting transcription factor binding sites and other regulatory elements are not accurate enough to classify the conserved regions (Fickett and Wasserman 2000).
Our studies of alignment efficiency with respect to different contig sizes should be useful for dynamic alignment tools that rapidly align query sequences to genomes, and for devising strategies for combined local and global alignment. It is important to note that we specifically designed our method in such a way that anchor selection is a stand-alone module, so that different methods can be used without difficulty. For example, it is possible that other whole-genome local alignment methods such as PatternHunter (Ma et al. 2002) or BLASTZ (http://bio.cse.psu.edu/) could also be very effective at selecting anchors. We plan to test different local and global programs, and novel methods for combining them to optimize performance and accuracy of our comparative analysis scheme. Unfortunately, it still remains an open problem to devise accurate criteria for judging the accuracy of an alignment. The sensitivity is not that difficult to measure (one can, for example, check to see how many exons were aligned), but the specificity (a measure of how much incorrect alignment there is) is considerably harder to estimate, as we have discussed.
The alignments described here are currently being used by a number of projects, including a comparative-based annotation of genes in the human and mouse genomes (Pachter et al. 2002) and a study of the rearrangement history of the genomes (P. Pevzner, unpubl.). These projects will in turn lead to better alignments, and eventually, in conjunction with more genomes, a more complete understanding of genome evolution.
WEB SITE REFERENCES
http://pipeline.lbl.gov; comparative analysis pipeline gateway at Lawrence Berkeley National laboratory.
http://pipeline.lbl.gov/cgi-bin/cnc; database of conserved sequences from LBNL, PSU, and UCSC.
http://bio.math.berkeley.edu/avid; Avid Web site.
http://genome.ucsc.edu/; UCSC Web site from which the human genome assemblies used in this study where downloaded.
http://www.ncbi.nlm.nih.gov/LocusLink/; NCBI Locus Link.
http://pipeline.lbl.gov/downloads.shtml; Download page for whole- genome alignments and other materials.
http://www.ensembl.org; The ENSEMBL project Web site.
http://pipeline.lbl.gov/das.shtnl; Alignment DAS server.
http://bio.cse.psu.edu; BLASTZ.
Acknowledgments
We thank the Mouse Genome Sequencing Consortium for the opportunity to work with the mouse genome during the sequencing phases and in the subsequent analysis phase. The analysis group, comprising many individuals and teams from around the world, was particularly helpful not only in providing crucial suggestions and advice as the project unfolded, but also in contributing many independent ideas. Special thanks go to Jim Kent, who coordinated the alignment efforts of the mouse sequencing consortium analysis group and designed the filtering methods for calculating alignment coverage. Thanks also to the Penn State Group (Laura Elnitsky, Ross Hardison, Webb Miller, Scott Schwartz, and others) and the PatternHunter Group (Ming Li, Mike Zody, and others), who developed different alignment strategies which we compared. We thank Ivan Ovcharenko for initiating the project and developing the prototype. We also thank Serafim Batzoglou for his help with generating simulated reads and assemblies for our test sets. The project was partially supported by a Program for Genomic Applications grant from the National Heart Lung and Blood Institute. This work was supported by the Director, Office of Science, of the U.S. Department of Energy under Contract No. DE-AC03-76SF00098.
The publication costs of this article were defrayed in part by payment of page charges. This article must therefore be hereby marked “advertisement” in accordance with 18 USC section 1734 solely to indicate this fact.
E-MAIL ocouronne@lbl.gov; FAX (510) 486-5717. E-MAIL lpachter@math.berkeley.edu.
Article and publication are at http://www.genome.org/cgi/doi/10.1101/gr.762503.
REFERENCES
- 1.Altschul S.F., Gish, W., Miller, W., Myers, E.W., and Lipman, D.J. 1990. Basic local alignment search tool. J. Mol. Biol. 215: 403-410. [DOI] [PubMed] [Google Scholar]
- 2.Aparicio S., Chapman, J., Stupka, E., Putnam, N., Chia, J.M., Dehal, P., Christoffels, A., Rash, S., Hoon, S., Smit, A., et al. 2002. Whole-genome shotgun assembly and analysis of the genome of Fugu rubripes. Science 297: 1301-1310. [DOI] [PubMed] [Google Scholar]
- 3.Bailey J.A., Gu, Z., Clark, R.A., Reinert, K., Samonte, R.V., Schwartz, S., Adams, M.D., Myers, E.W., Li, P.W., Eichler, E.E., et al. 2002. Recent segmental duplication in the human genome. Science 297: 1003-1007. [DOI] [PubMed] [Google Scholar]
- 4.Batzoglou S., Pachter, L., Mesirov, J.P., Berger, B., and Lander, E.S. 2000. Human and mouse gene structure: Comparative analysis and application to exon prediction. Genome Res. 10: 950-958. [DOI] [PMC free article] [PubMed] [Google Scholar]
- 5.Bray, N., Dubchak, I., and Pachter, L. 2003. AVID: A global alignment program. Genome Res. (this issue). [DOI] [PMC free article] [PubMed]
- 6.Chen R., Bouck, J.B., Weinstock, G.M., and Gibbs, R.A. 2001. Comparing vertebrate whole-genome shotgun reads to the human genome. Genome Res. 11: 1807-1816. [DOI] [PMC free article] [PubMed] [Google Scholar]
- 7.Dehal P., Predki, P., Olsen, A.S., Kobayashi, A., Folta, P., Lucas, S., Land, M., Terry, A., Ecale Zhou, C.L., Rash, S., et al. 2001. Human chromosome 19 and related regions in mouse: Conservative and lineage-specific evolution. Science 293: 104-111. [DOI] [PubMed] [Google Scholar]
- 8.Delcher A.L., Kasif, S., Fleischmann, R.D., Peterson, J., White, O., and Salzberg, S.L. 1999. Alignment of whole genomes. Nucleic Acids Res. 27: 2369-2376. [DOI] [PMC free article] [PubMed] [Google Scholar]
- 9.Dowell R.D., Jokerst, R.M., Day, A., Eddy, S.R., and Stein, L. 2001. The distributed annotation system. BMC Bioinformatics 2: 7. [DOI] [PMC free article] [PubMed] [Google Scholar]
- 10.Dubchak I., Brudno, M., Pachter, L.S., Loots, G.G., Mayor, C., Rubin, E.M., and Frazer, K.A. 2000. Active conservation of non-coding sequences revealed by 3–way species comparisons. Genome Res. 10: 1304-1306. [DOI] [PMC free article] [PubMed] [Google Scholar]
- 11.Fickett J.W. and Wasserman, W.W. 2000. Discovery and modeling of transcriptional regulatory regions. Curr. Opin. Biotechnol. 11: 19-24. [DOI] [PubMed] [Google Scholar]
- 12.Florea L., Riemer, C., Schwartz, S., Zhang, Z., Stajonovic, N., Miller, W., and McClelland, M. 2000. Web-based visualization tools for bacterial genome alignments. Nucleic Acids Res. 28: 3486-3496. [DOI] [PMC free article] [PubMed] [Google Scholar]
- 13.Fumoto M., Miyazaki, S., and Sugawara, H. 2002. Genome Information Broker (GIB): Data retrieval and comparative analysis system for completed microbial genomes and more. Nucleic Acids Res. 30: 66-68. [DOI] [PMC free article] [PubMed] [Google Scholar]
- 14.Hardison R.C. 2000. Conserved non-coding sequences are reliable guides to regulatory elements. Trends Genet. 16: 369-372. [DOI] [PubMed] [Google Scholar]
- 15.Hardison R.C., Oeltjen, J., and Miller, W. 1997. Long human-mouse sequence alignments reveal novel regulatory elements: A reason to sequence the mouse genome. Genome Res. 7: 959-966. [DOI] [PubMed] [Google Scholar]
- 16.Henkel G., Weiss, D.L., McCoy, R., Deloughery, T., Tara, D., and Brown, M.A. 1992. A DNase I-hypersensitive site in the second intron of the murine IL-4 gene defines a mast cell-specific enhancer. Immunology 149: 3239-3246. [PubMed] [Google Scholar]
- 17.Hubbard T., Barker, D., Birney, E., Cameron, G., Chen, Y., Clark, L., Cox, T., Cuff, J., Curwen, V., Down, T., et al. 2002. The Ensembl genome database project. Nucleic Acids Res. 30: 38-41. [DOI] [PMC free article] [PubMed] [Google Scholar]
- 18.Huxley C. 1997. Mammalian artificial chromosomes and chromosome transgenics. Trends Genet. 13: 345-347. [DOI] [PubMed] [Google Scholar]
- 19.International Human Genome Sequencing Consortium 2001. Initial sequencing and analysis of the human genome. International Human Genome Sequencing Consortium. Nature 409: 860-921. [Google Scholar]
- 20.Kent J. 2002. BLAT—The BLAST-like alignment tool. Genome Res. 12: 656-664. [DOI] [PMC free article] [PubMed] [Google Scholar]
- 21.Kent W.J. and Zahler, A.M. 2000. The intronerator: Exploring introns and alternative splicing in Caenorhabditis elegans. Nucleic Acids Res. 28: 91-93. [DOI] [PMC free article] [PubMed] [Google Scholar]
- 22.Kent W.J., Sugnet, C.W., Furey, T.S., Roskin, K.M., Pringle, T.H., Alan, M., Zahler, A.M., and Haussler, D. 2002. The Human Genome Browser at UCSC. Genome Res. 6: 996-1006. [DOI] [PMC free article] [PubMed] [Google Scholar]
- 23.Krivan W. and Wasserman, W.W. 2001. A predictive model for regulatory sequences directing liver-specific transcription. Genome Res. 11: 1559-1566. [DOI] [PMC free article] [PubMed] [Google Scholar]
- 24.Lawn R.M., Schwartz, K., and Patthy, L. 1997. Convergent evolution of apolipoprotein(a) in primates and hedgehog. Proc. Natl. Acad. Sci. 94: 11992-11997. [DOI] [PMC free article] [PubMed] [Google Scholar]
- 25.Loots G.G., Locksley, R.M., Blankespoor, C.M., Wang, Z.E., Miller, W., Rubin, E.M., and Frazer, K.A. 2000. Identification of a coordinate regulator of cytokines 4, 13, and 5 by cross-species sequence comparisons. Science 288: 136-140. [DOI] [PubMed] [Google Scholar]
- 26.Ma B., Tromp, J., and Li, M. 2002. PatternHunter: Faster and more sensitive homology search. Bioinformatics 18: 440-445. [DOI] [PubMed] [Google Scholar]
- 27.Mardis E., McPherson, J., Martienssen, R., Wilson, R.K., and McCombie, W.R. 2002. What is finished, and why does it matter. Genome Res. 12: 669-671. [DOI] [PubMed] [Google Scholar]
- 28.Mayor C., Brudno, M., Schwartz, J.R., Poliakov, A., Rubin, E.M., Frazer, K.A., Pachter, L., and Dubchak, I. 2000. VISTA: Visualizing global DNA sequence alignments of arbitrary length. Bioinformatics 16: 1046-1047. [DOI] [PubMed] [Google Scholar]
- 29.Miller W. 2001. Comparison of genomic DNA sequences: Solved and unsolved problems. Bioinformatics 17: 391-397. [DOI] [PubMed] [Google Scholar]
- 30.Mural R.J., Adams, M.D., Myers, E.W., Smith, H.O., Miklos, G.L., Wides, R., Halpern, A., Li, P.W., Sutton, G.G., et al. 2002. A comparison of whole genome derived mouse chromosome 16 and the human genome. Science 296: 1661-1671. [DOI] [PubMed] [Google Scholar]
- 31.Oeltjen J.C., Malley, T.M., Muzny, D.M., Miller, W., Gibbs, R.A., and Belmont, J.W. 1997. Large-scale comparative sequence analysis of the human and murine Bruton's tyrosine kinase loci reveals conserved regulatory domains. Genome Res. 7: 315-329. [DOI] [PubMed] [Google Scholar]
- 32.Pachter L., Alexandersson, M., and Cawley, S. 2002. Applications of generalized pair hidden Markov models to alignment and gene finding problems. J. Comp. Biol. 9: 389-399. [DOI] [PubMed] [Google Scholar]
- 33.Pennacchio L.A., Olivier, M., Hubacek, J.A., Cohen, J.C., Cox, D.R., Fruchart, J.C., Krauss, R.M., and Rubin, E.M. 2001. An apolipoprotein influencing triglycerides in humans and mice revealed by comparative sequencing. Science 294: 169-173. [DOI] [PubMed] [Google Scholar]
- 34.Rogic S., Ouellette, F., and Mackworth, A.K. 2002. Improving gene recognition accuracy by combining predictions from two gene-finding programs. Bioinformatics 18: 1034-1045. [DOI] [PubMed] [Google Scholar]
- 35.Schwartz, S., Kent, W.J., Smit, A., Zhang, Z., Baertsch, R., Hardison, R.C., Haussler, D., and Miller, W. 2003. Human–mouse alignments with BLASTZ. Genome Res. (this issue). [DOI] [PMC free article] [PubMed]
- 36.Tatusov R.L., Koonin, E.V., and Lipman, D.J. 1997. A genomic perspective on protein families. Science 278: 631-637. [DOI] [PubMed] [Google Scholar]
- 37.Venter J.C., Adams, M.D., Myers, E.W., Li, P.W., Mural, R.J., Sutton, G.G., Smith, H.O., Yandell, M., Evans, C.A., Holt, R.A., et al. 2001. The sequence of the human genome. Science 291: 1304-1351. [DOI] [PubMed] [Google Scholar]
- 38.Waterston R.H., Lindblad-Toh, K., Birney, E., Rogers, J., Abril, J.F., Agarwal, P., Agarwala, R., Ainscough, R., Alexandersson, M., An, P., et al. 2002. Initial sequencing and comparative analysis of the mouse genome. Nature 420: 520-562. [DOI] [PubMed] [Google Scholar]


