Abstract
Microbes present in the rumen of dairy cows are essential for degradation of cellulosic and nonstructural carbohydrates of plant origin. The prepartum and postpartum diets of high-producing dairy cows are substantially different, but in what ways the rumen microbiome changes in response and how those changes may influence production traits are not well elucidated. Here, we sequenced the 16S and 18S rRNA genes using the MiSeq platform to characterize the prepartum and postpartum rumen fluid microbiomes in 115 high-producing dairy cows, including both primiparous and multiparous animals. Discriminant analysis identified differences between the microbiomes of prepartum and postpartum samples and between primiparous and multiparous cows. 18S rRNA sequencing revealed an overwhelming dominance of the protozoan class Litostomatea, with over 90% of the eukaryotic microbial population belonging to that group. Additionally, fungi were relatively more prevalent and Litostomatea relatively less prevalent in prepartum samples than in postpartum ones. The core rumen microbiome (common to all samples) consisted of 64 bacterial taxa, of which members of the genus Prevotella were the most prevalent. The Chao1 richness index was greater for prepartum multiparous cows than for postpartum multiparous cows. Multivariable models identified bacterial taxa associated with increased or reduced milk production, and general linear models revealed that a metagenomically based prediction of productivity is highly associated with production of actual milk and milk components. In conclusion, the structure of the rumen fluid microbiome shifts between the prepartum and first-week postpartum periods, and its profile within the context of this study could be used to accurately predict production traits.
INTRODUCTION
Rumen microbiology studies in the last 4 to 5 decades have contributed to the advancement of the field of anaerobic microbiology (1, 2) and have explained much regarding the nature of ruminal fermentation, its effect on ruminant nutrition, and the physiological importance of volatile fatty acid production by ruminal microorganisms to the nutrition of the host. Additionally, ruminal microbiology provided vital concepts and quantitative data that are essential for the construction of the mathematical models that allow for precision nutrition of ruminants, which has been adopted throughout the world in modern meat and milk production systems (3). However, direct manipulation of fermentation by biotechnological means has so far been restricted to a few antimicrobial compounds and some microorganisms that can be added to the feed.
High-throughput sequencing technologies have opened new frontiers in microbial analysis by allowing cost-effective characterization of complex microbial communities in biological samples, and they have significantly improved our knowledge of bovine rumen microbial diversity. Over 27,000 carbohydrate-active genes, 50 proteins with enzymatic activity against cellulosic substrates, and 15 uncultured microbial genomes were revealed in a study of rumen samples using high-throughput sequencing (4). Diet can be a significant factor shaping the microbial diversity of the rumen content of dairy cows (5) and beef cows (6). Variation in the rumen microbiome of dairy cattle has also been linked to levels of methane emission (7), and metagenomic profiling of the rumen microbiome can actually be used to predict phenotypes related to enteric methane gas production (8).
Jami and Mizrahi (9) suggested the presence of a core rumen microbiome but also reported significant variability in bacterial genera abundances among animals. Using 454 pyrosequencing of ruminal metagenomic DNA, they and their colleagues described the bacterial communities across five different age groups (from 1-day-old calves to 2-year-old cows) (10). The same group of researchers recently showed the potential role of the bovine rumen microbiome in modulating milk composition (11). They were able to identify connections between milk fat yield and the Firmicutes-to-Bacteroides ratio. Interesting correlations were also present at the genus level. However, only 15 primiparous animals, one diet, and one sample per animal were used in that study, suggesting that additional work evaluating variation across diets and animals might improve the characterization of potential relationships between the rumen microbiome and production traits.
The transition period (usually defined as the 3 weeks before and the 3 weeks after calving) is undeniably the most challenging period for a high-producing Holstein dairy cow. During these 6 weeks, the cow undergoes physiological stress as she prepares for and then recovers from parturition, dramatically altering her metabolism so as to supply the mammary gland with nutrients necessary for milk synthesis, while often consuming insufficient dry matter, which leads to a negative energy balance and immunosuppression. Adaptation of the rumen microbiota to dietary changes during this period is of paramount importance and is best elucidated with the use of metagenomic tools. Koren et al. (12) showed dramatic changes in the gut microbiota of pregnant women and suggested the existence of important host-microbe interactions that impact host metabolism during pregnancy. Similar findings await description in dairy cattle. In this study, we characterized the rumen fluid microbiomes of prepartum and postpartum high-producing Holstein cows and revealed their associations with productivity.
MATERIALS AND METHODS
Animal handling, data, and sample collection.
The experimental procedures used in this study were reviewed and approved by the Institutional Animal Care and Use Committee of Cornell University (protocol number 2013-0082). The study was conducted at a single commercial dairy farm milking 2,800 Holstein cows near Ithaca, NY, USA. One week before the expected calving date and 1 week after parturition, rumen fluid samples were collected from the same group of primiparous (n = 48) and multiparous (n = 67) cows for prepartum and postpartum samples in the morning before feeding. In order to explore a large population of cows to account for diversity across individuals, we opted to sample the rumen using a noninvasive procedure with the aid of a scientifically evaluated and commercially available oro-ruminal sampling device (Flora Rumen Scoop; Profs-Product, Guelph, Canada) (13). The oro-ruminal sampling device was autoclaved every day, and when more than a sample was collected at the time, the device was thoroughly cleaned using current warming water between sample collection and the first fraction of fluid samples was always discarded to ensure that the sample collected was representative of a specific cow without contaminants from previous animals. After sample collection, an aliquot (50 ml) was stored in a sterile conical tube and kept on ice until transported to the laboratory in Ithaca, NY, where samples were preserved in a −80°C freezer.
Data regarding daily milk yield were recorded using the Alpro milk point controller 780 (DeLaval, Kansas City, MO, USA), and later data were retrieved from the DairyComp 305 (Tulare, CA, USA) database. Daily milk production for each cow was averaged on a weekly basis, and milk fat and protein percentages were recorded on a monthly basis. Quartiles for average milk production and milk fat and protein percentages for the first 150 days postpartum were determined for all cows and later used as ordinal categorical data in the statistical models.
The same prepartum close-up (4 weeks before calving expected date) and postpartum diets were fed for primiparous and multiparous cows. Prepartum cows were fed a diet with a high fiber content (forage neutral detergent fiber [NDF] = 38.2%; amylase-treated NDF [aNDF] = 43.3%) and low energy density (1.39 Mcal/kg), whereas postpartum cows were fed a diet with a low fiber content (forage NDF = 24.1%; aNDF = 30.1%) and high energy density (1.69 Mcal/kg) derived from higher starch and fat supplementation (see Table S1 in the supplemental material).
DNA extraction.
Rumen fluid samples were thawed and homogenized by vortexing for 3 min. A 1-ml aliquot of each rumen fluid sample was centrifuged for 10 min at room temperature at 13,200 rpm (16,100 relative centrifugal force [RCF]) in an Eppendorf 5415R centrifuge. The supernatant was discarded, and the remaining pellet was resuspended in 400 ml of nuclease-free water. Isolation of genomic DNA was performed by using a QIAamp DNA minikit (Qiagen) according to the manufacturer's instructions, except that 400 mg of lysozyme was added to the bacterial suspension and incubated for 12 h at 56°C to maximize bacterial DNA extraction. DNA concentration and purity were evaluated by optical density using a NanoDrop ND-1000 spectrophotometer (NanoDrop Technologies, Rockland, DE, USA) at wavelengths of 230, 260, and 280 nm.
DNA amplification and purification and quantification of 16S rRNA and 18S rRNA genes.
The 16S rRNA and 18S rRNA genes were amplified by PCR from individual metagenomic DNA samples using barcoded primers. For amplification of the V4 hypervariable region of the bacterial/archaeal 16S rRNA gene, primers 515F and 806R were used according to a previously described method (14) optimized for the Illumina MiSeq platform. Likewise, for amplification of the V9 hypervariable region of the 18S rRNA gene (15), primers 1391F and 1510R were used as described previously (14) with optimization for the Illumina MiSeq platform. The earth microbiome project (http://www.earthmicrobiome.org/) (16) was used to select 140 different 12-bp error-correcting Golay barcodes for the 16S rRNA gene and another 140 different 12-bp error-correcting Golay barcodes for 18S rRNA gene, as described previously (14). The 5′-barcoded amplicons were generated in triplicate using 12 to 300 ng DNA template (isolated from rumen samples), 1× GoTaq Green master mix (Promega, Madison, WI), 1 mM MgCl2, and 10 μM each primer. The PCR conditions for the 16S rRNA gene consisted of an initial denaturing step of 94°C for 3 min, followed by 35 cycles of 94°C for 45 s, 50°C for 1 min, and 72°C for 90 s, and a final elongation step of 72°C for 10 min. The PCR conditions for the 18S rRNA gene consisted of an initial denaturing step of 94°C for 3 min, followed by 35 cycles of 94°C for 45 s, 57°C for 1 min, and 72°C for 90 s, and a final elongation step of 72°C for 10 min. Replicate amplicons were pooled and purified with a QIAquick PCR purification kit (Qiagen, Valencia, CA, USA), and visualized by electrophoresis through 1.2% (wt/vol) agarose gels stained with 0.5 mg/ml ethidium bromide before sequencing. Reactions with blank controls, in which no DNA was added to the reaction mixture, were performed. In all cases these blank controls failed to produce visible PCR products; these samples were not analyzed further. Purified amplicon DNA was quantified using the Quant-iT PicoGreen double-stranded DNA (dsDNA) assay kit (Life Technologies Corporation, Carlsbad, CA, USA).
Sequence library analysis and statistical analysis.
Amplicon aliquots were standardized to the same concentration and then pooled into one of three different runs (140 samples per run) according to individual barcode primers of the 16S rRNA gene. The same procedure was conducted for the 18S rRNA amplicons. Final equimolar libraries were sequenced using the MiSeq reagent kit V2 for 300 cycles on the MiSeq platform (Illumina, Inc., San Diego, CA, USA). The 16S rRNA and 18S rRNA gene sequences obtained from the MiSeq platform were processed through the open-source software pipeline Quantitative Insights into Microbial Ecology (QIIME) version 1.7.0-dev (17). Sequences were filtered for quality using established guidelines (18). Sequences were binned into operational taxonomic units (OTUs) based on 97% identity using UCLUST (19) against the Greengenes reference database (20) May 2013 release. Low-abundance clusters (present in fewer than 5% of samples) were filtered, and chimeric sequences were removed using USEARCH (19). Representative sequences for each OTU were compared against the Greengenes database (May 2013 release) for 16S rRNA and Silva for 18S rRNA for taxonomy assignment, which was performed using the RDP classifier with confidence of assignment of ≥95% (21).
The OTU results obtained from the analysis described above were used to determine the core microbiome for the prepartum and postpartum periods. The core microbiome was defined as all taxa found to be ubiquitous across all samples. A multivariable model was built using JMP Pro 11 (SAS Institute Inc., NC) to evaluate correlations between bacterial taxa in the core microbiome at the prepartum and postpartum periods. Using the obtained OTU information, we evaluated each sample's richness using the Chao1 index, which is a nonparametric estimator of the minimum richness (number of OTUs) and is based on the number of rare OTUs (singletons and doublets) within a sample. The least-square means (± standard errors [SE]) of the Chao1 richness and Shannon diversity indexes were then compared using a general linear model with JMP Pro 11 corrected by number of sequences with time relative to calving, parity, and milk quartiles as independent variables.
The relative abundances of different bacterial taxa in each sample were used as covariates in stepwise discriminant analysis models built in JMP Pro 11. Discriminant analysis is a method that predicts a one-way classification based on known values of the responses. The technique is based on how close a set of measurement variables are to the multivariate means of the levels being predicted. The multivariate fitting platform used by discriminant analysis gives estimates of the means and the covariance matrix for the data, assuming that the covariances are the same for each group, allowing the generation of ranked canonical values for variable of interest. In our study, variables were removed in a stepwise manner until only variables with a P value of <0.001 were retained in the final model. “Time relative to calving” and “parity” were used as categorical variables. In this way, differences in microbiome structure during the transition periods of primiparous and multiparous cows were illustrated. A series of heat maps were generate to graphically represent data in a specific range of values contained in a matrix defined by color coding. A series of analyses was performed to investigate how prepartum and postpartum microbial diversity relates to production traits. A screening analysis using JMP Pro 11 was performed to determine which bacterial taxa were associated with increased or decreased average milk production, with average milk fat and protein percentages for the first 150 days in milk stratified by period relative to calving and by parity. Linear correlation matrixes (Pearson correlation coefficient) were generated to illustrate the level of correlation of the bacterial taxa selected by the screening model and the weekly milk averages. Metagenomically based production predictions were estimated using multivariable generalized linear mixed models with JMP Pro 11; bacterial taxa that were found to be significantly associated with milk production (P < 0.001) based on the variable screening model were offered to the model as independent variables, and the variable of interest was the repeated weekly measurements of milk production. Coefficients for parameters estimated by adding variables to the models and P values for false-discovery rates determined to correct for multiple testing are presented in Table S3 in the supplemental material. To control for repeated measures, the variable “animal identification” was included in the models as a random variable. Similar models were built for the monthly average of milk fat percentage and milk protein percentage for the first 5 months following parturition.
Nucleotide sequence accession numbers.
Sequences obtained in the current study were submitted to the Sequence Read Archive at the National Center for Biotechnology Information website with BioProject record number PRJNA258240.
RESULTS
Sequencing results, core microbiome description, and prevalence of genera.
Quality-filtered reads for 16S rRNA sequences were demultiplexed, yielding 24,863,354 sequences in total with a median sequence length of 301 bases per read and an average coverage of 108,102 sequences per sample. Similarly, quality-filtered reads for 18S rRNA sequences were demultiplexed, yielding 22,592,149 sequences in total with a median sequence length of 129 bases per read and an average coverage of 98,226 sequences per sample.
The rumen fluid core microbiome was composed of 64 bacterial taxa. The core microbiome represented 89.6% and 91.2% of all bacterial genera present in the rumen in the prepartum and postpartum periods, respectively. The mean prevalence of each bacterial taxon present in the core microbiome is illustrated in Table S2 in the supplemental material, and the relative abundances of core microbiome bacterial genera for all cows are illustrated in Fig. S1 (prepartum) and Fig. S2 (postpartum) in the supplemental material. Taxa that could not be assigned to a genus but were present in all samples are still displayed based on the highest taxonomic level that could be assigned to them. Data analysis identified 2,132 different bacterial species; however, these represented only 46% of the sequences identified for all samples, and therefore they were not included in further models to determine the core microbiome and associations with production traits. Twelve bacterial species that had an average prevalence of 1% and were consistently the most prevalent among prepartum and postpartum multiparous and primiparous cows are depicted in Fig. S3 in the supplemental material.
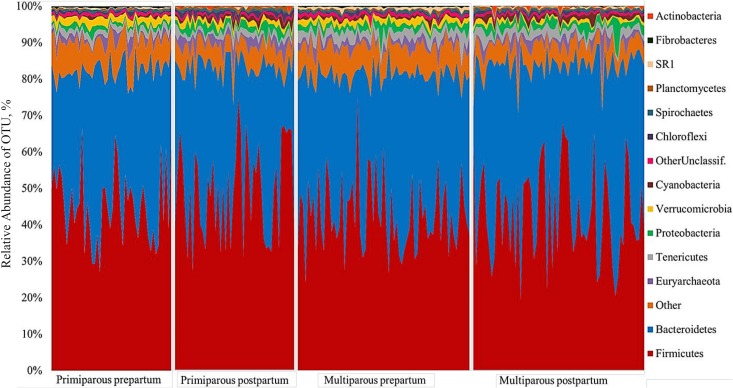
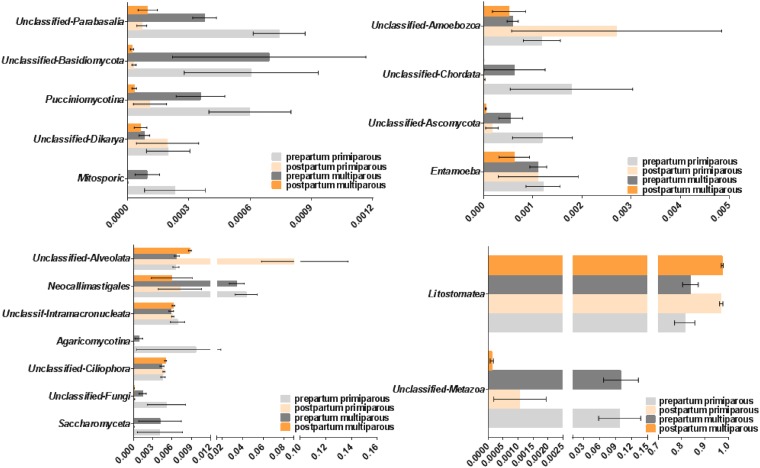
The core microbiome in the prepartum period was composed predominantly of Prevotella (19.5% ± 0.82%), Ruminococcaceae 2 (7.3% ± 0.21%), Bacteroidales (7.2% ± 0.21%), Lachnospiraceae 2 (5.4% ± 0.16%), Ruminococcus (4.8% ± 0.18%), Clostridia 2 (4.1%± 0.17%), Clostridiales 2 (3.5% ± 0.12%), Christensenellaceae (3.3% ± 0.16%), Bacteroidales 2 (3.2% ± 0.08%), and Succiniclasticum (3.1% ± 0.12%). In comparison, the core microbiome in the postpartum period consisted predominantly of Prevotella (21.3% ± 1.20%), Ruminococcaceae 2 (8.0% ± 0.34%), Ruminococcus (7.3% ± 0.38%), Bacteroidales (5.7% ± 0.24%), Lachnospiraceae 2 (5.7% ± 0.16%), Clostridia 2 (3.8% ± 0.15%), family S24-7 (3.8% ± 0.02%), Succiniclasticum (3.4% ± 0.17%), Clostridiales 2 (2.9% ± 0.11%), and Bacteroidales 2 (2.7% ± 0.24%). The prevalence of each bacterial phylum for each sample evaluated is depicted in Fig. 1. Twenty-eight phyla were identified in at least 20 samples across the prepartum and postpartum samples, and 13 phyla composed the core microbiome. The two major phyla present in rumen samples were Firmicutes and Bacteroidetes. The mean relative abundances of Firmicutes for the prepartum primiparous, prepartum multiparous, postpartum primiparous, and postpartum multiparous samples were 45.1%, 42.5%, 49.65%, and 42.8%, respectively. The mean relative abundances of Bacteroidetes for the prepartum primiparous, prepartum multiparous, postpartum primiparous, and postpartum multiparous samples were 36.9%, 38.4%, 33.6%, and 40.7%, respectively. Other major phyla with relative abundances over 1% include Verrucomicrobia, Euryarchaeota, Tenericutes, and Proteobacteria. The mean relative abundances of eukaryotic organisms based on 18S rRNA sequencing are presented in Fig. 2. The protozoan class Litostomatea was the dominant eukaryotic taxon, with its members accounting for more than 90% of the eukaryotes present in the rumen samples. An unclassified metazoan OTU was the second most prevalent eukaryotic taxon, followed by a series of fungi (Saccharomyceta, unclassified fungi, Agaricomycotina, and Neocallimastigales) and a few other protozoa (unclassified Ciliophora, unclassified Intramacronucleata, and unclassified Alveolata). The prevalence of Litostomatea and unclassified Alveolata decreased from the prepartum to the postpartum period, whereas unclassified Metazoa, Saccharomyceta, unclassified Fungi, Agaricomycotina, Neocallimastigales, Mitosporic fungi, Pucciniomycotina, unclassified Basidiomycota, and unclassified Parabasalia increased in prevalence over the same transition. In general, the fungal types identified showed variation similar to that of the unclassified Metazoa, having an increased prevalence from the prepartum to the postpartum period.
FIG 1.
Aggregate microbiome composition at the phylum level for 16S rRNA sequences according to period relative to calving (prepartum and postpartum) and parity (multiparous and primiparous) for each cow evaluated in the study. The y axis represents the relative abundance of OTUs for all samples evaluated within the specific period relative to calving and parity.
FIG 2.
Bar graphs illustrating the microbial taxon prevalence for 18S rRNA gene sequences. The mean microbial prevalence according to period relative to calving (prepartum and postpartum) and parity (multiparous and primiparous) is represented by x axis values. Error bars represent standard errors.
Discriminant analysis.
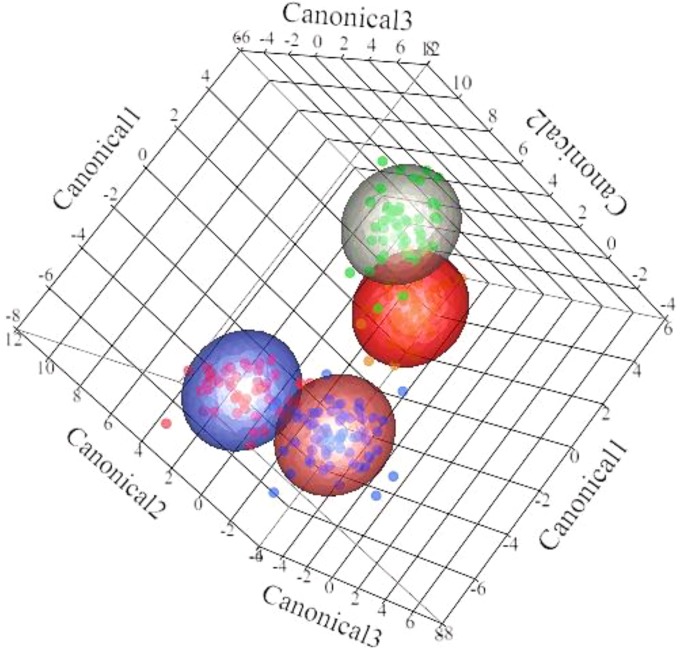
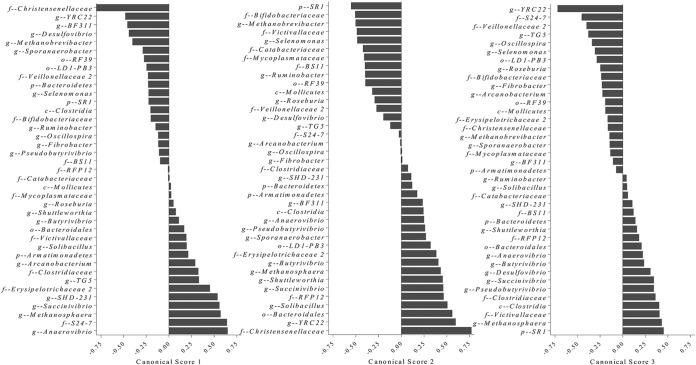
Differences in rumen microbial diversity between the prepartum and postpartum periods are mainly illustrated by canonical 1 (Fig. 3), whereas differences between primiparous and multiparous cows are mainly illustrated by canonicals 2 and 3 (Fig. 3). The canonical scores for each bacterial taxon used to discriminate rumen microbiomes according to period relative to calving and primiparous cows from multiparous cows are presented in Fig. 4.
FIG 3.
Discriminant analysis of rumen microbiome samples. Different mean relative abundances in samples were used as covariates and times relative to calving and parity were used as categorical variables. Differences in the ruminal microbial profiles of primiparous (prepartum, red dots; postpartum, green dots) and multiparous (prepartum, blue dots; postpartum, orange dots) are illustrated by canonical 1, 2, and 3.
FIG 4.
Canonical scores 1, 2, and 3 for bacterial taxa that were found to be significant for the discriminant analysis displayed in Fig. 3.
Richness and diversity indexes and association of the Firmicutes/Bacteroidetes ratio with production traits.
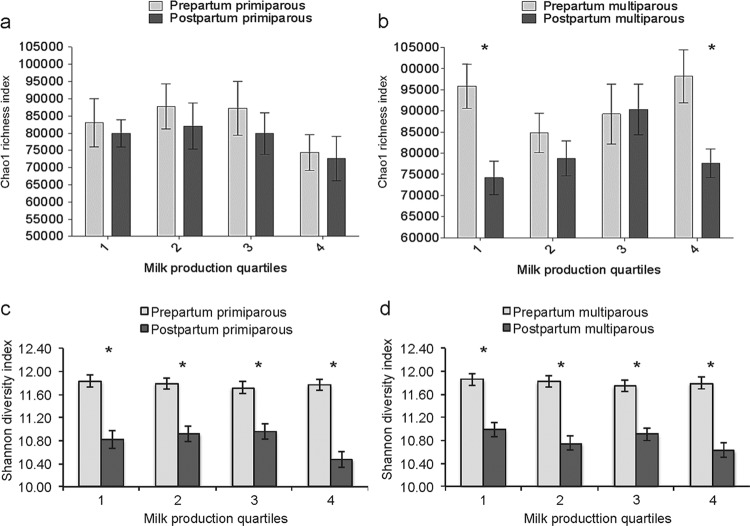
Chao1 richness index means for pre- and postpartum samples for multiparous and primiparous cows stratified by milk production quartiles are illustrated in Fig. 5a and b. The Chao1 index dropped significantly between the prepartum and postpartum periods in multiparous cows for both the lower milk production quartile (1) and the higher milk production quartile (4).
FIG 5.
Bar graphs illustrating the mean Chao1 (a and b) and Shannon (c and d) indexes for different periods relative to calving and milk quartiles for primiparous cows and multiparous cows. Error bars represent standard errors. *, P < 0.01.
Shannon1 diversity index means for pre- and postpartum samples for multiparous and primiparous cows stratified by milk production quartiles are illustrated in Fig. 5c and d. The Shannon index was higher for prepartum cows independent of milk quartile or parity (Fig. 5c and d).
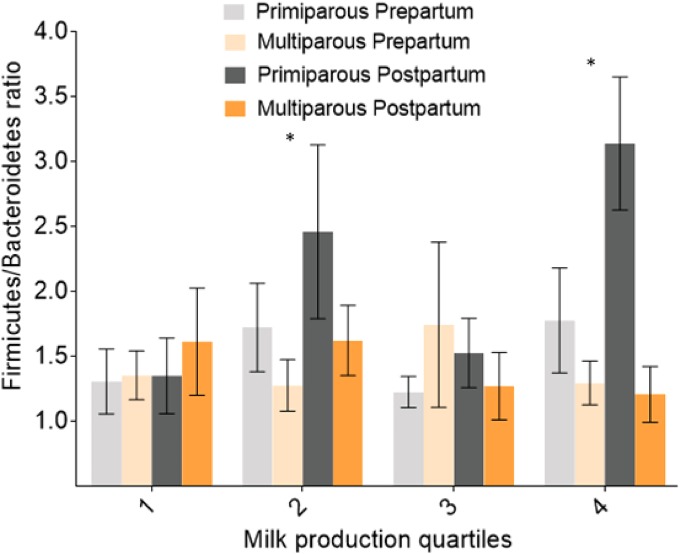
The Firmicutes/Bacteroidetes ratio for cows within milk quartile 2 was significantly higher in primiparous postpartum cows than in multiparous prepartum cows (Fig. 6). Likewise, the Firmicutes/Bacteroidetes ratio for cows within milk quartile 4 was significantly higher for primiparous postpartum cows than for multiparous prepartum, multiparous postpartum, and primiparous prepartum cows (Fig. 6). The Firmicutes/Bacteroidetes ratio was not correlated with milk fat percentage (Pearson r = −0.03; P = 0.38) or milk protein percentage (Pearson r = −0.83; P = 0.40).
FIG 6.
Bar graph illustrating the Firmicutes/Bacteroidetes ratios for periods relative to calving, parity, and milk quartiles. Error bars represent standard errors. *, P < 0.01.
Metagenomically based production traits.
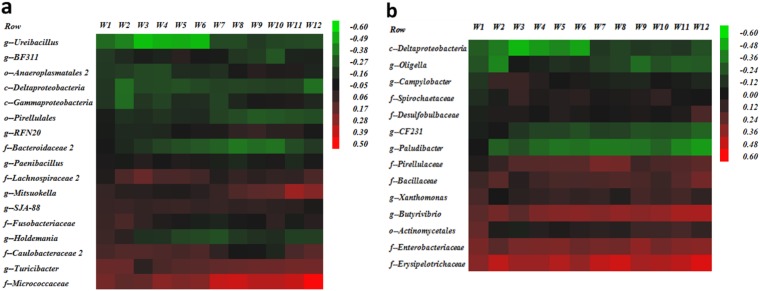
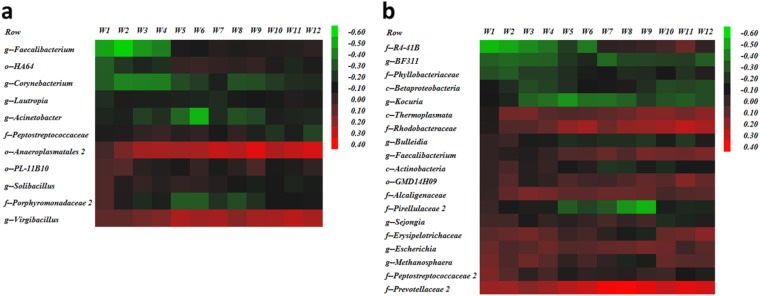
Bacterial taxa associated with either increased or reduced average milk production for the first 150 days postpartum were obtained from screening analyses performed according to the period relative to calving and parity. Those bacterial taxa were used in a multivariable model to evaluate correlations between the prevalence of these bacterial taxa and weekly average milk yield for the first 12 weeks postpartum. Primiparous prepartum microbiome correlation patterns varying from −0.60 (negative correlation with milk production) to 0.50 (positive correlation with milk production) are illustrated in Fig. 7a. The bacterial taxon Micrococcaceae was consistently the most positively correlated with weekly milk production throughout the first 12 weeks postpartum, whereas Ureibacillus was the most negatively correlated throughout the same period (Fig. 7a). A similar pattern was observed for the primiparous postpartum microbiome, with the correlation varying from −0.60 to 0.60 and with Deltaproteobacteria being the most negatively correlated with weekly average milk production and Erysipelotrichaceae the most positively correlated (Fig. 7b). Likewise, bacterial taxa in samples from multiparous prepartum cows showed correlations with weekly milk production throughout the first 12 weeks postpartum that ranged from −0.60 to 0.40, with Faecalibacterium and Virgibacillus being the most negatively and most positively associated, respectively (Fig. 8a). Lastly, the multiparous postpartum microbiome correlations also ranged from −0.60 to 0.40, with Prevotellaceae 2 being the most positively correlated with weekly milk production throughout the first 12 weeks postpartum and R4-41B the most negatively correlated (Fig. 8b).
FIG 7.
Heat maps illustrating correlations between bacterial taxa significantly associated with milk production and weekly average of milk production. The color and intensity of each square represent the value of the correlation between bacteria generally significantly associated with milk production and weekly average of milk production. (a) Correlations for the primiparous prepartum cow microbiomes. (b) Correlations for the primiparous postpartum cow microbiomes. The letters before the bacterial names identify the lowest level of classification (k, kingdom; p, phylum; c, class; o, order; f, family; g, genus).
FIG 8.
Heat maps illustrating correlations between bacterial taxa significantly associated with milk production and weekly average of milk production. The color and intensity of each square represent the value of the correlation between bacteria generally significantly associated with milk production and weekly average of milk production. (a) Correlations for the multiparous prepartum cow microbiomes. (b) Correlations for the multiparous postpartum cows microbiomes. The letters before the bacterial names identify the lowest level of classification (k, kingdom; p, phylum; c, class; o, order; f, family; g, genus).
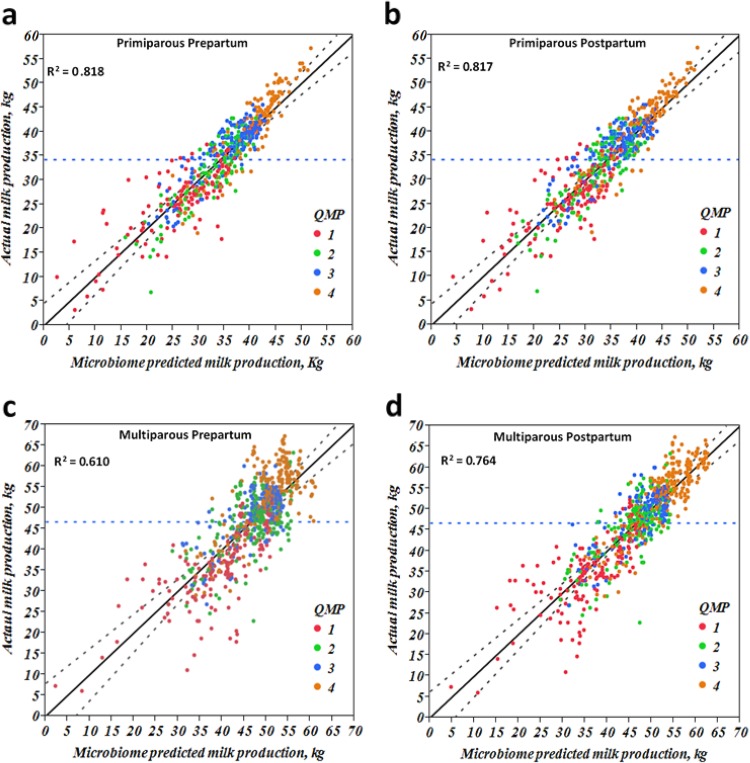
Additionally, a multivariable regression model was built that used bacterial taxa significantly associated with average milk production in the first 150 days postpartum to predict weekly average milk production compared to actual milk production. The microbiome-predicted milk production according to period relative to calving and parity was significantly correlated with actual weekly averages of milk production, as illustrated in Fig. 9a to d. Similar models were built for milk fat percentage and milk protein percentage and added to our supplemental data (see Fig. S4 and S5 in the supplemental material).
FIG 9.
Linear regression illustration of microbiome-predicted milk production and actual milk production. The x axis represents the microbiome-predicted milk production according to bacterial taxa that significantly affected milk production for weekly values, and the y axis represents the actual average of weekly milk production. QMP, quartiles of milk production.
A final multivariable model was built to evaluate correlations between the prepartum and postpartum core microbiomes for the most prevalent bacteria, and this revealed strong correlations between the predominant core bacterial genera before and after parturition (see Fig. S6 in the supplemental material).
DISCUSSION
We showed here that differences exist between the prepartum and postpartum rumen microbiomes in primiparous and multiparous Holstein cows and that these differences can be used to predict certain production traits. Rumen microbes have an essential role in the deconstruction of plant lignocellulosic material (4) by enabling cows to harness the solar energy stored in plant fibers via their conversion into milk and meat, both of which are important sources of high-quality protein and energy for human consumption. The transition from a prepartum high-fiber, low-energy diet to a postpartum low-fiber, high-energy diet represents the most common feeding scenario on dairy farms with high-producing dairy cows, and understanding its effects on the rumen fluid microbiome and potential relationships with production is of great interest.
The use of the MiSeq Illumina sequencing platform generated a great number of sequences per read (108,102), exceeding the 80,000 sequences per sample estimated to be required for full coverage of all OTUs in rumen samples across different diets (9). Indeed, 88.3% of all samples evaluated in the present study were above the threshold of 80,000 sequences per read, representing increased coverage and depth compared to those in previous studies that used 454 Roche pyrosequencing (16,000 to 36,000 sequences per sample) (9).
Prepartum and postpartum rumen samples were readily distinguished by discriminant analysis based on bacterial profiles (Fig. 3). These results are comparable to recent findings describing rapid alterations of the gut microbiome in humans (22) and cattle (6) in a diet-dependent manner. Many well-known cellulolytic, amylolytic, and acidophilic bacteria (Fibrobacter, Ruminobacter, Selenomonas, Butyrivibrio, and Succinivibrio) were significant in discriminating the prepartum from the postpartum microbiome. Other significant bacteria distinguishing these two microbiomes were uncultured/unidentified rumen bacterial clones YRC22 and RFP12 and, previously unreported in rumen, bacteria such as Solibacillus and Sporanaerobacter, all with completely unknown and unexplored functions in rumen physiology. Bacteria from the family Christensenellaceae have previously been reported in human feces; these are strictly anaerobic, nonmotile, non-spore-forming, Gram-negative species, which produce acetic acid and a small amount of butyric acid as fermentation end products (23). Considering the high significance that Christensenellaceae had in our discriminant analysis model, it is likely that these bacteria play an important role in rumen dynamics, and their further investigation is warranted.
Discriminant analysis models also revealed that rumen samples derived from primiparous cows were readily distinguished from multiparous cows based on their microbiomes (Fig. 3). A clear age effect on the rumen microbiome was described by Jami et al. (10), in which diversity and within-group similarity increased with age. Similar results of increased microbial diversity and convergence toward a mature bacterial composition with age were also reported in a study of the gut microbiomes of human populations from different geographical locations across different age groups (24). Heifers at 1 week before the expected calving date are considered adult animals. However, they are fed a high-fiber, low-energy diet that differs dramatically from the low-fiber, high-energy diet fed to multiparous cows during the previous lactation period. The group of bacteria that largely distinguishes primiparous from multiparous cows is the amylolytic/acidophilic bacteria (Butyrivibrio, Succinivibrio, Selenomonas, and Ruminobacter). Nonetheless, some unusual bacterial types also featured in this discrimination, such as the candidate phylum SR1, which includes bacteria found in marine and terrestrial high-temperature environments (25), in mammalian digestive tracts (26), or in the human oral cavity (27). Until now, these bacteria were not known to be present in the rumen of dairy cows.
The notion of diet influencing microbial diversity in cattle is a long-standing one (1), supported more recently by the use of molecular techniques to investigate rumen dynamics and function and the effects of diet (6, 28, 29). As discussed above, use of the MiSeq Illumina platform can propel studies of rumen microbiology even further. Although sequencing of the 18S rRNA gene is limited for recognition of species, it allows us to identify rumen fungal and protozoan species that have also been shown to play important roles in rumen physiology (30, 31). We showed here that over 90% of the sequences belonged to the protozoan class Litostomatea, ciliated protists that until recently were divided into two groups, the Haptoria and the Trichostomatia (32). The Trichostomatia subclass contains one of most studied ruminal protozoan taxa, the Entodinium spp., which are able to engulf starch and attach to amylolytic bacteria (33); these protozoans have greater relative abundance in cows fed a high-energy diet than in cows fed a low-energy diet (34). These results are in line with our findings of increased relative abundance of Litostomatea in the postpartum period, corresponding to a low-fiber, high-energy diet. Also in line with our findings was the consistently increased abundance of fungal types in the prepartum period compared to the postpartum period. Generally, fungi present in the rumen can penetrate both the cuticle and the cell wall of lignified material, thus playing an essential role in fiber degradation (35).
The concept of a “core” microbiome developed for the human gut implies that there is a population of microbes that remains stable independent of host genetics and diet; however, deviation from this core population might indicate the occurrence of metabolic unbalance and disease (36–38). The same concept has been recently applied to the bovine rumen (10). Jami and Mizrahi (9) identified 32 genera across 16 cows fed an ad libitum diet for many months. Li et al. (39) identified 45 genera that were common to 4 calves being fed milk replacer. However, a study by Petri et al. (6) found that only the genus Prevotella was ubiquitous in 8 heifers fed either a forage diet, a forage-concentrate diet, a concentrate diet, or an acidosis-inducing diet. In our much larger sample population and across two different diets, the core rumen microbiome in the present study is defined by 64 bacterial taxa, suggesting that the description of the core rumen microbiome is perhaps influenced by sequencing methodology coverage and depth. Evidence in support of this possibility comes from the work of Petri et al. (6), who reported relative abundances of 32.3% and 43.2% for the two major phyla Bacteroidetes and Firmicutes, respectively, percentages comparable to ours despite differences in animal category, diets, and methodology between the two studies. Many of the core rumen microbiome bacterial types identified in the present study belong to these two phyla and could potentially be present in other samples studied by Petri et al. (6). Use of the MiSeq platform allows greater throughput per run and smaller errors rates than those with 454 pyrosequencing, which ultimately leads to greater depth and breadth of coverage and potential identification of higher numbers of microbial genera (40, 41). Petri et al. (6) reported an average of 3,260 to 6,832 sequences per sample depending upon diet/treatment, and they mentioned that a plateau was not reached for any of the dietary treatments, indicating that additional sequencing would be necessary to fully describe rumen bacterial communities under those conditions. An important recent finding was that cooccurrence analysis of microbial taxa from all three domains of life suggested strong within- and between-domain correlations between different groups of microorganisms within the rumen. Communities analyzed with different primers always grouped by sample origin rather than by the primers used. Primer choice had a greater impact on apparent archaeal community structure than on bacterial community structure, and biases for certain methanogen groups were detected (42).
Recently, Jami et al. (11) reported that milk yield and composition were highly correlated with the abundance of various bacterial members of the rumen microbiota. A strong correlation between the Firmicutes-to-Bacteroidetes ratio and milk fat yield was shown. Considering the essential role of rumen bacteria in the breakdown of plant polysaccharides (43) and that volatile fatty acids produced by this breakdown are a major source of energy and have a direct effect on milk production (44, 45), it is plausible that rumen microbiome profiles in the prepartum and early postpartum periods help determine production traits. Indeed, our screening analysis revealed that several bacterial taxa in prepartum and postpartum samples were associated with increased or reduced average milk production, milk fat percentage, and milk protein percentage for the first 150 days postpartum. We built many models using bacterial taxa significantly associated with production traits in an attempt to evaluate correlations between the rumen microbiome and weekly milk production or monthly milk fat and protein percentages. Bacteria significantly correlated with milk production were used to generate microbiome predictions for milk production, milk fat percentage, and milk protein percentage. Although we were unable to replicate the strong correlation between the Firmicutes-to-Bacteroidetes ratio and milk fat percentage reported by Jami et al. (11), we did identify bacterial groups (stratified by parity and period relative to calving) that are highly correlated with production traits. In general, moderate to high correlations (r2 = 0.42 to 0.82) of microbiome predictions for production traits were identified by our models. Some of the bacteria with the highest positive correlation with milk production are well-known rumen bacteria such as Butyrivibrio and Prevotellaceae 2, and their role in rumen function is already well described. Butyrivibrio spp. undertake biohydrogenation of fatty acids (46), which generates conjugated linoleic acid as an intermediate (47). Prevotellaceae 2 is the most prevalent bacterial family in the rumen of adult cattle, and some of the species within this family, such as Prevotella bryantii, when used as probiotics decreased lactate production and increased milk fat percentages during the weeks following inoculation (48). Conversely, other bacteria with high positive correlations with milk production, such as Micrococcus, Enterobacteriaceae, Erysipelotrichaceae, Virgibacillus, Anaeroplasmatales 2, Thermoplasmata, and Rhodobacteraceae, are very poorly characterized or unreported in rumen. Among all production traits, milk production had the highest correlations with bacterial types and could be more accurately predicted by microbiome profiles within the context of the current study. Although it remains unclear if differences in the microbiome during the prepartum and postpartum periods would translate to a specific microbiome associated with milk production later in lactation, the predictions identified by our models within the constrains of this study suggest that there is a potential relationship between the rumen microbiome and production traits that might make the rumen microbiome an important predictor of productivity in dairy cows.
Conclusions.
As expected, moving from a high-fiber, low-energy diet to a low-fiber, high-energy diet led to a shift of the rumen microbiome. Differences between the prepartum and postpartum rumen microbiomes included different relative abundance of classic cellulolytic and amylolytic bacteria coupled with variations in several other bacterial taxa that were previously uncultured, unreported or with unknown function in the rumen. Moreover, the prepartum microbiome was characterized by an increased prevalence of fungi, which then shifted at the immediate postpartum period to a pattern of increased prevalence of protozoa associated with starch digestion. Milk production was predicted with relatively high accuracy by the rumen microbiome; nonetheless, it remains to be determined how microbiome profiles are associated with or indeed shape production traits. Future research will need to investigate the validity of the microbiome predictions of this study across different environments in an integrative manner that incorporates host genetics and metatranscriptomic information on the rumen microbiome.
Supplementary Material
ACKNOWLEDGMENT
This work was supported by the National Institute of Food and Agriculture at the New York State Federal Formula Funds (NYC-478452).
Footnotes
Supplemental material for this article may be found at http://dx.doi.org/10.1128/AEM.03138-14.
REFERENCES
- 1.Hungate RE, Bryant MP, Mah RA. 1964. The rumen bacteria and protozoa. Annu Rev Microbiol 18:131–166. doi: 10.1146/annurev.mi.18.100164.001023. [DOI] [PubMed] [Google Scholar]
- 2.Krause DO, Nagaraja TG, Wright AD, Callaway TR. 2013. Board-invited review: rumen microbiology: leading the way in microbial ecology. J Anim Sci 91:331–341. doi: 10.2527/jas.2012-5567. [DOI] [PubMed] [Google Scholar]
- 3.Sniffen CJ, O'Connor JD, Van Soest PJ, Fox DG, Russell JB. 1992. A net carbohydrate and protein system for evaluating cattle diets. II. Carbohydrate and protein availability. J Anim Sci 70:3562–3577. [DOI] [PubMed] [Google Scholar]
- 4.Hess M, Sczyrba A, Egan R, Kim TW, Chokhawala H, Schroth G, Luo S, Clark DS, Chen F, Zhang T, Mackie RI, Pennacchio LA, Tringe SG, Visel A, Woyke T, Wang Z, Rubin EM. 2011. Metagenomic discovery of biomass-degrading genes and genomes from cow rumen. Science 331:463–467. doi: 10.1126/science.1200387. [DOI] [PubMed] [Google Scholar]
- 5.de Menezes AB, Lewis E, O'Donovan M, O'Neill BF, Clipson N, Doyle EM. 2011. Microbiome analysis of dairy cows fed pasture or total mixed ration diets. FEMS Microbiol Ecol 78:256–265. doi: 10.1111/j.1574-6941.2011.01151.x. [DOI] [PubMed] [Google Scholar]
- 6.Petri RM, Schwaiger T, Penner GB, Beauchemin KA, Forster RJ, McKinnon JJ, McAllister TA. 2013. Changes in the rumen epimural bacterial diversity of beef cattle as affected by diet and induced ruminal acidosis. Appl Environ Microbiol 79:3744–3755. doi: 10.1128/AEM.03983-12. [DOI] [PMC free article] [PubMed] [Google Scholar]
- 7.Ross EM, Moate PJ, Marett L, Cocks BG, Hayes BJ. 2013. Investigating the effect of two methane-mitigating diets on the rumen microbiome using massively parallel sequencing. J Dairy Sci 96:6030–6046. doi: 10.3168/jds.2013-6766. [DOI] [PubMed] [Google Scholar]
- 8.Ross EM, Moate PJ, Marett LC, Cocks BG, Hayes BJ. 2013. Metagenomic predictions: from microbiome to complex health and environmental phenotypes in humans and cattle. PLoS One 8:e73056. doi: 10.1371/journal.pone.0073056. [DOI] [PMC free article] [PubMed] [Google Scholar]
- 9.Jami E, Mizrahi I. 2012. Similarity of the ruminal bacteria across individual lactating cows. Anaerobe 18:338–343. doi: 10.1016/j.anaerobe.2012.04.003. [DOI] [PubMed] [Google Scholar]
- 10.Jami E, Israel A, Kotser A, Mizrahi I. 2013. Exploring the bovine rumen bacterial community from birth to adulthood. ISME J 7:1069–1079. doi: 10.1038/ismej.2013.2. [DOI] [PMC free article] [PubMed] [Google Scholar]
- 11.Jami E, White BA, Mizrahi I. 2014. Potential role of the bovine rumen microbiome in modulating milk composition and feed efficiency. PLoS One 9:e85423. doi: 10.1371/journal.pone.0085423. [DOI] [PMC free article] [PubMed] [Google Scholar]
- 12.Koren O, Goodrich JK, Cullender TC, Spor A, Laitinen K, Backhed HK, Gonzalez A, Werner JJ, Angenent LT, Knight R, Backhed F, Isolauri E, Salminen S, Ley RE. 2012. Host remodeling of the gut microbiome and metabolic changes during pregnancy. Cell 150:470–480. doi: 10.1016/j.cell.2012.07.008. [DOI] [PMC free article] [PubMed] [Google Scholar]
- 13.Geishauser T, Linhart N, Neidl A, Reimann A. 2012. Factors associated with ruminal pH at herd level. J Dairy Sci 95:4556–4567. doi: 10.3168/jds.2012-5380. [DOI] [PubMed] [Google Scholar]
- 14.Caporaso JG, Lauber CL, Walters WA, Berg-Lyons D, Huntley J, Fierer N, Owens SM, Betley J, Fraser L, Bauer M, Gormley N, Gilbert JA, Smith G, Knight R. 2012. Ultra-high-throughput microbial community analysis on the Illumina HiSeq and MiSeq platforms. ISME J 6:1621–1624. doi: 10.1038/ismej.2012.8. [DOI] [PMC free article] [PubMed] [Google Scholar]
- 15.Amaral-Zettler LA, McCliment EA, Ducklow HW, Huse SM. 2009. A method for studying protistan diversity using massively parallel sequencing of V9 hypervariable regions of small-subunit ribosomal RNA genes. PLoS One 4:e6372. doi: 10.1371/journal.pone.0006372. [DOI] [PMC free article] [PubMed] [Google Scholar]
- 16.Gilbert JA, Meyer F, Antonopoulos D, Balaji P, Brown CT, Brown CT, Desai N, Eisen JA, Evers D, Field D, Feng W, Huson D, Jansson J, Knight R, Knight J, Kolker E, Konstantindis K, Kostka J, Kyrpides N, Mackelprang R, McHardy A, Quince C, Raes J, Sczyrba A, Shade A, Stevens R. 2010. Meeting report: the terabase metagenomics workshop and the vision of an Earth microbiome project. Stand Genomic Sci 3:243–248. doi: 10.4056/sigs.1433550. [DOI] [PMC free article] [PubMed] [Google Scholar]
- 17.Caporaso JG, Kuczynski J, Stombaugh J, Bittinger K, Bushman FD, Costello EK, Fierer N, Pena AG, Goodrich JK, Gordon JI, Huttley GA, Kelley ST, Knights D, Koenig JE, Ley RE, Lozupone CA, McDonald D, Muegge BD, Pirrung M, Reeder J, Sevinsky JR, Turnbaugh PJ, Walters WA, Widmann J, Yatsunenko T, Zaneveld J, Knight R. 2010. QIIME allows analysis of high-throughput community sequencing data. Nat Methods 7:335–336. doi: 10.1038/nmeth.f.303. [DOI] [PMC free article] [PubMed] [Google Scholar]
- 18.Bokulich NA, Subramanian S, Faith JJ, Gevers D, Gordon JI, Knight R, Mills DA, Caporaso JG. 2013. Quality-filtering vastly improves diversity estimates from Illumina amplicon sequencing. Nat Methods 10:57–59. doi: 10.1038/nmeth.2276. [DOI] [PMC free article] [PubMed] [Google Scholar]
- 19.Edgar RC. 2010. Search and clustering orders of magnitude faster than BLAST. Bioinformatics 26:2460–2461. doi: 10.1093/bioinformatics/btq461. [DOI] [PubMed] [Google Scholar]
- 20.McDonald D, Price MN, Goodrich J, Nawrocki EP, DeSantis TZ, Probst A, Andersen GL, Knight R, Hugenholtz P. 2012. An improved Greengenes taxonomy with explicit ranks for ecological and evolutionary analyses of bacteria and archaea. ISME J 6:610–618. doi: 10.1038/ismej.2011.139. [DOI] [PMC free article] [PubMed] [Google Scholar]
- 21.Wang Q, Garrity GM, Tiedje JM, Cole JR. 2007. Naive Bayesian classifier for rapid assignment of rRNA sequences into the new bacterial taxonomy. Appl Environ Microbiol 73:5261–5267. doi: 10.1128/AEM.00062-07. [DOI] [PMC free article] [PubMed] [Google Scholar]
- 22.David LA, Maurice CF, Carmody RN, Gootenberg DB, Button JE, Wolfe BE, Ling AV, Devlin AS, Varma Y, Fischbach MA, Biddinger SB, Dutton RJ, Turnbaugh PJ. 2014. Diet rapidly and reproducibly alters the human gut microbiome. Nature 505:559–563. doi: 10.1038/nature12820. [DOI] [PMC free article] [PubMed] [Google Scholar]
- 23.Morotomi M, Nagai F, Watanabe Y. 2012. Description of Christensenella minuta gen. nov., sp. nov., isolated from human faeces, which forms a distinct branch in the order Clostridiales, and proposal of Christensenellaceae fam. nov. Int J Syst Evol Microbiol 62:144–149. doi: 10.1099/ijs.0.026989-0. [DOI] [PubMed] [Google Scholar]
- 24.Yatsunenko T, Rey FE, Manary MJ, Trehan I, Dominguez-Bello MG, Contreras M, Magris M, Hidalgo G, Baldassano RN, Anokhin AP, Heath AC, Warner B, Reeder J, Kuczynski J, Caporaso JG, Lozupone CA, Lauber C, Clemente JC, Knights D, Knight R, Gordon JI. 2012. Human gut microbiome viewed across age and geography. Nature 486:222–227. doi: 10.1038/nature11053. [DOI] [PMC free article] [PubMed] [Google Scholar]
- 25.Davis JP, Youssef NH, Elshahed MS. 2009. Assessment of the diversity, abundance, and ecological distribution of members of candidate division SR1 reveals a high level of phylogenetic diversity but limited morphotypic diversity. Appl Environ Microbiol 75:4139–4148. doi: 10.1128/AEM.00137-09. [DOI] [PMC free article] [PubMed] [Google Scholar]
- 26.Ley RE, Hamady M, Lozupone C, Turnbaugh PJ, Ramey RR, Bircher JS, Schlegel ML, Tucker TA, Schrenzel MD, Knight R, Gordon JI. 2008. Evolution of mammals and their gut microbes. Science 320:1647–1651. doi: 10.1126/science.1155725. [DOI] [PMC free article] [PubMed] [Google Scholar]
- 27.Dewhirst FE, Chen T, Izard J, Paster BJ, Tanner AC, Yu WH, Lakshmanan A, Wade WG. 2010. The human oral microbiome. J Bacteriol 192:5002–5017. doi: 10.1128/JB.00542-10. [DOI] [PMC free article] [PubMed] [Google Scholar]
- 28.Mackie RI, Aminov RI, Hu W, Klieve AV, Ouwerkerk D, Sundset MA, Kamagata Y. 2003. Ecology of uncultivated Oscillospira species in the rumen of cattle, sheep, and reindeer as assessed by microscopy and molecular approaches. Appl Environ Microbiol 69:6808–6815. doi: 10.1128/AEM.69.11.6808-6815.2003. [DOI] [PMC free article] [PubMed] [Google Scholar]
- 29.Malmuthuge N, Li M, Chen Y, Fries P, Griebel PJ, Baurhoo B, Zhao X, Guan LL. 2012. Distinct commensal bacteria associated with ingesta and mucosal epithelium in the gastrointestinal tracts of calves and chickens. FEMS Microbiol Ecol 79:337–347. doi: 10.1111/j.1574-6941.2011.01220.x. [DOI] [PubMed] [Google Scholar]
- 30.Bauchop T. 1979. Rumen anaerobic fungi of cattle and sheep. Appl Environ Microbiol 38:148–158. [DOI] [PMC free article] [PubMed] [Google Scholar]
- 31.William A, Coleman G. 1997. The rumen anaerobi fungi. Kluwer Academic and Publishers, Book News, Inc., Portand, OR, USA. [Google Scholar]
- 32.Gao S, Song W, Ma H, Clamp JC, Yi Z, Al-Rasheid KA, Chen Z, Lin X. 2008. Phylogeny of six genera of the subclass Haptoria (Ciliophora, Litostomatea) inferred from sequences of the gene coding for small subunit ribosomal RNA. J Eukaryot Microbiol 55:562–566. doi: 10.1111/j.1550-7408.2008.00360.x. [DOI] [PubMed] [Google Scholar]
- 33.Dennis SM, Arambel MJ, Bartley EE, Dayton AD. 1983. Effect of energy concentration and source of nitrogen on numbers and types of rumen protozoa. J Dairy Sci 66:1248–1254. doi: 10.3168/jds.S0022-0302(83)81931-6. [DOI] [PubMed] [Google Scholar]
- 34.Carberry CA, Kenny DA, Han S, McCabe MS, Waters SM. 2012. Effect of phenotypic residual feed intake and dietary forage content on the rumen microbial community of beef cattle. Appl Environ Microbiol 78:4949–4958. doi: 10.1128/AEM.07759-11. [DOI] [PMC free article] [PubMed] [Google Scholar]
- 35.Hobson P, Stewart C. 1997. The rumen microbial ecosystem. Blackie Academic and Professional, London, England. [Google Scholar]
- 36.Ley RE, Peterson DA, Gordon JI. 2006. Ecological and evolutionary forces shaping microbial diversity in the human intestine. Cell 124:837–848. doi: 10.1016/j.cell.2006.02.017. [DOI] [PubMed] [Google Scholar]
- 37.Turnbaugh PJ, Hamady M, Yatsunenko T, Cantarel BL, Duncan A, Ley RE, Sogin ML, Jones WJ, Roe BA, Affourtit JP, Egholm M, Henrissat B, Heath AC, Knight R, Gordon JI. 2009. A core gut microbiome in obese and lean twins. Nature 457:480–484. doi: 10.1038/nature07540. [DOI] [PMC free article] [PubMed] [Google Scholar]
- 38.Turnbaugh PJ, Ley RE, Mahowald MA, Magrini V, Mardis ER, Gordon JI. 2006. An obesity-associated gut microbiome with increased capacity for energy harvest. Nature 444:1027–1031. doi: 10.1038/nature05414. [DOI] [PubMed] [Google Scholar]
- 39.Li RW, Connor EE, Li C, Baldwin Vi RL, Sparks ME. 2012. Characterization of the rumen microbiota of pre-ruminant calves using metagenomic tools. Environ Microbiol 14:129–139. doi: 10.1111/j.1462-2920.2011.02543.x. [DOI] [PubMed] [Google Scholar]
- 40.Loman NJ, Misra RV, Dallman TJ, Constantinidou C, Gharbia SE, Wain J, Pallen MJ. 2012. Performance comparison of benchtop high-throughput sequencing platforms. Nat Biotechnol 30:434–439. doi: 10.1038/nbt.2198. [DOI] [PubMed] [Google Scholar]
- 41.Frey KG, Herrera-Galeano JE, Redden CL, Luu TV, Servetas SL, Mateczun AJ, Mokashi VP, Bishop-Lilly KA. 2014. Comparison of three next-generation sequencing platforms for metagenomic sequencing and identification of pathogens in blood. BMC Genomics 15:96. doi: 10.1186/1471-2164-15-96. [DOI] [PMC free article] [PubMed] [Google Scholar]
- 42.Kittelmann S, Seedorf H, Walters WA, Clemente JC, Knight R, Gordon JI, Janssen PH. 2013. Simultaneous amplicon sequencing to explore co-occurrence patterns of bacterial, archaeal and eukaryotic microorganisms in rumen microbial communities. PLoS One 8:e47879. doi: 10.1371/journal.pone.0047879. [DOI] [PMC free article] [PubMed] [Google Scholar]
- 43.Flint HJ, Bayer EA, Rincon MT, Lamed R, White BA. 2008. Polysaccharide utilization by gut bacteria: potential for new insights from genomic analysis. Nat Rev Microbiol 6:121–131. doi: 10.1038/nrmicro1817. [DOI] [PubMed] [Google Scholar]
- 44.Brulc JM, Antonopoulos DA, Miller ME, Wilson MK, Yannarell AC, Dinsdale EA, Edwards RE, Frank ED, Emerson JB, Wacklin P, Coutinho PM, Henrissat B, Nelson KE, White BA. 2009. Gene-centric metagenomics of the fiber-adherent bovine rumen microbiome reveals forage specific glycoside hydrolases. Proc Natl Acad Sci U S A 106:1948–1953. doi: 10.1073/pnas.0806191105. [DOI] [PMC free article] [PubMed] [Google Scholar]
- 45.Hurtaud C, Rulquin H, Verite R. 1993. Effect of infused volatile fatty acids and caseinate on milk composition and coagulation in dairy cows. J Dairy Sci 76:3011–3020. doi: 10.3168/jds.S0022-0302(93)77640-7. [DOI] [PubMed] [Google Scholar]
- 46.Polan CE, McNeill JJ, Tove SB. 1964. Biohydrogenation of unsaturated fatty acids by rumen bacteria. J Bacteriol 88:1056–1064. [DOI] [PMC free article] [PubMed] [Google Scholar]
- 47.Kepler CR, Hirons KP, McNeill JJ, Tove SB. 1966. Intermediates and products of the biohydrogenation of linoleic acid by Butyrinvibrio fibrisolvens. J Biol Chem 241:1350–1354. [PubMed] [Google Scholar]
- 48.Chiquette J, Allison MJ, Rasmussen MA. 2008. Prevotella bryantii 25A used as a probiotic in early-lactation dairy cows: effect on ruminal fermentation characteristics, milk production, and milk composition. J Dairy Sci 91:3536–3543. doi: 10.3168/jds.2007-0849. [DOI] [PubMed] [Google Scholar]
Associated Data
This section collects any data citations, data availability statements, or supplementary materials included in this article.


