

Abstract
In normal tissue repair, macrophages exhibit a pro-inflammatory phenotype (M1) at early stages and a pro-healing phenotype (M2) at later stages. We have previously shown that M1 macrophages initiate angiogenesis while M2 macrophages promote vessel maturation. Therefore, we reasoned that scaffolds that promote sequential M1 and M2 polarization of infiltrating macrophages should result in enhanced angiogenesis and healing. To this end, we first analyzed the in vitro kinetics of macrophage phenotype switch using flow cytometry, gene expression, and cytokine secretion analysis. Then, we designed scaffolds for bone regeneration based on modifications of decellularized bone for a short release of interferon-gamma (IFNg) to promote the M1 phenotype, followed by a more sustained release of interleukin-4 (IL4) to promote the M2 phenotype. To achieve this sequential release profile, IFNg was physically adsorbed onto the scaffolds, while IL4 was attached via biotin-streptavidin binding. Interestingly, despite the strong interactions between biotin and streptavidin, release studies showed that biotinylated IL4 was released over 6 days. These scaffolds promoted sequential M1 and M2 polarization of primary human macrophages as measured by gene expression of ten M1 and M2 markers and secretion of four cytokines, although the overlapping phases of IFNg and IL4 release tempered polarization to some extent. Murine subcutaneous implantation model showed increased vascularization in scaffolds releasing IFNg compared to controls. This study demonstrates that scaffolds for tissue engineering can be designed to harness the angiogenic behavior of host macrophages towards scaffold vascularization.
Introduction
Tissue engineering of bone grafts of clinically relevant sizes has been challenging, largely due to the inability to provide sufficient oxygen and nutrient transport to encapsulated cells. We have used perfusion bioreactors to mitigate diffusional limitations [1–4], but an ideal strategy would be to promote blood vessel ingrowth from the surrounding host tissue, connecting the scaffold to the host vasculature.
In addition to supporting cell viability, the growth of new blood vessels is also critical for stimulating osteogenesis. In developing bone, differentiation of mesenchymal stromal cells (MSCs) into osteoblasts is coupled with the invasion of capillaries, and the capillary network serves as a template for the developing bone [5]. Crosstalk between endothelial cells and osteoblasts is essential for bone formation [6, 7]. This process is tightly regulated by a series of angiogenic growth factors, especially vascular endothelial growth factor (VEGF) and platelet-derived growth factor-BB (PDGF-BB), which act in a sequential fashion to stimulate and stabilize blood vessel growth, respectively [5, 8]. The sequential application of growth factors following this natural temporally defined sequence of VEGF and PDGF-BB in angiogenesis has been used as a powerful stimulant to enhance blood vessel formation in tissue engineering scaffolds [9, 10]. However, during development, changes in the concentrations, timing, or spatial distribution of angiogenic growth factors result in vascular abnormalities [11]. For example, VEGF administered in high doses or without the subsequent administration of stabilizing PDGF-BB can lead to vessels that are leaky and unstable [12, 13]. Thus, precise control over the presentation of angiogenic growth factors in a tissue engineering strategy is crucial to their effectiveness.
In bone healing, inflammation, angiogenesis, and new bone regeneration are intimately linked, and the proper sequence of inflammatory signals followed by anti-inflammatory signals is critical for normal bone healing [14]. For example, administration of TNFα to fracture sites immediately after injury accelerated fracture repair in mice [15], while sustained administration impaired healing [16]. In another study, inflammation was prolonged and angiogenesis was reduced when bone healing was surgically prevented in an ovine model [17]. Thus, pro-inflammatory signals are beneficial for repair, provided that they subside in a timely fashion.
The temporally defined actions of the inflammatory response may be due to the changing profile of macrophages. Macrophages exist on a spectrum of phenotypes, ranging from “classically activated” or “M1,” which secrete pro-inflammatory cytokines, to “alternatively activated” or “M2,” which promote extracellular matrix (ECM) synthesis and cell proliferation [18]. M1 macrophages dominate at early times (1–5 days) after injury, while M2 macrophages dominate at later stages (4–10 days), although they are present at initial time points [19, 20].
We recently showed that M1 macrophages express and secrete factors that are responsible for initiating the process of angiogenesis, including VEGF, while M2 macrophages secrete factors involved in later stages of angiogenesis, including PDGF-BB [21]. Thus, it appears likely that M1 macrophages initiate angiogenesis and M2 macrophages stabilize the growing vasculature. In keeping with these results, we found that sprouting of human umbilical cord-derived endothelial cells (HUVECs) on Matrigel in vitro was increased in culture media conditioned by M1 macrophages, while anastomosis of growing sprouts was promoted in M2-conditioned media [21].
Given the critical role of macrophages in promoting angiogenesis, a strategy that uses these cells to direct scaffold vascularization would be highly advantageous. Macrophages would release growth factors necessary for proper blood vessel formation at the correct doses and timing. The fact that M1 macrophages appear at early stages of normal wound healing followed by M2 macrophages, and that each subtype secretes factors known to follow similar temporal patterns in angiogenesis, suggests that biomaterials that first promote the M1 phenotype followed by the M2 phenotype would achieve maximum vascularization by mobilization of the host macrophages.
To this end, we have designed scaffolds based on decellularized bone that first release the M1-promoting cytokine interferon-gamma (IFNg) in order to augment the natural M1 response to injury, followed by the M2-promoting cytokine interleukin-4 (IL4), to promote the M2 phenotype. To achieve this sequential release profile, IFNg was physically adsorbed onto the scaffolds for fast release, while IL4 was attached via biotin and streptavidin binding for sustained release. Exploiting biotin-streptavidin interactions affords control over the release of IL4 without drastically altering the biofunctionality of the bone scaffolds, which might occur with other controlled release systems such as coatings. Because the bone scaffolds themselves are osteogenic [2, 22], we expected that infiltrating blood vessels will bring osteoprogenitor cells that will differentiate into osteoblasts within the scaffolds. We first confirmed that macrophages have the ability to switch from the M1 to the M2 phenotype, and characterized the kinetics of gene expression, surface marker expression, and protein secretion (Fig. 1a). Then, the ability of biofunctionalized scaffolds to promote sequential M1 and M2 polarization of primary human macrophages was evaluated in vitro (Fig. 1b). Finally, a preliminary study of the effects on scaffold vascularization was conducted in a subcutaneous implantation model in mice.
Figure 1. Study design.

a) Study 1: Monocyte-derived macrophages were exposed to M1- or M2-polarizing stimuli for 3 days followed by polarizing stimuli of the other phenotype for an additional 3 days (M1→M2 and M2→M1). Unstimulated macrophages (M0) or macrophages cultured under M1- or M2-polarizing stimuli for 6 days (M1 and M2), with a media change at day 3, served as controls. b) Study 2: Scaffolds with physically adsorbed IFN-gamma are expected to cause initial polarization of macrophages to the M1 phenotype. M1 macrophages release angiogenic growth factors such as VEGF, recruit endothelial cells, and initiate the process of angiogenesis. Scaffolds would then release IL4, which would convert M1 macrophages to the M2 phenotype. M2 macrophages secrete factors such as PDGF-BB that recruit pericytes to stabilize the growing vasculature. c) The small molecule biotin is covalently conjugated to the scaffolds and to IL4, preserving their bioactivity and allowing them to be joined to the scaffolds using streptavidin.
2. Materials and methods
2.1. Isolation and culture of primary human macrophages
Monocytes were isolated from enriched leukocyte fractions of human peripheral blood purchased from the New York Blood Center using sequential Ficoll and Percoll density gradient centrifugations, as we have previously described [21]. Monocytes were cultured at 37°C and 5% CO2 in ultra low attachment flasks (Corning) for five days at a density of 0.4×10⁶ cells/cm2 and 1.0×10⁶ cells/ml of complete media (RPMI media supplemented with 10% heat-inactivated human serum, 1% penicillin-streptomycin, and 20ng/ml macrophage colony stimulating factor (MCSF)). Macrophages were polarized over the next 1–6 days by culturing at 1.0×10⁶ cells/ml in complete media with 100ng/ml IFN-gamma (Peprotech, Rocky Hill, NJ) and 100ng/ml lipopolysaccharide (LPS, Sigma Aldrich) for M1 or 40ng/ml IL4 and 20ng/ml IL13 (Peprotech, Rocky Hill, NJ) for M2, with a media change at day 3. At the media change, the media of another group of M1 macrophages was switched to M2-polarizing media and the media of a group of M2 macrophages was switched to M1-polarizing stimuli, in order to characterize the ability of macrophages to switch phenotypes. Unactivated macrophages were also cultured over the same time periods (M0), resulting in three groups through day 3 (M0, M1, M2) and five groups between days 4 and 6 (M0, M1, M2, M1→M2, M2→M1) (Fig. 1a).
2.2 Characterization of macrophage phenotype
At days 1, 2, 3, 4, and 6, macrophages were collected by gentle scraping and centrifugation. The number of viable cells was determined at each time point by trypan blue exclusion. Macrophages from each time point were characterized for expression of known M1 and M2 markers by quantitative RT-PCR, according to our previously described methods [21]. For flow cytometry, cells were dual-stained with APC-conjugated CCR7 (Biolegend.com, catalog no. 353213, dilution 1:50) and FITC-conjugated CD206 (Biolegend.com, catalog no. 321103, dilution 1:100). Corresponding isotype controls were used as recommended by the manufacturer. Labeled cells were analyzed using a FACSCalibur flow cytometer and the CellQuest software (BD Biosciences, Pharminogen). Data was processed using FlowJo software (Treestar). To determine the proportion of cells staining for a given marker at high or low levels, the mean intensity of staining of the M0 population was used as a threshold. In other words, cells staining more intensely for CCR7 than the mean of the M0 population were considered CCR7hi, while those staining less intensely than the mean of the M0 population were considered CCR7lo. This analysis was performed similarly for CD206hi and CD206lo populations, allowing determination of the proportion of cells that were both CCR7hi and CD206lo and those that were both CCR7lo and CD206hi.
At each time point, the supernatant was frozen at −80°C until analysis by enzyme-linked immunosorbent assays (ELISA). Secreted M1 markers included tumor necrosis factor-alpha (TNF-alpha) and VEGF (Peprotech) and M2 markers included CCL18 (R&D Systems) and PDGF-BB (Peprotech).
2.3. Preparation and biotinylation of scaffolds
Decellularized bone scaffolds were prepared from trabecular bone by coring plugs from the subchondral regions of young cows and washing with water and detergents as we have previously described [2, 23]. Scaffolds (4mm in diameter and 2–3mm in height) were separated based on density, calculated by measuring the height, diameter, and mass of cylindrical samples, in order to ensure uniformity between experiments. The average density of the scaffolds used in this study was 0.49±0.03 mg/mm3 (mean ± standard deviation).
Scaffolds were sterilized by soaking in 70% ethanol for 24 hours, followed by washing in phosphate-buffered saline (PBS). Then, scaffolds were biotinylated using NHS (N-Hydroxysuccinimide) chemistry by immersion in 10mM Biotin-sulfo-LC-LC-NHS (EZ Link™, Thermo Fisher Scientific, Rockford, IL) for one hour, followed by three washes with 2ml PBS to remove unattached biotin. Scaffolds were briefly immersed again in 70% ethanol for 10min, followed by three more washes, and finally immersed in PBS at 4°C overnight prior to attachment of biotinylated proteins.
The extent of scaffold biotinylation was determined after mixing with avidin and HABA (4′-hydroxyazobenzene-2-carboxylic acid, Thermo Fisher Scientific, Rockford, IL). HABA binds strongly to avidin, but is displaced by biotin, which binds at a much higher affinity, causing a decrease in the absorbance of HABA, which can be read spectrophotometrically. A standard curve of biotin was prepared in a 96-well plate using non-biotinylated scaffolds together with 20ul of biotin solutions ranging from 0 to 100ug/ml. 180ul of a solution of HABA and avidin (2.69mg/ml HABA and 0.467mg/ml avidin) was added to each well containing the standards or the biotinylated scaffolds. After 1 minute the scaffolds were removed and the absorbance was read at 500nm. The difference in absorbance from blank controls was used to generate a standard curve and to calculate the amount of biotin on each scaffold.
In preliminary studies, an approximately 50-fold excess of biotin to protein content of the scaffolds (calculated using the assumption that the protein was 100% collagen) was found to result in the same level of biotinylation as up to 500-fold molar excess (Fig. S1). Therefore a 50-fold molar excess of biotin was used for scaffold biotinylation.
2.4. Protein biotinylation and conjugation to scaffolds
IL4 was biotinylated by adding a 100-fold molar excess of the 10mM Biotin-sulfo-LS-LS-NHS for one hour, followed by dialysis overnight to remove unattached biotin, and then sterile-filtered. Retention of bioactivity was 75%, determined using an IL4 ELISA (Peprotech).
Four groups of scaffolds were prepared: scaffolds with attached IL4 (IL4), scaffolds with adsorbed IFNg (IFNg), their combination (Combo), and a negative control (Neg. Cntrl.), which was prepared in the same way as the other scaffolds but using PBS instead of IFNg or IL4 solutions (Fig. 1b).
For all groups, biotinylated scaffolds were soaked in 0.5ml of 172μg/ml streptavidin (Thermo Fisher Scientific) for 1 hour, followed by washing 3 times in PBS. To prepare the IL4 and Combo groups, scaffolds were soaked in 375ng biotinylated IL4 in 0.5ml of PBS for 1 hour, while Neg. Cntrl. and IFNg groups were soaked in PBS. Streptavidin has four binding sites for biotin with extremely high specificity and strength [24], creating a strong but not covalent linkage between IL4 and the scaffolds (Fig. 1c). To determine that streptavidin bound specifically to biotin on the scaffolds, biotinylated scaffolds were incubated with fluorescent Streptavidin-DyLight-594 (Thermo Fisher Scientific) and compared to non-biotinylated scaffolds using confocal laser scanning microscopy.
Following streptavidin binding, scaffolds were washed 3 times with 2ml PBS to remove unattached IL4. Then, scaffolds in the IFNg and Combo groups were incubated in IFNg (325ng/scaffold) for 1 hour to allow physical adsorption, while Neg. Cntrl. and IL4 scaffolds were soaked in PBS. Scaffolds were then transferred to 24-well ultra low attachment plates for release studies or for macrophage culture.
2.5. Characterization of release profiles
The amount of bound IFNg and IL4 on each scaffold was assessed indirectly by measuring the amount of protein in the wash solutions using ELISA kits (Peprotech). To characterize the release of IFNg and IL4 proteins from the scaffolds, scaffolds from each of the four groups were incubated in 1ml complete media for 11 days at 37°C and 5% CO2, with samples taken and media refreshed at 6hrs, 1 day, 2 days, 3 days, 6 days, and 11 days. The amount of IFN-gamma and IL4 in each sample was determined using ELISA (Peprotech). Values obtained for the negative control scaffolds were subtracted from the experimental groups at each time point. Samples of biotinylated IL4 were also assayed in both IFNg and IL4 ELISAs to ensure that there was no nonspecific binding.
2.6. Macrophage seeding and characterization
Macrophages were collected 5 days after differentiation from monocytes and seeded onto the scaffolds at 8.0×10⁵ per scaffold in 20μl of complete media (n=6). The cells were allowed to attach for 1 hour before the addition of 1ml complete media. The cell-seeded constructs were cultured for 3 and 6 days, with a media change after 3 days. The media was frozen at −80°C until analysis for M1 and M2 markers by ELISA, as described above. To extract RNA from the scaffolds, the scaffolds were immersed in 1ml Trizol Reagent (Life Technologies) with 5–6 steel beads (0.5mm diameter) and homogenized for 6 cycles of 10 seconds in a Mini Bead Beater-8 (Biospec Products, Bartlesville, OK). RNA was extracted into chloroform, which was then purified using an RNeasy Micro Kit (Qiagen) according to the manufacturer’s instructions. DNase treatment, cDNA synthesis, and RT-PCR was performed as we have previously described [21].
2.7. LPS contamination
Cell culture media was periodically tested for contamination with LPS using the LAL Chromogenic Endotoxin Quantification kit (Thermo Scientific Fisher) per the manufacturer’s instructions. LPS contamination was always below 0.1 EU/ml.
2.8. Subcutaneous implantation model
All animal experiments followed federal guidelines and were conducted under a protocol approved by Drexel University’s Institutional Animal Care and Use Committee. Scaffolds were prepared as described above except using murine cytokines (Peprotech). One scaffold from each of the four groups was implanted subcutaneously in female 8-week-old C57BL/6 mice for two weeks (n=3 mice). Mice received a subcutaneous injection of buprenorphine (0.1mg/ml) for pain, anesthetized using isofluorane (1–5%), shaved, cleaned with ethanol and iodine, and then draped for surgery. A small incision was made in the central dorsal surface using a scalpel. Blunt forceps were used to create a pocket in the subcutaneous space for the scaffolds. After implantation, wounds were closed with one wound clip. Mice were housed together and monitored for 14 days. No signs of pain or discomfort were observed following surgery or throughout the study.
Following 2 weeks of in vivo cultivation, mice were euthanized by CO2 asphyxiation. Scaffolds were explanted, fixed overnight in 4% paraformaldehyde, decalcified in formic acid (Immunocal, Decal Chemical Corporation, Tallman, NY), dehydrated through an ethanol series and embedded in paraffin. Samples were sectioned to 5μm and stained for general structure using hematoxylin and eosin (H&E). Endothelial cells were visualized via immunohistochemical staining for CD31. Sections were subjected to antigen retrieval by immersion in 95°C citrate buffer for 20min, then blocked for 1hr in 5% bovine serum albumin, then incubated overnight with goat-anti-mouse CD31 (dilution 1:30, Santa Cruz Biotechnology, catalog no. sc-1506) and visualized using a donkey-anti-goat secondary antibody conjugated to FITC (Santa Cruz Biotechnology, catalog no. sc-2024), counterstained with DAPI (Vector Labs DAPI mounting medium). Fluorescent images of CD31 staining were acquired on an Evos Fl Digital inverted fluorescence microscope. The number of CD31+ vessels within the samples was quantified in at least six images per section (10x magnification) and two sections per sample using ImageJ. The mean fluorescence intensity of the delete primary negative control was subtracted from that of the samples.
Samples were also analyzed for macrophage phenotype markers as we have previously described [21]. Samples were triple-stained for the M1 marker iNOS, the M2 marker Arg1, and the pan-macrophage marker F480. At least six images per section (20x images) and two sections per sample will acquired on an Evos FI Digital inverted fluorescence microscope. The mean intensity of expression of each marker in the cellular portion of the images was quantified in ImageJ. Intensity was analyzed as opposed to counting cells because we have previously shown that intensity is a better marker of macrophage phenotype than the presence or absence of a marker [21]. The mean intensity of expression in the delete primary control images was subtracted from the value obtained each marker to account for nonspecific staining.
Samples were also analyzed for the presence of IL4 using rabbit-anti-mouse IL4 (1:10 Thermo Scientific Pierce, catalog no. PA 525165) and goat-anti-rabbit secondary antibody conjugated to DyLight488 (Thermo Scientific Pierce).
2.9. Statistical analysis
Data are represented as mean ±SEM. Data from all in vitro experiments are representative from one of at least three repeated experiments. Statistical analysis was performed in GraphPad Prism 4.0 using one-way ANOVA and either Tukey’s or Dunnett’s post-hoc analysis, as indicated. A p-value of less than 0.05 was considered significant.
3. Results
3.1. Kinetics of macrophage phenotype switching
Over 6 days of culture in polarizing stimuli, M1 and M2 macrophages gradually increased surface marker expression of CCR7 and CD206, with M1 macrophages staining more strongly for CCR7 (Fig. 2a) and M2 macrophages staining more strongly for CD206 (Fig. 2c). When M1 macrophages were given M2-promoting stimuli at day 3, the entire population shifted to express less CCR7 and more CD206 (Fig. 2b). Similarly, M2 macrophages that were given M1-promoting stimuli at day 3 showed reduced CD206 expression and increased CCR7 expression (Fig. 2a, c).
Figure 2. Expression of surface markers of macrophage phenotype, determined by flow cytometry.

(a) Histograms showing intensity of CCR7 expression, an M1 marker, over time for each group. Open histograms represent the isotype control. b) Scatterplots representing intensity of CCR7 and CD206 staining for dual-stained samples (arbitrary units). The switched phenotype group (M1->M2) shows intermediate staining between M1 and M2 controls at days 4 and 6. (c) Histograms showing intensity of CD206 expression, and M2 marker, over time for each group. Open histograms represent the isotype control. (d) The proportions of each populations staining both at a high level for CCR7 and a low level for CD206 (CCR7hiCD206lo), indicative of a strong M1 phenotype, or those staining both at a low level for CCR7 and a high level for CD206 (CCR7loCD206hi), indicative of a strong M2 phenotype.
Maximum staining was observed at day 4 in terms of both the percentage of the population staining positively (Fig. S2a). We also evaluated the mean intensity per cell (Fig. S2b), which is a better indicator of macrophage phenotype than the percent of cells staining positively [21]. To more accurately describe the change in the numbers of cells representing the M1 and M2 populations, we gated based on the mean intensities of CD206 and CCR7 expression of the M0 population at the same time point, in order to determine the number of cells that could be described as CCR7hiCD206lo, which would indicate the M1 phenotype, and those that were CCR7loCD206hi, which would be more indicative of the M2 phenotype (Fig. 2d). Interestingly, the greatest changes in expression were seen at day 4, or one day after the media change at day 3, even for control phenotypes that were not switched, indicating that the macrophages were able to respond to increased stimulus. In addition, the change from M1→M2 appeared more dramatic than the change from M2→M1, in that the latter group did not show expression of CCR7 after 6 days at the same levels as M1 controls, even though M1→M2 cells showed levels of CD206 that were higher than M2 controls at day 6.
Gene expression of the M1 markers TNFa, IL1b, CCR7, and VEGF was highest for M1 macrophages and increased over time, with the highest expression at day 6 (Fig. 3). In keeping with flow cytometry results, a dramatic increase was seen at day 4, after the media change. The addition of M2-promoting stimuli at day 3 effectively inhibited expression of these genes and caused upregulation of the M2 markers CCL18, MDC/CCL22, CD206/MRC1, PDGF, and TIMP3. M2 macrophages showed high levels of expression of the M2 markers, with maximum expression at day 3, until the media was changed to M1-polarizing stimuli, at which point they decreased expression of M2 markers and increased expression of M1 markers. Both M1 and M2 macrophages that were switched to the other phenotype expressed genes comparable to or higher than the control phenotypes. Interestingly, however, M1 macrophages that were switched to the M2 phenotype did not down regulate VEGF expression, although they did increase expression of PDGF. Moreover, M2 macrophages that were switched to the M1 phenotype showed equally high expression of both VEGF and PDGF at day 6, indicating a mixed or hybrid phenotype. Control M1 macrophages also increased expression of PDGF at day 6, suggesting that they may naturally increase expression of this gene over time.
Figure 3. Temporal changes in macrophage gene expression.

Data are shown as fold change over M0 controls at the same time point. Gene expression was analyzed by RTPCR after 1, 3, 4, and 6 days of culture. Lines connecting data points are used to show relationships between time points and do not indicate a linear relationship.
M1 macrophages secreted high levels of TNF-alpha and VEGF, with maximum secretion at days 4–6 (Fig. 4). The addition of M2-polarizing stimuli caused drastic inhibition of secretion of these markers and increased in secretion of the M2 markers CCL18 and PDGF-BB, compared to control M1 macrophages that were stimulated for 6 days. Similarly, the addition of M1-polarizing stimuli to M2 macrophages caused decreased secretion of M2 markers CCL18 and PDGF-BB as well as increased secretion of the M1 markers TNF-alpha and VEGF.
Figure 4. Changes in cytokine secretion over time.

Cell culture media after 1, 2, 3, 4, and 6 days was analyzed by ELISA.
Interestingly, we found that M2 macrophages, including M1 macrophages that were switched to the M2 phenotype, proliferated over time in culture (Fig. S3). When the amount of secreted proteins was normalized to the number of viable cells at each time point, the amounts of M2 markers secreted by M1 macrophages that were switched to M2 media were only slightly higher than the M1 control (Fig. S4).
3.2. Release of IFNg and IL4
Having confirmed that M1 macrophages can switch to the M2 phenotype, we next examined their behavior on scaffolds designed to elicit sequential M1 and M2 polarization. Decellularized bone scaffolds were biotinylated using NHS chemistry. Streptavidin was found to only bind to scaffolds that were biotinylated (Fig. 5a), with undetectable nonspecific binding to control scaffolds after washing (Fig. 5b).
Figure 5. Cumulative release.
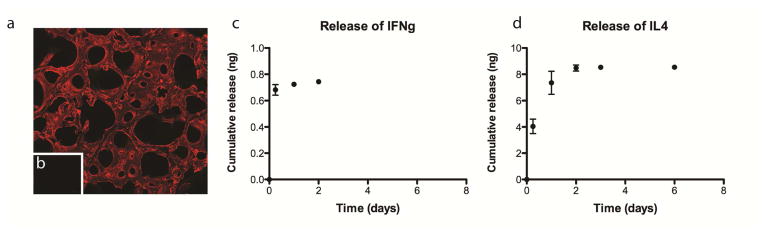
(a) Fluorescent streptavidin bound to biotinylated scaffolds but not to non-biotinylated scaffolds (b), assessed using confocal microscopy. (c) Cumulative release of IFN-gamma from IFNg scaffolds. (d) Cumulative release of IL4 from IL4 scaffolds.
Indirect measurement of the content of unbound proteins in the wash solutions used in the preparation of the scaffolds suggested that 26.9 ± 10.3ng of IFNg and 153.3 ± 48.5ng of IL4 attached to the scaffolds. However, release studies showed that less than 1ng of the adsorbed IFN-gamma was released in the first 48 hours, resulting in a concentration of less than 1ng/ml in the media (Fig. 5c). Less than 8ng of biotinylated IL4 was released over 6 days, with no detectable IL4 in the media after that point (Fig. 5d). It is likely that the indirect measurement method overestimates the actual loading, and further studies are therefore required to confirm this point.
Release profiles of IFNg and of IL4 were not found to be different for Combo scaffolds, which had both IFNg and IL4, compared to the scaffolds with only IFNgor IL4 (Fig. S5).
3.3. Response of macrophages to immunomodulatory scaffolds
Gene expression data indicated that physical adsorption of IFNg to scaffolds with and without attached IL4 caused increased expression of M1 markers after 3 days of culture (Fig. 6). This early M1 polarization was achieved despite low levels of protein released in the first three days (less than 1ng, compared to the dose of 100ng that is typically used to polarize macrophages to the M1 phenotype (Fig. 5c)). Expression of M1 markers decreased to background levels by day 6, although expression of TNFa and CCR7 did remain significantly higher for Combo scaffolds compared to the negative control. At both 3 and 6 days, expression of M2 markers was significantly higher for macrophages seeded on scaffolds with attached IL4 compared to the negative control. Macrophages seeded on scaffolds in the Combo group also significantly increased gene expression of M2 markers at day 3, but these increases were not significant at day 6. There were some genes that were not regulated as expected: Expression of CD206 was not significantly different between any of the groups at either time point, despite being a well-known marker of IL4-induced M2 activation. In addition, the M2 marker PDGF was upregulated at day 3 by the presence of IFNg, reminiscent of the hybrid phenotypes of M1 switching to M2 shown in Fig. 3.
Figure 6. Gene expression changes of macrophages on immunomodulatory scaffolds over time.

Data are represented as fold change over GAPDH (2−ΔCt). *p<0.05, **p<0.01, and ***p<0.001 compared to the negative control, analyzed using one-way ANOVA at each timepoint with Dunnett’s post-hoc analysis (mean+/− SEM, n=4). Representative data from experiments that were repeated three times.
The amounts of secreted proteins associated with the M1 and M2 phenotypes were measured using ELISA to confirm gene expression results. Adsorption of IFNg caused increases in the secretion of the M1 marker TNF-alpha at 3 days compared to the IL4 group (one-way ANOVA with Tukey’s post-hoc analysis, p<0.05) (Fig. 7). No differences were seen in M1 marker secretion at 6 days. Attachment of IL4, without adsorbed IFNg, caused significant increases in secretion of the M2 marker CCL18, which was sustained at 6 days (one-way ANOVA with Tukey’s post-hoc analysis, p<0.001). Attachment of IL4 also increased secretion of PDGF-BB at 6 days compared to the negative control (one-way ANOVA with Dunnett’s post-hoc analysis, p<0.05). Interestingly, macrophages seeded on the Combo scaffolds did not show significantly different levels of secretion of any marker compared to the control, despite their ability to promote changes in both M1 and M2 gene expression.
Figure 7. Cytokine secretion by macrophages seeded on scaffolds.

*p<0.05 by one-way ANOVA and Tukey’s post-hoc analysis; #p<0.01 and ***p<0.001 by one-way ANOVA followed by Dunnett’s post hoc analysis (mean +/− SEM, n=5).
3.4. Vascularization in vivo
After 2 weeks of in vivo implantation (Fig. 8a), all scaffolds were fully infiltrated by cells (Fig. 8b). Large blood vessel-like structures were apparent in the IFNg, IL4, and Combo groups, but not in the negative control scaffolds. The endothelial cell marker CD31 was most abundant in IFNg and Combo samples (Fig. 8c). There were significantly more CD31+ blood vessels in the IFNg scaffolds compared to the negative control scaffolds (p<0.05) (Fig. 8d).
Figure 8. Scaffolds after 2 weeks of subcutaneous implantation in mice.

(a) Gross view, (b) H&E staining, (c) immunohistochemical analysis for the endothelial cell marker CD31 (green) and counterstained with DAPI (blue), and (d) quantification of the number of CD31+ vessels per mm2 (mean +/− SEM, n=3, * indicates significance determined from one way ANOVA and Tukey’s post-hoc analysis, p<0.05). Scale bars represent 100μm.
No differences were observed in macrophage phenotype, as indicated by staining for the M1 marker iNOS, the M2 marker Arg1, and the pan-macrophage marker F480 (Fig. 9A). Quantification of the mean intensity of each marker in the cellular portion of the scaffolds (Fig. 9B) confirmed that there were no significant differences in staining between groups. Normalization to F480, which would represent amount of staining per macrophage, or normalization of Arg1 staining to iNOS staining, a relative measure of M2 vs. M1 polarization, also yielded no significant differences (Fig. 9C).
Figure 9. Immunohistochemical analysis of macrophage phenotype after 2 weeks of subcutaneous implantation in mice.

Samples were stained for the M1 marker iNOS (green), the M2 marker Arg1 (blue) and the pan-macrophage marker F480 (red). A. (a) Neg. cntrl, (b) IFNg, (c) IL4, (d) Combo, (e) delete primary control. B. Quantification of the mean intensity of the cells staining for (f) the M2 marker Arg1, (g) the M1 marker iNOS, and (h) the pan-macrophage marker F480. C. Normalized values representing (i) the mean level of Arg1 expression per macrophage, (j) the mean level of iNOS expression per macrophage, and (k) the relative level of Arg1 to iNOS staining. No significant differences were found between any groups.
Murine IL4 was detected in all of the samples, without differences in staining between the groups, indicating that no scaffold-derived IL4 remained after 2 weeks in vivo (Fig. S6).
4. Discussion
Bone is unique in that small fractures heal perfectly, without scarring [25], while large bone defects remain a significant challenge [26]. There is a significant need for tissue engineering strategies that utilize synthetic materials to harness the body’s natural ability to heal itself. The natural inflammatory response to injury or to an implanted biomaterial is a powerful force that determines the course of angiogenesis, healing, and repair. Our work and that of others showed that the inflammatory response and subsequent angiogenesis could be modulated through manipulation of macrophages using biomaterial properties [21, 27, 28]. The fact that M1 macrophages appear at early stages of normal wound healing, followed by M2 macrophages, and that each secretes factors that are known to act sequentially in angiogenesis, suggests that biomaterials that first promote the M1 phenotype followed by the M2 phenotype will achieve greater vascularization and healing.
Protein delivery strategies that are designed to cause vascularization following implantation in vivo include scaffolds that sequentially release pro-angiogenic factors like VEGF followed by pro-maturation factors like PDGF-BB [10, 29]. The regulation of blood vessels is a complex process involving a myriad of growth factors and signaling molecules released at precise timing and doses [30], making recapitulation with synthetic drug delivery systems an impossible task. However, macrophages are known to control angiogenesis through secretion of multiple factors [21, 31–33]. Macrophages also control healing by influencing the behavior of other cell types, including fibroblasts in cutaneous wound healing [34, 35], neurons in spinal cord repair [36, 37] osteoblasts in bone defects [38, 39], and myogenic cells in skeletal muscle injury [19]. Control over macrophage behavior may therefore afford control over all other cell types in the vicinity of the injury.
It is well known that the balance of macrophage phenotypes switches from pro-inflammatory (M1) to anti-inflammatory (M2) at 1–2 days after injury [19, 40, 41]. However, whether the macrophages themselves change phenotypes or a new wave of arriving macrophages takes on a new phenotype is more controversial [42]. Studies that employed fluorescent labeling showed that at least part of the M2 population that appears at later stages of wound healing are derived directly from the M1 population that presided at early stages [19, 41, 43]. Such plasticity of macrophages is considered useful for the rapid resolution of inflammation. Tumors and parasites exploit this plasticity of macrophages, triggering the M1-to-M2 switch in order to evade the immune system [44, 45]. Macrophages also switch from M2 to M1 in pathologic situations, especially obesity, kidney disease, atherosclerosis, and chronic venous ulcers [34, 46–48].
Macrophage phenotype switching has been described in vitro [49–51], but the mechanism of this transition is still not well understood. As an initial step toward elucidating macrophage phenotype transitions, we characterized the kinetics of this process using a wide range of phenotypic markers on both gene and protein levels. However, recent studies show that it is not entirely accurate to portray macrophages as possessing the ability to “switch” from one phenotype to another, which implies that there are just two phenotypes that exist in opposition to one another. In contrast, macrophages change their behavior in response to subtle changes in their microenvironment, including the sequential administration of synergistic and/or antagonistic stimuli [51]. In this study, macrophages predictably increased or decreased gene expression of known markers of macrophage phenotype when the environmental stimuli were switched, but expression and secretion of the angiogenic proteins VEGF and PDGF were less predictable. Further research is required to investigate the role of these hybrid phenotypes in regulating angiogenesis, especially considering that “mixed” phenotypes have been associated with blood vessel development and scaffold vascularization [20, 21, 52]. Another interesting result was that M2 macrophages proliferated in vitro, which was recently described in vivo as a normal response to IL4 [53]. Thus, switching from the M1 phenotype is not the only mechanism by which M2 macrophages accumulate at a site of injury in order to contribute to repair.
We have previously shown that the sequential actions of M1 and M2 macrophages result in increased vascularization of scaffolds because of their roles in angiogenesis at early and late stages, respectively [21]. Therefore, we hypothesized that biomaterials that promote the M1 and then the M2 phenotype would promote vascularization via the action of host macrophages. Decellularized bone scaffolds are highly osteoinductive and osteoconductive, supporting the formation of new bone by osteoblasts and MSCs [2, 54, 55]. We have successfully utilized these scaffolds for bone tissue engineering [2, 22, 23], but the in vivo regeneration of bone of clinically relevant sizes has not yet been achieved, largely due to the inability to provide sufficient oxygen and nutrient transport to encapsulated cells. We have used perfusion bioreactors to mitigate the diffusional limitations in vitro, but no blood vessels exist to support the viability of the tissue once it is implanted [1–4]. An ideal strategy would promote blood vessel ingrowth from the surrounding tissue, connecting the scaffold to the host vasculature.
Our goal was to impart immunomodulatory activity to these scaffolds to enhance their vascularization through the action of host macrophages while minimizing disruptive effects on their osteogenic properties. For this reason we chose to attach IFNg by physical adsorption to allow rapid release and to attach IL4 via biotin-streptavidin interactions to cause its sustained presence. Biotinylation is a useful strategy in bioconjugation techniques because the small size of biotin limits damage to protein bioactivity [56–58]. Biotin-avidin binding is among the strongest known non-covalent interactions [59]. Affinity systems with weaker binding interactions, including heparin with heparin-binding growth factors, cyclodextrins with small hydrophobic drugs, and antibody-antigen pairs, have been used in numerous controlled release strategies [60]. The release of drug from affinity-based systems can be described by
| (Eq. 1) |
where C is the concentration of the free drug, D is its diffusivity, and Kb is the ratio of the concentration of available binding sites to the dissociation constant Kd [61]. The assumptions of this model are that the drug diffuses with constant diffusivity, that the drug binds to its receptor with a 1:1 interaction, which is the case with a high ratio of available binding sites to the diffusible drug, and that the rate of binding is much higher than that of dissociation. Because of the extremely low Kd of biotin-streptavidin (10−15 M, [62]), with a D of ~10−9 m2/s for IL4 [63], and with 0.04 mol/m3 of avidin added to the system, this model predicts that biotinylated drug would virtually never exit the system, a result of the strong binding interactions between biotin and streptavidin. Surprisingly, we found that biotinylated IL4 was slowly released over 6 days. We found no evidence of remaining IL4 after 2 weeks in vivo, although further studies are required to conclusively confirm that no residual protein remains bound to the scaffolds. These results suggest that the conjugation of IL4 to biotin substantially reduced its binding affinity to streptavidin, which is in agreement with studies on the use of streptavidin-biotin interactions in affinity separation chromatography [64–67]. Further research is required to investigate the utility of biotin-streptavidin binding in controlled release systems.
Rapid release of IFNg caused early M1 polarization of seeded macrophages in vitro, at least in terms of gene expression, and sustained release of IL4 caused M2 polarization that persisted at 6 days in terms of both gene expression and protein secretion. However, early release of IFNg combined with sustained release of IL4 (Combo group) did not result in robust M1 and M2 polarization at early and late time points, respectively, and protein secretion at any time point was not different from the negative control. It is likely that the effects of IFNg and IL4 were counterproductive. M2 macrophages are present at early time points and mixed macrophage phenotypes have been shown to be beneficial for angiogenesis [20], but the two phases may need to be more temporally separated in future generations of these biomaterials in order to allow more robust sequential polarization.
In the study of vascularization in vivo, the presence of IFNg without the presence of IL4 resulted in increased vascularization compared to the negative control. Considering that IFNg has been shown to inhibit angiogenesis in vitro [68, 69], these results suggest that the increased vascularization was mediated by M1 macrophages, which are highly angiogenic [21]. Other studies have found a correlation between M1 macrophage behavior and scaffold vascularization [70–73]. In this study, we found no difference in immunofluorescent staining of M1 and M2 phenotype markers, which may be a result of the lack of sensitivity or robustness of semi-quantitative image analysis to distinguish between macrophage phenotypes, or the fact that these samples were retrieved after 2 weeks in vivo, which is at least one week after the released cytokines would be expected to have an effect. Future studies are required with increased numbers of replicates and at earlier and later time points in order to fully attribute vascularization to the actions of host macrophages. We report proof-of-concept that scaffolds can be designed to control macrophage phenotype through the conjugation and release of immunomodulatory cytokines, with resulting effects on scaffold vascularization. Future studies are required to maximize sequential M1 and M2 polarization, and to ensure the continued osteogenic properties of the bone scaffolds.
5. Conclusions
The inflammatory response is a powerful determinant of the success or failure of a biomaterial. If this process can be harnessed through biomaterial design, then vascularization or integration could potentially be achieved without the need for cell seeding. This study highlights the importance of using multiple markers on the gene and protein levels to characterize macrophages and provides insight into the temporal changes in phenotype over time. We show that biotin-streptavidin interactions can be used to convert biomaterials into controlled release systems that sustain the release of biotinylated proteins for over 6 days. Future studies will examine the potential of these immunomodulatory bone scaffolds in an orthotopic bone defect.
Supplementary Material
Figure S1: Amount of biotin bound to each scaffold. Data are shown as a function of the molar excess that was added, determined using the HABA/avidin binding assay.
Figure S2: Quantitation of macrophage staining. (a) Percentage of the population staining positively for CCR7 or CD206. (b) mean fluorescent intensity per cell of CCR7 and CD206, determined using flow cytometry.
Figure S3: Numbers of viable cells. Data are shown as a function of time, and normalized to the starting numbers. Cells were counted using trypan blue exclusion.
Figure S4: Total proteins secreted into the media. Data are normalized to the number of viable cells at each time point.
Figure S5: Cumulative release of IFN-gamma and IL4. Data are shown for IFNg, IL4, and Combo scaffolds. The release profiles of IFN-gamma or IL4 from the Combo scaffolds were not different from the control IFNg and IL4 scaffolds.
Figure S6: In vivo studies. Immunohistochemical staining for IL4 on scaffolds that were implanted subcutaneously in mice for 2 weeks.
Acknowledgments
The authors gratefully acknowledge NIH support of this work (grants EB002520, DE016525 and AR061988 to GVN). The authors thank Dr. Sarindr Bhumiratana and Petros Petridis for their assistance with bone scaffold preparation, Emily Reimold for help with animal surgeries, and the Kimmel Cancer Center at Jefferson for assistance with histology.
Footnotes
Publisher's Disclaimer: This is a PDF file of an unedited manuscript that has been accepted for publication. As a service to our customers we are providing this early version of the manuscript. The manuscript will undergo copyediting, typesetting, and review of the resulting proof before it is published in its final citable form. Please note that during the production process errors may be discovered which could affect the content, and all legal disclaimers that apply to the journal pertain.
References
- 1.Grayson WL, Bhumiratana S, Cannizzaro C, Chao PH, Lennon DP, Caplan AI, et al. Effects of initial seeding density and fluid perfusion rate on formation of tissue-engineered bone. Tissue Eng Part A. 2008;14(11):1809–20. doi: 10.1089/ten.tea.2007.0255. [DOI] [PMC free article] [PubMed] [Google Scholar]
- 2.Grayson WL, Frohlich M, Yeager K, Bhumiratana S, Chan ME, Cannizzaro C, et al. Engineering anatomically shaped human bone grafts. Proc Natl Acad Sci U S A. 2010;107(8):3299–304. doi: 10.1073/pnas.0905439106. [DOI] [PMC free article] [PubMed] [Google Scholar]
- 3.Sikavitsas VI, Bancroft GN, Holtorf HL, Jansen JA, Mikos AG. Mineralized matrix deposition by marrow stromal osteoblasts in 3D perfusion culture increases with increasing fluid shear forces. Proc Natl Acad Sci U S A. 2003;100(25):14683–8. doi: 10.1073/pnas.2434367100. [DOI] [PMC free article] [PubMed] [Google Scholar]
- 4.Sikavitsas VI, Bancroft GN, Lemoine JJ, Liebschner MA, Dauner M, Mikos AG. Flow perfusion enhances the calcified matrix deposition of marrow stromal cells in biodegradable nonwoven fiber mesh scaffolds. Ann Biomed Eng. 2005;33(1):63–70. doi: 10.1007/s10439-005-8963-x. [DOI] [PubMed] [Google Scholar]
- 5.Kanczler JM, Oreffo RO. Osteogenesis and angiogenesis: the potential for engineering bone. Eur Cell Mater. 2008;15:100–14. doi: 10.22203/ecm.v015a08. [DOI] [PubMed] [Google Scholar]
- 6.Deckers MM, van Bezooijen RL, van der Horst G, Hoogendam J, van Der Bent C, Papapoulos SE, et al. Bone morphogenetic proteins stimulate angiogenesis through osteoblast-derived vascular endothelial growth factor A. Endocrinology. 2002;143(4):1545–53. doi: 10.1210/endo.143.4.8719. [DOI] [PubMed] [Google Scholar]
- 7.Brandi ML, Collin-Osdoby P. Vascular biology and the skeleton. J Bone Miner Res. 2006;21(2):183–92. doi: 10.1359/JBMR.050917. [DOI] [PubMed] [Google Scholar]
- 8.Conway EM, Collen D, Carmeliet P. Molecular mechanisms of blood vessel growth. Cardiovasc Res. 2001;49(3):507–21. doi: 10.1016/s0008-6363(00)00281-9. [DOI] [PubMed] [Google Scholar]
- 9.Richardson TP, Peters MC, Ennett AB, Mooney DJ. Polymeric system for dual growth factor delivery. Nat Biotechnol. 2001;19(11):1029–34. doi: 10.1038/nbt1101-1029. [DOI] [PubMed] [Google Scholar]
- 10.Spiller KL, Vunjak-Novakovic G. Clinical translation of controlled protein delivery systems for tissue engineering. Drug Deliv and Transl Res. 2013 doi: 10.1007/s13346-013-0135-1. [DOI] [PMC free article] [PubMed] [Google Scholar]
- 11.Cao L, Mooney DJ. Spatiotemporal control over growth factor signaling for therapeutic neovascularization. Adv Drug Deliv Rev. 2007;59(13):1340–50. doi: 10.1016/j.addr.2007.08.012. [DOI] [PMC free article] [PubMed] [Google Scholar]
- 12.Hellberg C, Ostman A, Heldin CH. PDGF and vessel maturation. Recent Results Cancer Res. 2010;180:103–14. doi: 10.1007/978-3-540-78281-0_7. [DOI] [PubMed] [Google Scholar]
- 13.Yancopoulos GD, Davis S, Gale NW, Rudge JS, Wiegand SJ, Holash J. Vascular-specific growth factors and blood vessel formation. Nature. 2000;407(6801):242–8. doi: 10.1038/35025215. [DOI] [PubMed] [Google Scholar]
- 14.Mountziaris PM, Mikos AG. Modulation of the inflammatory response for enhanced bone tissue regeneration. Tissue Eng Part B Rev. 2008;14(2):179–86. doi: 10.1089/ten.teb.2008.0038. [DOI] [PMC free article] [PubMed] [Google Scholar]
- 15.Glass GE, Chan JK, Freidin A, Feldmann M, Horwood NJ, Nanchahal J. TNF-alpha promotes fracture repair by augmenting the recruitment and differentiation of muscle-derived stromal cells. Proc Natl Acad Sci U S A. 2011;108(4):1585–90. doi: 10.1073/pnas.1018501108. [DOI] [PMC free article] [PubMed] [Google Scholar]
- 16.Hashimoto J, Yoshikawa H, Takaoka K, Shimizu N, Masuhara K, Tsuda T, et al. Inhibitory effects of tumor necrosis factor alpha on fracture healing in rats. Bone. 1989;10(6):453–7. doi: 10.1016/8756-3282(89)90078-1. [DOI] [PubMed] [Google Scholar]
- 17.Schmidt-Bleek K, Schell H, Schulz N, Hoff P, Perka C, Buttgereit F, et al. Inflammatory phase of bone healing initiates the regenerative healing cascade. Cell Tissue Res. 2012;347(3):567–73. doi: 10.1007/s00441-011-1205-7. [DOI] [PubMed] [Google Scholar]
- 18.Mosser DM, Edwards JP. Exploring the full spectrum of macrophage activation. Nat Rev Immunol. 2008;8(12):958–69. doi: 10.1038/nri2448. [DOI] [PMC free article] [PubMed] [Google Scholar]
- 19.Arnold L, Henry A, Poron F, Baba-Amer Y, van Rooijen N, Plonquet A, et al. Inflammatory monocytes recruited after skeletal muscle injury switch into antiinflammatory macrophages to support myogenesis. J Exp Med. 2007;204(5):1057–69. doi: 10.1084/jem.20070075. [DOI] [PMC free article] [PubMed] [Google Scholar]
- 20.Troidl C, Jung G, Troidl K, Hoffmann J, Mollmann H, Nef H, et al. The temporal and spatial distribution of macrophage subpopulations during arteriogenesis. Curr Vasc Pharmacol. 2013;11(1):5–12. [PubMed] [Google Scholar]
- 21.Spiller KL, Anfang RR, Spiller KJ, Ng J, Nakazawa KR, Daulton JW, et al. The role of macrophage phenotype in vascularization of tissue engineering scaffolds. Biomaterials. 2014;35(15):4477–88. doi: 10.1016/j.biomaterials.2014.02.012. [DOI] [PMC free article] [PubMed] [Google Scholar]
- 22.Marolt D, Campos IM, Bhumiratana S, Koren A, Petridis P, Zhang G, et al. Engineering bone tissue from human embryonic stem cells. Proc Natl Acad Sci U S A. 2012;109(22):8705–9. doi: 10.1073/pnas.1201830109. [DOI] [PMC free article] [PubMed] [Google Scholar]
- 23.Marcos-Campos I, Marolt D, Petridis P, Bhumiratana S, Schmidt D, Vunjak-Novakovic G. Bone scaffold architecture modulates the development of mineralized bone matrix by human embryonic stem cells. Biomaterials. 2012;33(33):8329–42. doi: 10.1016/j.biomaterials.2012.08.013. [DOI] [PMC free article] [PubMed] [Google Scholar]
- 24.Weber PC, Ohlendorf DH, Wendoloski JJ, Salemme FR. Structural origins of high-affinity biotin binding to streptavidin. Science. 1989;243(4887):85–8. doi: 10.1126/science.2911722. [DOI] [PubMed] [Google Scholar]
- 25.Carano RA, Filvaroff EH. Angiogenesis and bone repair. Drug Discov Today. 2003;8(21):980–9. doi: 10.1016/s1359-6446(03)02866-6. [DOI] [PubMed] [Google Scholar]
- 26.Hausman MR, Rinker BD. Intractable wounds and infections: the role of impaired vascularity and advanced surgical methods for treatment. Am J Surg. 2004;187(5A):44S–55S. doi: 10.1016/S0002-9610(03)00304-0. [DOI] [PubMed] [Google Scholar]
- 27.Roh JD, Sawh-Martinez R, Brennan MP, Jay SM, Devine L, Rao DA, et al. Tissue-engineered vascular grafts transform into mature blood vessels via an inflammation-mediated process of vascular remodeling. Proc Natl Acad Sci U S A. 2010;107(10):4669–74. doi: 10.1073/pnas.0911465107. [DOI] [PMC free article] [PubMed] [Google Scholar]
- 28.Madden LR, Mortisen DJ, Sussman EM, Dupras SK, Fugate JA, Cuy JL, et al. Proangiogenic scaffolds as functional templates for cardiac tissue engineering. Proc Natl Acad Sci U S A. 2010;107(34):15211–6. doi: 10.1073/pnas.1006442107. [DOI] [PMC free article] [PubMed] [Google Scholar]
- 29.Brudno Y, Ennett-Shepard AB, Chen RR, Aizenberg M, Mooney DJ. Enhancing microvascular formation and vessel maturation through temporal control over multiple pro-angiogenic and pro-maturation factors. Biomaterials. 2013;34(36):9201–9. doi: 10.1016/j.biomaterials.2013.08.007. [DOI] [PMC free article] [PubMed] [Google Scholar]
- 30.Herbert SP, Stainier DY. Molecular control of endothelial cell behaviour during blood vessel morphogenesis. Nat Rev Mol Cell Biol. 2011;12(9):551–64. doi: 10.1038/nrm3176. [DOI] [PMC free article] [PubMed] [Google Scholar]
- 31.Anghelina M, Krishnan P, Moldovan L, Moldovan NI. Monocytes and macrophages form branched cell columns in matrigel: implications for a role in neovascularization. Stem Cells Dev. 2004;13(6):665–76. doi: 10.1089/scd.2004.13.665. [DOI] [PubMed] [Google Scholar]
- 32.Hibino N, Yi T, Duncan DR, Rathore A, Dean E, Naito Y, et al. A critical role for macrophages in neovessel formation and the development of stenosis in tissue-engineered vascular grafts. FASEB J. 2011;25(12):4253–63. doi: 10.1096/fj.11-186585. [DOI] [PMC free article] [PubMed] [Google Scholar]
- 33.Murray PJ, Wynn TA. Protective and pathogenic functions of macrophage subsets. Nat Rev Immunol. 2011;11(11):723–37. doi: 10.1038/nri3073. [DOI] [PMC free article] [PubMed] [Google Scholar]
- 34.Sindrilaru A, Peters T, Wieschalka S, Baican C, Baican A, Peter H, et al. An unrestrained proinflammatory M1 macrophage population induced by iron impairs wound healing in humans and mice. J Clin Invest. 2011;121(3):985–97. doi: 10.1172/JCI44490. [DOI] [PMC free article] [PubMed] [Google Scholar]
- 35.Wu L, Yu YL, Galiano RD, Roth SI, Mustoe TA. Macrophage colony-stimulating factor accelerates wound healing and upregulates TGF-beta1 mRNA levels through tissue macrophages. J Surg Res. 1997;72(2):162–9. doi: 10.1006/jsre.1997.5178. [DOI] [PubMed] [Google Scholar]
- 36.Mokarram N, Merchant A, Mukhatyar V, Patel G, Bellamkonda RV. Effect of modulating macrophage phenotype on peripheral nerve repair. Biomaterials. 2012;33(34):8793–801. doi: 10.1016/j.biomaterials.2012.08.050. [DOI] [PMC free article] [PubMed] [Google Scholar]
- 37.Kigerl KA, Gensel JC, Ankeny DP, Alexander JK, Donnelly DJ, Popovich PG. Identification of two distinct macrophage subsets with divergent effects causing either neurotoxicity or regeneration in the injured mouse spinal cord. J Neurosci. 2009;29(43):13435–44. doi: 10.1523/JNEUROSCI.3257-09.2009. [DOI] [PMC free article] [PubMed] [Google Scholar]
- 38.Champagne CM, Takebe J, Offenbacher S, Cooper LF. Macrophage cell lines produce osteoinductive signals that include bone morphogenetic protein-2. Bone. 2002;30(1):26–31. doi: 10.1016/s8756-3282(01)00638-x. [DOI] [PubMed] [Google Scholar]
- 39.Chehroudi B, Ghrebi S, Murakami H, Waterfield JD, Owen G, Brunette DM. Bone formation on rough, but not polished, subcutaneously implanted Ti surfaces is preceded by macrophage accumulation. J Biomed Mater Res A. 2010;93(2):724–37. doi: 10.1002/jbm.a.32587. [DOI] [PubMed] [Google Scholar]
- 40.Lumeng CN, DelProposto JB, Westcott DJ, Saltiel AR. Phenotypic switching of adipose tissue macrophages with obesity is generated by spatiotemporal differences in macrophage subtypes. Diabetes. 2008;57(12):3239–46. doi: 10.2337/db08-0872. [DOI] [PMC free article] [PubMed] [Google Scholar]
- 41.Ramachandran P, Pellicoro A, Vernon MA, Boulter L, Aucott RL, Ali A, et al. Differential Ly-6C expression identifies the recruited macrophage phenotype, which orchestrates the regression of murine liver fibrosis. Proc Natl Acad Sci U S A. 2012;109(46):E3186–95. doi: 10.1073/pnas.1119964109. [DOI] [PMC free article] [PubMed] [Google Scholar]
- 42.Sica A, Mantovani A. Macrophage plasticity and polarization: in vivo veritas. J Clin Invest. 2012;122(3):787–95. doi: 10.1172/JCI59643. [DOI] [PMC free article] [PubMed] [Google Scholar]
- 43.Lee S, Huen S, Nishio H, Nishio S, Lee HK, Choi BS, et al. Distinct macrophage phenotypes contribute to kidney injury and repair. J Am Soc Nephrol. 2011;22(2):317–26. doi: 10.1681/ASN.2009060615. [DOI] [PMC free article] [PubMed] [Google Scholar]
- 44.Pantano F, Berti P, Guida FM, Perrone G, Vincenzi B, Amato MM, et al. The role of macrophages polarization in predicting prognosis of radically resected gastric cancer patients. J Cell Mol Med. 2013;17(11):1415–21. doi: 10.1111/jcmm.12109. [DOI] [PMC free article] [PubMed] [Google Scholar]
- 45.Wolfs IM, Stoger JL, Goossens P, Pottgens C, Gijbels MJ, Wijnands E, et al. Reprogramming macrophages to an anti-inflammatory phenotype by helminth antigens reduces murine atherosclerosis. FASEB J. 2014;28(1):288–99. doi: 10.1096/fj.13-235911. [DOI] [PubMed] [Google Scholar]
- 46.Lumeng CN, Bodzin JL, Saltiel AR. Obesity induces a phenotypic switch in adipose tissue macrophage polarization. J Clin Invest. 2007;117(1):175–84. doi: 10.1172/JCI29881. [DOI] [PMC free article] [PubMed] [Google Scholar]
- 47.Anders HJ, Ryu M. Renal microenvironments and macrophage phenotypes determine progression or resolution of renal inflammation and fibrosis. Kidney Int. 2011;80(9):915–25. doi: 10.1038/ki.2011.217. [DOI] [PubMed] [Google Scholar]
- 48.Khallou-Laschet J, Varthaman A, Fornasa G, Compain C, Gaston AT, Clement M, et al. Macrophage plasticity in experimental atherosclerosis. PLoS One. 2010;5(1):e8852. doi: 10.1371/journal.pone.0008852. [DOI] [PMC free article] [PubMed] [Google Scholar]
- 49.Porcheray F, Viaud S, Rimaniol AC, Leone C, Samah B, Dereuddre-Bosquet N, et al. Macrophage activation switching: an asset for the resolution of inflammation. Clin Exp Immunol. 2005;142(3):481–9. doi: 10.1111/j.1365-2249.2005.02934.x. [DOI] [PMC free article] [PubMed] [Google Scholar]
- 50.Rao AJ, Gibon E, Ma T, Yao Z, Smith RL, Goodman SB. Revision joint replacement, wear particles, and macrophage polarization. Acta Biomater. 2012;8(7):2815–23. doi: 10.1016/j.actbio.2012.03.042. [DOI] [PMC free article] [PubMed] [Google Scholar]
- 51.Stout RD, Jiang C, Matta B, Tietzel I, Watkins SK, Suttles J. Macrophages sequentially change their functional phenotype in response to changes in microenvironmental influences. J Immunol. 2005;175(1):342–9. doi: 10.4049/jimmunol.175.1.342. [DOI] [PubMed] [Google Scholar]
- 52.Agrawal H, Tholpady SS, Capito AE, Drake DB, Katz AJ. Macrophage phenotypes correspond with remodeling outcomes of various acellular dermal matrices. Open Journal of Regenerative Medicine. 2012;1(3):51–9. [Google Scholar]
- 53.Jenkins SJ, Ruckerl D, Cook PC, Jones LH, Finkelman FD, van Rooijen N, et al. Local macrophage proliferation, rather than recruitment from the blood, is a signature of TH2 inflammation. Science. 2011;332(6035):1284–8. doi: 10.1126/science.1204351. [DOI] [PMC free article] [PubMed] [Google Scholar]
- 54.Urist MR. Bone: formation by autoinduction. Science. 1965;150(698):893–9. doi: 10.1126/science.150.3698.893. [DOI] [PubMed] [Google Scholar]
- 55.Grayson WL, Martens TP, Eng GM, Radisic M, Vunjak-Novakovic G. Biomimetic approach to tissue engineering. Semin Cell Dev Biol. 2009;20(6):665–73. doi: 10.1016/j.semcdb.2008.12.008. [DOI] [PMC free article] [PubMed] [Google Scholar]
- 56.Ahmed A, Bonner C, Desai TA. Bioadhesive microdevices with multiple reservoirs: a new platform for oral drug delivery. J Control Release. 2002;81(3):291–306. doi: 10.1016/s0168-3659(02)00074-3. [DOI] [PubMed] [Google Scholar]
- 57.Gref R, Couvreur P, Barratt G, Mysiakine E. Surface-engineered nanoparticles for multiple ligand coupling. Biomaterials. 2003;24(24):4529–37. doi: 10.1016/s0142-9612(03)00348-x. [DOI] [PubMed] [Google Scholar]
- 58.Qureshi MH, Wong SL. Design, production, and characterization of a monomeric streptavidin and its application for affinity purification of biotinylated proteins. Protein Expr Purif. 2002;25(3):409–15. doi: 10.1016/s1046-5928(02)00021-9. [DOI] [PubMed] [Google Scholar]
- 59.Green NM. Thermodynamics of the binding of biotin and some analogues by avidin. Biochem J. 1966;101(3):774–80. doi: 10.1042/bj1010774. [DOI] [PMC free article] [PubMed] [Google Scholar]
- 60.Wang NX, von Recum HA. Affinity-based drug delivery. Macromol Biosci. 2011;11(3):321–32. doi: 10.1002/mabi.201000206. [DOI] [PubMed] [Google Scholar]
- 61.Lin CC, Metters AT. Hydrogels in controlled release formulations: network design and mathematical modeling. Adv Drug Deliv Rev. 2006;58(12–13):1379–408. doi: 10.1016/j.addr.2006.09.004. [DOI] [PubMed] [Google Scholar]
- 62.Bayer EA, Wilchek M. Application of avidin-biotin technology to affinity-based separations. J Chromatogr. 1990;510:3–11. doi: 10.1016/s0021-9673(01)93733-1. [DOI] [PubMed] [Google Scholar]
- 63.Albright JG, Annunziata O, Miller DG, Paduano L, Pearlstein AJ. Precision Measurements of Binary and Multicomponent Diffusion Coefficients in Protein Solutions Relevant to Crystal Growth: Lysozyme Chloride in Water and Aqueous NaCl at pH 4.5 and 25 °C. J Am Chem Soc. 1999;121(14):3256–66. [Google Scholar]
- 64.Xiong MP, Forrest ML, Karls AL, Kwon GS. Biotin-triggered release of poly(ethylene glycol)-avidin from biotinylated polyethylenimine enhances in vitro gene expression. Bioconjug Chem. 2007;18(3):746–53. doi: 10.1021/bc0602883. [DOI] [PubMed] [Google Scholar]
- 65.Hofmann K, Titus G, Montibeller JA, Finn FM. Avidin binding of carboxyl-substituted biotin and analogues. Biochemistry. 1982;21(5):978–84. doi: 10.1021/bi00534a024. [DOI] [PubMed] [Google Scholar]
- 66.Kaiser K, Marek M, Haselgrubler T, Schindler H, Gruber HJ. Basic studies on heterobifunctional biotin-PEG conjugates with a 3-(4-pyridyldithio)propionyl marker on the second terminus. Bioconjug Chem. 1997;8(4):545–51. doi: 10.1021/bc970086u. [DOI] [PubMed] [Google Scholar]
- 67.Finn FM, Hofmann KH. Synthesis of biotinyl derivatives of peptide hormones and other biological materials. Methods in Enzymology. 1985;109:418–46. [Google Scholar]
- 68.Maheshwari RK, Srikantan V, Bhartiya D, Kleinman HK, Grant DS. Differential effects of interferon gamma and alpha on in vitro model of angiogenesis. J Cell Physiol. 1991;146(1):164–9. doi: 10.1002/jcp.1041460121. [DOI] [PubMed] [Google Scholar]
- 69.Sato N, Nariuchi H, Tsuruoka N, Nishihara T, Beitz JG, Calabresi P, et al. Actions of TNF and IFN-gamma on angiogenesis in vitro. J Invest Dermatol. 1990;95(6 Suppl):85S–9S. doi: 10.1111/1523-1747.ep12874809. [DOI] [PubMed] [Google Scholar]
- 70.Sussman EM, Halpin MC, Muster J, Moon RT, Ratner BD. Porous implants modulate healing and induce shifts in local macrophage polarization in the foreign body reaction. Ann Biomed Eng. 2014;42(7):1508–16. doi: 10.1007/s10439-013-0933-0. [DOI] [PubMed] [Google Scholar]
- 71.Bota PC, Collie AM, Puolakkainen P, Vernon RB, Sage EH, Ratner BD, et al. Biomaterial topography alters healing in vivo and monocyte/macrophage activation in vitro. J Biomed Mater Res A. 2010;95(2):649–57. doi: 10.1002/jbm.a.32893. [DOI] [PMC free article] [PubMed] [Google Scholar]
- 72.Tolg C, Hamilton SR, Zalinska E, McCulloch L, Amin R, Akentieva N, et al. A RHAMM mimetic peptide blocks hyaluronan signaling and reduces inflammation and fibrogenesis in excisional skin wounds. Am J Pathol. 2012;181(4):1250–70. doi: 10.1016/j.ajpath.2012.06.036. [DOI] [PMC free article] [PubMed] [Google Scholar]
- 73.Tous E, Weber HM, Lee MH, Koomalsingh KJ, Shuto T, Kondo N, et al. Tunable hydrogel-microsphere composites that modulate local inflammation and collagen bulking. Acta Biomater. 2012;8(9):3218–27. doi: 10.1016/j.actbio.2012.05.027. [DOI] [PMC free article] [PubMed] [Google Scholar]
Associated Data
This section collects any data citations, data availability statements, or supplementary materials included in this article.
Supplementary Materials
Figure S1: Amount of biotin bound to each scaffold. Data are shown as a function of the molar excess that was added, determined using the HABA/avidin binding assay.
Figure S2: Quantitation of macrophage staining. (a) Percentage of the population staining positively for CCR7 or CD206. (b) mean fluorescent intensity per cell of CCR7 and CD206, determined using flow cytometry.
Figure S3: Numbers of viable cells. Data are shown as a function of time, and normalized to the starting numbers. Cells were counted using trypan blue exclusion.
Figure S4: Total proteins secreted into the media. Data are normalized to the number of viable cells at each time point.
Figure S5: Cumulative release of IFN-gamma and IL4. Data are shown for IFNg, IL4, and Combo scaffolds. The release profiles of IFN-gamma or IL4 from the Combo scaffolds were not different from the control IFNg and IL4 scaffolds.
Figure S6: In vivo studies. Immunohistochemical staining for IL4 on scaffolds that were implanted subcutaneously in mice for 2 weeks.