Abstract
The tetraethylammonium salt of the transition metal complex (FeCl4−) has been examined using inelastic x-ray scattering (IXS) with 1.5 meV resolution (12 cm−1) at 21.747 keV. This sample serves as a feasibility test for more complex transition metal complexes. The IXS spectra were compared with previously recorded infrared, Raman, and NRVS spectra, revealing the same normal modes but with less strict selection rules. Calculations with a previously derived Urey Bradley force field were used to simulate the expected Q and orientation dependence of the IXS intensities. The relative merits of IXS, as compared to other photon based vibrational spectroscopies such as NRVS, Raman, and IR are discussed.
Keywords: inelastic x-ray scattering, IXS, synchrotron radiation, normal modes, vibrational spectroscopy
Vibrational spectroscopy is one of the most fundamental tools for inorganic chemistry. The standard techniques, IR and Raman spectroscopy, are powerful probes of structure and dynamics, and they complement each other with different se lection rules 1. Particle scattering methods such as inelastic neutron scattering (INS) and high resolution electron energy loss (HREELS) also have their merits, but have respective requirements for multi gram samples or an ultra high vacuum environment. One synchrotron based technique, nuclear reso nant vibrational spectroscopy (NRVS), has shown great poten tial for characterization of materials and metalloproteins 2, but it can only be applied to isotopes such as 57Fe with appropriate excited state energies and lifetimes. A second synchrotron based technique, resonant inelastic x-ray scattering (RIXS), has been used to observe well spaced molecular vibrations in samples such as O23a, but at the moment is limited to several hundred cm−1 resolution 3b. Here we employ a third synchro tron method, inelastic x-ray scattering (IXS) 4. IXS has pre viously been applied to pure elements such as carbon in dia mond or graphite 5, binary solid state compounds such as MgB2, MgO, and SiC 6, complex superconductors 4c, liquids as diverse as water or 3He 7, and even DNA and proteins 8, but never to a metal coordination complex.
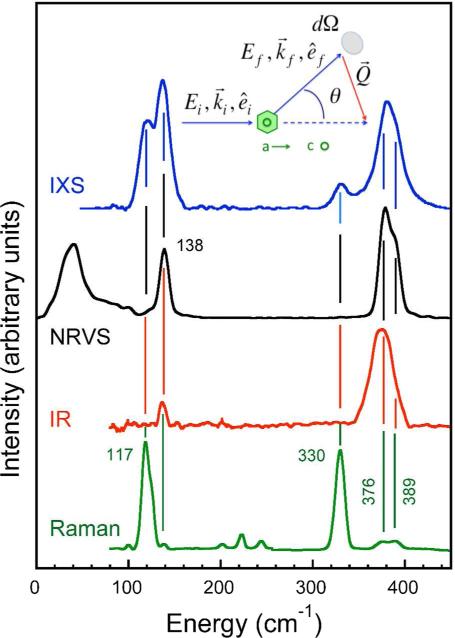
IXS differs fundamentally from IR, Raman, and RIXS in that it depends on an A2 term in the Hamiltonian for the inter-action of radiation with matter, as opposed to the p A terms relevant to the other methods (where A is the vector potential and p is momentum) 9. Whereas x-ray diffraction Bragg peaks derive from coherent elastic scattering of x-rays, IXS derives from the coherent inelastic scattering of x rays by phonons in a sample. In fact, much of the thermal diffuse scattering (TDS) seen between diffraction peaks is part of the IXS signal, but in a TDS measurement there is no attempt to energy re solve that scattering. Thanks to developments in synchrotron radiation sources and x-ray optics, IXS experiments can re solve scattered radiation with an energy resolution of ~1 meV (8 cm−1). As a test of the feasibility and relevance of this technique for inorganic coordination chemistry, we recorded the IXS for a crystal of a tetrahedral Fe complex: (NEt4)(FeCl4). Despite the small cross section and competition with photoab sorption, we were able to record excellent spectra using an established spectrometer 4c,10. A representative spectrum (acquired in 24 hours) is compared with previously recorded NRVS, Raman, and IR data in Figure 1; experimental details are provided in Supporting Information.
Figure 1.
Comparison of IXS for NEt4(FeCl4) vs. other methods. Top to bottom: IXS for crystal with beam along a-axis and c-axis perpendicular to the horizontal scattering plane; θ=27° ( ), 57Fe NRVS PVDOS (
 ) 11, FT-IR (
 ), and Raman (
 ). Inset: definition of scattering angle θ and other quantities.
For an isolated transition metal complex in tetrahedral Td symmetry, there are 4 types of normal modes: A1 and T2 stretching motions, along with T2 and E and bending modes. The selection rule advantage of IXS for seeing these modes, compared to other methods, is clearly visible in Figure 1, where all 4 of the expected bands are clearly visible. This is in sharp contrast to the IR, NRVS, and Raman spectra, which are each most sensitive to only 2 out of the 4 main features. For example, the bands at 119 and 137 cm−1 can be attributed to the E and T2 bend modes respectively 11. The former is strong in the Raman while the latter is more visible in the IR and NRVS, but both bands are strong in the IXS. At higher energies, the bands at 330 and 380 cm−1 correspond to the totally symmetric A1 stretching mode and the T2 asymmetric stretch. As before, the first band is strong in the Raman while the second is mostly visible by IR or NRVS, but both modes are distinct in the IXS.
A closer look reveals that the FeCl4− asymmetric stretching mode near 380 cm−1 is split. This is clearest in the Raman spectrum, where bands at 376 and 389 cm−1 are resolved. In the room temperature crystal structure, the symmetry of the Fe-Cl4− ion is better described as C3v, with 3 shorter Fe-Cl bonds at 2.177 Å and 1 longer Fe-Cl bond at 2.186 Å. Descent in symmetry from Td to C3v splits the T2 modes into E and A1 modes. This splitting is suggested in the IXS, since the line width of the A1 region is 12-14 cm−1 FWHM (essentially the beamline resolution), while for the T2 region it is ~30 cm−1.
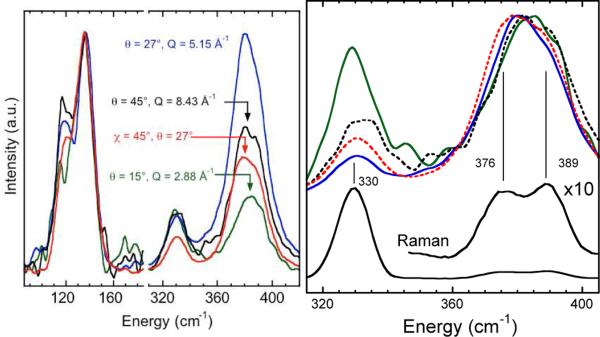
The IXS data in Figure 1 come from just one crystal orientation and scattering angle θ. One of the strengths of this technique is that particular normal modes can be enhanced by variation of both settings. To illustrate the value of Q-dependent and orientation-dependent IXS for highlighting particular normal modes, we present spectra obtained for different condi tions in Figure 2. (At χ=0 the crystal c-axis was vertical and the beam was along the a-axis. At χ=45° the c-axis was rotat ed to make a 45° degree angle with the beam. The additional curves each took 12 hours.)
Figure 2.
IXS for various Q and crystal orientations. Left: Spectra for (χ, at (0°, 15°) ( ), (0°, 27°) (
 ), (0°, 45°) (
 ), and (45°, 27°) (
 ). Right: stretching mode region comparison with Raman spectrum. (All curves normalized to maximum peak height.)
From the data shown in Figure 2, it is clear that there is a strong Q-dependence to the relative intensities of IXS bands. For example, for θ=15° the stretching bands are ~3-fold weaker than the bending modes, while for θ=27° the T2 stretch and T2 bend are of comparable intensity. There are also wide variations within the stretching region. As shown better in Figure 2 (right), for θ=15° the A1 stretch intensity is 82% of the T2 intensity, while for θ=27° it is reduced to 24%. Finally, there are also significant variations in relative intensities for a fixed scattering angle. For example, at θ=27°, rotation of the crystal by 45° about the a-axis yields the spectrum with the weakest A1 band.
With a known crystal structure and force field, all of the observed changes are in principle calculable from the well-developed theory behind IXS. This theory has been extensively reviewed elsewhere 4a,12, so before discussing the representative calculated spectra, we merely summarize the key factors that govern IXS intensities. With initial photon energy Ei and final energy Ef, the phonon energy is given by: . As defined in Figure 1, where , and are the initial and final photon wavevectors and polarizations respectively, and for scattering angle θ the momentum transfer is . The single phonon cross-section for scattering, ∂2σ/∂Ω∂E, is proportional to – the ‘dynamical structure factor’. Along with terms accounting for phonon population and polarization effects, is in turn proportional to the ‘inelastic structure factor’, , which involves a summation over all the atoms in the primitive cell, and thus for a particular phonon mode 4a,4c, 12:
In the above expression, atom m with mass Mm is located at and has x-ray form factor fm(Q) and Debye-Waller factor exp(-wm). The term is the phonon polarization eigen-vector for the direction of motion of atom m in phonon mode n with wavevector . Since as Q→0, fm(Q)→Z, at small angles the strength of scattering from a particular atom in a sample will vary approximately as Z2. The overall signal strength depends on the product of three terms: fm(Q), Q2, and a polarization factor that goes as cos2θ. In practice, this product maximizes at Q ≅ 10 Å−1 for many elements.
The product , the projection of the phonon polarization onto the total momentum transfer vector , plays a critical role in the observed intensities. Thus the intensities of the IXS signal can be directly related to the motions of particular atoms in a given normal mode 4a,12 projected onto . Since one can choose different by controlling the scattering geometry, IXS can be made more sensitive to particular phonons in a sample. This means that IXS has the flexibility to see all of the normal modes for a transition metal coordination complex. The appearance of the sum inside the magnitude signs means that the intensity is sensitive to the relative phase of the motions within one primitive cell.
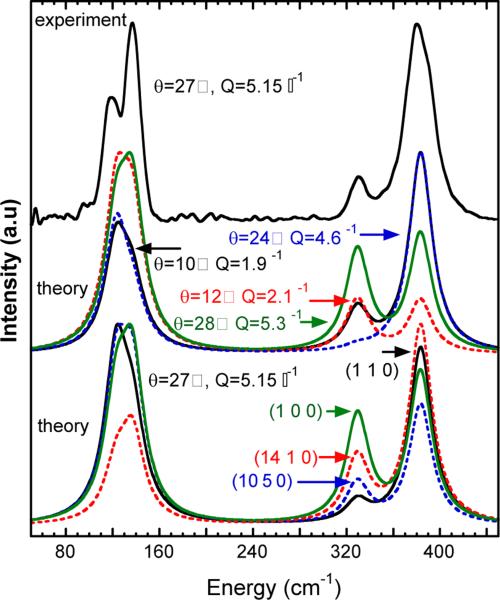
The strength of geometry-dependent IXS for highlighting specific normal modes is illustrated in Figure 3. As examples, we show the Q-dependence for an incident beam along the crystal a-axis (with c-axis vertical and a horizontal scattering plane) and the IXS for different crystal orientations at fixed Q.
Figure 3.
Comparison of experiment and theory for IXS. Top: data for χ=0° and θ=27°. Middle: calculated IXS for χ=0° and different momentum transfers – θ=10° ( ), 12° (
 ), 24° (
 ), and 28° (
 ). Bottom: IXS at θ=27° for beam along crystal orientations (1 1 0) (
 ), (14 1 0) (
 ), (10 5 0) (
 ), and (1 0 0) (
 ).
).
One striking result from these simulations is the extreme variability in intensity of the totally symmetric A1 stretching mode at 330 cm−1. Within the range of θ from 24 to 28°, the strength of this mode varies from almost as strong as the T2 mode to nearly invisible. A similar variability in relative in tensities is observed for different crystal orientations at a fixed scattering angle. From a practical point of view, this ability to enhance or diminish particular normal modes should assist the detailed assignment of vibrational features in complex spectra.
In summary, the current results show that high quality IXS spectra can be obtained for a transition metal complex in a few hours at a third generation synchrotron radiation source. IXS intensities are amenable to straightforward calculation from a given structure and force field, with none of the complexities involved in the calculation of IR or Raman spectra. Compared to NRVS, IXS has the advantage of applicability to any element in the periodic table, and compared to INS, IXS requires orders of magnitude less material. The Q-dependence allows one to enhance the visibility of particular normal modes. There is also a benefit from orientation dependence of single crystal spectra, but it has been shown by others that powder spectra are also informative.12b Although it has limitations as a bulk-sensitive technique, there should be many applications in co-ordination chemistry where selection rules or other constraints preclude the use of more conventional vibrational methods, and where IXS will shine as a technique that allows any de-sired normal mode to be observed.
Supplementary Material
ACKNOWLEDGMENTS
This work was funded by NIH grants GM-65440 (SPC) and the DOE Office of Biological and Environmental Research (SPC). Use of SPring 8 is supported by JASRI.
Footnotes
Supporting Information. Experimental details for sample prepa ration; crystallographic results concerning phase transformations at different temperatures. This material is available free of charge via the Internet at http://pubs.acs.org.
REFERENCES
- 1.a Nakamoto K. Infrared & Raman Spectra of Inorganic & Coordination Compounds. 5th ed. Wiley-Interscience; New York: 1997. [Google Scholar]; b Squires GL. Introduction to the Theory of Thermal Neutron Scattering. Dover; New York: 1978. [Google Scholar]; c Richardson NV. Curr. Opin. Solid State Mat. Sci. 1997;2:517–524. [Google Scholar]; d Seto M, Yoda Y, Kikuta S, Zhang XW, Ando M. Phys. Rev. Lett. 1995;74:3828–3831. doi: 10.1103/PhysRevLett.74.3828. [DOI] [PubMed] [Google Scholar]
- 2.a Alp E, Sturhahn W, Toellner TS, Zhao J, Hu M, Brown DE. Hyp. Interact. 2002;144/145:3–20. [Google Scholar]; b Sturhahn W. J. Phys. Cond. Matt. 2004;16:S497–S530. [Google Scholar]
- 3.a Hennies F, Pietzsch A, Berglund M, Fohlisch A, Schmitt T, Strocov V, Karlsson HO, Andersson J, Rubensson JE. Phys. Rev. Lett. 2010;104:193002–193005. doi: 10.1103/PhysRevLett.104.193002. [DOI] [PubMed] [Google Scholar]; b van Schooneveld MM, Gosselink RW, Eggenhuisen TM, Al Samarai M, Monney C, Zhou KJ, Schmitt T, de Groot FMF. Ang. Chem. 2013;1170:3828–3831. doi: 10.1002/anie.201204855. [DOI] [PMC free article] [PubMed] [Google Scholar]
- 4.a Burkel E. J. Phys. Cond. Matt. 2001;13:7627–7644. [Google Scholar]; b Krisch M, Sette F. Light Scattering in Solids IX. Vol. 108. Springer Verlag; Berlin: 2007. pp. 317–369. [Google Scholar]; c Baron AQR. J. Spect. Soc. Japan. 2009;58:205–214. (Japanese) arXiv 0910.5764 (English) [Google Scholar]
- 5.a Kulda J, Kainzmaier H, Strauch D, Dorner B, Lorenzen M, Krisch M. Phys. Rev. B. 2002;66:241202. [Google Scholar]; b Maultzsch J, Reich S, Thomsen C, Requardt H, Ordejón P. Phys. Rev. Lett. 2004;92:075501. doi: 10.1103/PhysRevLett.92.075501. [DOI] [PubMed] [Google Scholar]
- 6.a Baron AQR, Uchiyama H, Tanaka Y, Tsutsui S, Ishikawa D, Lee S, Heid R, Bohnen KP, Tajima S, Ishikawa T. Phys. Rev. Lett. 2004;92:197004. doi: 10.1103/PhysRevLett.92.197004. [DOI] [PubMed] [Google Scholar]; b Fukui H, Katsura T, Kuribayashi T, Matsuzaki T, Yoneda A, Ito E, Kudoh Y, Tsutsui S, Baron AQR. J. Synchrot. Radiat. 2008;15:618–623. doi: 10.1107/S0909049508023248. [DOI] [PubMed] [Google Scholar]; c Strauch D, Dorner B, Ivanov A, Krisch M, Serrano J, Bosak A, Choyke WJ, Stojetz B, Malorny M. Mater. Sci. Forum. 2006;527-529:689–694694. [Google Scholar]
- 7.a Sette F, Ruocco G, Krisch M, Bergmann U. Phys. Rev. Lett. 1995;75:850–853. doi: 10.1103/PhysRevLett.75.850. [DOI] [PubMed] [Google Scholar]; b Seyfert C, Simmons RO, Sinn H, Arms DA, Burkel E. J. Phys. Condens. Matter. 1999;11:3501. [Google Scholar]
- 8.a Liu Y, Chen SH, Berti D, Baglioni P, Alatas A, Sinn H, Alp E, Said A. J. Chem. Phys. 2005;123:2235–2245. doi: 10.1063/1.2128702. [DOI] [PubMed] [Google Scholar]; b Liu D, Chu XQ, Lagi M, Zhang Y, Fratini E, Baglioni P, Alatas A, Said A, Alp E, Chen SH. Phys. Rev. Lett. 2008;101:135501. doi: 10.1103/PhysRevLett.101.135501. [DOI] [PubMed] [Google Scholar]
- 9.Baron AQR, Uchiyama H, Tsutsui S, Tanaka Y, Ishikawa D, Sutter JP, Lee S, Tajima S, Heid R, Bohnen KP. Physica C. 2007;456:83–91. doi: 10.1103/PhysRevLett.92.197004. [DOI] [PubMed] [Google Scholar]
- 10.Baron AQR, Tanaka Y, Goto S, Takeshita K, Matsushita T, Ishikawa TJ. Phys. Chem. Sol. 2000;61:461–465. [Google Scholar]
- 11.Smith MC, Xiao Y, Wang H, George SJ, Coucovanis D, Koutmos M, Sturhahn W, Alp EE, Zhao J, Cramer SP. Inorg. Chem. 2005;44:5562–5570. doi: 10.1021/ic0482584. [DOI] [PubMed] [Google Scholar]
- 12.a Burkel E. Rep. Prog. Phys. 2000;63:171–232. [Google Scholar]; b Sinha SK. J. Phys. Cond. Matt. 2001;13:7511–7523. [Google Scholar]; Fischer I, Bosak A, Krisch M. Phys. Rev. B. 2009;79:134302. [Google Scholar]
Associated Data
This section collects any data citations, data availability statements, or supplementary materials included in this article.


