This exploratory MR imaging, CT, and PET study demonstrated a progressive pattern of bone remodeling after MR imaging–guided high-intensity focused ultrasound ablation.
Abstract
Purpose
To serially monitor bone remodeling in the swine femur after magnetic resonance (MR) imaging–guided high-intensity focused ultrasound (HIFU) ablation with MR imaging, computed tomography (CT), sodium fluorine 18 (Na18F)–positron emission tomography (PET), and histopathologic examination, as a function of sonication energy.
Materials and Methods
Experimental procedures received approval from the local institutional animal care and use committee. MR imaging–guided HIFU was used to create distal and proximal ablations in the right femurs of eight pigs. The energy used at the distal target was higher (mean, 419 J; range, 390–440 J) than that used at the proximal target (mean, 324 J; range, 300–360 J). Imaging was performed before and after ablation with 3.0-T MR imaging and 64-section CT. Animals were reevaluated at 3 and 6 weeks with MR imaging (n = 8), CT (n = 8), Na18F-PET (n = 4), and histopathologic examination (n = 4). Three-dimensional ablation lengths were measured on contrast material–enhanced MR images, and bone remodeling in the cortex was measured on CT images.
Results
Ablation sizes at MR imaging 3 and 6 weeks after MR imaging–guided HIFU ablation were similar between proximal (low-energy) and distal (high-energy) lesions (average, 8.7 × 21.9 × 16.4 mm). However, distal ablation lesions (n = 8) demonstrated evidence of subperiosteal new bone formation at CT, with a subtle focus of new ossification at 3 weeks and a larger focus of ossification at 6 weeks. New bone formation was associated with increased uptake at Na18F-PET in three of four animals; this was confirmed at histopathologic examination in four of four animals.
Conclusion
MR imaging–guided HIFU ablation of bone may result in progressive remodeling, with both subcortical necrosis and subperiosteal new bone formation. This may be related to the use of high energies. MR imaging, CT, and PET are suitable noninvasive techniques to monitor bone remodeling after MR imaging–guided HIFU ablation.
© RSNA, 2014
Introduction
The advent of magnetic resonance (MR) imaging–guided high-intensity focused ultrasound (HIFU) ablation has signaled a potential paradigm shift in the treatment of focal bone lesions. This completely noninvasive technology can be used to focally deposit energy along the margins of bone, with minimal damage to surrounding tissues (1–3). MR imaging–guided HIFU ablation has already been shown to be effective for palliation of painful bone metastases, treatment of osteoid osteomas, and possibly even for treatment of primary bone malignancies (4–7).
Both experimental and clinical studies of MR imaging–guided HIFU ablation for bone lesions have demonstrated remodeling of bone in the weeks to months after ablation, in some instances with apparent new bone growth (2,4). Remodeling has been reported both in patients treated for bone metastases (4) and in a preclinical porcine study (2). However, it is not clear why chronic bone remodeling is seen only in a subset of patients treated with MR imaging–guided HIFU ablation.
Our purpose was to serially monitor bone remodeling in the swine femur after MR imaging–guided HIFU ablation with MR imaging, computed tomography (CT), sodium fluorine 18 (Na18F)–positron emission tomography (PET), and histopathologic examination, as a function of sonication energy. Our hypothesis was that the differences in energy dose and temperature increase affect the long-term remodeling of bone after MR imaging–guided HIFU ablation.
Materials and Methods
The procedures of HIFU ablation have been previously reported (8) and are summarized here. The eight animals in that study were also used in this longer-term study.
MR Imaging–guided HIFU Ablation Procedure
Experimental procedures received approval from the local institutional animal care and use committee. Eight female farm pigs were anesthetized with standard techniques, as previously described (8). An MR imaging–guided HIFU ablation system (ExAblate2000; Insightec, Haifa, Israel) with a phased-array transducer of 208 elements embedded in an MR unit table was used to create two ovoid bone ablations in the proximal and distal portions of the metadiaphysis of the right femur of each of the eight pigs. Initially, each pig was placed onto the MR table in the right lateral decubitus position, inside a shallow bath filled with degassed water. A three-plane localizer image set was used to verify adequate positioning. The skin surface and cortical surface of the bone were manually segmented (V.R., Technical Director of MR Imaging–guided HIFU, 13 years of experience with focused ultrasound ablation). The ablations were separated by approximately 1.5 cm of craniocaudal distance. Each focal spot sonication used to create the ablations lasted 20 seconds and was performed at a frequency of 1.05 MHz, with a subsequent cooling duration of 25 seconds. The average energy for the focal spots to create ablations ranged from 300 to 360 J for proximal ablations and from 390 to 440 J for distal ablations (Table 1). We chose not to vary the locations of the higher- and lower-energy ablations to preserve statistical power among the small number of animals studied (ie, if location was varied in addition to variance in follow-up and sonication energy, only two of each specific type of ablation could be created). Acoustic power was used to vary energy dose, with a goal of creating a 7°–10°C difference in the adjacent soft tissues between the proximal (desired temperature increase to 60°C) and distal (desired temperature increase to 67°–70°C) ablations, in an attempt to find a minimum difference in temperature that might alter patterns of chronic remodeling. Energies were selected to achieve this difference on the basis of the pattern of heating with low-energy test sonications.
Table 1.
Average Sonication Energy and Local Temperature at MR Imaging–guided HIFU

Note.—Data are averages, with ranges in parentheses. These data were previously reported (8).
Procedural MR Imaging
A two-dimensional fast gradient-echo localizer sequence (field of view [FOV]/section thickness/repetition time [TR]/echo time [TE]/flip angle/matrix/bandwidth [BW] = 44 cm/7 mm/5.1 msec/1.5 msec/30°/256 × 128/29 kHz) was used to obtain three plane images of both femurs. The following sequences were performed at baseline: a two-dimensional T2-weighted fast spin-echo (FSE) sequence (FOV/section thickness/TR/TE/echo train length/flip angle/matrix/BW = 36 cm/7 mm/3500 msec/83 msec/12/90°/256 × 224/10.4 kHz), a T1-weighted FSE sequence (FOV/section thickness/TR/TE/echo train length/flip angle/matrix/BW = 36 cm/7 mm/583 msec/6.6 msec/five/90°/320 × 192/39 kHz), and a three-dimensional spoiled gradient-echo sequence (FOV/section thickness/TR/TE/flip angle = 44 × 44 cm/3.8 mm/4.3 msec/2 msec/15°), for treatment planning. After baseline imaging, the MR imaging–guided HIFU treatment was performed.
While focused ultrasound heating of bone tends to radiate quickly to adjacent bone, in contrast to soft-tissue heating isolated to a focal spot, we used the temperature increase in soft tissue as a proxy for heat radiating from the highly absorptive bone. Increases in temperature were monitored by using real-time MR thermometry (the proton resonant frequency shift method) in the soft tissues adjacent to the targeted bone (9). MR thermometry was performed during each sonication with multiphase, multisection echo-planar imaging (FOV/section thickness/TR/TE/flip angle/echo train length/matrix/BW = 28 cm/3.6 mm/210 msec/18.3 msec/35°/12/144 × 144/35 kHz). Two-dimensional T2-weighted FSE, T1-weighted FSE, and three-dimensional spoiled gradient-echo sequences were then repeated after the procedure. Next, saturation-recovery first-pass perfusion gradient-echo images (FOV/section thickness/TR/TE/flip angle/matrix/BW = 36 cm/3.8 mm/4.3 msec/2.1 msec/15°/300 × 192/36 kHz) were acquired during the injection of 0.15 mmol gadopentetate dimeglumine per kilogram of body weight. After the perfusion sequence, T1-weighted FSE and three-dimensional spoiled gradient-echo dynamic contrast material–enhanced sequences were performed serially over the course of 15 minutes to monitor the kinetics of the contrast medium. Quantitative data were acquired 10 minutes after contrast medium administration, when the lesions were well seen.
Postprocedure CT
CT was performed after MR imaging with a 64-section multidetector CT scanner (LightSpeed Ultra; GE Healthcare, Waukesha, Wis). Nonenhanced CT images were first obtained, followed by the administration of iodinated CT contrast material (2 mL/kg, 350 mg/mL iohexol, Omnipaque; GE Healthcare, Princeton, NJ). Contrast-enhanced images were obtained 3–5 minutes later. Imaging parameters were as follows: tube voltage, 120 kVp; tube current, 650 mAs per section; reconstructed section thickness, 4 mm; and spatial resolution, 0.625 × 0.625 × 0.625 mm.
Postprocedure Monitoring
After the procedure, the animals were allowed to recover and were treated prophylactically with buprenorphine (twice daily for 3 days) and carprofen (once daily for 5 days). The skin site in the acoustic window where the transducer was applied was examined carefully and periodically for skin burns during the recovery from anesthesia. Additionally, leg movement was carefully monitored for 3 weeks (n = 4) or 6 weeks (n = 4). A movement score (from 0 to 3) was determined, as previously described by Kopelman et al (2) as follows: a movement score of 0 was assigned to animals that rose immediately from recumbence and moved freely, with weight evenly balanced on all four limbs; a movement score of 1, to animals that rose immediately but occasionally demonstrated a reluctant movement or uneven distribution of weight with respect to the treated limb; a movement score of 2, to animals that moved slowly with short steps, with extended periods of time with reduced weight on the treated limb or non–weight bearing on the treated limb; and a movement score of 3, to animals that refused to move from the ground.
Follow-up Imaging
After 3 (n = 4) or 6 weeks (n = 4), animals underwent follow-up MR imaging, which was performed in an identical manner to the immediate postprocedural imaging. Two of the animals studied at 3 weeks and two of the animals studied at 6 weeks were also imaged with Na18F-PET/CT performed by using a GE Discovery VCT PET/CT scanner. Pre- and postcontrast CT images were obtained in an identical manner to the immediate postprocedural imaging. Immediately after the CT examination, 5 mCi (185 MBq) Na18F was injected. A dynamic emission Na18F-PET scan was then acquired over 60 minutes. The PET images were reconstructed with an iterative algorithm, with measured CT for attenuation correction, by using software provided by the equipment manufacturer. Because of concerns about laboratory contamination by animal radioactivity or, alternatively, osteoblast lysis during a freeze-thaw cycle during specimen preparation, these four animals were not subjected to histopathologic examination. In the remaining four animals, follow-up CT images were obtained at 3 weeks (n = 2) or at 6 weeks (n = 2), and these animals had specimens dissected for histopathologic analysis.
Follow-up Image Analysis
The qualitative appearance of the treated limbs at MR imaging, CT, and Na18F-PET was compared with that of each untreated contralateral limb at 3 or 6 weeks. MR and CT images were reviewed in consensus by two musculoskeletal radiologists (M.D.B., with 5 years of experience, and T.M.L., with more than 20 years of experience). PET images were reviewed in consensus by two radiologists (M.D.B. and R.A.H. [a nuclear radiologist with more than 20 years of experience]) and a nuclear physicist (Y.S., with 10 years of experience in nuclear imaging). At MR imaging, the images were evaluated for the presence of edema (as suggested by focal T2 hyperintensity), bone marrow or cortical damage (as suggested by morphologic irregularity, hypointensity, or hyperintensity on T1-weighted images at the bone–soft-tissue interface), first-pass perfusion abnormalities (as suggested by abnormal enhancement or signal intensity on the perfusion MR images), and focal necrosis and/or abnormalities in local vascularity (as suggested by focal hypo- or hyperenhancement at postcontrast imaging). At CT, the images were evaluated for the presence of endosteal sclerosis and/or lucency and the presence of new bone density at the cortical margin in the region of the MR imaging–guided HIFU treatments. Similarly, the qualitative appearance of Na18F-PET images in the four animals imaged with PET was compared with that of each untreated contralateral limb with regard to visual discrepancy in uptake between the two sides.
Maximum three-plane dimensions of the hypoenhanced ablations (as seen on 10-minute postcontrast three-dimensional LAVA images) both immediately after MR imaging–guided HIFU ablation and then again at either 3- or 6-week follow-up were measured at a picture archiving and communication system workstation (Impax 5; AGFA Healthcare, Greenville, SC). Ablation volumes at 3 and 6 weeks were also calculated, with the ablation shape approximated as an ellipsoid, where volume = (π/6) × transverse × craniocaudal × anteroposterior dimensions. At baseline, the ablations were not seen at CT, so only at follow-up were the maximum three-plane dimensions of endosteal sclerosis or lucency and/or new bone density at the cortical margin calculated. Similarly, only at follow-up, in the animals that underwent PET imaging, was the K1 uptake rate constant calculated (by using a one-tissue compartment model) at each of the ablation sites and compared with that in the contralateral untreated limb.
Histopathologic Examination
After follow-up imaging, treated specimens were dissected. Samples were taken from the midcraniocaudal length of each ablation, as defined by the area of bone changes at MR imaging and CT. A single 1-cm-thick cross-sectional slice was obtained through the bone and adjacent soft tissues from each of the two ablations in each treated limb. Samples were also taken from the contralateral side at the level of the treatments. From each slice, the medial and lateral portions of the specimen were further dissected, fixed in 10% buffered formalin, decalcified in Easy-Cut decal (American Mastertech, Lodi, Calif), processed in an automated tissue processor (Peloris II; Leica Biosystems, Buffalo Grove, Ill), embedded in paraffin, sliced, and stained with hematoxylin-eosin by using conventional techniques. Slides were reviewed by a bone and soft-tissue pathologist with more than 10 years of experience (A.E.H.).
Statistical Analysis
The Mann-Whitney test was used to compare the medians of the values to determine if there was a significant difference in energies and resultant temperature increase between the proximal and distal ablations and if there was a significant difference in MR ablation volume between proximal and distal ablations. P < .05 was considered to indicate a statistically significant difference. Data analysis was performed with InStat 3.1a (GraphPad, San Diego, Calif).
Results
MR imaging–guided HIFU successfully created 16 focal bone ablations in eight animals. Table 1 summarizes the sonication energy and resultant temperature applied in animals euthanized at 6 weeks and those euthanized at 3 weeks. No evidence of skin burn was seen in any of the treated animals. The animals resumed normal behavior and movement immediately after treatment and for the duration of the study; thus, all animals received a movement score of 0 throughout the follow-up period.
MR Imaging Findings
Three-dimensional bone ablation lengths (in millimeters) of proximal and distal lesions measured at contrast-enhanced MR imaging 3 and 6 weeks after MR imaging–guided HIFU ablation are shown in Table 2. There was a consistent evolution in the imaging appearance noted immediately after MR imaging–guided HIFU ablation and at 3-week and 6-week imaging, which was seen in all animals. Immediately after the sonications, each ovoid ablation was characterized by a faint T1 hypointense rim, T2 hyperintensity, and homogeneous postcontrast hypoenhancement (Fig 1). Further details are shown in Figure E1 (online).
Table 2.
Average Three-dimensional Bone Ablation Lengths and Volumes at Contrast-enhanced MR Imaging after MR Imaging–guided HIFU Ablation

Note.—Data are averages, with ranges in parentheses. AP = anteroposterior, CC = craniocaudal. P = .53 for comparison of distal with proximal ablation volume in the 3-week group; P = .10 for comparison of distal with proximal ablation volume in the 6-week group.
Figure 1:
Coronal contrast-enhanced T1-weighted spoiled gradient-echo MR image of swine femur. The proximal and distal diaphyses of the right femur (downside limb) were sonicated. MR images were acquired immediately after HIFU ablation. The ablations are seen as two focal ovoid regions of hypoenhancement (arrows).
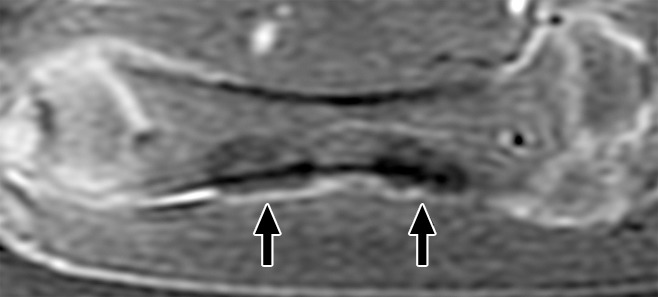
At 3 weeks, there was a well-defined T1 hypointense rim, persistent T2 hyperintensity, and moderate peripheral enhancement, particularly in the soft tissues along the lateral cortical bone (Fig 2). Cortical thinning and irregularity was also seen in all ablations (proximal and distal) on images obtained with all sequences at 3 weeks. Further details are shown in Figure E2 (online).
Figure 2a:
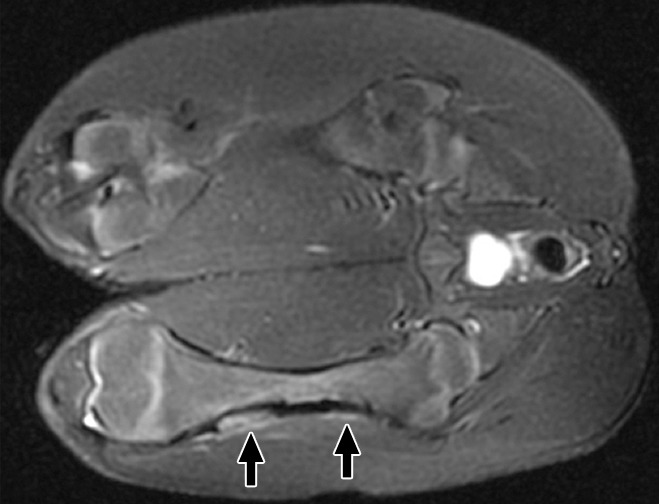
(a) Coronal T2-weighted and (b) contrast-enhanced T1-weighted spoiled gradient-echo MR images obtained in swine 3 weeks after MR imaging–guided HIFU ablation. The ablations show persistent T2 hyperintensity and moderate peripheral enhancement (arrows). Distal ablations showed slightly more enhancement lateral to the bone than proximal ablations.
Figure 2b:
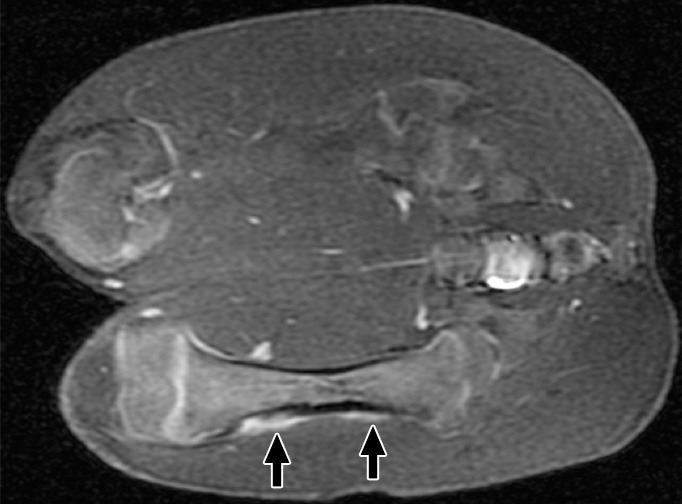
(a) Coronal T2-weighted and (b) contrast-enhanced T1-weighted spoiled gradient-echo MR images obtained in swine 3 weeks after MR imaging–guided HIFU ablation. The ablations show persistent T2 hyperintensity and moderate peripheral enhancement (arrows). Distal ablations showed slightly more enhancement lateral to the bone than proximal ablations.
At 6 weeks, the distal ablations demonstrated cortical irregularity on images obtained with all sequences, with a small nodule of heterogeneous T2 signal extending into the adjacent soft tissue (Fig 3). The proximal ablations were difficult to visualize at this time point, with subtle T1 signal heterogeneity suggestive of cortical irregularity and faint intramedullary enhancement noted. None of the ablations were visible at any time point with the perfusion MR technique. No signal abnormalities were seen in the control contralateral femur at any point in time. Further details are shown in Figure E3 (online).
Figure 3a:
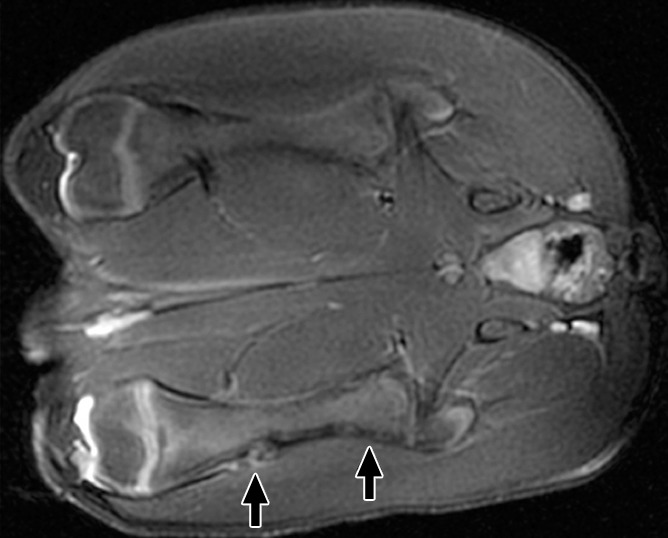
(a) Coronal T2-weighted and (b) contrast-enhanced T1-weighted spoiled gradient-echo MR images obtained in swine 6 weeks after MR imaging–guided HIFU. Distal ablations showed cortical irregularity on images obtained with all sequences; this irregularity was associated with a small soft-tissue nodule of heterogeneous T2 signal with moderate heterogeneous enhancement (arrows). Proximal ablations are difficult to visualize, with only subtle cortical irregularity and faint intramedullary enhancement (arrows).
Figure 3b:
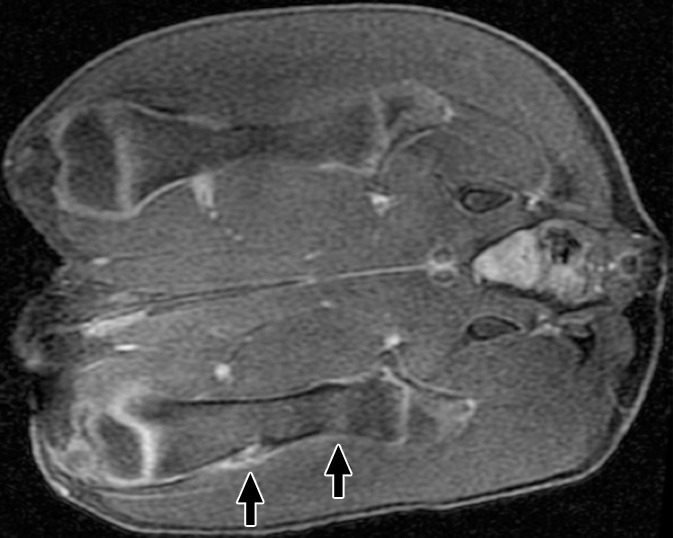
(a) Coronal T2-weighted and (b) contrast-enhanced T1-weighted spoiled gradient-echo MR images obtained in swine 6 weeks after MR imaging–guided HIFU. Distal ablations showed cortical irregularity on images obtained with all sequences; this irregularity was associated with a small soft-tissue nodule of heterogeneous T2 signal with moderate heterogeneous enhancement (arrows). Proximal ablations are difficult to visualize, with only subtle cortical irregularity and faint intramedullary enhancement (arrows).
CT Findings
Ablation sizes at CT are listed in Table 3. Immediately after MR imaging–guided HIFU ablation, none of the ablations were seen at 64-section CT. However, at 3 weeks, all ablations demonstrated mixed endosteal sclerosis and lucency (Fig 4). Additionally, all distal ablations at 3 weeks demonstrated a small linear focus of new bone density at the cortical margin of the bone, which measured up to an average of 3.0 × 10.3 × 7 mm (transverse × anteroposterior ×craniocaudal).
Table 3.
Average MR Imaging–guided HIFU Bone Ablation Sizes for Each Animal as Evaluated with CT

Note.—Data are averages, with ranges in parentheses. The New Bone column documents the presence and average size of new bone density at the cortical margin along each ablation. AP = anteroposterior, CC = craniocaudal.
Figure 4a:
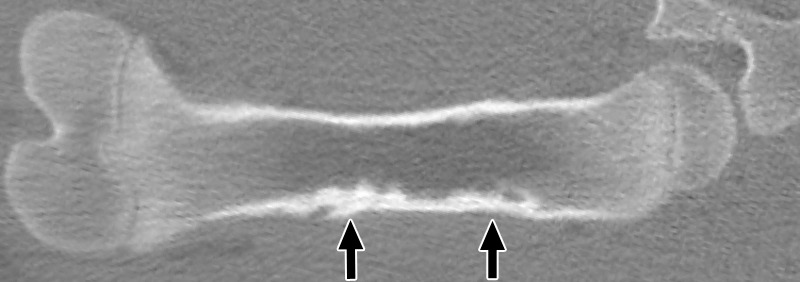
Coronal nonenhanced CT images in a treated femur (a) 3 weeks after MR imaging–guided HIFU ablation and (b) 6 weeks after ablation. At 3 weeks, both ablations show mixed endosteal sclerosis and lucency (arrows). Distal lesions also demonstrated a subtle focus of new bone density along the cortical margin. At 6 weeks, all ablations show dense subcortical sclerosis, but distal lesions also show a larger focus of new bone density along the cortical margin (arrows) compared with the appearance at 3 weeks.
Figure 4b:
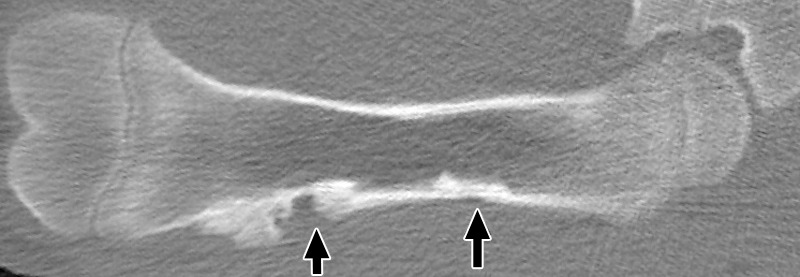
Coronal nonenhanced CT images in a treated femur (a) 3 weeks after MR imaging–guided HIFU ablation and (b) 6 weeks after ablation. At 3 weeks, both ablations show mixed endosteal sclerosis and lucency (arrows). Distal lesions also demonstrated a subtle focus of new bone density along the cortical margin. At 6 weeks, all ablations show dense subcortical sclerosis, but distal lesions also show a larger focus of new bone density along the cortical margin (arrows) compared with the appearance at 3 weeks.
At 6 weeks, all ablations (proximal and distal) showed dense subcortical sclerosis, but additionally, among the distal ablations, there was a larger focus of new bone density compared with the ablations evaluated at 3 weeks. The distal new bone density at 6 weeks measured up to an average of 6.3 × 20.8 × 15 mm (transverse × anteroposterior × craniocaudal). This new bone density was not seen along the margins of any of the proximal ablations. No attenuation abnormalities were seen on the contralateral side at any point in time. Further details are shown in Figure E4 (online).
Na18F-PET Findings
One of the two animals examined with Na18F-PET at 3 weeks demonstrated qualitatively increased uptake at the distal ablation, with a corresponding K1 uptake rate constant of 0.36 mL/mg/min, compared with 0.21 mL/mg/min on the contralateral side (Fig 5). The other animal demonstrated symmetric uptake at the level of the ablations. Both animals at 6 weeks demonstrated qualitatively increased radiotracer uptake at the distal ablations, with quantitative K1 uptake rate constants of 0.29 and 0.24 mL/min/g, compared with 0.02 and 0.05 mL/min/g in the control contralateral femurs, respectively. Further details are shown in Figure E5 (online).
Figure 5a:
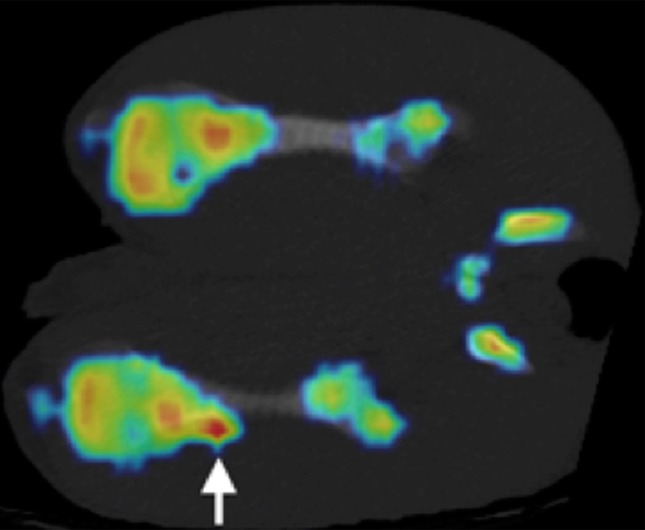
(a, b) Na18F PET/CT fusion images at (a) 3 weeks and (b) 6 weeks after MR imaging–guided HIFU ablation. One of two animals at 3 weeks demonstrated a focus of increased uptake at the distal ablation that correlated with a small focus of increased bone density at CT (arrow). Both animals at 6 weeks demonstrated a region of increased uptake at the distal ablation that correlated with a larger focus of new bone density compared with that seen at 3 weeks (arrow).
Figure 5b:
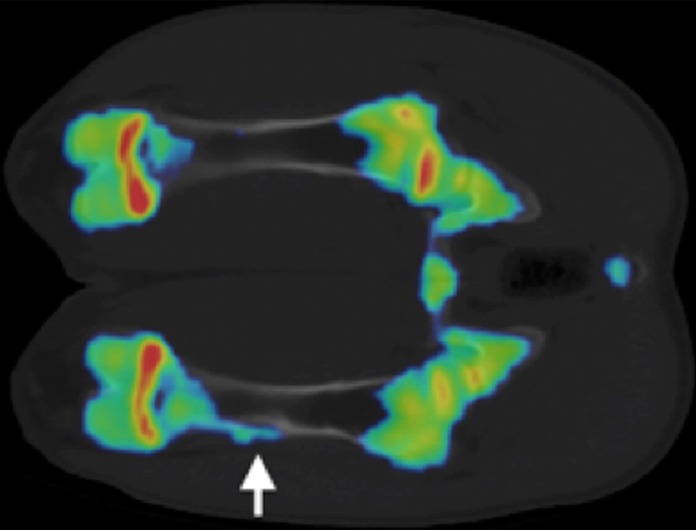
(a, b) Na18F PET/CT fusion images at (a) 3 weeks and (b) 6 weeks after MR imaging–guided HIFU ablation. One of two animals at 3 weeks demonstrated a focus of increased uptake at the distal ablation that correlated with a small focus of increased bone density at CT (arrow). Both animals at 6 weeks demonstrated a region of increased uptake at the distal ablation that correlated with a larger focus of new bone density compared with that seen at 3 weeks (arrow).
Histopathologic Findings
The hematoxylin-eosin staining of samples taken at 3 weeks demonstrated acute-on-chronic endosteal inflammation with osteonecrosis and bone resorption at the proximal ablations (Fig 6). Distal ablations demonstrated a similar pattern of endosteal inflammation, with minimal new subperiosteal bone formation along the cortical margin. These changes were not seen in the contralateral control femur, which demonstrated normal bone architecture. At 6 weeks, the proximal ablations demonstrated atrophy, scarring, and chronic inflammation with subcortical osteonecrosis and endosteal fat necrosis. Similar endosteal changes were seen at the distal ablations. However, the distal ablations also demonstrated marked subperiosteal new bone formation. Soft tissues adjacent to all ablations appeared normal, without necrosis, atrophy, or inflammation. Further details are shown in Figure E6 (online).
Figure 6:
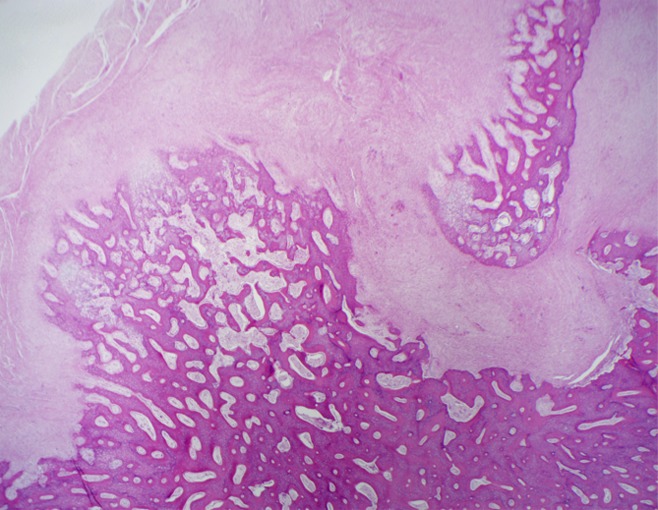
Hematoxylin-eosin–stained slices at ablation sites 6 weeks after MR imaging–guided HIFU ablation. Distal lesions showed evidence of extensive subperiosteal new bone formation. (Original magnification, ×20.)
Discussion
This exploratory MR imaging, CT, and PET study demonstrated a progressive pattern of bone remodeling after MR imaging–guided HIFU ablation. The discrete foci of hypoenhancement observed at MR imaging immediately after MR imaging–guided HIFU ablation were best seen at 3 and 6 weeks as enlarging discrete regions of mixed endosteal sclerosis and lucency at CT. Additionally, in 50% (eight of 16) of the ablations (specifically, all distal ablations at 3 and 6 weeks), we saw evidence of new bone formation at CT and increased flow and/or metabolism at Na18F-PET, potentially indicating bone turnover. Interestingly, subperiosteal new bone formation was seen only in the distal ablations, which were created with higher energies, suggesting the possibility of an energy dose threshold at which new bone formation is seen after MR imaging–guided HIFU ablation. This finding confirms those of prior studies (4), which suggested possible new bone formation in patients after MR imaging–guided HIFU ablation for treatment of malignant bone lesions, where even higher levels of energy were used compared with those used for the distal femoral targets in our study.
The precise mechanism of new bone formation after MR imaging–guided HIFU ablation is not well understood. It is possible that the higher energy dose insult crosses a threshold of injury, stimulating repair mechanisms, analogous to the formation of callus. Additionally, of note, when focused ultrasound deposits energy in bone as opposed to soft tissue, heat spreads rapidly to involve a relatively large bone volume because of the highly absorptive nature of bone. Therefore, the use of higher energies could increase the subperiosteal volume affected, contributing to a response that would result in new bone formation, as we found in our study.
Once a critical temperature is reached, proteins are coagulated, regardless of the original source of heating. Therefore, the evolution of the ablative zone would be expected to be similar among other heat-based methods of ablation, such as laser-, radiofrequency-, and microwave-based ablation. However, there might be a discrepancy in the effects on cells and tissues immediately adjacent to the ablation zone in MR imaging–guided HIFU ablation. Immediately adjacent to an MR imaging–guided HIFU ablation zone, cells would be exposed both to moderate heating and the mechanical effects of high-frequency ultrasound. That combination of effects at the margins of the ablation might influence subsequent bone remodeling. However, additional studies are needed to more completely investigate this possibility.
It is important to understand the patterns of chronic remodeling after MR imaging–guided HIFU ablation, as certain patterns might be more or less desirable for treating a given condition. For example, when treating a lytic bone metastasis, higher doses might be preferable to stimulate new bone growth, whereas in the treatment of benign conditions, exuberant subperiosteal new bone formation might prove biomechanically disadvantageous. Additional studies are needed to better understand the relationship between HIFU and intracellular second messengers. Large trials with controlled energy deposition and careful follow-up of patients who have undergone MR imaging–guided HIFU ablation for palliation of bone metastases will also be critical in helping us to better understand the phenomenon of new bone formation after MR imaging–guided HIFU ablation.
This exploratory study was limited in terms of its small sample size, the unblinded consensus review, indirect thermometric MR imaging data (temperatures were not obtained from the bone but from the surrounding soft tissue), and the ablation of normal bone. Chronic remodeling after MR imaging–guided HIFU ablation in diseased bones might differ. However, the current study design was chosen to enable more consistent and direct comparison of changes in the femur during the follow-up period. Additionally, higher doses were used only distally, and although the targeted proximal and distal bone–soft-tissue interfaces appeared similar, location might affect the remodeling response. Finally, our study was also limited because only half of the animals underwent Na18F-PET evaluation, and the remainder underwent histopathologic analysis.
Practical applications: The results of the current study could be useful in designing clinical MR imaging–guided HIFU treatments of bone, for both benign and malignant conditions. MR imaging–guided HIFU ablation of bone can result in progressive remodeling, with subcortical osteonecrosis and subperiosteal new bone formation. New bone formation appears to correlate with the use of relatively higher energies during MR imaging–guided HIFU ablation. MR imaging, CT, and PET each have unique strengths in post–HIFU ablation evaluation. MR imaging effectively demonstrates postprocedural changes in vascularity. CT several weeks after treatment clearly depicts subcortical increased density and bone formation. Finally, Na18F-PET evaluation during follow-up can demonstrate increased bone metabolism.
Advances in Knowledge
■ At 3 and 6 weeks after MR imaging–guided high-intensity focused ultrasound (HIFU) ablation of the femur in swine, MR, CT, sodium fluorine 18 (Na18F)-PET, and histopathologic examination demonstrated progressive, increasing subperiosteal new bone formation at all eight sites sonicated with relatively higher energy doses (average, 419 J; range, 390–440 J).
■ Subperiosteal new bone formation after MR imaging–guided HIFU ablation was not seen in ablations created with relatively lower energy sonications (n = 0 of eight).
Implications for Patient Care
■ Choice of energy dose during MR imaging–guided HIFU ablation may potentially be used to help control remodeling of bone as needed on the basis of the clinical indication for treatment.
■ MR imaging–guided HIFU ablation could potentially be used to stimulate bone growth in bone-deficient states (eg, nonhealing osteoporotic fractures).
SUPPLEMENTAL FIGURES
Acknowledgments
Acknowledgments
The authors thank Nicole Bronson, BSRT (R)(MR), and Carol Stillson, BA, VT, for their technical support in imaging and animal preparation.
Received November 17, 2013; revision requested January 6, 2014; revision received April 3; accepted August 4; final version accepted August 12.
Supported by the University of California–San Francisco Department of Radiology and Biomedical Imaging.
Funding: This research was supported by the National Institutes of Health (grant 1 T32 EB001631).
Disclosures of Conflicts of Interest: M.D.B. disclosed no relevant relationships. V.R. Activities related to the present article: has received a grant from GE Healthcare. Activities not related to the present article: has received a grant from InSightec. Other relationships: none to disclose. Y.S. disclosed no relevant relationships. A.E.H. disclosed no relevant relationships. R.A.H. disclosed no relevant relationships. S.M. Activities related to the present article: has received grants from GE and InSightec. Activities not related to the present article: none to disclose. Other relationships: none to disclose. T.M.L. Activities related to the present article: has received a grant from InSightec. Activities not related to the present article: none to disclose. Other relationships: none to disclose. M.S. disclosed no relevant relationships.
Abbreviations:
- BW
- bandwidth
- FOV
- field of view
- FSE
- fast spin echo
- HIFU
- high-intensity focused ultrasound
- TE
- echo time
- TR
- repetition time
References
- 1.Catane R, Beck A, Inbar Y, et al. MR-guided focused ultrasound surgery (MRgFUS) for the palliation of pain in patients with bone metastases: preliminary clinical experience. Ann Oncol 2007;18(1):163–167. [DOI] [PubMed] [Google Scholar]
- 2.Kopelman D, Inbar Y, Hanannel A, et al. Magnetic resonance guided focused ultrasound surgery: ablation of soft tissue at bone-muscle interface in a porcine model. Eur J Clin Invest 2008;38(4):268–275. [DOI] [PubMed] [Google Scholar]
- 3.Jolesz FA, Hynynen K, McDannold N, Tempany C. MR imaging-controlled focused ultrasound ablation: a noninvasive image-guided surgery. Magn Reson Imaging Clin N Am 2005;13(3):545–560. [DOI] [PubMed] [Google Scholar]
- 4.Gianfelice D, Gupta C, Kucharczyk W, Bret P, Havill D, Clemons M. Palliative treatment of painful bone metastases with MR imaging–guided focused ultrasound. Radiology 2008;249(1):355–363. [DOI] [PubMed] [Google Scholar]
- 5.Liberman B, Gianfelice D, Inbar Y, et al. Pain palliation in patients with bone metastases using MR-guided focused ultrasound surgery: a multicenter study. Ann Surg Oncol 2009;16(1):140–146. [DOI] [PubMed] [Google Scholar]
- 6.Napoli A, Mastantuono M, Cavallo Marincola B, et al. Osteoid osteoma: MR-guided focused ultrasound for entirely noninvasive treatment. Radiology 2013;267(2):514–521. [DOI] [PubMed] [Google Scholar]
- 7.Chen W, Zhu H, Zhang L, et al. Primary bone malignancy: effective treatment with high-intensity focused ultrasound ablation. Radiology 2010;255(3):967–978. [DOI] [PubMed] [Google Scholar]
- 8.Bucknor MD, Rieke V, Do L, Majumdar S, Link TM, Saeed M. MRI-guided high-intensity focused ultrasound ablation of bone: evaluation of acute findings with MR and CT imaging in a swine model. J Magn Reson Imaging 2013 . [DOI] [PMC free article] [PubMed] [Google Scholar]
- 9.Rieke V, Butts Pauly K. MR thermometry. J Magn Reson Imaging 2008;27(2):376–390. [DOI] [PMC free article] [PubMed] [Google Scholar]
Associated Data
This section collects any data citations, data availability statements, or supplementary materials included in this article.


