

Abstract
Background
At least nineteen states have laws that require telling women with dense breasts and a negative screening mammogram to consider supplemental screening. The most readily available supplemental screening modality is ultrasound, yet little is known about its effectiveness.
Objective
To evaluate the benefits, harms, and cost-effectiveness of supplemental ultrasound screening for women with dense breasts.
Design
Comparative modeling with 3 validated simulation models.
Data Sources
Surveillance, Epidemiology, and End Results Program; Breast Cancer Surveillance Consortium; the medical literature.
Target Population
A contemporary cohort of women eligible for routine screening.
Time Horizon
Lifetime.
Perspective
Payer.
Interventions
Supplemental ultrasound screening for women with dense breasts following a negative screening mammogram.
Outcome Measures
Breast cancer deaths averted, quality-adjusted life years (QALYs) gained, false positive ultrasound biopsy recommendations, costs, costs per QALY gained.
Results of Base-Case Analysis
Supplemental ultrasound screening after a negative mammogram for women aged 50–74 with heterogeneously or extremely dense breasts averted 0.36 additional breast cancer deaths (range across models: 0.14–0.75), gained 1.7 QALYs (0.9–4.7), and resulted in 354 false-positive ultrasound biopsy recommendations (345–421) per 1000 women with dense breasts compared with biennial screening by mammography alone. The cost-effectiveness ratio was $325,000 per QALY gained ($112,000-$766,000). Restricting supplemental ultrasound screening to women with extremely dense breasts cost $246,000 per QALY gained ($74,000-$535,000).
Results of Sensitivity Analysis
The conclusions were not sensitive to ultrasound performance characteristics, screening frequency, or starting age.
Limitations
Provider costs for coordinating supplemental ultrasound were not considered.
Conclusions
Supplemental ultrasound screening for women with dense breasts undergoing screening mammography would substantially increase costs while producing relatively small benefits in breast cancer deaths averted and QALYs gained.
Primary Funding Source
National Institutes of Health
INTRODUCTION
Mammographic breast density is a risk factor for developing breast cancer(1, 2). It also affects mammography performance(3–6). Consequently, the false-negative rate of screening mammography varies as much as 10-fold from the lowest to the highest categories of breast density(5). Because breast density affects cancer risk and the false-negative rate of screening, at least nineteen states have enacted legislation requiring that women with dense breasts be told of their breast density following a screening mammogram and that they might benefit from supplemental screening tests such as ultrasound(7, 8). Similar legislation is under consideration at the national level(9).
Breast density notification laws have an uncertain impact on health but could affect millions of women. More than 50% of women aged 40–74 years have dense breasts(10),defined in the laws as heterogeneously or extremely dense breast tissue by the American College of Radiology’s Breast Imaging Reporting and Data System (BI-RADS)(9, 11). However, the American College of Radiology and other organizations have cautioned legislators, health policy makers, and health care providers to carefully consider the unintended consequences of breast density notification legislation, including the uncertain harms and benefits of supplemental screening(8, 12–15). These concerns are amplified given the subjective nature of the BI-RADS breast density assessment and the challenges providers face in accurately assessing and communicating breast cancer risk to their patients.
Ultrasound is often suggested for supplemental screening of women with dense breasts because it is widely available and has relatively low direct medical costs(16–18). Shortly after Connecticut became the first state to enact a breast density notification law, as many as 30% of women with dense breasts at some practices within the state were undergoing supplemental ultrasound screening(19–21). Limited data from clinical trials and observational studies suggest that the addition of handheld ultrasound screening to mammography for women with dense breasts increases cancer detection rates at the expense of increased biopsies for women without cancer(16, 19–22). Moreover, the impact of supplemental ultrasound screening on long-term outcomes such as breast cancer mortality and its cost-effectiveness at a population-level are not known(8).
We assessed the potential population benefits, harms, and cost effectiveness of supplemental screening ultrasound for women with dense breasts using three established Cancer Intervention and Surveillance Modeling Network (CISNET) breast cancer models(23). The models incorporate evidence from clinical trials and observational studies to estimate the impact of various screening scenarios on breast cancer outcomes including breast cancer mortality, quality-adjusted life years (QALYs), and costs(24, 25). The results provide evidence for policymakers considering breast density notification legislation and for women and providers evaluating screening options for women with dense breasts.
METHODS
We used three micro simulation models developed independently with in the National Cancer Institute-funded CISNET consortium (www.cisnet.cancer.gov): Model E (Erasmus University Medical Center), Model G–E (Georgetown University Medical Center and Albert Einstein College of Medicine), and Model W (University of Wisconsin and Harvard Medical School). These modeling groups are collaborating in the program project grant that supported this study and are described in detail elsewhere(26–28) and online at http://cisnet.cancer.gov/breast/profiles.html; Appendix Table 1 outlines the main model differences and assumptions. Our analyses used a lifetime horizon and federal payer perspective. Briefly, the models simulated life histories of women who were at risk for breast cancer, underwent screening, were treated for breast cancers diagnosed by screening or clinical detection, and were at risk for death from breast cancer and other causes. The models have independent approaches and different modeling structures(23), but use common inputs, including incidence in the absence of screening, mammography performance, treatment effectiveness, and competing causes of mortality(29). The models approximately replicate US breast cancer incidence and mortality trends(26–28, 30); see Appendix Figure 1.For this analysis we used stimulated cohorts of women born in 1960, as described elsewhere(24, 25).
Model Parameters
At age 40, women in the simulated model cohorts were assigned an initial breast density based on the distribution of BI-RADS density categories for premenopausal women in the Breast Cancer Surveillance Consortium (BCSC; Table 1)(31). At age 50, women in the model cohorts were assigned to the same breast density category or the next lower category so the prevalence of breast density categories matched the BCSC observed prevalence for postmenopausal women(31). Sensitivity analyses were conducted with Model W to examine the impact of re-assigning density at both age 50 and age 65, based on the BCSC breast density prevalence data for women aged 50–64 (44% with dense breasts) and ≥65 years (33% with dense breasts). In all scenarios, a woman’s modeled risk of developing breast cancer depended on her age and breast density, based on BCSC data (Table 1).
Table 1.
Key common inputs used by the three simulation models.
| Prevalence by Age, % |
Relative Risk of Breast Cancer |
|||
|---|---|---|---|---|
| BI-RADS breast density | Age <50† | Age ≥50† | Age <50* | Age ≥50* |
| Almost entirely fat | 4.3 | 10.2 | 0.49 | 0.59 |
| Scattered fibro glandular densities | 34.3 | 49.0 | 1 (Ref) | 1 (Ref) |
| Heterogeneously dense | 47.0 | 35.5 | 1.55 | 1.46 |
| Extremely dense | 14.4 | 5.3 | 2.00 | 1.77 |
| Screening ultrasound performance |
Base case value |
Range in Sensitivity analyses |
||
| Sensitivity | 0.55 | 0.45, 0.85 | ||
| Specificity | 0.94 | 0.90, 0.98 | ||
| Cost of screening ultrasound exam | $100 | $100, $138 | ||
Ref, reference group; BI-RADS, the American College of Radiology’s Breast Imaging Reporting and Data System.
Unpublished data from the Breast Cancer Surveillance Consortium.
Density prevalence is based on BCSC data for premenopausal vs. postmenopausal women undergoing screening mammography (31).
Sensitivity and specificity of digital mammography were determined as a function of age, breast density, and screening interval using BCSC data (Appendix Table 2)(32). The American College of Radiology Imaging Network (ACRIN) Protocol 6666 study, a randomized trial of screening handheld ultrasound among high-risk women with at least one risk factor for breast cancer, provides the only controlled study of ultrasound test performance(33). Based on this study, experts (authors CIL, CDL) estimated screening ultrasound performance following a negative mammogram for average-risk women. We used a screening ultrasound sensitivity of 0.55 for women with dense breasts following a negative mammogram. We used a specificity of 0.94, with positive exams defined as those recommended for biopsy. Models were calibrated such that94% of ultrasound screen-detected cancers were invasive and 6% were in situ, as observed in published studies(16, 22). Sensitivity analyses evaluated a range of performance characteristics (Table 1).
Health-related quality of life utilities were a function of age(34)and decremented for breast cancer diagnosis and stage-specific treatment(35). Sensitivity analyses included short-term reductions in quality of life for a screening exam (0.006 for one week per screening exam) or a positive screening result(0.105 for five weeks)(36).
The cost of a screening digital mammogram was $138 based on the 2013 Medicare reimbursement rate. Screening ultrasound does not currently have a specific reimbursement rate, so we used the diagnostic breast ultrasound reimbursement rate of $100.Sensitivity analyses were also conducted using higher potential reimbursement rates for screening ultrasound because of its increased work intensity compared to diagnostic ultrasound. Diagnostic costs for additional imaging and biopsy following a positive screening mammogram and costs for cancer treatment were from the literature(32, 37). Diagnostic costs following a positive ultrasound were assumed to be equal to the biopsy-related costs of diagnostic work-up after a positive mammogram. All costs were in 2013 US dollars.
Screening strategies
Primary analysis compared three strategies for women aged 50–74 receiving biennial mammography screening: 1) mammography alone; 2) mammography plus screening ultrasound following a negative mammogram for women with extremely dense breasts; and 3) mammography plus handheld screening ultrasound following a negative mammogram for women with heterogeneously or extremely dense breasts (base-case). Secondary analyses evaluated the three strategies as an annual screening regimen for women aged 40–74.All strategies were compared with “no screening.” All scenarios assumed 100% adherence to the screening regimen and adjuvant treatment guidelines.
Analysis
For each strategy, the models estimated breast cancer mortality, life-years, QALYs, false-positive exams, and costs across the lifetimes of each simulated woman beginning at age 40. Costs, life years, and QALYs were discounted at 3% annually(38). Within-model cost-effectiveness ratios were calculated for each ultrasound strategy relative to its comparable mammography-alone strategy by dividing the difference in total costs by the difference in QALYs. All results are presented as median and range from the three simulation models.
Role of the funding source
This work was funded by the National Cancer Institute. The funding source had no role in the design and conduct of the study; collection, management, analysis, and interpretation of the data; preparation, review, and approval of the manuscript; or the decision to submit the manuscript for publication.
RESULTS
The three models yielded similar results for the estimated benefits and harms of the screening strategies (Figure 1, Appendix Tables 3 and 4). In the absence of screening, the models estimated 25.4 breast cancer deaths (range, 21.4–27.5) per 1000 women. Strategies with mammography screening alone reduced breast cancer mortality to 19.7 (14.7–20.3) and 15.2 (10.3–17.5) breast cancer deaths per 1000 women for biennial 50–74 and annual 40–74 mammography screening, respectively. Relative to “no screening”, these gains came at an increase in total costs of approximately $1 million per 1000 women for biennial 50–74 mammography screening and $3 million per 1000 women for annual 40–74 mammography screening.
Figure 1.
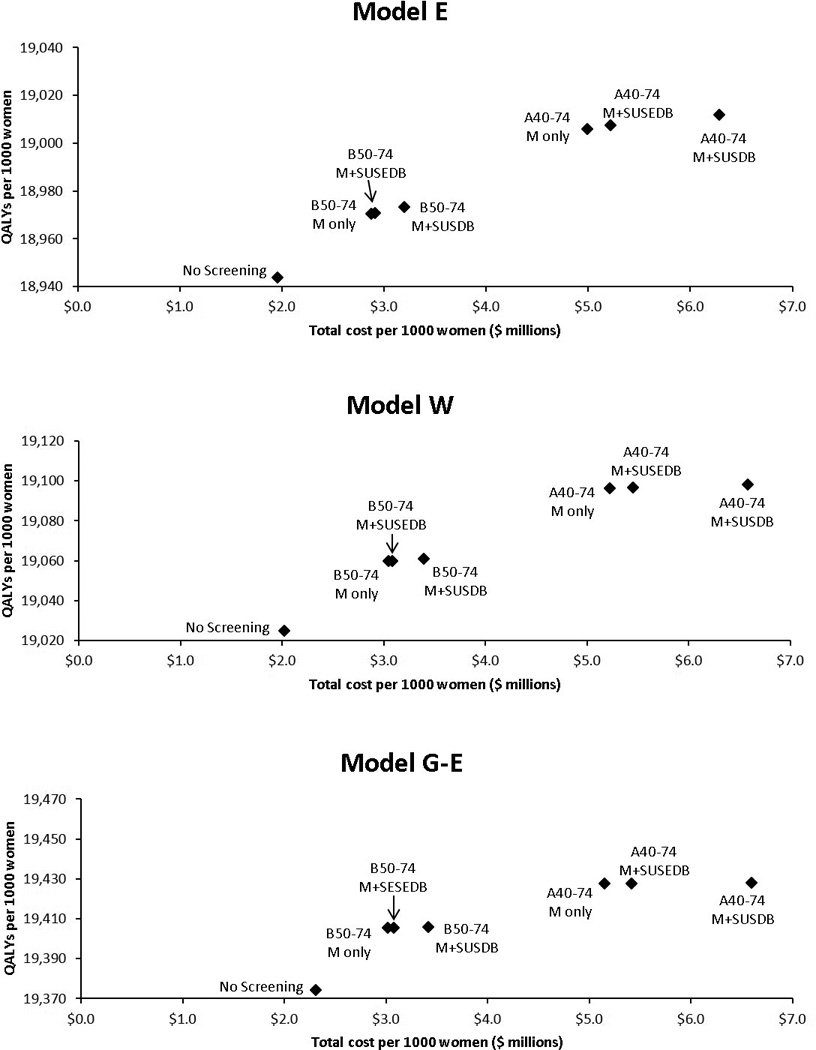
Discounted quality-adjusted life years versus costs by model and screening strategy. B50–74, biennial screening for women aged 50–74; A40–74, annual screening for women aged 40–74; M, mammography; SUSEDB, supplemental ultrasound screening for women with extremely dense breasts; SUSDB, supplemental ultrasound screening for women with dense breasts (heterogeneously or extremely dense).
For women aged 50–74 undergoing biennial screening, the models estimated that supplemental ultrasound would result in 504 ultrasound screening exams (range across models: 361, 584)per 1000 women if targeted to women with extremely dense breasts and 3827 ultrasound screening exams (3417–4048) per 1000 women if targeted to women with heterogeneously or extremely dense breasts(Table 2).
Table 2.
Median and range of outcomes per 1000 women across the three simulation models, by screening strategy.*
| Screening Strategy | Screening Mammograms‡ |
Screening Ultrasounds |
Breast Cancer Deaths |
Life Years | QALYs | Costs ($ millions) |
|---|---|---|---|---|---|---|
| No screening | 0 | 0 | 25.4 (21.4–27.5) |
23,065.5 (22,947.7–23,510.0) |
19,024.9 (18,943.8–19,374.4) |
2.02 (1.96–2.31) |
| Biennial 50–74 mammography alone | 11,014 (10,754–11,207) |
0 | 19.7 (14.7–20.3) |
23,108.5 (22,981.0–23,548.7) |
19,059.8 (18,970.4–19,405.4) |
3.02 (2.87–3.05) |
| Biennial 50–74 mammography plus ultrasound for extremely dense breasts† |
11,013 (10,753–11,207) |
504 (361, 584) |
19.6 (14.7–20.3) |
23,108.7 (22,981.6–23,548.9) |
19,059.9 (18,970.9–19,405.5) |
3.08 (2.91–3.08) |
| Biennial 50–74 mammography plus ultrasound for heterogeneously or extremely dense breasts† | 11,009 (10,746–11,207) |
3,827 (3,417–4,048) |
19.1 (14.5–20.2) |
23,109.8 (22,984.4–23,549.4) |
19,060.8 (18,973.3–19,405.9) |
3.39 (3.20–3.42) |
| Annual 40–74 mammography alone | 30,172 (30,159–31,287) |
0 | 15.2 (10.3, 17.5) |
23,151.5 (23,025.4–23,575.4) |
19,096.5 (19,005.9–19,427.5) |
5.15 (4.99–5.22) |
| Annual 40–74 mammography plus ultrasound for extremely dense breasts† | 30,165 (30,155–31,287) |
2,151 (1,837–2,293) |
15.0 (10.3–17.5) |
23,152.0 (23,027.4–23,575.5) |
19,096.9 (19,007.6–19,427.6) |
5.42 (5.22–5.45) |
| Annual 40–74 mammography plus ultrasound for heterogeneously or extremely dense breasts† | 30,145 (30,142–31,286) |
12,397 (11,776–12,802) |
14.4 (10.1–17.4) |
23,153.8 (23,032.3–23,575.9) |
19,098.4 (19,011.7–19,427.9) |
6.58 (6.28–6.60) |
QALYs, quality adjusted life years; 50–74, women aged 50–74 years; 40–74, women aged 40–74 years.
All outcomes computed from age 40 until death. Life years, QALYs and total costs were discounted at 3% per year.
Screening ultrasound following a negative digital screening mammogram.
Note that these are less than 13,000 for biennial 50–74 and less than 35,000 for annual 40–74 because screening does not occur among women in the cohort who have died from other causes or have already been diagnosed with breast cancer.
Compared to biennial mammography screening alone for women aged 50–74, supplemental screening ultrasound for women with extremely dense breasts averted 0.30 additional breast cancer deaths (range across models 0.14–0.75) and produced 1.1 additional QALYs (0.8–3.9) per 1000 women with extremely dense breasts (Table 3). The median 1.1 QALYs gained per 1000 women is equivalent to 9.6 hours per woman. These gains came at the cost of 189 false-positive ultrasound biopsy recommendations(173–259) and $287,000 ($271,000-$411,000) per 1000 women with extremely dense breasts. These findings gave a cost-effectiveness ratio of $246,000 per QALY gained ($74,000-$535,000) for supplemental ultrasound relative to digital mammography screening alone. Supplemental ultrasound screening for women with heterogeneously or extremely dense breasts averted 0.36 additional breast cancer deaths (0.17–0.93) and produced 1.7 additional QALYs (0.9–4.7), at a cost of 354 false-positive ultrasound biopsy recommendations and $560,000($529,000-$625,000) per 1000 women with heterogeneously or extremely dense breasts. These findings gave a cost-effectiveness ratio of $325,000 per QALY gained ($112,000-$766,000) for supplemental ultrasound relative to mammography screening alone (Table 3).
Table 3.
Median and range of benefits and harms in women with dense breasts from three simulation models for supplemental ultrasound screening relative to digital mammography alone.
| Supplemental Screening Strategy | Breast Cancer Deaths Averted |
Life Years Gained |
QALYS Gained |
False Positive Ultrasound Biopsy Recommendations |
Additional Costs | Cost per QALY gained relative to mammography alone |
Incremental cost per QALY gained† |
|---|---|---|---|---|---|---|---|
| Biennial 50–74 screening | |||||||
| Outcomes per 1000 women with extremely dense breasts | |||||||
| Supplemental ultrasound* for extremely dense breasts | 0.30 (0.14–0.75) |
1.2 (0.9–4.5) |
1.1 (0.8, 3.9) |
189 (173–259) |
$287,000 ($271k–$411k) |
$246,000 ($74k–$535k) |
|
| Outcomes per 1000 women with heterogeneously or extremely dense breasts | |||||||
| Supplemental ultrasound* for heterogeneously or extremely dense breasts | 0.36 (0.17–0.93) |
2.1 (1.0–5.6) |
1.7 (0.9–4.7) |
354 (345–421) |
$560,000 ($529k–$652k) |
$325,000 ($112k–$766k) |
$338,000 ($121k–$562k) |
| Annual 40–74 screening | |||||||
| Outcomes per 1000 women with extremely dense breasts | |||||||
| Supplemental ultrasound* for extremely dense breasts | 0.35 (0.04–1.40) |
3.6 (0.6–14.0) |
3.1 (0.6–11.8) |
879 (865–1,018) |
$1,693,000 ($1,596k-$1,889k) |
$553,000 ($135k-$3,221k) |
|
| Outcomes per 1000 women with heterogeneously or extremely dense breasts | |||||||
| Supplemental ultrasound* for heterogeneously or extremely dense breasts | 0.43 (0.08–1.28) |
3.7 (0.8–11.3) |
3.0 (0.7–9.4) |
1,219 (1,174–1,333) |
$2,210,000 ($2,103k–$2,363k) |
$728,000 ($223k–$3,509k) |
$776,000 ($259k–$3,583k) |
QALYs, quality adjusted life years; 50–74, women aged 50–74 years; 40–74, women aged 40–74 years.
Screening ultrasound following a negative digital screening mammogram.
Incremental cost per QALY gained for supplemental ultrasound screening for women with heterogeneously or extremely dense breasts compared to supplemental ultrasound screening for women with extremely dense breasts.
For an annual screening regimen for women aged 40–74, the benefits, harms, and costs of supplemental ultrasound screening were substantially amplified (Tables 2 and 3). Supplemental ultrasound screening for women with heterogeneously or extremely dense breasts averted 0.43 additional breast cancer deaths (0.08–1.28) and produced 3.0 additional QALYs (0.7–9.4) per 1,000 women with heterogeneously or extremely dense breasts compared to mammography screening alone. These findings yielded a cost-effectiveness ratio of $728,000 ($223,000-$3,509,000) per QALY gained for supplemental ultrasound relative to mammography screening alone (Table 3).
The incremental cost-effectiveness of expanding supplemental ultrasound screening from women with extremely dense breasts to women with either heterogeneously or extremely dense breasts was $338,000 per QALY gained ($121,000-$562,000) in the biennial screening scenario for women aged 50–74 and $776,000 per QALY gained ($259,000-$3,583,000) for the annual screening scenario for women aged 40–74 (data not shown).
Close examination of the model results revealed that differences in model estimates of the benefits of supplemental ultrasound screening were largely due to variation in the estimated ultrasound screening cancer detection rates among women with dense breasts following a negative mammogram (Table 4).
Table 4.
Sample histories from three simulation models of annual 40–74 digital mammography plus ultrasound screening for women with heterogeneously or extremely dense breasts. Screening outcomes per 10,000 women are shown for a single calendar year corresponding to age 52 years.
| Model E | Model W | Model G–E | |
|---|---|---|---|
| Screening mammograms* | 9652 | 9583 | 9694 |
| True-positive screening mammograms | 27 | 38 | 26 |
| Mammography cancer detection rate (per 1000 exams) | 2.8 | 4.0 | 2.7 |
| Negative mammograms | 8811 | 8669 | 8684 |
| Screening ultrasounds† | 3497 | 3090 | 3435 |
| True-positive screening ultrasounds | 2.8 | 1.8 | 0.3 |
| False-negative screening ultrasounds | 2.3 | 1.1 | 0.2 |
| False-positive screening ultrasound biopsy recommendations | 206 | 198 | 219 |
| Ultrasound cancer detection rate (per 1000 exams)‡ | 0.8 | 0.6 | 0.1 |
| Ultrasound sensitivity§ | 55% | 62% | 57% |
| Ultrasound specificity | 94% | 94% | 94% |
| Percent of ultrasound-detected cancers that are invasive (vs. in situ) | 94% | 94% | 96% |
Women previously diagnosed with breast cancer are not screened.
Supplemental ultrasound screening occurs among women with heterogeneously or extremely dense breasts following a negative mammogram.
Cancers detected among women with a negative screening mammogram.
Note that while the overall sensitivity target for screening ultrasound was 0.55 in each model, the models employ different techniques to calibrate detection probability curves that can vary based on patient age, tumor size, and other factors, thereby resulting in modest differences in sensitivity across models for the observed sensitivity for a given age group (in this case, age 52).
Sensitivity analyses
For biennial screening of women aged 50–74, the cost-effectiveness of supplemental ultrasound screening of women with heterogeneously or extremely dense breasts compared to mammography alone improved to $127,000 ($60,000-$353,000) per QALY gained when using elevated screening ultrasound sensitivity (0.85) and specificity (0.98) (Figure 2). Increasing the cost of a screening ultrasound exam to equal a screening mammogram had a modest impact on cost-effectiveness (median $396,000 per QALY gained), while the inclusion of short-term utility decrements for screening tests and diagnostic work-up substantially reduced the cost-effectiveness (median $703,000 per QALY gained) of supplemental ultrasound. Re-assigning breast density at both age 50 and age 65 (vs. at age 50 only) had a small impact on the results for Model W ($347,000 vs.$325,000 per QALY gained for the base-case scenario).
Figure 2.
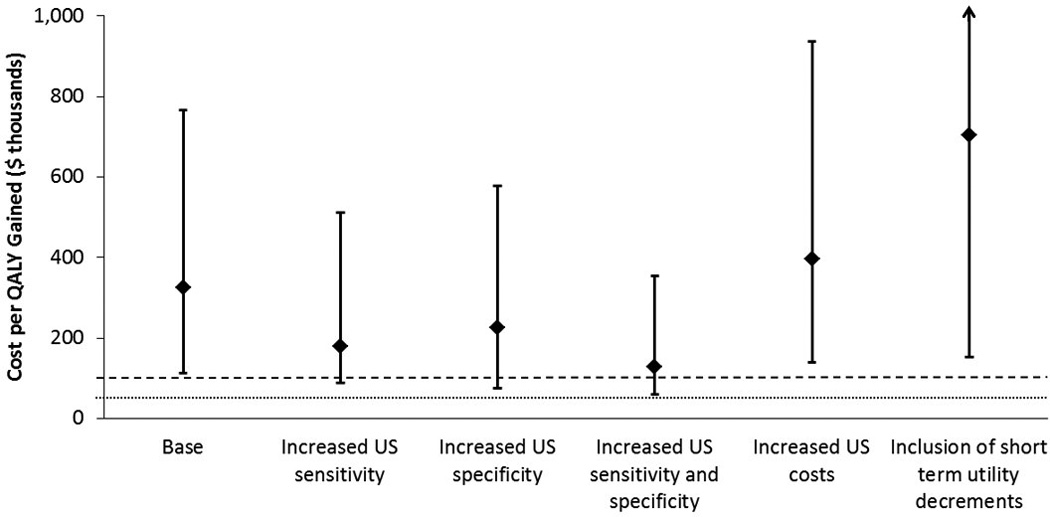
Sensitivity analyses comparing cost per quality adjusted life year(QALY) gained for biennial mammography alone with mammography plus supplemental ultrasound (US) for women aged 50–74 with heterogeneously or extremely dense breasts. X-axis shows key variables that were changed. Diamonds show the median from the three simulation models. Error bars show range across models. Dashed and dotted lines indicate $100,000 and $50,000 per QALY gained, respectively. The range of values explored for each variable are described in the methods and in Table 1.
DISCUSSION
Our models predicted that supplemental ultrasound screening for women with dense breasts would result in limited health gains and substantially increased expenses. The three models estimated that supplemental screening of women with heterogeneously or extremely dense breasts and a negative mammogram would cost more than $100,000 per QALY gained for either biennial screening of women aged 50–74 or annual screening of women aged 40–74. The models consistently showed that targeting supplemental ultrasound screening to women with extremely dense breasts undergoing biennial mammography would be more efficient than targeting women with either heterogeneously or extremely dense breasts, although even this strategy was not cost effective by most standards. The results also demonstrated that if supplemental ultrasound screening was used, it would be more cost effective for biennial screening of women aged 50–74 than annual screening of women aged 40–74.
While estimates of the breast cancer deaths averted and QALYs gained with supplemental ultrasound screening varied across models, all models found a small impact of supplemental ultrasound screening on breast cancer mortality and QALYs, particularly compared with the impact of screening mammography alone, which has a comparatively high sensitivity for detecting breast cancer. Consistent with prior work(25), our models estimated that biennial mammography alone for women aged 50–74 averted approximately six breast cancer deaths per 1000 women compared to no screening. Supplemental ultrasound screening of all women with heterogeneously or extremely dense breasts was estimated to reduce the breast cancer death rate by 0.36deaths per 1000 women with dense breasts compared to mammography screening alone. The models were consistent in finding that supplemental ultrasound screening for women with heterogeneously or extremely dense breasts would cost more than $100,000 per QALY gained relative to mammography screening alone. Thus, despite improved screening sensitivity with the addition of supplemental ultrasound, each model projected a limited impact on breast cancer mortality and QALYs gained due to relatively low cancer detection rates for screening ultrasound among women at average risk who undergo regular mammography screening.
While breast density legislation typically defines “dense breasts” as heterogeneously or extremely dense, we found that scenarios where supplemental ultrasound screening was limited to women with extremely dense breasts were relatively more efficient. For biennial screening of women aged 50–74, the models estimated improved cost effectiveness for supplemental ultrasound screening when targeted to women with extremely dense breasts; one model estimated $74,000 per QALY gained relative to mammography alone. All three models generated unfavorable cost-effectiveness ratios for supplemental ultrasound screening of women with extremely dense breasts for annual screening of women aged 40–74, reinforcing the effect of screening frequency on results.
Conclusions were generally consistent across models and robust in sensitivity analyses. Model estimates of costs and false-positive ultrasound screens for each screening strategy were in close agreement. The models showed more substantial variation in estimates of the benefits of supplemental screening, although all models reported small benefits. Cost-effectiveness ratios used measures of benefit in the denominator and thus were sensitive to small differences.
The range in model-estimated supplemental screening benefits reflects uncertainty about breast cancer natural history in the absence of screening. The models used independent approaches to simulate the natural history of breast cancer with different assumptions for unobservable variables such as duration of the preclinical screen-detectable phase of cancer and the proportion of cancers that do not ultimately lead to breast cancer death. Sensitivity analyses also indicated considerable variation in cost-effectiveness according to the ultrasound screening sensitivity and specificity parameters. No randomized controlled studies are available on the use of adjunct ultrasound for screening in women with dense breasts but at otherwise average risk for breast cancer(33). Data are needed on ultrasound screening performance in community settings directly relevant to breast density legislation, i.e., among women with dense breasts, a negative mammogram, and various risks of developing breast cancer. Variation in comparative effectiveness estimates could be reduced with high-quality data on ultrasound screening including cancer detection rate, stage distribution, and false-negative rate following a negative mammogram among women with dense breasts at various ages and levels of breast cancer risk. Such data would be particularly useful in evaluating alternative ultrasound screening strategies that target women based on factors beyond breast density alone, including breast cancer risk or likelihood of a false-negative mammogram.
Estimates of the benefits of supplemental ultrasound screening were substantially affected by considering short-term utility decrements that may result from screening exams and diagnostic work-up. In sensitivity analyses that assigned short-term utility decrements for mammography and ultrasound exams, the median cost per QALY gained from supplemental ultrasound screening increased from $325,000 to $703,000.These results suggest that the benefit-to-harm balance of supplemental ultrasound could vary substantially depending on a woman’s tolerance for false-positives and screening-related anxiety. Recent findings from the Digital Mammographic Imaging Screening Trial(39)suggest that while anxiety is increased following a false-positive mammogram, health utility scores as measured by the EQ-5D do not differ from women with a negative mammogram. Further research is needed to examine the short-term impacts of supplemental ultrasound screening on health utility scores, particularly given the frequency of biopsy following an abnormal screening ultrasound exam.
Our cost-effectiveness analysis was from the payer perspective and did not include societal costs such as patient time or facility costs for coordinating ultrasound screening; these factors would further increase the costs of supplemental screening. We assumed 100% screening and treatment adherence in evaluating the screening strategies and did not evaluate supplemental screening strategies for women not undergoing routine mammography. We considered only false-positive ultrasound recommendations for biopsy since only a small fraction of women with suspicious screening ultrasound findings but a negative mammogram are referred for additional imaging(19–21). However, a substantial fraction of ultrasound screening exams result in recommended short-interval follow-up(19–21). We did not model short-interval follow-up, which would further increase costs and likely worsen the cost effectiveness of supplemental ultrasound screening. Thus, the implications and optimal management of women receiving short-interval follow-up recommendations following ultrasound screening is an area for further research.
Our findings indicated that supplemental ultrasound screening of women with dense breasts would substantially increase costs while producing small benefits in breast cancer deaths averted and QALYs gained. To further improve our understanding of these harms and benefits, we need research that provides high-quality estimates of the performance of supplemental ultrasound screening in women at various levels of breast cancer risk. This includes both handheld ultrasound screening as well as automated whole breast ultrasound, which is an emerging technology with the potential to increase the standardization of ultrasound screening while reducing user skill and time constraints (40, 41). We also need estimates of the utility decrements associated with supplemental screening.
The widespread replacement of film mammography by digital mammography in the US has reduced but not eliminated the disparity in screening mammography sensitivity according to breast density(42). Targeted supplemental screening strategies are also motivated by the elevated breast cancer risk of women with dense breasts. While our results demonstrate that even under optimistic assumptions, supplementary handheld ultrasound screening in women with dense breasts but otherwise average risk is not cost-effective, it remains possible that a better-performing technology with targeted application to dense-breasted women or to women at higher than average risk may be useful. We particularly need studies evaluating the potential role of additional imaging modalities such as magnetic resonance imaging and digital breast tomosynthesis in screening for women with dense breasts.
Our results are directly applicable to breast density legislation. The value of breast density notification is complex and must be evaluated from a range of perspectives. We hope our results inform discussions about pending national legislation and also provide health care providers and women with information to guide decisions about screening strategies.
ACKNOWLEDGMENTS
We thank the BCSC investigators, participating women, mammography facilities, and radiologists for the data they have provided for this study. A list of the BCSC investigators and procedures for requesting BCSC data for research purposes are provided at: http://breastscreening.cancer.gov/.
GRANT SUPPORT:
This work was supported by the National Cancer Institute-funded Breast Cancer Surveillance Consortium (P01 CA154292, HHSN261201100031C) and the National Cancer Institute-funded grants U01 CA152958, U54 CA163303, and U54 CA163307. The collection of BCSC cancer and vital status data used in this study was supported in part by several state public health departments and cancer registries throughout the US. For a full description of these sources, please see: http://breastscreening.cancer.gov/work/acknowledgement.html.
Appendix
Appendix Figure 1.
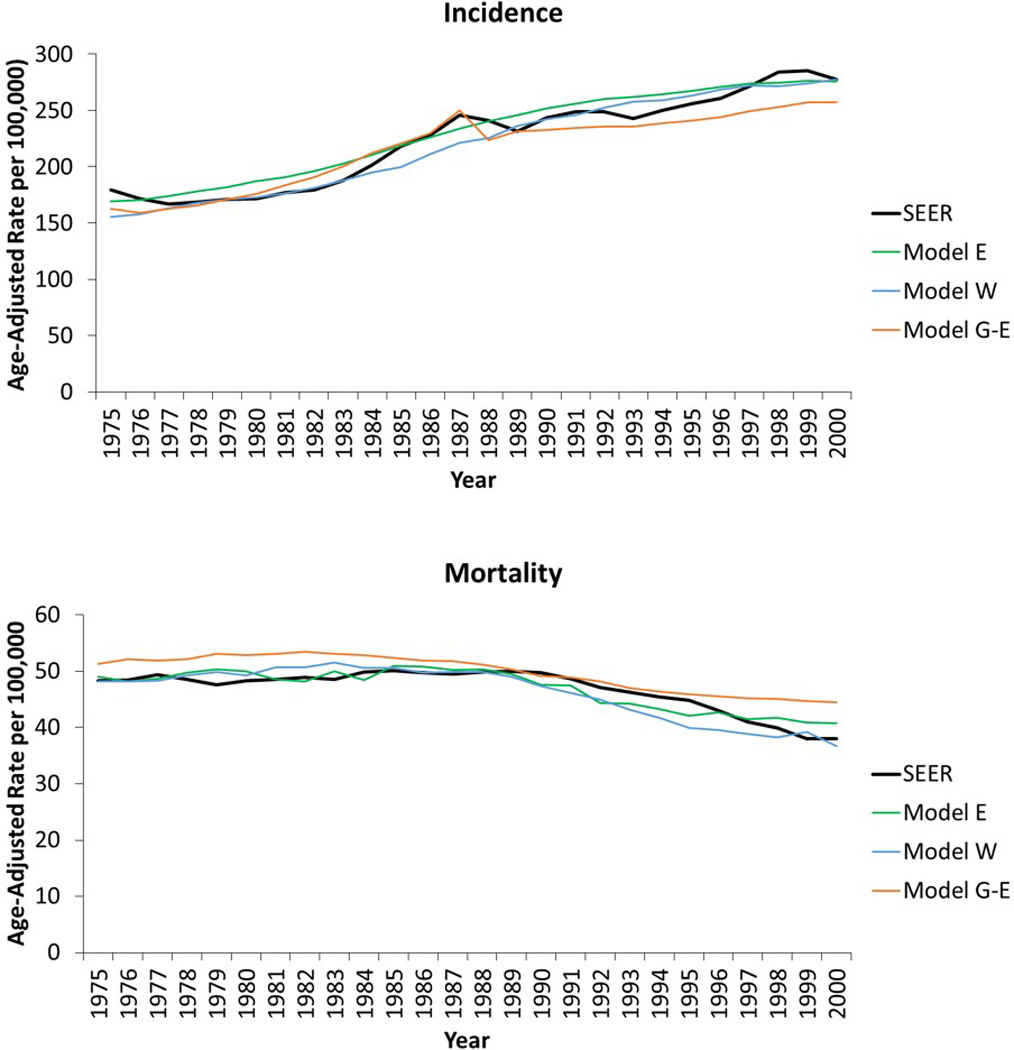
Model replication of US incidence and mortality patterns for women aged 30–79 years during 1975–2000. SEER: Surveillance, Epidemiology, and End Results Program.
Appendix Table 1.
Key assumptions and features in the three simulation models, adapted from Stout et al. (32)
| Model* | |||
|---|---|---|---|
| E | W | G-E | |
| Breast cancer natural history | |||
| Model structure | Continuous-time tumor growth model beginning in preclinical in situ disease; subset does not progress from in situ to invasive |
Continuous-time tumor growth model beginning in preclinical in situ disease; subset does not progress from early invasive and may regress if undetected |
State transition model beginning in preclinical in situ disease; subset does not progress from in situ to invasive |
| Parameter estimation | Calibrated to US stage-specific breast cancer incidence from 1975–2000 |
Calibrated to US stage-specific breast cancer incidence and mortality from 1975–2000 |
Calibrated to US stage-specific breast cancer incidence from 1975–2000 |
| Screening and Treatment | |||
| Implementation of screening benefits |
Tumor size | Tumor size, age shifts |
Stage, age shifts |
| Implementation of treatment benefits |
Cure fraction | Cure faction | Hazard reduction |
| Factors affecting treatment benefits |
ER and HER2 status, age, calendar year |
ER status, age, calendar year, stage at diagnosis |
ER and HER2 status, age, calendar year, stage at diagnosis |
| Software | |||
| Programming language | Delphi | C++ | C++ |
CISNET = Cancer Intervention and Surveillance Modeling Network; ER = estrogen receptor; HER2 = human epidermal growth factor
Model abbreviations are: E = Erasmus University Medical Center; W = University of Wisconsin and Harvard Medical School; G–E - Georgetown University Medical Center and Albert Einstein College of Medicine;
Appendix Table 2.
Digital mammography sensitivity and specificity* by screening interval, age group, and breast density from the Breast Cancer Surveillance Consortium, 2001–2008, adapted from Stout et al (32).
| BI-RADS breast density | Age, Yrs | Interval | Sensitivity | Specificity |
|---|---|---|---|---|
| Almost entirely fat | 40–49 | First | 0.84 | 0.90 |
| Annual† | 0.69 | 0.95 | ||
| Biennial‡ | 0.76 | 0.94 | ||
| 50–74 | First | 0.88 | 0.92 | |
| Annual | 0.76 | 0.95 | ||
| Biennial | 0.82 | 0.95 | ||
| Scattered fibro glandular densities | 40–49 | First | 0.91 | 0.83 |
| Annual | 0.82 | 0.90 | ||
| Biennial | 0.87 | 0.89 | ||
| 50–74 | First | 0.94 | 0.85 | |
| Annual | 0.87 | 0.92 | ||
| Biennial | 0.90 | 0.90 | ||
| Heterogeneously dense | 40–49 | First | 0.86 | 0.78 |
| Annual | 0.74 | 0.87 | ||
| Biennial | 0.80 | 0.85 | ||
| 50–74 | First | 0.90 | 0.81 | |
| Annual | 0.80 | 0.89 | ||
| Biennial | 0.85 | 0.88 | ||
| Extremely dense | 40–49 | First | 0.87 | 0.82 |
| Annual | 0.74 | 0.90 | ||
| Biennial | 0.80 | 0.88 | ||
| 50–74 | First | 0.90 | 0.85 | |
| Annual | 0.80 | 0.92 | ||
| Biennial | 0.85 | 0.90 |
BI-RADS = Breast Imaging Reporting and Data System
Sensitivity and specificity based on a 12-month follow-up period for defining interval cancers. Multivariable logistic regressions were used to estimate parameters. Covariates included age, screening frequency, and breast density.
Screening exams with a screen 9 to 18 months prior included in the calculation.
Screening exams with a screen 19 to 30 months prior included in the calculation.
Appendix Table 3.
Model-specific outcomes per 1000 women associated with biennial 50–74 digital mammography screening, by screening strategy.*
| Screening strategy | Mammography Screenings |
Ultrasound Screenings |
False Positive Ultrasound Biopsy Recommendations |
Breast Cancer Deaths |
Life Years |
Quality-Adjusted Life Years |
Total Costs |
|---|---|---|---|---|---|---|---|
| Model E | |||||||
| No screening | 0 | 0 | 0 | 25.4 | 22,947.7 | 18,943.8 | $1,956,003 |
| Biennial 50–74 mammography alone | 11,014 | 0 | 0 | 19.7 | 22,981.0 | 18,970.4 | $2,872,768 |
| Biennial 50–74 mammography plus ultrasound for extremely dense breasts† | 11,013 | 504 | 27 | 19.6 | 22,981.6 | 18,970.9 | $2,914,062 |
| Biennial 50–74 mammography plus ultrasound for heterogeneously or extremely dense breasts† | 11,009 | 3,827 | 212 | 19.1 | 22,984.4 | 18,973.3 | $3,197,490 |
| Model W | |||||||
| No screening | 0 | 0 | 0 | 21.4 | 23,065.5 | 19,024.9 | $2,021,074 |
| Biennial 50–74 mammography alone | 10,754 | 0 | 0 | 14.7 | 23,108.5 | 19,059.8 | $3,048,791 |
| Biennial 50–74 mammography plus ultrasound for extremely dense breasts† | 10,753 | 361 | 23 | 14.7 | 23,108.7 | 19,059.9 | $3,084,855 |
| Biennial 50–74 mammography plus ultrasound for heterogeneously or extremely dense breasts† | 10,746 | 3,417 | 218 | 14.5 | 23,109.8 | 19,060.8 | $3,393,578 |
| Model G–E | |||||||
| No screening | 0 | 0 | 0 | 27.5 | 23,510.0 | 19,374.4 | $2,312,148 |
| Biennial 50–74 mammography alone | 11,207 | 0 | 0 | 20.3 | 23,548.7 | 19,405.4 | $3,018,824 |
| Biennial 50–74 mammography plus ultrasound for extremely dense breasts† | 11,207 | 584 | 37 | 20.3 | 23,548.9 | 19,405.5 | $3,078,048 |
| Biennial 50–74 mammography plus ultrasound for heterogeneously or extremely dense breasts† | 11,207 | 4,048 | 258 | 20.2 | 23,549.4 | 19,405.9 | $3,418,949 |
All outcomes computed from age 40 until death. Life years, quality-adjusted life years and total costs were discounted at 3% per year.
Screening ultrasound following a negative screening mammogram.
Appendix Table 4.
Model-specific outcomes per 1000 women associated with annual 40–74 digital mammography screening, by screening strategy.*
| Screening Strategy | Mammography Screenings |
Ultrasound Screenings |
False Positive Ultrasound Biopsy Recommendations |
Breast Cancer Deaths |
Life Years | Quality- Adjusted Life Years |
Total Costs |
|---|---|---|---|---|---|---|---|
| Model E | |||||||
| No screening | 0 | 0 | 0 | 25.4 | 22,947.7 | 18,943.8 | $1,956,003 |
| Annual 40–74 mammography alone | 30,159 | 0 | 0 | 15.2 | 23,025.4 | 19,005.9 | $4,989,653 |
| Annual 40–74 mammography plus ultrasound for extremely dense breasts† | 30,155 | 2,151 | 124 | 15.0 | 23,027.4 | 19,007.6 | $5,219,332 |
| Annual 40–74 mammography plus ultrasound for heterogeneously or extremely dense breasts† | 30,142 | 12,397 | 721 | 14.4 | 23,032.3 | 19,011.7 | $6,280,442 |
| Model W | |||||||
| No screening | 0 | 0 | 0 | 21.4 | 23,065.5 | 19,024.9 | $2,021,074 |
| Annual 40–74 mammography alone | 30,172 | 0 | 0 | 10.3 | 23,151.5 | 19,096.5 | $5,223,561 |
| Annual 40–74 mammography plus ultrasound for extremely dense breasts† | 30,165 | 1,837 | 117 | 10.3 | 23,152.0 | 19,096.9 | $5,448,521 |
| Annual 40–74 mammography plus ultrasound for heterogeneously or extremely dense breasts† | 30,145 | 11,776 | 751 | 10.1 | 23,153.8 | 19,098.4 | $6,584,407 |
| Model G–E | |||||||
| No screening | 0 | 0 | 0 | 27.5 | 23,510.0 | 19,374.4 | $2,312,148 |
| Annual 40–74 mammography alone | 31,287 | 0 | 0 | 17.5 | 23,575.4 | 19,427.5 | $5,147,210 |
| Annual 40–74 mammography plus ultrasound for extremely dense breasts† | 31,287 | 2,293 | 147 | 17.5 | 23,575.5 | 19,427.6 | $5,419,072 |
| Annual 40–74 mammography plus ultrasound for heterogeneously or extremely dense breasts† | 31,286 | 12,802 | 818 | 17.4 | 23,575.9 | 19,427.9 | $6,598,051 |
All outcomes computed from age 40 until death. Life years, quality adjusted life years and total costs were discounted at 3% per year.
Screening ultrasound following a negative screening mammogram.
Footnotes
REPRODUCIBILITY RESEARCH STATEMENT
Protocol: Not applicable
Statistical code: Detailed information about the models is available online at http://cisnet.cancer.gov/breast/profiles.html
Data: Input and output data from the models is available by contacting Dr. Sprague at bsprague@uvm.edu.
REFERENCES
- 1.Boyd NF, Guo H, Martin LJ, Sun L, Stone J, Fishell E, et al. Mammographic density and the risk and detection of breast cancer. N Engl J Med. 2007;356(3):227–236. doi: 10.1056/NEJMoa062790. [DOI] [PubMed] [Google Scholar]
- 2.Tice JA, Cummings SR, Smith-Bindman R, Ichikawa L, Barlow WE, Kerlikowske K. Using clinical factors and mammographic breast density to estimate breast cancer risk: development and validation of a new predictive model. Ann Intern Med. 2008;148(5):337–347. doi: 10.7326/0003-4819-148-5-200803040-00004. [DOI] [PMC free article] [PubMed] [Google Scholar]
- 3.Kerlikowske K, Grady D, Barclay J, Sickles EA, Ernster V. Effect of age, breast density, and family history on the sensitivity of first screening mammography. JAMA. 1996;276(1):33–38. [PubMed] [Google Scholar]
- 4.Buist DS, Porter PL, Lehman C, Taplin SH, White E. Factors contributing to mammography failure in women aged 40–49 years. Journal of the National Cancer Institute. 2004;96(19):1432–1440. doi: 10.1093/jnci/djh269. [DOI] [PubMed] [Google Scholar]
- 5.Carney PA, Miglioretti DL, Yankaskas BC, Kerlikowske K, Rosenberg R, Rutter CM, et al. Individual and combined effects of age, breast density, and hormone replacement therapy use on the accuracy of screening mammography. Ann Intern Med. 2003;138(3):168–175. doi: 10.7326/0003-4819-138-3-200302040-00008. [DOI] [PubMed] [Google Scholar]
- 6.Pisano ED, Gatsonis C, Hendrick E, Yaffe M, Baum JK, Acharyya S, et al. Diagnostic performance of digital versus film mammography for breast-cancer screening. N Engl J Med. 2005;353(17):1773–1783. doi: 10.1056/NEJMoa052911. [DOI] [PubMed] [Google Scholar]
- 7.Dehkordy SF, Carlos RC. Dense breast legislation in the United States: state of the states. J Am Coll Radiol. 2013;10(12):899–902. doi: 10.1016/j.jacr.2013.09.007. [DOI] [PubMed] [Google Scholar]
- 8.Lee CI, Bassett LW, Lehman CD. Breast density legislation and opportunities for patient-centered outcomes research. Radiology. 2012;264(3):632–636. doi: 10.1148/radiol.12120184. [DOI] [PubMed] [Google Scholar]
- 9.U.S. Congress. H.R. 3404 Breast Density and Mammography Reporting Act of 2013. U.S. Congress; 2013. [Accessed at on June 30, 2014]. https://www.govtrack.us/congress/bills/113/hr3404/text. [Google Scholar]
- 10.Kerlikowske K, Zhu W, Hubbard RA, Geller B, Dittus K, Braithwaite D, et al. Outcomes of screening mammography by frequency, breast density, and postmenopausal hormone therapy. JAMA Intern Med. 2013;173(9):807–816. doi: 10.1001/jamainternmed.2013.307. [DOI] [PMC free article] [PubMed] [Google Scholar]
- 11.American College of Radiology. ACR Breast Imaging Reporting and Data System, Breast Imaging Atlas. 4th Edition. Reston, VA: American College of Radiology; 2003. ACR BI-RADS® - Mammography. [Google Scholar]
- 12.American College of Radiology. ACR Statement on Reporting Density in Mammography Reports and Patient Summaries. Reston, VA: 2012. [Accessed at on June 30, 2014]. http://www.acr.org/About-Us/Media-Center/Position-Statements/Position-Statements-Folder/Statement-on-Reporting-Breast-Density-in-Mammography-Reports-and-Patient-Summaries. [Google Scholar]
- 13.Brower V. Breast density legislation fueling controversy. J Natl Cancer Inst. 2013;105(8):510–511. doi: 10.1093/jnci/djt086. [DOI] [PubMed] [Google Scholar]
- 14.Smith ML. The density conundrum: does legislation help or hurt? J Am Coll Radiol. 2013;10(12):909–912. doi: 10.1016/j.jacr.2013.09.012. [DOI] [PubMed] [Google Scholar]
- 15.D’Orsi CJ, Sickles EA. To seek perfection or not? That is the question. Radiology. 2012;265(1):9–11. doi: 10.1148/radiol.12121515. [DOI] [PubMed] [Google Scholar]
- 16.Berg WA, Blume JD, Cormack JB, Mendelson EB, Lehrer D, Bohm-Velez M, et al. Combined screening with ultrasound and mammography vs mammography alone in women at elevated risk of breast cancer. JAMA. 2008;299(18):2151–2163. doi: 10.1001/jama.299.18.2151. [DOI] [PMC free article] [PubMed] [Google Scholar]
- 17.Nothacker M, Duda V, Hahn M, Warm M, Degenhardt F, Madjar H, et al. Early detection of breast cancer: benefits and risks of supplemental breast ultrasound in asymptomatic women with mammographically dense breast tissue. A systematic review. BMC cancer. 2009;9:335. doi: 10.1186/1471-2407-9-335. [DOI] [PMC free article] [PubMed] [Google Scholar]
- 18.Kolb TM, Lichy J, Newhouse JH. Comparison of the performance of screening mammography, physical examination, and breast US and evaluation of factors that influence them: an analysis of 27,825 patient evaluations. Radiology. 2002;225(1):165–175. doi: 10.1148/radiol.2251011667. [DOI] [PubMed] [Google Scholar]
- 19.Hooley RJ, Greenberg KL, Stackhouse RM, Geisel JL, Butler RS, Philpotts LE. Screening US in patients with mammographically dense breasts: initial experience with Connecticut Public Act 09–41. Radiology. 2012;265(1):59–69. doi: 10.1148/radiol.12120621. [DOI] [PubMed] [Google Scholar]
- 20.Parris T, Wakefield D, Frimmer H. Real world performance of screening breast ultrasound following enactment of Connecticut Bill 458. Breast J. 2013;19(1):64–70. doi: 10.1111/tbj.12053. [DOI] [PubMed] [Google Scholar]
- 21.Weigert J, Steenbergen S. The connecticut experiment: the role of ultrasound in the screening of women with dense breasts. Breast J. 2012;18(6):517–22. doi: 10.1111/tbj.12003. [DOI] [PubMed] [Google Scholar]
- 22.Berg WA, Zhang Z, Lehrer D, Jong RA, Pisano ED, Barr RG, et al. Detection of breast cancer with addition of annual screening ultrasound or a single screening MRI to mammography in women with elevated breast cancer risk. JAMA. 2012;307(13):1394–1404. doi: 10.1001/jama.2012.388. [DOI] [PMC free article] [PubMed] [Google Scholar]
- 23.Clarke LD, Plevritis SK, Boer R, Cronin KA, Feuer EJ. A comparative review of CISNET breast models used to analyze U.S. breast cancer incidence and mortality trends. J Natl Cancer Inst Monogr. 2006;(36):96–105. doi: 10.1093/jncimonographs/lgj013. [DOI] [PubMed] [Google Scholar]
- 24.Mandelblatt JS, Cronin KA, Bailey S, Berry DA, de Koning HJ, Draisma G, et al. Effects of mammography screening under different screening schedules: model estimates of potential benefits and harms. Ann Intern Med. 2009;151(10):738–747. doi: 10.1059/0003-4819-151-10-200911170-00010. [DOI] [PMC free article] [PubMed] [Google Scholar]
- 25.van Ravesteyn NT, Miglioretti DL, Stout NK, Lee SJ, Schechter CB, Buist DS, et al. Tipping the balance of benefits and harms to favor screening mammography starting at age 40 years: a comparative modeling study of risk. Ann Intern Med. 2012;156(9):609–617. doi: 10.1059/0003-4819-156-9-201205010-00002. [DOI] [PMC free article] [PubMed] [Google Scholar]
- 26.Tan SY, van Oortmarssen GJ, de Koning HJ, Boer R, Habbema JD. The MISCAN-Fadia continuous tumor growth model for breast cancer. J Natl Cancer Inst Monogr. 2006;(36):56–65. doi: 10.1093/jncimonographs/lgj009. [DOI] [PubMed] [Google Scholar]
- 27.Mandelblatt J, Schechter CB, Lawrence W, Yi B, Cullen J. The SPECTRUM population model of the impact of screening and treatment on U.S. breast cancer trends from 1975 to 2000: principles and practice of the model methods. J Natl Cancer Inst Monogr. 2006;(36):47–55. doi: 10.1093/jncimonographs/lgj008. [DOI] [PubMed] [Google Scholar]
- 28.Fryback DG, Stout NK, Rosenberg MA, Trentham-Dietz A, Kuruchittham V, Remington PL. The Wisconsin Breast Cancer Epidemiology Simulation Model. J Natl Cancer Inst Monogr. 2006;(36):37–47. doi: 10.1093/jncimonographs/lgj007. [DOI] [PubMed] [Google Scholar]
- 29.Feuer EJ. Modeling the impact of adjuvant therapy and screening mammography on U.S. breast cancer mortality between 1975 and 2000: introduction to the problem. J Natl Cancer Inst Monogr. 2006;(36):2–6. doi: 10.1093/jncimonographs/lgj002. [DOI] [PubMed] [Google Scholar]
- 30.Berry DA, Cronin KA, Plevritis SK, Fryback DG, Clarke L, Zelen M, et al. Effect of screening and adjuvant therapy on mortality from breast cancer. N Engl J Med. 2005;353(17):1784–1792. doi: 10.1056/NEJMoa050518. [DOI] [PubMed] [Google Scholar]
- 31.Barlow WE, White E, Ballard-Barbash R, Vacek PM, Titus-Ernstoff L, Carney PA, et al. Prospective breast cancer risk prediction model for women undergoing screening mammography. J Natl Cancer Inst. 2006;98(17):1204–1214. doi: 10.1093/jnci/djj331. [DOI] [PubMed] [Google Scholar]
- 32.Stout NK, Lee SJ, Schechter CB, Kerlikowske K, Alagoz O, Berry D, et al. Benefits, Harms, and Costs for Breast Cancer Screening After US Implementation of Digital Mammography. J Natl Cancer Inst. 2014;106(6):dju092. doi: 10.1093/jnci/dju092. [DOI] [PMC free article] [PubMed] [Google Scholar]
- 33.Gartlehner G, Thaler K, Chapman A, Kaminski-Hartenthaler A, Berzaczy D, Van Noord MG, et al. Mammography in combination with breast ultrasonography versus mammography for breast cancer screening in women at average risk. The Cochrane database of systematic reviews. 2013;4:CD009632. doi: 10.1002/14651858.CD009632.pub2. [DOI] [PMC free article] [PubMed] [Google Scholar]
- 34.Hanmer J, Lawrence WF, Anderson JP, Kaplan RM, Fryback DG. Report of nationally representative values for the non institutionalized US adult population for 7 health-related quality-of-life scores. Medical decision making : an international journal of the Society for Medical Decision Making. 2006;26(4):391–400. doi: 10.1177/0272989X06290497. [DOI] [PubMed] [Google Scholar]
- 35.Stout NK, Rosenberg MA, Trentham-Dietz A, Smith MA, Robinson SM, Fryback DG. Retrospective cost-effectiveness analysis of screening mammography. J Natl Cancer Inst. 2006;98(11):774–782. doi: 10.1093/jnci/djj210. [DOI] [PubMed] [Google Scholar]
- 36.de Haes JC, de Koning HJ, van Oortmarssen GJ, van Agt HM, de Bruyn AE, van Der Maas PJ. The impact of a breast cancer screening programme on quality-adjusted life-years. International Journal of Cancer. 1991;49(4):538–544. doi: 10.1002/ijc.2910490411. [DOI] [PubMed] [Google Scholar]
- 37.Yabroff KR, Lamont EB, Mariotto A, Warren JL, Topor M, Meekins A, et al. Cost of care for elderly cancer patients in the United States. Journal of the National Cancer Institute. 2008;100(9):630–641. doi: 10.1093/jnci/djn103. [DOI] [PubMed] [Google Scholar]
- 38.Gold MR, Siegel JE, Russell LB, Weinstein MC. Cost-effectiveness in health and medicine. New York: Oxford University Press; 1996. [Google Scholar]
- 39.Tosteson AN, Fryback DG, Hammond CS, Hanna LG, Grove MR, Brown M, et al. Consequences of false-positive screening mammograms. JAMA Intern Med. 2014;174(6):954–961. doi: 10.1001/jamainternmed.2014.981. [DOI] [PMC free article] [PubMed] [Google Scholar]
- 40.Kelly KM, Dean J, Comulada WS, Lee SJ. Breast cancer detection using automated whole breast ultrasound and mammography in radiographically dense breasts. Eur Radiol. 2010;20(3):734–742. doi: 10.1007/s00330-009-1588-y. [DOI] [PMC free article] [PubMed] [Google Scholar]
- 41.Giuliano V, Giuliano C. Improved breast cancer detection in asymptomatic women using 3D–automated breast ultrasound in mammographically dense breasts. Clin Imaging. 2013;37(3):480–486. doi: 10.1016/j.clinimag.2012.09.018. [DOI] [PubMed] [Google Scholar]
- 42.Kerlikowske K, Hubbard RA, Miglioretti DL, Geller BM, Yankaskas BC, Lehman CD, et al. Comparative effectiveness of digital versus film-screen mammography in community practice in the United States: a cohort study. Ann Intern Med. 2011;155(8):493–502. doi: 10.7326/0003-4819-155-8-201110180-00005. [DOI] [PMC free article] [PubMed] [Google Scholar]