

Abstract
Gorillas include separate eastern (Gorilla beringei) and western (Gorilla gorilla) African species that diverged from each other approximately 2 million years ago. Although anatomical, genetic, behavioral, and socioecological differences have been noted among gorilla populations, little is known about variation in their brain structure. This study examines neuroanatomical variation between gorilla species using structural neuroimaging. Postmortem magnetic resonance images were obtained of brains from 18 captive western lowland gorillas (Gorilla gorilla gorilla), 15 wild mountain gorillas (Gorilla beringei beringei), and 3 Grauer's gorillas (Gorilla beringei graueri) (both wild and captive). Stereologic methods were used to measure volumes of brain structures, including left and right frontal lobe gray and white matter, temporal lobe gray and white matter, parietal and occipital lobes gray and white matter, insular gray matter, hippocampus, striatum, thalamus, each hemisphere and the vermis of the cerebellum, and the external and extreme capsules together with the claustrum. Among the species differences, the volumes of the hippocampus and cerebellum were significantly larger in G. gorilla than G. beringei. These anatomical differences may relate to divergent ecological adaptations of the two species. Specifically, G. gorilla engage in more arboreal locomotion and thus may rely more on cerebellar circuits. In addition, they tend to eat more fruit and have larger home ranges and consequently might depend more on spatial mapping functions of the hippocampus.
Keywords: primate brain evolution, cerebellum, hippocampus
Gorillas are diverse and widespread African great apes that include two geographically distinct species: western gorillas (Gorilla gorilla) and eastern gorillas (G. beringei) (Groves, 2001; Grubb et al., 2003). The latter includes two subspecies, mountain gorillas (G. beringei beringei) and Grauer's gorillas (G. beringei graueri). The two gorilla species diverged approximately two million years ago (perhaps with subsequent gene flow between the western and eastern populations), based on analyses of mitochondrial and nuclear DNA (Jensen-Seaman et al., 2003; Scally et al., 2012); this genetic difference is similar in magnitude to that observed between chimpanzees and bonobos (Jensen-Seaman et al., 2003). Extensive anatomical, genetic, behavioral, and socioecological differences have been observed among gorillas throughout their distribution in Africa. Mountain gorillas are more likely than western lowland gorillas to have multi-male groups (Yamagiwa et al., 2001; Robbins, 2007). Mountain gorillas in the Virungas are almost entirely folivorous (Goldsmith, 2003; Tutin, 2003; Watts, 1996, 2003; Robbins, 2007), are much more terrestrial than other subspecies, and have smaller home ranges (Doran, 1996; Taylor, 1997; Doran and McNeilage, 2001; Caillaud et al., 2014). Mountain gorillas in Bwindi and Grauer's gorillas in high altitude habitats are also highly folivorous, but eat considerable fruit when it is available and show levels of frugivory and arboreal feeding intermediate between Virunga gorillas and western lowland gorillas, which are the most frugivorous of the taxa (Yamigawa et al., 1994; Robbins and McNeilage, 2003; Yamigawa et al., 2003). Virunga mountain gorillas have a faster life history in many respects than either western lowland or Grauer's gorillas, with earlier ages of first birth, earlier weaning, and higher fertility overall (Yamagiwa and Kahekwa, 2001; Robbins et al., 2004, 2009; Breuer et al, 2009), as well as remarkably fast development of adult brain size (McFarlin et al., 2013). Furthermore, morphological differences between western and eastern gorillas have been reported in the scapula (Schultz, 1934; Taylor, 1997), foot (Tocheri et al., 2011; Dunn et al., 2014), and dentition (Leigh et al., 2003).
The possibility that brain organization also differs between these gorilla species has not yet been fully addressed. Barks et al. (2014) reported a pattern of cortical folding prevalent in eastern gorillas but rare in western gorillas and other great apes, possibly related to a genetic bottleneck in the eastern populations. A preliminary study comparing neuroanatomical variation in a small sample of gorillas among other great apes (Sherwood et al., 2004) noted two differences between the gorilla species: mountain gorillas had a relatively larger striatum and relatively smaller cerebellum than western lowland gorillas. The present research analyzes data from a much larger sample of gorillas across a range of ages, providing a better representation of within-species variation. Although the brains of great ape species are in many ways quite similar overall in terms of the size of neural structures (Sherwood et al., 2004), differences among them can highlight the mosaic nature of brain evolution in which specializations occur in response to the sensorimotor and cognitive demands of local ecological conditions.
Methods
Sample
Postmortem magnetic resonance (MR) brain images were obtained from a total of 36 gorillas, including captive western lowland gorillas (Gorilla gorilla gorilla), wild mountain gorillas from the Virunga massif (Gorilla beringei beringei), and both wild and captive Grauer's gorillas (Gorilla beringei graueri) (Table 1). All animals included in this study died from non-neurological causes.
Table 1. Individual data.
| Subject | Sex | Age (years) | Rearing history | Brain volume (cm3) |
|---|---|---|---|---|
| Mountain gorillas (Gorilla beringei beringei) | ||||
|
| ||||
| 0003 | male | 1.6 | wild | 445.6 |
| 0012 | male | adult | wild | 488.9 |
| 0005 | male | 5.5 | wild | 411.7 |
| 0045 | female | adult | wild | 369.4 |
| 0046 | female | 33 | wild | 398.1 |
| 0002 | female | 1.3 | wild | 326.0 |
| 0006 | female | 1.5 | wild | 360.5 |
| 0029 | male | adult | wild | 293.4* |
| 0030 | female | 39 | wild | 406.0 |
| 0035 | female | 16 | wild | 358.9 |
| 0032 | male | 31.5 | wild | 434.6 |
| 0033 | female | adult | wild | 359.8 |
| 0034 | female | 2.5 | wild | 336.4 |
| 0004 | unknown | unknown | wild | 363.5 |
| 0007 | female | 2.8 | wild | 410.3 |
| Grauer's gorillas (Gorilla beringei graueri) | ||||
|
| ||||
| 9907 | male | 51 | captive | 442.7 |
| 0049 | female | juvenile | wild | 372.4 |
| 0028 | male | juvenile | wild | 430.7 |
| Western lowland gorillas (Gorilla gorilla gorilla) | ||||
|
| ||||
| 0224 | female | 43 | captive | 380.5 |
| 0897 | male | 21 | captive | 435.2 |
| 0653 | male | 27 | captive | 488.3 |
| 0506 | male | 31 | captive | 449.2 |
| 0015 | female | 50 | captive | 490.2 |
| 0393 | female | 44 | captive | 339.0 |
| 0062 | female | 55 | captive | 461.5 |
| 1108 | male | 8 | captive | 540.4 |
| 0820 | female | 13 | captive | 417.2 |
| 0783 | male | 25 | captive | 459.4 |
| 0444 | male | 34 | captive | 433.4 |
| 0713 | female | 44 | captive | 380.7 |
| 0191 | female | 41 | captive | 401.8 |
| 0232 | male | 31 | captive | 346.4 |
| 0072 | male | 49 | captive | 445.7 |
| 0234 | female | 48 | captive | 490.7 |
| 0172 | female | 49 | captive | 326.2 |
| 0115 | male | 42 | captive | 564.3 |
Cerebellum is missing
G. beringei beringei brains came from a wild population in the Volcanoes National Park in Rwanda, monitored daily by the Rwanda Development Board, the Dian Fossey Gorilla Fund International's Karisoke Research Center, and the Mountain Gorilla Veterinary Project. When deceased mountain gorilla remains were encountered during daily monitoring (typically within 24 hours of death), a postmortem necropsy examination was performed, which included collection of brain tissue whenever preservation conditions permitted. One G. beringei beringei brain in our sample is from a population in the Parc National des Virunga in the Democratic Republic of Congo (DRC). The two wild G. beringei graueri individuals in this sample are from DRC: one originated from the Mount Tshiaberimu population, and one is from an unknown population. Captive G. gorilla and G. beringei graueri brains were obtained from zoos in the United States and from the Yerkes National Primate Research Center. The research presented here is in accordance with the American Society of Primatologists Principles for the Ethical Treatment of Nonhuman Primates and adhered to the legal requirements of Rwanda.
MR image acquisition
MR images of G. beringei brains were acquired on a Siemens 3 T Allegra (Siemens Medical System, Erlangen, Germany) running Syngo 2002B software. Coronal T1-weighted MR images were acquired through the entire brain with repetition time (TR) = 2500 ms and echo time (TE) = 4.4 ms with an echo-train of 1. Slices were obtained as 0.7-mm-thick contiguous sections with a matrix size of 256 × 256 and a field of view (FOV) of 18.0 cm × 18.0 cm, resulting in a final voxel size of 0.7 mm isotropic. For G. gorilla brains, either 4.7 or 7 T magnets were used and T2-weighted images were collected in the transverse plane using a gradient echo protocol (pulse repetition = 22.0 s, echo time = 78.0 ms, number of signals averaged = 8-12, and a 256 × 192 matrix reconstructed to 256 × 256), with a final voxel size of 0.7 mm isotropic. There was sufficient contrast in all images to clearly identify the boundaries of the anatomical structures measured.
Measurement of brain structure volumes
Analyses of brain structure volumes were performed on the complete sample of 36 gorillas, including G. beringei beringei (n = 15; five male, nine female, one unknown sex; age range 1.6–39 years including some adults of unknown age), G. gorilla (n = 18; nine male, nine female, age range 8–55 years), and G. beringei graueri (n = 3; including one captive male age 51, one wild juvenile male, and one wild juvenile female, exact ages unknown but younger than 6 years).
Using the Cavalieri point-counting method (Gunderson et al., 1988), we measured the volume (in cm3) of the gray matter and white matter (separately) of regions listed in Table 2. MR images were initially viewed in all orthogonal planes and three-dimensional reconstructions were created using ITK-SNAP (Yushkevich et al., 2006; www.itksnap.org). Lines indicating the central sulcus, lateral sulcus, circular insular sulcus, amygdala-hippocampal transition, and parieto-occipital sulcus were drawn in three dimensions. A series of coronal images were then exported, and loaded into Image J (Schneider et al., 2012) for point-counting using custom macros. Systematic-random point sampling in all three dimensions was optimized to produce an average stereological coefficient of error (CE) of less than 5% (Gundersen and Jensen, 1987; see Table 2). Points for each region were superimposed over each image (Fig. 1), and a trained analyst manually identified which points fell within the region.
Table 2.
Stereological sampling of brains.
| Region | Hemisphere | Average number points counted | CE |
|---|---|---|---|
| Frontal Gray | L | 191.1 | 0.026 |
| R | 192.1 | 0.031 | |
| Frontal White | L | 124.6 | 0.034 |
| R | 130.4 | 0.028 | |
|
| |||
| Temporal Gray | L | 141.3 | 0.037 |
| R | 149.5 | 0.036 | |
| Temporal White | L | 77.6 | 0.052 |
| R | 86.5 | 0.054 | |
|
| |||
| Parietal&Occipital Gray | L | 531.5 | 0.021 |
| R | 528.6 | 0.017 | |
| Parietal&Occipital White | L | 375.4 | 0.026 |
| R | 357.8 | 0.027 | |
|
| |||
| Insula | L | 205.5 | 0.018 |
| R | 206.1 | 0.021 | |
|
| |||
| External capsule/ claustrum/extreme capsule | L | 195.0 | 0.020 |
| R | 193.6 | 0.021 | |
|
| |||
| Cerebellar Hemisphere | L | 220.9 | 0.029 |
| R | 207.1 | 0.026 | |
| Cerebellar Vermis | bilateral | 197.6 | 0.041 |
|
| |||
| Amygdala | L | 140.3 | 0.033 |
| R | 135.8 | 0.027 | |
|
| |||
| Hippocampus | L | 229.4 | 0.013 |
| R | 230.9 | 0.014 | |
|
| |||
| Striatum | L | 179.2 | 0.017 |
| R | 181.8 | 0.014 | |
|
| |||
| Thalamus | bilateral | 237.1 | 0.013 |
Figure 1.
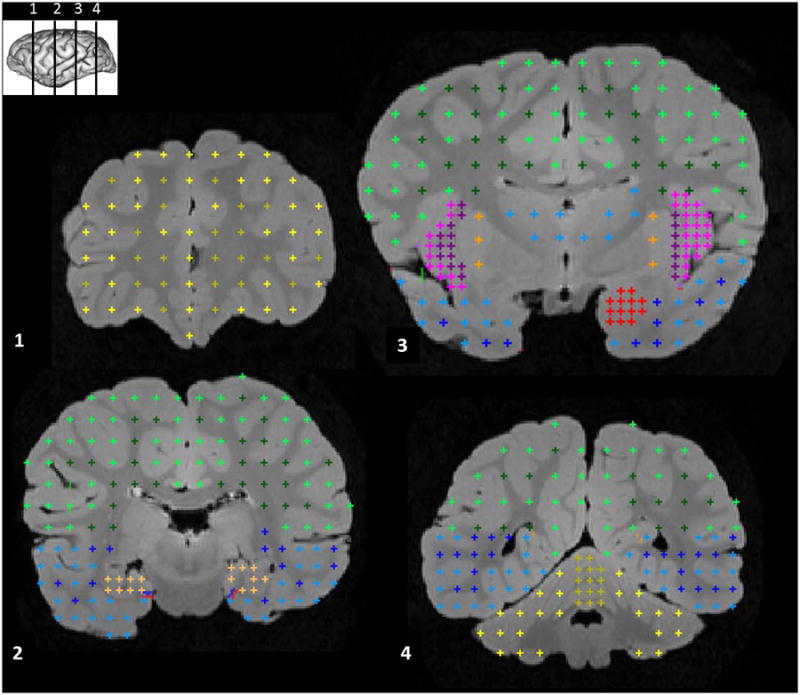
Example of measures of brain structure volume using stereology. Four coronal sections from a mountain gorilla brain are shown, anterior to posterior (see inset for level of each section). Structures shown, section 1: frontal gray (light yellow) and white matter (dark yellow). Section 2: parietal and occipital gray (light green) and white matter (dark green), temporal gray (light blue) and white matter (dark blue), hippocampus (tan). Section 3: parietal and occipital gray (light green) and white matter (dark green), thalamus (medium blue), insula gray (pink), external capsule/claustrum/extreme capsule (purple), striatum (orange), amygdala (red), temporal gray (light blue) and white matter (dark blue). Section 4: parietal and occipital gray (light green) and white matter (dark green), cerebellar vermis (dark yellow) and hemispheres (light yellow).
The recorded locations for all points/regions were subsequently reviewed and anatomy was corrected as necessary by three authors (SB, MC, CS; see Fig. 1). Volume of each region was calculated as the product of the number of points counted, the point area, and slice sample-spacing. A “cloud” of all points sampled in one mountain gorilla brain is presented in Figure 2, representing the complete volume of all structures measured. The cerebral lobar subdivisions were modified from Semendeferi and Damasio (2000) as follows. The central sulcus was designated as the posterior limit of the frontal lobe. The posterior limit of the temporal lobe was defined on the lateral surface of the brain as a straight line connecting the preoccipital notch and the posterior end of the sylvian fissure, and on the mesial surface as a line connecting the preoccipital notch and the caudal end of the hippocampal sulcus. The parietal and occipital lobes were combined into one region, demarcated anteriorly by the central sulcus and the posterior boundaries of the temporal lobe described above. Following Allen et al. (2008), the insula was defined laterally by the circular sulcus and mesially by a line linking the deepest extents of the two ends of that sulcus.
Figure 2.
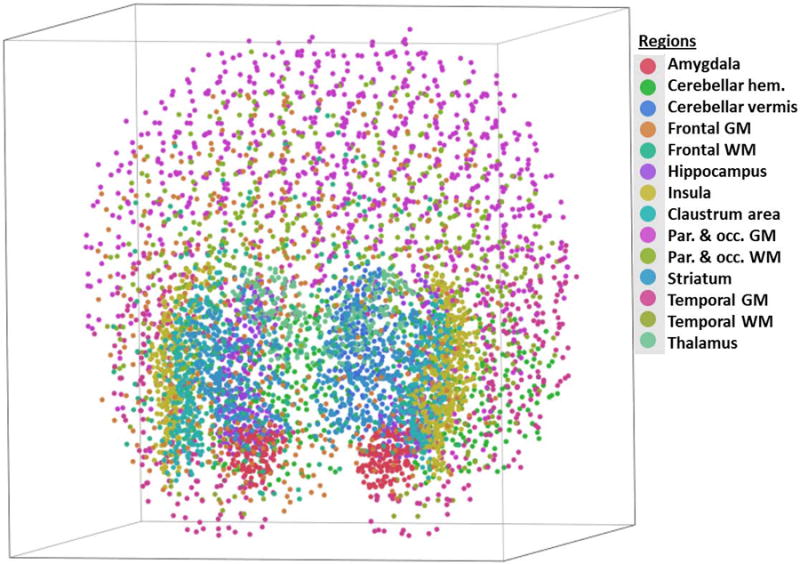
3-D “cloud” of all points measured in one mountain gorilla brain, representing the complete volume of all structures measured. “Claustrum area” refers to the region encompassing external capsule, claustrum, and extreme capsule.
Statistical analyses
We used PAST (Paleontological Statistics) software, version 2.17c (Hammer et al., 2001) to perform principal component analyses (PCA) as an initial approach to explore the data. Two PCAs were performed: one including absolute values of measures, and a second including each measure's proportion of the total volume measured from the sum of all regions of interest. We examined proportional volume in order to account for variation in shrinkage across specimens resulting from fixation of postmortem tissue. In SPSS Statistics v. 21 (SPSS Statistics for Windows, Version 21.0., IBM, Armonk, NY), pairwise Mann-Whitney U tests, corrected for multiple comparisons (corrected α = 0.002), were performed on all pairs of measures for which PCAs showed a significant separation between the G. beringei and G. gorilla populations. Interaction effects of sex and species were assessed with a two-way ANOVA.
Results
Total brain volume did not differ significantly between the two species, either within the entire sample or among adults only (Table 1). Because G. beringei graueri falls between G. gorilla and G. beringei beringei in a number of socioecological factors, we examined brain volume data both with and without the three G. beringei graueri individuals. The mean brain volume of all G. beringei in this sample was 389.4 cm3 (standard deviation 49.09), and of all G. gorilla was 419.6 cm3 (SD 69.42) (Mann-Whitney U = 107, p = 0.085). The mean of all G. beringei beringei (i.e., exclusive of G. beringei graueri) was 384.2 cm3 (SD 50.52). Within adults of each species, there was no significant difference between male and female brain volumes. Mean brain volume of adult female G. beringei was 374.9 cm3 (SD 26.91) and of adult male G. beringei was 405.6 cm3 (SD 100.90) (Mann-Whitney U = 3, p = 0.7); mean brain volume of adult female G. gorilla was 409.8 cm3 (SD 60.72) and of adult male G. gorilla was 429.3 cm3 (SD 79.60) (Mann-Whitney U = 33, p = 0.815). Adult and juvenile/infant (i.e. younger than 6 years, following Robbins (2007)) G. beringei did not significantly differ in their brain volume (adult mean brain volume was 386.4 cm3, SD 63.04; juvenile/infant mean brain volume was 383.3 cm3, SD 40.91) (Mann-Whitney U = 30, p = 0.918; the G. gorilla sample did not contain any juvenile or infant specimens.)
In the PCA of brain structure volumes, the first 7 PCs explained 95% of the total variance (Fig. 3A). G. beringei and G. gorilla populations overlapped in their distributions on the first two PCs, but displayed greater separation on PC 3, which loads primarily on the bilateral cerebellar hemispheres, bilateral frontal gray matter, and bilateral parietal and occipital white matter (Fig. 3B, C). In the PCA of proportion of total brain structure volumes measured (i.e. each structure's ratio to total measurement), the first 3 PCs explained 91% of the total variance (Fig. 3D). G. beringei and G. gorilla populations showed the most separation on PC 2, which loads primarily on the cerebellum, bilateral frontal gray matter, and white and gray matter of the parietal and occipital lobes (Fig. 3E, F).
Figure 3.
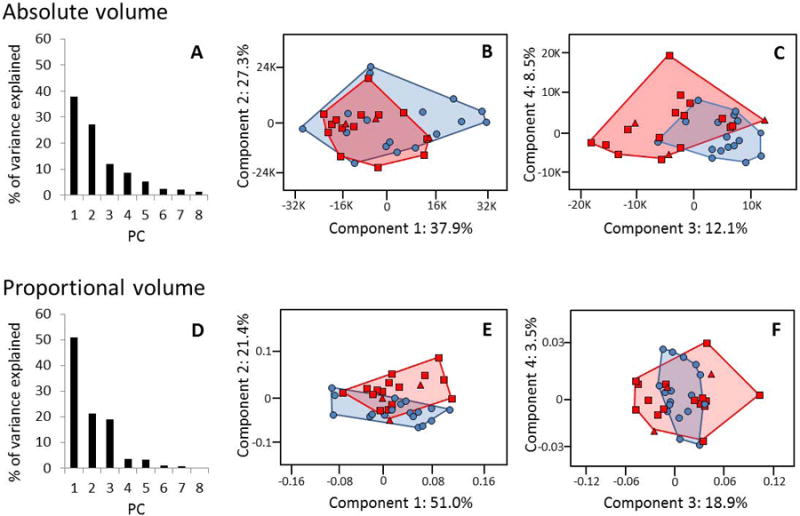
PCA results. Blue circles represent G. gorilla; red squares represent G. b. beringei; red triangles represent G. b. graueri. A. Variance explained by each principal component (PC) for absolute volume of brain structures. B. PCA plot for absolute volumes, PCs 1 and 2. C. PCA plot for absolute volumes, PCs 3 and 4. D. Variance explained by each PC for proportional volume of brain structures. E. PCA plot for proportional volumes, PCs 1 and 2. F. PCA plot for proportional volumes, PCs 3 and 4.
G. beringei graueri were not analyzed separately because of their small sample size (n = 3), but tended to cluster with G. beringei beringei in PCAs. The data from the single captive adult G. beringei graueri fell closer to the G. gorilla sample than the two wild juvenile subjects. The PCA results do not change significantly if G. beringei graueri subjects are removed from the analyses: in the PCA of absolute volumes, the first 7 PCs explain 96% of the total variance, and G. gorilla and G. beringei beringei again separate on PC 3, which loads primarily on the bilateral cerebellar hemispheres, bilateral frontal gray matter, and bilateral parietal and occipital white matter. In the PCA of proportional volumes, the first 3 PCs explained 91% of the total variance. G. gorilla and G. beringei again separated on PC 2, which loads on the cerebellum, bilateral frontal gray and white matter, and parietal and occipital gray and white matter.
Follow-up Mann-Whitney pairwise tests of absolute volumes showed significant differences between the two species, with larger volumes in G. gorilla than in G. beringei for the left hippocampus (U = 29, p < 0.000), right hippocampus (U = 43, p < 0.000), left cerebellar hemisphere (Mann-Whitney U = 63, p = 0.002), and vermis of the cerebellum (U = 26.5, p < 0.000) (Fig. 4A). Other differences were non-significant after correction for multiple comparisons. Pairwise tests of proportional volumes also showed a significantly larger volume of the left hippocampus in G. gorilla compared to G. beringei (U = 41, p < 0.000), and significantly larger volume of right frontal gray matter (U = 58.5, p = 0.001) and right striatum (U = 63.5, p = 0.002) in G. beringei compared to G. gorilla (Fig. 4B). No other differences in proportional volumes were significant after correction for multiple comparisons. However, the cerebellar regions that were significantly different between the two species in comparisons of absolute volumes approached significance: the left cerebellar hemisphere (Mann-Whitney U = 70.5, p = 0.003) and cerebellar vermis (Mann-Whitney U = 66, p = 0.003) were both larger in G. gorilla than in G. beringei.
Figure 4.
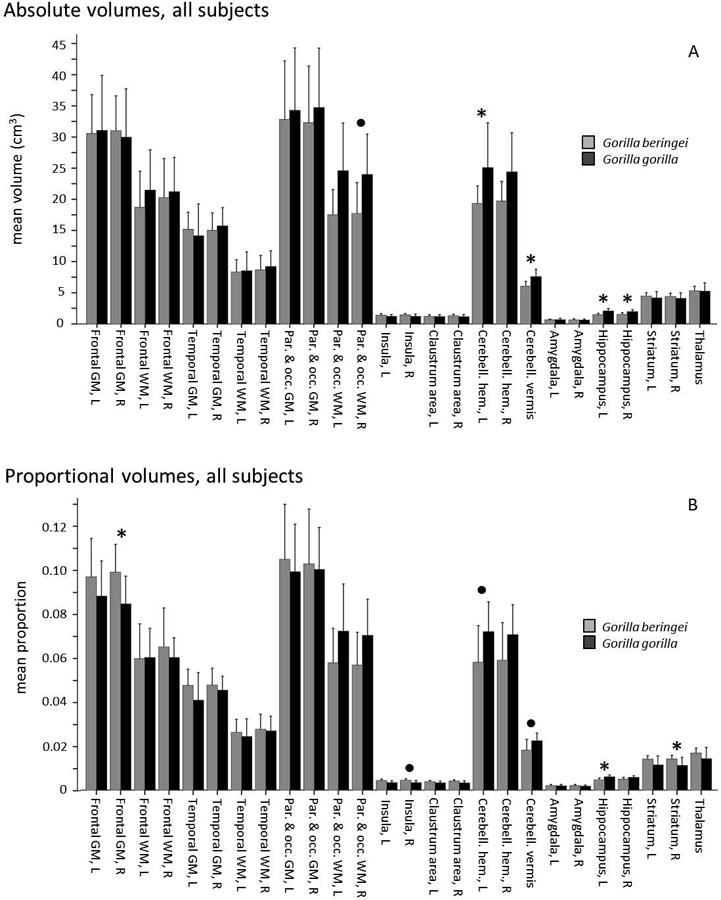
Comparison of mean brain structure volumes in eastern (G.b.b., gray) and western gorillas (G.g.g., black), all subjects, assessed by Mann-Whitney pairwise tests. Error bars indicate +1 SD. Asterisks denote significant differences after correction for multiple comparisons, p < 0.05 (corrected α = 0.002). Bullets denote significant differences after correction for multiple comparisons, p < 0.10 (corrected α = 0.004). “Claustrum area” refers to the region encompassing external capsule, claustrum, and extreme capsule. A. Absolute volume (cm3). B. Proportional volume.
Because the G. beringei sample in this study contained a large number of juveniles and infants, we also analyzed these brain structure measurements with the sample restricted to only adults. This age-range restriction removes two out of three G. beringei graueri from the sample in the analyses that follow. Pairwise tests of absolute volumes in adults showed a significant difference (G. gorilla > G. beringei) in the cerebellar vermis (Mann-Whitney U = 18, p = 0.001) and left hippocampus (U = 23, p = 0.001) (Fig. 5A). Pairwise tests of proportional volumes in adults showed a significant difference in the right frontal white matter, with G. beringei larger than G. gorilla (U = 23, p = 0.002) (Fig. 5B).
Figure 5.

Comparison of mean brain structure volumes in eastern (G.b.b., gray) and western gorillas (G.g.g., black), adult subjects, assessed by Mann-Whitney pairwise tests. Error bars indicate +1 SD. Asterisks denote significant differences after correction for multiple comparisons (corrected α = 0.002). “Claustrum area” refers to the region encompassing external capsule, claustrum, and extreme capsule. A. Absolute volume (cm3). B. Proportional volume.
Captive western lowland gorillas in this sample varied in their place of birth (either in the wild or in captivity) and in rearing condition (either parent-reared or hand-reared). A PCA of brain structure volumes did not reveal any separation among these groups, nor did follow-up Mann-Whitney pairwise tests.
Age- and sex-related variation in Gorilla beringei
Within G. beringei we compared brain structure volumes in adults versus juveniles/infants, defining “adult” as older than age 10 years (n = 7 adults, 9 juveniles/infants), the median age for first birth in mountain gorillas (Watts 1991). Note that our sample does not include any individuals between age 6 and 16, ensuring that all individuals described as adults are fully mature. No significant differences were observed in pairwise tests between these two age groups in either absolute or proportional volume of any brain structure after correction for multiple comparisons.
No significant differences in either absolute or proportional volume were observed in pairwise tests between males and females for any brain structure, nor were significant interaction effects of sex and species observed in a two-way ANOVA. Males and females did not separate in any PCA.
Discussion
We examined variation in brain structure volumes among gorillas using neuroimaging. Our results demonstrated that gorilla species differ in the size of particular regions, despite displaying similar overall brain size, suggesting that neuroanatomical specializations have been shaped by selection in response to species-typical ecological conditions. Notably, the hippocampus was both absolutely and proportionately larger in G. gorilla than in G. beringei in comparisons of the entire sample, and its absolute volume was significantly larger in adult G. gorilla than in adult G. beringei (when juveniles are removed from the sample, the difference in the left hippocampus in proportional volumes is present with a significance level of p = 0.004, equivalent to an uncorrected level of 0.15). Also, absolute volumes of cerebellar substructures were significantly larger in G. gorilla than in G. beringei, for both the entire sample and for adults only. This difference also approaches conventional levels of statistical significance in a comparison of proportional volumes (p < 0.1 before correction for multiple comparisons; corrected α = 0.004). In contrast, areas that have significantly larger proportional volumes in G. beringei than in G. gorilla—right frontal gray matter, right frontal white matter, and right striatum—were not significantly different in absolute volumes, with a lowest significance level of p = 0.211. In considering these results overall, we interpret the larger hippocampus and cerebellum in G. gorilla as the most robust findings in this study.
These anatomical differences may reflect divergent ecological adaptations between the two species. First, western lowland gorillas have a more frugivorous diet than mountain gorillas, which are almost entirely folivorous because of the lack of fruit trees in their high-altitude habitat, particularly in the Virunga Mountains from where the eastern gorillas in this sample originated (Tutin, 2003; Robbins, 2007), and they have larger home ranges (Doran, 1996; Caillaud et al., 2014). These two factors likely place an increased demand on spatial memory, which relies on the hippocampus (Eichenbaum et al., 1999; Burgess et al., 2002). Studies across multiple species indicate interplay between ecological conditions that require greater spatial memory and navigation skills and a relative increase in hippocampus size (e.g. Jacobs et al., 1990; Clayton and Krebs, 1995; Maguire, 2000). Exploiting fruit as a dietary source may place greater demands on spatial cognition than relying on non-reproductive plant parts, because the availability of fruit varies more and can be less predictable and less abundant. Thus, frugivores stand to benefit more from effective cognitive maps of tree locations and, in the case of plant species that reliably fruit at the same time each year, memory of seasonality. For example, Janmaat et al. (2013) describe a fruit-foraging strategy in which female chimpanzees in a lowland forest habitat similar to those used by G. gorilla inspected individual trees of synchronously fruiting species days before they produced ripe fruit as if in expectation of the fruit's appearance; this suggested that they were relying on such mental maps and memory.
The more dispersed nature of fruit patches has implications for home range size as well: G. gorilla's travel range expands in conjunction with the abundance of fruit resources (Tutin, 2003; Masi et al., 2009). Yamagiwa and colleagues (Yamagiwa et al., 1994; Yamagiwa et al., 2003) have observed that G. b graueri shows both a level of frugivory and a mean day journey length intermediate between that of G. gorilla and G. b. beringei. Notably, chimpanzees (Pan troglodytes) have the largest hippocampal volume relative to total brain size among the great apes, possibly reflecting their high dependence on fruit and correspondingly large home ranges (Sherwood et al., 2004; Stumpf, 2007). However, the relationship between fruit consumption and home range size, even in gorillas, is not always straightforward. For example, in reviewing data on the population of G. b. beringei in the Bwindi Impenetrable National Park, Uganda, which is considerably more frugivorous overall than the Virunga population and in which home range sizes are similar to those of G. gorilla, Robbins and McNeilage (2003) describe considerable variation in both fruit consumption and home range size, but found no significant correlation between these two variables. However, because the G. b. beringei brains in this study were obtained exclusively from the Virunga population, data from this habitat are most relevant to the present analyses.
Second, G. gorilla tends to spend more time foraging in trees, incorporating more arboreality into their locomotor patterns than G. b. beringei (Doran, 1996; Taylor, 1997). Differences in arboreality between the two gorilla species largely relate to differences in habitat and diet: the high-altitude home ranges of mountain gorillas have few fruit trees and the majority of their food is terrestrial herbaceous vegetation. Comparable data for degree of arboreality in G. b. graueri are not available, although Yamagiwa et al. (1994) observed both climbing of trees to obtain ripe fruit and eating of ripe fruit from the ground by gorillas in the lowland sector of Kahuzi-Biega National Park (where all the gorillas belonged to a single population). G. b. graueri's positional behavior, like its diet, probably varies with altitude-related ecological variation, with gorillas in lower-altitude habitats more like G. gorilla and those in montane forest more like G. beringei.
The cerebellum is known to control complex aspects of locomotion, including planning of sequential behaviors like those employed in moving through trees. Great apes as a group have larger cerebelli relative to total brain size than do other primates (MacLeod et al., 2003). Further, a large cerebellum relative to total brain size in G. gorilla—more so than in other great apes—has also been noted in previous studies (Stephan et al., 1981; Rilling and Insel, 1998; Semendeferi and Damasio, 2000), including specifically in comparison to G. beringei (Sherwood et al., 2004). The enlarged cerebellum of G. gorilla might relate to the greater degree of arboreal locomotion employed than in G. beringei. Matano and Hirasaki (1997), for example, noted increased development of the size of cerebellar nuclei in arboreal quadrupedal primates relative to terrestrial primates, suggesting that these structures play a role in the navigation of a three-dimensional arboreal space. Gorillas' large body size may have also played a role in the development of their large cerebellum relative to other ape taxa. Povinelli and Cant (1995) proposed that large-bodied hominoids' navigation through complex substrates—particularly trees—was a significant selective pressure in their cognitive development.
All specimens of G. gorilla in this study were obtained from individuals raised in captivity, whereas all but one G. beringei specimen were from wild animals. Therefore, we must acknowledge the possibility that what we have identified as species-level differences may be attributed, at least in part, to differences in rearing conditions. However, research showing developmental effects on the volume of specific brain regions in other animals provides reason to think that if anything, captivity would decrease any differences among the gorilla taxa in our sample in terms of brain structures involved in locomotion and spatial memory, including the cerebellum and hippocampus. For example, impoverished housing or rearing conditions can lead to diminished cognitive function associated with neurochemical changes in rodents (Robbins et al., 1996; Würbel, 2001), and specific decreases in hippocampal volume have been documented in birds kept in captivity with lesser spatial cognitive demands than wild counterparts (Day et al., 2008). Conversely, both environmental enrichment and experience can produce increases in brain weight and in brain structure volumes, as well as changes to synapses, cortical thickness, and neurotransmitter receptors (Rosenzweig and Bennett, 1996; van Praag et al., 2000). Human neuroimaging studies have demonstrated an increase in cerebellar volume (but not total brain size) in skilled musicians relative to controls (Gaser and Schlaug, 2003; Hutchinson, 2003), and an increase in subregions of the vermis of the cerebellum in basketball players relative to controls (Park et al., 2009). A well-known study (Maguire, 2000) showed a redistribution of gray matter in the hippocampus of experienced London taxi drivers (i.e., an increase in posterior hippocampal volume and decrease in anterior volume), associated with significant demands on spatial memory and navigation. While the neuroanatomical differences described within single species in these studies are qualitatively similar to those described here between species, they are generally smaller. The results of the present study suggest that ecological selective pressures that typify the habitats of wild G. gorilla appear to be reflected in the brains of captive animals, despite developing in a more limited environment.
Chimpanzees and bonobos are also congeners within the African great apes and diverged approximately 2 million years ago. Neuroanatomical differences between these two species, on a scale comparable to that reported here, have also been described, based entirely on samples from captive individuals. Hopkins and colleagues (2009) reported larger cerebellum, hippocampus, and putamen in chimpanzees compared to bonobos assessed via MR images, and a greater degree in asymmetry of the striatum and cortical motor hand area in bonobos. Schenker et al. (2005), also using MRI data, showed that the dorsal frontal lobe of chimpanzees is proportionally larger than that of bonobos, relative to the rest of the frontal lobe. Finally, Rilling et al. (2011) described neuroanatomical differences between these two species using voxel-based morphometry and diffusion tensor imaging in areas related to social behavior. Specifically, bonobos had more gray matter than chimpanzees in right anterior amygdala, right dorsal amygdala, and hypothalamus, and a larger pathway between the amygdala and the ventral anterior cingulate cortex.
The current study contributes to our understanding of diversity among gorillas by exploring neuroanatomical variation. G. gorilla and G. beringei are distinct in terms of behavior, morphology, and ecology (Doran and McNeilage, 2001; Leigh et al., 2003; Robbins, 2007). Our present data show that species-level variation also exists in the brain structure of gorillas.
Acknowledgments
We thank Dr. Mark Grabowski for assistance with statistical analyses, Dr. Amy Cobden for insightful discussion, and Dr. David Watts and two anonymous reviewers for helpful comments on an earlier draft.
Grant sponsorship: National Science Foundation Grant BCS-0827531; National Institutes of Health Grant NS042867; James S. McDonnell Foundation Grants 22002078 and 220020293.
References
- Allen JS, Emmorey K, Bruss J, Damasio H. Morphology of the insula in relation to hearing status and sign language experience. J Neurosci. 2008;28:11900–11905. doi: 10.1523/JNEUROSCI.3141-08.2008. [DOI] [PMC free article] [PubMed] [Google Scholar]
- Barks SK, Bauernfeind AL, Bonar CJ, Cranfield MR, de Sousa AA, Erwin JM, Hopkins WD, Lewandowski AH, Mudakikwa A, Phillips KA, Raghanti MA, Stimpson CD, Hof PR, Zilles K, Sherwood CC. Variable temporoinsular cortex anatomy in primates suggests a bottleneck effect in eastern gorillas. J Comp Neurol. 2014;522:844–860. doi: 10.1002/cne.23448. [DOI] [PMC free article] [PubMed] [Google Scholar]
- Breuer T, Breuer-Ndoundou Hockemba M, Olejniczak C, Parnell RJ, Stokes EJ. Physical maturation, life-history classes and age estimates of free-ranging western gorillas—insights from Mbeli Bai, Republic of Congo. Am J Primatol. 2009;71:106–119. doi: 10.1002/ajp.20628. [DOI] [PubMed] [Google Scholar]
- Burgess N, Maguire EA, O'Keefe J. The human hippocampus and spatial and episodic memory. Neuron. 2002;35:625–641. doi: 10.1016/s0896-6273(02)00830-9. [DOI] [PubMed] [Google Scholar]
- Caillaud D, Ndagijimana F, Giarrusso A, Vecellio V, Stoinski TS. Mountain gorilla ranging patterns: influence of group size and dynamics. Am J Primatol. 2014 doi: 10.1002/ajp.22265. [DOI] [PubMed] [Google Scholar]
- Clayton NS, Krebs JR. Memory in food-storing birds: from behaviour to brain. Curr Opin Neurobiol. 1995;5:149–154. doi: 10.1016/0959-4388(95)80020-4. [DOI] [PubMed] [Google Scholar]
- Day LB, Guerra M, Schlinger BA, Rothstein SI. Sex differences in the effects of captivity on hippocampus size in brown-headed cowbirds (Molothrus ater obscurus) Behav Neurosci. 2008;122:527–534. doi: 10.1037/0735-7044.122.3.527. [DOI] [PMC free article] [PubMed] [Google Scholar]
- Doran DM. Comparative positional behavior of the African apes. In: McGrew WC, Marchant LF, Nishida T, editors. Great Ape Societies. New York: Cambridge University Press; 1996. pp. 213–224. [Google Scholar]
- Doran DM, McNeilage A. Subspecific variation in gorilla behavior: the influence of ecological and social factors. In: Robbins MM, Sicotte P, Stewart KJ, editors. Mountain Gorillas: Three Decades of Research at Karisoke. Cambridge: Cambridge University Press; 2001. pp. 123–149. [Google Scholar]
- Dunn RH, Tocheri MW, Orr CM, Jungers WL. Ecological divergence and talar morphology in gorillas. Am J Phys Anthropol. 2014;153:526–541. doi: 10.1002/ajpa.22451. [DOI] [PubMed] [Google Scholar]
- Eichenbaum H, Dudchenko P, Wood E, Shapiro M, Tanila H. The hippocampus, memory, and place cells: is it spatial memory or a memory space? Neuron. 1999;23:209–226. doi: 10.1016/s0896-6273(00)80773-4. [DOI] [PubMed] [Google Scholar]
- Gaser C, Schlaug G. Brain structures differ between musicians and non-musicians. J Neurosci. 2003;23:9240–9245. doi: 10.1523/JNEUROSCI.23-27-09240.2003. [DOI] [PMC free article] [PubMed] [Google Scholar]
- Groves CP. Primate Taxonomy. Washington: Smithsonian Institution Press; 2001. [Google Scholar]
- Grubb P, Butynski T, Oates J, Beader S, Disotell T, Groves C, Struhsaker T. Assessment of the diversity in African primates. Int J Primatol. 2003;24:1301–1357. [Google Scholar]
- Gundersen HJG, Bendtsen TF, Korbo L, Marcussen N, Moller A, Nielsen K, Nyengaard JR, Pakkenberg B, Sørensen FB, Vesterby A, West MJ. Some new, simple and efficient stereological methods and their use in pathological research and diagnosis. Acta Pathol Microbiol Immunol Scand. 1988;96:379–394. doi: 10.1111/j.1699-0463.1988.tb05320.x. [DOI] [PubMed] [Google Scholar]
- Gundersen HJG, Jensen EB. The efficiency of systematic sampling in stereology and its prediction. J Microsc. 1987;147:229–263. doi: 10.1111/j.1365-2818.1987.tb02837.x. [DOI] [PubMed] [Google Scholar]
- Hammer Ø, Harper DAT, Ryan PD. PAST: Paleontological statistics software package for education and data analysis. Palaeontologia Electronica. 2001;4:9. [Google Scholar]
- Hopkins WD, Lyn H, Cantalupo C. Volumetric and lateralized differences in selected brain regions of chimpanzees (Pan troglodytes) and bonobos (Pan paniscus) Am J Primatol. 2009;71:988–997. doi: 10.1002/ajp.20741. [DOI] [PMC free article] [PubMed] [Google Scholar]
- Hutchinson S, Lee LH, Gaab N, Schlaug G. Cerebellar volume of musicians. Cereb Cortex. 2003;13:943–949. doi: 10.1093/cercor/13.9.943. [DOI] [PubMed] [Google Scholar]
- Jacobs LF, Gaulin SJ, Sherry DF, Hoffman GE. Evolution of spatial cognition: sex-specific patterns of spatial behavior predict hippocampal size. Proc Natl Acad Sci USA. 1990;87:6349–6352. doi: 10.1073/pnas.87.16.6349. [DOI] [PMC free article] [PubMed] [Google Scholar]
- Janmaat KRL, Ban SD, Boesch C. Taï chimpanzees use botanical skills to discover fruit: what we can learn from their mistakes. Anim Cogn. 2013;16:851–860. doi: 10.1007/s10071-013-0617-z. [DOI] [PubMed] [Google Scholar]
- Jensen-Seaman MI, Deinard AS, Kidd KK. Mitochondrial and nuclear DNA estimates of divergence between western and eastern gorillas. In: Taylor AB, Goldsmith ML, editors. Gorilla biology: a multidisciplinary perspective. New York: Cambridge University Press; 2003. pp. 247–268. [Google Scholar]
- Leigh SR, Relethford JH, Park PB, Konigsberg LW. Morphological differentiation of Gorilla subspecies. In: Taylor AB, Goldsmith ML, editors. Gorilla biology: a multidisciplinary perspective. New York: Cambridge University Press; 2003. pp. 104–131. [Google Scholar]
- MacLeod CE, Zilles K, Schleicher A, Rilling JK, Gibson KR. Expansion of the neocerebellum in Hominoidea. J Hum Evol. 2003;44:401–429. doi: 10.1016/s0047-2484(03)00028-9. [DOI] [PubMed] [Google Scholar]
- Maguire EA, Gadian DG, Johnsrude IS, Good CD, Ashburner J, Fackowiak RS, Frith CD. Navigation-related structural change in the hippocampi of taxi drivers. Proc Natl Acad Sci USA. 2000;97:4398–4403. doi: 10.1073/pnas.070039597. [DOI] [PMC free article] [PubMed] [Google Scholar]
- Malenky RK, Kuroda S, Ono Vineberg E, Wrangham RW. The significance of terrestrial herbaceous foods for bonobos, chimpanzees, and gorillas. In: Wrangham RW, McGrew WC, de Waal FBM, Heltne PG, editors. Chimpanzee Cultures. Cambridge: Harvard University Press; 1994. pp. 59–75. [Google Scholar]
- Malenky RK, Wrangham RW. A quantitative comparison of terrestrial herbaceous food consumption by Pan paniscus in the Lomako Forest, Zaire, and Pan troglodytes in the Kibale Forest, Uganda. Am J Primatol. 1994;32:1–12. doi: 10.1002/ajp.1350320102. [DOI] [PubMed] [Google Scholar]
- Masi S, Cipolletta C, Robbins MM. Western lowland gorillas (Gorilla gorilla gorilla) change their activity patterns in response to frugivory. Am J Primatol. 2009;71:91–100. doi: 10.1002/ajp.20629. [DOI] [PubMed] [Google Scholar]
- McFarlin SC, Barks SK, Tocheri MW, Massey JS, Eriksen AB, Fawcett KA, Hof PR, Bromage TG, Mudakikwa A, Cranfield MR, Sherwood CC. Exceptionally early brain growth cessation in wild Virunga mountain gorillas (Gorilla beringei beringei) Am J Primatol. 2013;75:450–463. doi: 10.1002/ajp.22100. [DOI] [PubMed] [Google Scholar]
- Park IS, Lee KJ, Han JW, Lee NJ, Lee WT, Park KA, Rhyu IJ. Experience-dependent plasticity of cerebellar vermis in basketball players. Cerebellum. 2009;8:334–339. doi: 10.1007/s12311-009-0100-1. [DOI] [PubMed] [Google Scholar]
- Povinelli DJ, Cant JGH. Arboreal clambering and the evolution of self-conception. Q Rev Biol. 1995;70:393–421. doi: 10.1086/419170. [DOI] [PubMed] [Google Scholar]
- Remis MJ. Effects of body size and social context on the arboreal activities of lowland gorillas in the Central African Republic. Am J Phys Anthropol. 1995;97:413–433. doi: 10.1002/ajpa.1330970408. [DOI] [PubMed] [Google Scholar]
- Remis MJ. Tree structure and sex differences in arboreality among western lowland gorillas (Gorilla gorilla gorilla) at Bai Hokou, Central African Republic. Primates. 1999;40:383–396. [Google Scholar]
- Rilling JK, Insel TR. Evolution of the cerebellum in primates: differences in relative volume among monkeys, apes and humans. Brain Behav Evol. 1998;52:308–314. doi: 10.1159/000006575. [DOI] [PubMed] [Google Scholar]
- Rilling JK, Insel TR. The primate neocortex in comparative perspective using magnetic resonance imaging. J Hum Evol. 1999;37:191–223. doi: 10.1006/jhev.1999.0313. [DOI] [PubMed] [Google Scholar]
- Rilling JK, Scholz J, Preuss TM, Glasser MF, Errangi BK, Behrens TE. Differences between chimpanzees and bonobos in neural systems supporting social cognition. Soc Cogn Affect Neurosci. 2011;7:369–379. doi: 10.1093/scan/nsr017. [DOI] [PMC free article] [PubMed] [Google Scholar]
- Robbins MM. Gorillas: diversity in ecology and behavior. In: Campbell CJ, Fuentes A, MacKinnon KC, Panger M, Bearder SK, editors. Primates in Perspective. New York: Oxford University Press; 2007. pp. 304–321. [Google Scholar]
- Robbins MM, Bermejo M, Cipolletta C, Magliocca F, Parnell RJ, Stokes E. Social structure and life-history patterns in western gorillas (Gorilla gorilla gorilla) Am J Primatol. 2004;64:145–159. doi: 10.1002/ajp.20069. [DOI] [PubMed] [Google Scholar]
- Robbins MM, Gray M, Kagoda E, Robbins AM. Population dynamics of the Bwindi mountain gorillas. Biol Conserv. 2009;142:2886–2895. [Google Scholar]
- Robbins MM, McNeilage A. Home range and frugivory patterns of mountain gorillas in Bwindi Impenetrable National Park, Uganda. Int J Primatol. 2003;24:467–491. [Google Scholar]
- Robbins TW, Jones GH, Wilkinson LS. Behavioural and neurochemical effects of early social deprivation in the rat. J Psychopharmacol. 1996;10:39–47. doi: 10.1177/026988119601000107. [DOI] [PubMed] [Google Scholar]
- Rosenzweig MR, Bennett EL. Psychobiology of plasticity: effects of training and experience on brain and behavior. Behav Brain Res. 1996;78:57–65. doi: 10.1016/0166-4328(95)00216-2. [DOI] [PubMed] [Google Scholar]
- Scally A, Dutheil JY, Hillier LW, Jordan GE, Goodhead I, Herrero J, Hobolth A, Lappalainen T, Mailund T, Marquex-Bonet T, McCarthy S, Montgomery S, Schwalie PC, Tang YA, Ward MC, Xue Y, Yngvadottir B, Alkan C, Andersen LN, Ayub Q, Ball EV, Beal K, Bradley BJ, Chen Y, Clee CM, Fitzgerald S, Graves TA, Gu Y, Heath P, Heger Andreas, Karakoc E, Kolb-Kokocinski A, Laird GK, Lunter G, Meader S, Mort M, Mullikin JC, Munch K, O'Connor TD, Phillips AD, Prado-Martinez J, Rogers AS, Sajjadian S, Schmidt D, Shaw K, Simpson JT, Stenson PD, Turner DJ, Vigilant L, Vilella AJ, Whitener W, Zhu B, Cooper DN, de Jong P, Dermitzakis ET, Eichler EE, Flicek P, Goldman N, Mundy NI, Ning Z, Odom DT, Ponting CP, Quail MA, Ryder OA, Searle SM, Warren WC, Wilson RK, Schierup MH, Rogers J, Tyler-Smith C, Durbin R. Insights into hominid evolution from the gorilla genome sequence. Nature. 2012;483:169–175. doi: 10.1038/nature10842. [DOI] [PMC free article] [PubMed] [Google Scholar]
- Schenker NM, Desgouttes AM, Semendeferi K. Neural connectivity and cortical substrates of cognition in hominoids. J Hum Evol. 2005;49:547–569. doi: 10.1016/j.jhevol.2005.06.004. [DOI] [PubMed] [Google Scholar]
- Schneider CA, Rasband WS, Eliceiri KW. NIH Image to Image J: 25 years of image analysis. Nat Methods. 2012;9:671–675. doi: 10.1038/nmeth.2089. [DOI] [PMC free article] [PubMed] [Google Scholar]
- Schultz AH. Some distinguishing characters of the mountain gorilla. J Mammal. 1934;15:51–61. [Google Scholar]
- Semendeferi K, Damasio H. The brain and its main anatomical subdivisions in living hominoids using magnetic resonance imaging. J Hum Evol. 2000;38:317–332. doi: 10.1006/jhev.1999.0381. [DOI] [PubMed] [Google Scholar]
- Sherwood CC, Cranfield MR, Mehlman PT, Lilly AA, Garbe JAL, Whittier CA, Nutter FB, Rein TR, Bruner HJ, Holloway RL, Tang CY, Naidich TP, Delman BN, Steklis HD, Erwin JM, Hof PR. Brain structure variation in great apes, with attention to the mountain gorilla (Gorilla beringei beringei) Am J Primatol. 2004;63:149–164. doi: 10.1002/ajp.20048. [DOI] [PubMed] [Google Scholar]
- Stephan H, Frahm HD, Baron G. New and revised data on volumes of brain structures in insectivores and primates. Folia Primatol. 1981;35:1–29. doi: 10.1159/000155963. [DOI] [PubMed] [Google Scholar]
- Stumpf R. Chimpanzees and bonobos: diversity within and between species. In: Campbell CJ, Fuentes A, MacKinnon KC, Panger M, Bearder SK, editors. Primates in Perspective. New York: Oxford University Press; 2007. pp. 321–344. [Google Scholar]
- Taylor AB. Scapula form and biomechanics in gorillas. J Hum Evol. 1997;33:529–553. doi: 10.1006/jhev.1997.0147. [DOI] [PubMed] [Google Scholar]
- Tocheri MW, Solhan CR, Orr CM, Femiani J, Frohlich B, Groves CP, Harcourt-Smith WE, Richmond BG, Shoelson B, Jungers WL. Ecological divergence and medial cuneiform morphology in gorillas. J Hum Evol. 2011;60:171–184. doi: 10.1016/j.jhevol.2010.09.002. [DOI] [PubMed] [Google Scholar]
- Tutin CEG. An introductory perspective: behavioral ecology of gorillas. In: Taylor AB, Goldsmith ML, editors. Gorilla biology: a multidisciplinary perspective. New York: Cambridge University Press; 2003. pp. 296–301. [Google Scholar]
- van Praag H, Kempermann G, Gage FH. Neural consequences of environmental enrichment. Nat Rev Neurosci. 2000;1:191–198. doi: 10.1038/35044558. [DOI] [PubMed] [Google Scholar]
- Watts DP. Mountain gorilla reproduction and sexual behavior. Am J Primatol. 1991;24:211–225. doi: 10.1002/ajp.1350240307. [DOI] [PubMed] [Google Scholar]
- Watts DP. Comparative socio-ecology of gorillas. In: McGrew WC, Marchant LF, Nishida T, editors. Great Ape Societies. New York: Cambridge University Press; 1996. pp. 16–28. [Google Scholar]
- Würbel H. Ideal homes? Housing effects on rodent brain and behavior. Trends Neurosci. 2001;24:207–211. doi: 10.1016/s0166-2236(00)01718-5. [DOI] [PubMed] [Google Scholar]
- Yamagiwa J, Kahekwa J. Dispersal patterns, group structure, and reproductive parameters of eastern lowland gorillas at Kahuzi in the absence of infanticide. In: Robbins MM, Sicotte P, Stewart KJ, editors. Mountain Gorillas: Three Decades of Research at Karisoke. Cambridge: Cambridge University Press; 2001. pp. 89–122. [Google Scholar]
- Yamagiwa J, Kahekwa J, Kanyunyi Basabose A. Intra-specific variation in social organization of gorillas: implications for their social evolution. Primates. 2003;44:359–369. doi: 10.1007/s10329-003-0049-5. [DOI] [PubMed] [Google Scholar]
- Yamagiwa J, Mwanza N, Yumoto T, Maruhashi T. Seasonal change in the composition of the diet of eastern lowland gorillas. Primates. 1994;35:1–14. [Google Scholar]
- Yushkevich PA, Piven J, Cody Hazlett H, Gimpel Smith R, Ho S, Gee JC, Gerig G. User-guided 3D active contour segmentation of anatomical structures: significantly improved efficiency and reliability. NeuroImage. 2006;31:1116–1128. doi: 10.1016/j.neuroimage.2006.01.015. [DOI] [PubMed] [Google Scholar]