Abstract
The capabilities of an adaptive Cartesian grid (ACG)-based Poisson-Boltzmann (PB) solver (CPB) are demonstrated. CPB solves various PB equations with an ACG, built from a hierarchical octree decomposition of the computational domain. This procedure decreases the number of points required, thereby reducing computational demands. Inside the molecule, CPB solves for the reaction-field component (ϕrf) of the electrostatic potential (ϕ), eliminating the charge-induced singularities in ϕ. CPB can also use a least-squares reconstruction method to improve estimates of ϕ at the molecular surface. All surfaces, which include solvent excluded, Gaussians and others, are created analytically, eliminating errors associated with triangulated surfaces. These features allow CPB to produce detailed surface maps of ϕ and compute polar solvation and binding free energies for large biomolecular assemblies, such as ribosomes and viruses, with reduced computational demands compared to other PBE solvers. The reader is referred to http://www.continuum-dynamics.com/solution-mm.html for how to obtain the CPB software.
Keywords: Poisson-Boltzmann equation, implicit solvent model, electrostatics, adaptive Cartesian grid, surface, electrostatic potential
Introduction
The Poisson-Boltzmann equation (PBE) describes the long-range and non-specific electrostatic interactions of molecules immersed in ionic solutions. It is based on an implicit solvent model where the molecule and ionic solution are treated as low and high dielectric regions, respectively. The solution of the PBE provides the electrostatic potential (ϕ) over the entire molecule-ionic solution system and various electrostatic energy-derived quantities and sensitivities (e.g., salt sensitivities and forces) that are employed in many biophysical applications1–3. For example, the ϕ on and/or around a molecule is used to rationalize molecular function and to locate potential binding sites. Additionally, the PBE is now widely used to estimate the electrostatic component (ΔΔGel) of the binding free energy (ΔΔG), which can be combined with estimates of the non-electrostatic contributions to determine ΔΔG for drug design purposes4.
Because the PBE is analytically solvable for only certain idealized geometries, such as spheres, various algorithms based on boundary element, finite difference, finite element, and stochastic methods have been developed to numerically solve the PBE for the complex geometries of three-dimensional (3D) molecules5–10. Due to the desire for improved speed and accuracy of 3D PBE solutions, especially for highly charged and large-scale biomolecular assemblies (e.g., viruses and ribosomes that can contain O(107) atoms), the development of fast and accurate PBE solvers remains an active area of research. The interested reader is referred to recent reviews for a detailed discussion of the various numerical techniques developed to solve the PBE6,7,11. In the present study the capabilities and features of a Cartesian grid-based PBE solver (CPB)5 were examined.
One advantage of CPB over some other PBE solvers is that rather than solving for ϕ inside the molecule, it instead solves for the reaction-field component (ϕrf) of ϕ5. Solving for ϕrf inside the molecule is beneficial because it lacks the singularities at the atomic charge sites present in ϕ. Consequently, ϕrf is less sensitive to mesh spacing and grid placement than ϕ. Additionally, a singularity-free description obviates the need for auxiliary reference calculations and allows the electrostatic energy (Gel) to be computed directly from one PBE solution, thereby further reducing overall computation time and eliminating the potential for numerical errors associated with subtracting comparable magnitude energy contributions.
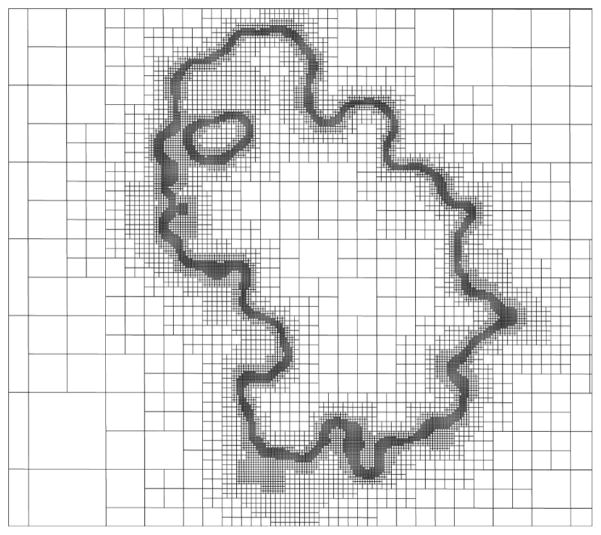
One feature of CPB not available in most PBE solvers is an adaptive Cartesian grid (ACG) based on a hierarchical octree data structure. The ACG, which is generated via a recursive subdivision of a cube representing the physical domain, is widely used in other contexts, including mesh generation 12,13, data search14, computational fluid dynamics simulation 15,16, and fast multipole methods17,18. By using an ACG, a single grid with variable grid resolution allocates the necessary length scales (mesh spacings or grid point densities) where needed so that the solution is obtained in a single PBE calculation. As shown in Figure 1, outside the molecule CPB assigns fewer grid points to regions far from the molecular surface because ϕ varies slowly in these regions. Similarly, inside the molecule CPB concentrates fewer points in regions far from the molecular surface because ϕrf varies slowly in these regions. As noted above, choosing ϕrf to represent the interior solution eliminates the need to pack points near charge sites, thus permitting the use of fewer mesh points to represent the interior solution. By reducing the number of points on the solution grid, the use of an ACG reduces both the solution time and memory compared to what would be achieved with uniform mesh spacing. The use of the ACG also allows the outer boundaries to be placed far from the molecular surface, which leads to smaller boundary errors without significant computational overhead. Lastly, ACG facilitates the use of multigrid schemes that further expedite the solution process.
Figure 1.
A slice through the computational domain, containing a barnase (PDBid: 1B3S) and ionic solution dielectric regions, showing the adaptive Cartesian grid of CPB. This figure shows how CPB assigns more grid points to regions where the solution potential varies most rapidly (i.e., near the molecular surface).
Many PBE solvers use approximate triangulated surface definitions to specify the dielectric boundary, which separates the interior (molecule) and exterior (ionic solution) dielectric regions, and often generate these surfaces using separate software. CPB instead adopts analytical representations of common surface definitions, such as the solvent-excluded (SE), van der Waals (vdW), solvent-accessible (SA), and various Gaussian and polynomial surfaces. These analytical representations help reduce discretization errors near the surface, particularly when referencing surface normal and curvature information necessary to reconstruct the surface solution. Also, different PBE metrics, such as ϕ and energies, and their associated grid discretization errors (e.g., those that depend on grid resolution and positioning) are affected to varying degrees by the choice of surface definition19,20.
To improve the accuracy of ϕ CPB uses a least-squares reconstruction (LSR) at the molecular surface21. This procedure is similar to that developed by LeVeque and Li22 and implemented in some PBE solvers23,24. At the molecular surface ϕrf and ϕ are expanded to second-order, and the appropriate jump conditions in ϕ and its spatial derivatives across the surface are explicitly enforced. The use of an LSR scheme can greatly improve the convergence rate of the calculations with respect to grid spacing, as shown in Results, with minimal increases in memory and computational overhead.
Near the surfaces of highly charged molecules the PBE can over predict ion concentrations since the ions are assumed to have no size. To account for ion (and solvent) size, CPB provides the option of solving the size-modified PBE (SMPBE)25–27. Additionally, CPB allows for inclusion of a Stern (ion-exclusion) layer. The reader is referred elsewhere for applications of CPB’s SMPBE in the prediction of the number of excess ions around nucleic acids20.
Because most PBE solvers use a finite computational grid, some method of assigning ϕ on the grid boundary must be implemented. Most PBE solvers assume that ϕ on the boundary can be estimated with the Debye-Hückel equation, which may introduce bias errors for nonlinear problems, particularly ones involving highly charged molecules at low salt conditions. Instead CPB uses a more rigorous, general, and accurate charge-conserving boundary condition, which has been shown to yield better estimates of ϕ and is valid for the linear, nonlinear and sized modified PBE28. CPB can correct PBE quantities (e.g., energies and their salt sensitivities, and numbers of excess ions) for contributions from outside the computational grid.
The above features allow CPB to perform common molecular computations while requiring less computational time and memory than other PBE solvers. CPB can compute electrostatic potential surface maps (EPSMs), which are used to rationalize molecular structures and predict the location of ligand binding sites. Because the above features of CPB reduce the number of points required in the solution grid, CPB can generate EPSMs for large biomolecular assemblies (e.g., ribosomes and viruses) that would require much more memory in other PBE solvers. Additionally, using the LSR scheme and solving for ϕrf inside the molecule improves the rate at which the estimates of ϕ projected on the molecular surface converge with respect to grid spacing. The above features also improve the rate at which ΔΔGel converges with respect to grid spacing and allow these PBE-derived quantities to be computed for large molecular systems.
Methods
All molecular structures determined by X-ray diffraction techniques were taken from the RCSB Protein Data Bank (PDB). Only the chains containing the molecules of interest were used, whereas ions, water, ligands, and other small molecules were discarded. The ideal 40 base pair B-DNA structure was generated using the 3DNA package29. With the exception of paromomycin, the partial charges and van der Waals (vdW) radii were taken from the Amber 94 force field30 and added to the structure files with the pdb2pqr software 31. For the paromomycin in the ribosome and 16S rRNA complexes the AM1-BBC method in Chimera32 was used to assign partial charges, as in previous PBE studies33. The vdW radii of paromomycin were taken from a previous study 33. With the exception of paromomycin, the hydrogen atoms were added with pdb2pqr. All ionizable protein and nucleic acid residues were in their standard ionization states at pH=7. The PDB structure file for virus capsid structure was obtained from the VIPERdb icosahedral virus capsid database (http://viberdb.scripps.edu). No hydrogen atoms were added to this virus capsid structure and only a formal charge assignment was employed. In this formal charge model only the side chains of the Lys, Arg, Glu, and Asp residues assumed a net charge of −1e or +1e, with all other atom charges set to zero. The His residues had a net charge of zero.
All calculations were performed with CPB. All details about the finite difference PBE implementation in CPB, including the numerical methods used to solve the discretized PBE, are provided elsewhere5. Unless otherwise stated the nonlinear PBE (NLPBE) with a 1:1 salt (i.e., NaCl) concentration of 0.1 M was used. The interior (solute/molecule) and exterior (solvent) dielectric constants were set to 1 and 80, the temperature was set to 298.15 K, the SE surface with a solvent probe radius of 1.4 Å was used to define the dielectric boundary, and no Stern layer was used. Unless otherwise stated, the finite difference equations were solved iteratively until the change in the dimensionless potential at any grid point was less than 10−9. Also, the length of each side of the grid was set to 4 times the largest dimension of the molecule. Charge-conserving outer boundary conditions 28 were applied. All ΔΔGel were computed using grids with the same size and position for the binding partners and complex. To estimate the dependence of ΔΔGel on the position of the grid, for some of the results 30 different calculations were run at each grid spacing, with the grid randomly shifted by a fraction of a grid spacing in each Cartesian direction. The standard deviations of the resulting estimates of ΔΔGel are reported as error bars. With the exception of Figure 3 all plots were generated using the Tecplot graphics package (http://www.tecplot.com/). All PBE calculations were carried out on a 24 core (2 AMD Opteron 6234 12-core machine) 2.6 GHz workstation with 128 GB memory.
Figure 3.

Electrostatic binding free energies (ΔΔGel) calculated with and without LSR as functions of the finest grid spacing. The data points show the average of 30 calculations for each grid spacing, and the error bars depict their standard deviations, as outlined in Methods. (a) Paromomycin bound to a 16S rRNA fragment (PDBid: 1J7T). (b) Paromomycin bound to a 30S ribosomal subunit (PDBid: 1FJG). (c) Barnase-barstar complex (PDBid: 1B3S). The NaCl concentration was set to 0.1 M.
Results and Discussion
Polar Binding and Solvation Free Energies
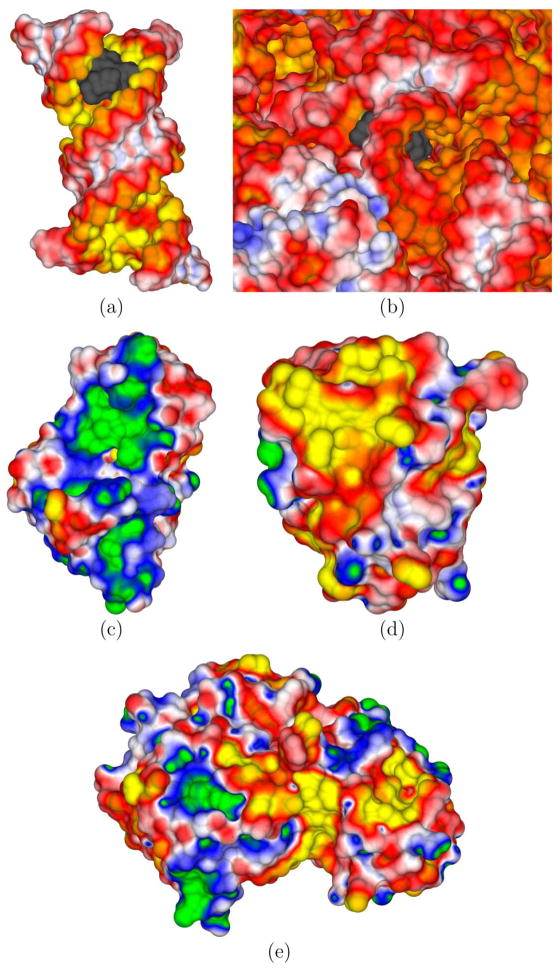
Computing ΔΔGel is a common application with PBE methods, but doing so is challenging because of the fine grid spacing required for convergence. Here ΔΔGel was computed for the three different complexes shown in Figure 2: paromomycin binding to an 16S RNA (PDBid: 1J7T), paromomycin binding to a 30S ribosomal subunit (PDBid: 1FJG), and barnase-barstar (PDBid: 1B3S). As shown in Figure 3 for large grid spacings these energies are very sensitive to the placement of the grid, and ΔΔGel deviates significantly from its value at the finest grid spacing. These findings agree with previous results19. For both paromomycin-nucleic acid complexes a finest grid spacing of 0.5 Å was required to obtain converged estimates of ΔΔGel without LSR to within 1 kcal/mol. However, for 1B3S this same finest grid spacing of 0.5 Å produced ΔΔGel that differed from ΔΔGel computed with 0.1 Å by 11 kcal/mol. In contrast, when LSR was used converged estimates of ΔΔGel were obtained with much larger finest grid spacings. For instance, for 1B3S, (ΔΔGel (0.8 Å) - ΔΔGel (0.1 Å)) is only 1.1 kcal/mol. The polar solvation free energies, ΔGel, ranged from −1290 kcal/mol to −2290 kcal/mol for the 1B3S complex and its components; −502 kcal/mol to −17200 kcal/mol for 1J7T; and from −379 kcal/mol to −4,330,000 kcal/mol for 1FJG. Because ΔGel is orders of magnitude larger than ΔΔGel, highly accurate predictions of ΔGel are required to estimate ΔΔGel.
Figure 2.
(a) An electrostatic potential surface map (EPSM) of the isolated 16S rRNA (PDBid: 1J7T) computed without its cationic aminoglycosidic paromomycin (net charge=+4e) binding partner at 0.1 M NaCl. The paromomycin is shown as a gray surface. This cationic drug binds in the deep enlarged major groove created by a distorted phosphate backbone containing unpaired and bulging adenines. (b) A close-up view of the paromomycin binding site in the full 16S rRNA of the 30S ribosomal subunit (PDBid: 1FJG) at 0.1 M NaCl. The paromomycin is buried when bound to the A-site of the 16S rRNA in the 30S ribosomal subunit. (c) An EPSM of barnase (PDBid: 1B3S) immersed in a 0.1 M NaCl solution. (d) An EPSM of barstar (PDBid: 1B3S) embedded in a 0.1 M NaCl solution. (e) An EPSM of the barnase-barstar complex (PDBid: 1B3S) at 0.1 M NaCl. The electrostatic potential (ϕ) coloring scales (in kT/e) are as follows: green (G) = 5, blue (B) = 2.5, white (W) = 0, red (R) = −2.5, and yellow (Y) = −5 in panel a. For panel b, (G,B,W,R,Y)=(4,2,0,−2,−4). For panels c, d, and e, (G,B,W,R,Y)=(3,1.5, 0,−1.5,−3). In views (c) and (d), which show the binding interface, one observes that barnase has a large region of positive ϕ and barstar has a complementary negative ϕ.
Table 1 shows the results of computing ΔGel with the Adaptive Poisson-Boltzmann Solver (APBS) and CPB on grids with uniform mesh spacings and with CPB on an adaptive grid with and without LSR. This table illustrates that using an adaptive grid in CPB enables ΔGel to be computed much more quickly than with a uniform grid in APBS because of the huge reduction in the number of grid points. This advantage should increase with the size of the considered molecular system because the ACG in CPB concentrates grid points near the molecular surface and the surface area to volume ratio should decrease as the size of the molecule increases.
Table 1.
The electrostatic solvation energy (ΔGel) of barstar (PDBid: 1B3S) computed with the Adaptive Poisson-Boltzmann Solver (APBS) and CPB, with and without least-squares reconstruction (LSR) and on adaptive Cartesian and uniform grids. These calculations used a 2 Å Stern layer, a convergence tolerance parameter of 10−6 and the grid side length was set to twice the longest dimension of the molecule, but otherwise were performed as described in the Methods.
| Grid# spacing (Å) | Adaptive Cartesian Grid | Uniform Grid | ||||||
|---|---|---|---|---|---|---|---|---|
| ΔGel (kcal/mol) | Number of Grid Points | CPU Time (s) | CPB ΔGel (kcal/mol) | APBS ΔGel (kcal/mol) | Number of Grid Points | CPU* Time (s) | ||
| 0.0625 | LSR | −1592 | 7.4×10⁷ | 15735 | — | — | — | — |
| No LSR | −1592 | 7.2×10⁷ | 15570 | |||||
| 0.125 | LSR | −1591 | 1.1×10⁷ | 1318 | — | — | — | — |
| No LSR | −1592 | 1.0×10⁷ | 1211 | |||||
| 0.25 | LSR | −1590 | 1.6×10⁶ | 162 | −1593 | −1612 | 1.4×10⁸ | 1048 |
| No LSR | −1593 | 1.5×10⁶ | 142 | |||||
| 0.5 | LSR | −1582 | 2.7×10⁵ | 24 | −1620 | −1663 | 1.7×10⁷ | 120 |
| No LSR | −1620 | 2.4×10⁵ | 19 | |||||
| 1.0 | LSR | −1546 | 5.8×10⁴ | 6 | −2097 | −1706 | 2.1×10⁶ | 19 |
| No LSR | −2097 | 5.1×10⁴ | 4 | |||||
—, Calculations on uniform grids could not be performed for these grid spacings because doing so would have required more than the available memory.
These CPU times are those found for the APBS calculations. The CPU times for CPB on the same uniform grid were significantly longer than those for APBS because CPB is optimized to use an adaptive Cartesian grid.
The finest grid spacing was used for the adaptive Cartesian grid.
Table 1 also demonstrates that the use of a LSR gives higher accuracy for a given grid spacing without a significant penalty in CPU time or number of grid points required. For an ACG with a finest grid spacing of Δsf = 1.0 Å the ΔGel given without a LSR differed by more than 500 kcal/mol from that obtained with Δsf = 0.0625 Å; the corresponding difference using LSR is only 46 kcal/mol. For some systems, the LSR may provide a significant savings in CPU times by allowing the user to use a larger finest grid spacing.
Given the various optimizations and adjustments available in APBS and CPB, Table 1 is necessarily a very limited comparison of the two codes. For example, the CPU times and accuracy of APBS could be improved by focusing (focusing is not necessary in CPB). The data in Table 1 also indicate that the results given by APBS may have been converging to a different value than that given by CPB, possibly because APBS uses a triangulated definition of the SE surface, whereas CPB uses an analytical SE surface, and perhaps also because of different numerical implementations of the Stern layer. Nevertheless, the data in Table 1 does provide a rough illustration of the advantages provided by CPB, and we expect that the advantage of CPB will increase with system size because, as discussed above, the ACG in CPB concentrates grid nodes at the molecular surface and the surface area to volume ratio should decrease with system size.
Size-modified Poisson-Boltzmann equation with nonuniform ion sizes
Because the PBE idealizes ions as points, no constraints exist to prevent ion concentrations from exceeding the tightly packed ion limit. As a result the PBE can produce excessive and physically unrealistic ion concentrations near highly charged molecules. Finite ion sizes can be accounted for by means of an ion exclusion (Stern) layer, but recent studies have indicated that this can produce ion distributions grossly different from those found in molecular dynamics simulations27. Various methods to account for finite ion sizes by modifying the PBE have been developed34–36. In CPB the SMPBE25, which allows for different ion sizes and can also model the finite size of water, can be invoked for salt mixtures containing an arbitrary number of ionic species. The computational times required to solve the SMPBE are comparable to those required by the NLPBE, with system-dependent increases in execution times of about 10–20%.
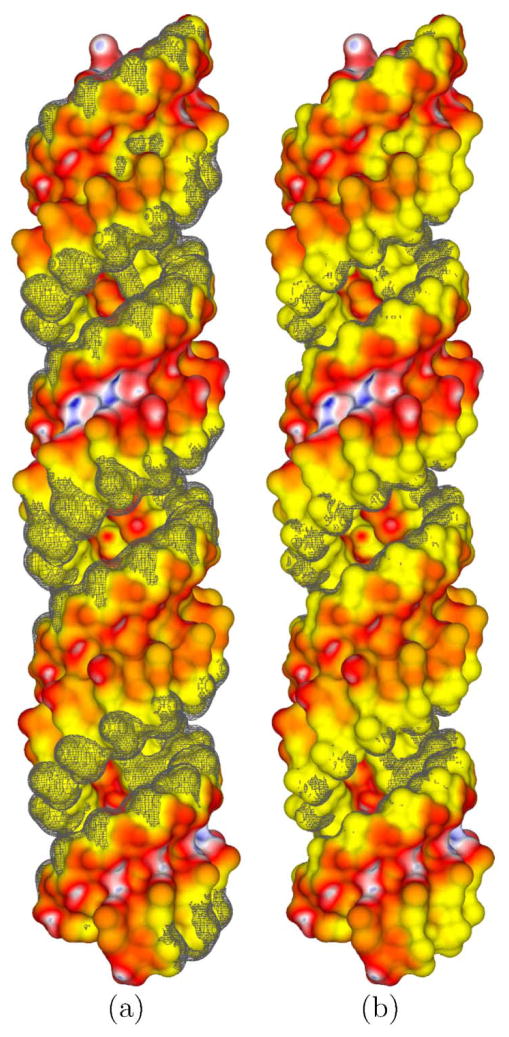
Figure 4 shows a 40 base pair ideal A-RNA structure previously studied using the “tightly bound ion” (TBI) theory 37 that accounts for both ion size and correlation effects. In Figures 4a and 4b, isosurfaces where the sodium ion densities predicted by the PBE and SMPBE differ by 1 M and 0.1 M respectively, are shown. These isosurfaces closely conform to areas of large negative ϕ, as expected.
Figure 4.
Electrostatic potential (ϕ) surface maps generated with the nonlinear Poisson-Boltzmann equation (PBE) for a 40 base pair ideal A-RNA helix embedded in a NaCl solution. Using the notation in Figure 2, the ϕ scale in kT/e is (G,B,W,R,Y) = (+5,+2.5,0,−2.5, −5). The gray meshes represent isocontours where the difference between the concentration of counterions given by the size-modified PBE and that given by the nonlinear PBE is (a) 0.1 M and (b) 1.0 M NaCl.
Electrostatic Potentials of Molecules
PBE solvers are used in conjunction with popular molecular modeling software packages, such as Pymol (http://www.pymol.org/) and VMD38 to visualize ϕ on and near the surfaces of molecules. Such EPSMs help characterize molecules, explain their functions, and identify binding sites. For example, several studies have claimed that regions with large ϕ are associated with binding sites for ions, ligands, and other molecules39–43; many DNA-binding proteins contain surface patches with large positive ϕ near the binding site 44,45; and ϕ has been incorporated into machine-learning algorithms to identify nucleic acid-binding proteins 46. The combination of LSR and an ACG in CPB enables the generation of high-resolution EPSMs5 and requires a minimal number of grid points in the solution grid.
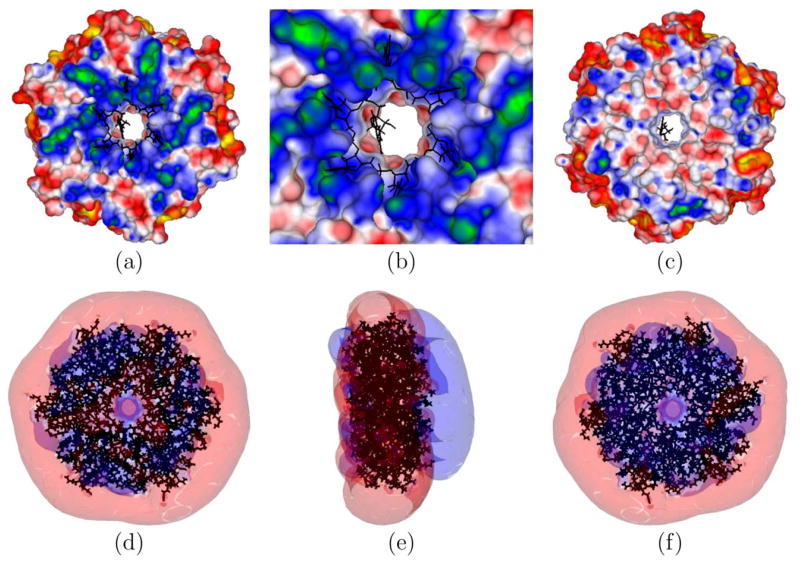
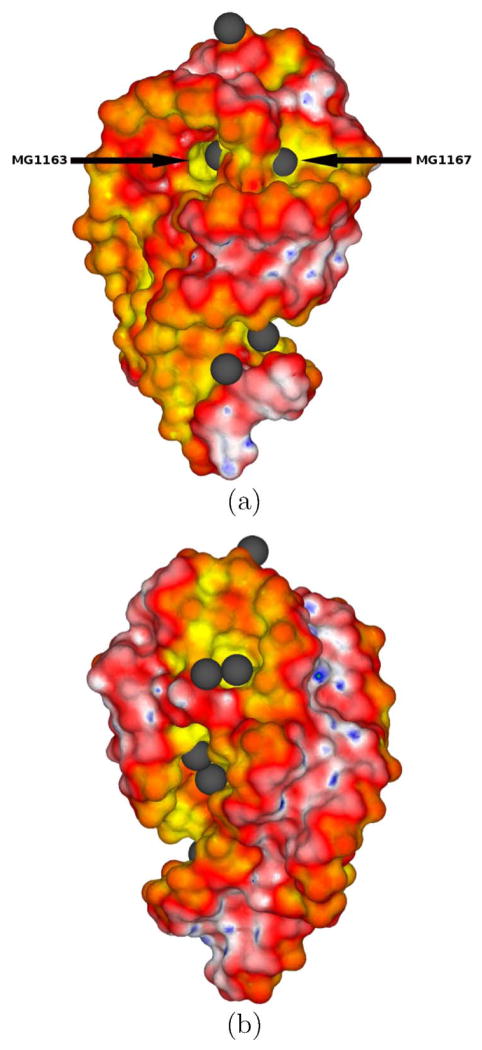
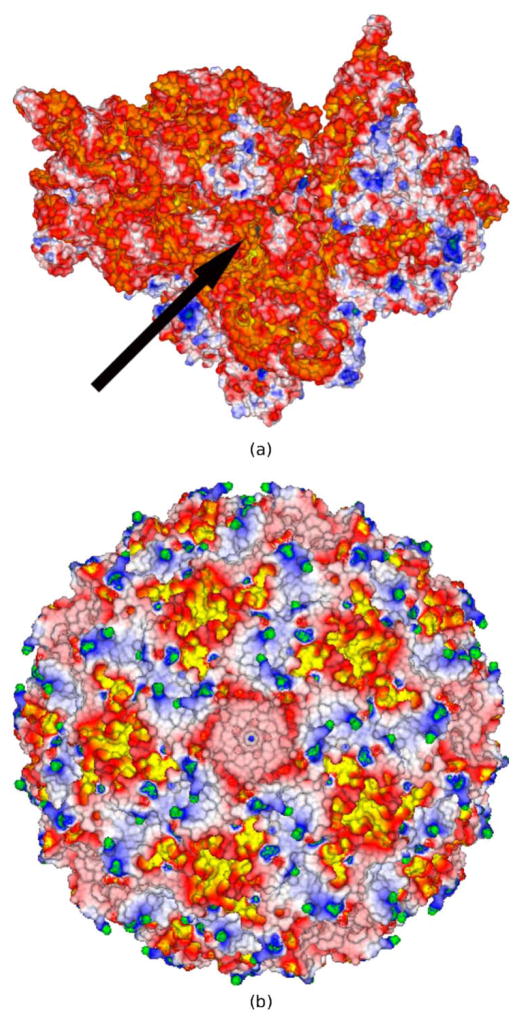
To further demonstrate the high-resolution EPSMs generated by CPB5, several cases, three of which were previously considered in the literature47–49 using other PBE solvers, were examined. First, the EPSM of a RNA-binding protein Host factor for Q beta (Hfq) (PDBid: 1KQ2) was generated (Figure 5). It agrees qualitatively with an EPSM reported in the literature48 and confirms that one side of the central cleft in the Hfq protein, where the RNA binds, has a region of distinctly positive ϕ whereas the other side contains no region of large ϕ. As shown in Figures 5a and 5b, the RNA binds in a circular conformation aligned with this region of positive ϕ. The magnitude of ϕ is smaller in Figure 5 than in Figure 5 of a previous study48 since this latter figure was created with the LPBE, whereas the current figure was created with the NLPBE. Second, the EPSM of the 23S ribosomal RNA (PDBid: 1HC8) is shown in Figure 6 and is similar to one reported in the literature47. Figure 6 agrees with the EPSM in the literature47 with two particular magnesium ions (MG1167 and MG1163) binding in regions of relatively large negative ϕ, even though the EPSM in the literature47 used the SA rather than the SE surface. Third, an EPSM of a 30S ribosomal subunit, containing a net charge of −1256e, previously considered in the literature49 was produced. As shown in Figure 7a this particular view of the 30S ribosome subunit, which faces the 50S ribosome subunit, consists of large regions of negative ϕ and small regions of positive ϕ. A close-up view of the binding site of paramomycin in this 30S ribosome subunit (see Figure 2b) reveals the very high quality of CPB’s EPSM. Finally, an EPSM of the satellite panicum mosaic viral capsid (PDBid: 1STM) was created and as observed in Figure 7b, the exterior of the viral capsid has a series of connected star-like negative ϕ patches created by clusters of external acidic residues, surrounded by interconnected positive ϕ regions that follow the symmetrical elements of the full viral capsid. The ribosome and viral capsid are large and highly charged biomolecular systems that contain 88,532 and 63,600 atoms, respectively. Most EPSM’s of such ribosomes and viruses reported in the literature50 have used large, likely inadequate, grid spacing (i.e., the same size as atomic radii) due to memory constraints, and/or been based on the linear PBE due to convergence/stability issues associated with the NLPBE. Due to the large size of these biomolecular assemblies, producing these fine grid resolution (i.e., ≤ 0.3 Å) EPSMs for large-scale biomolecular assemblies on laptops and workstations would present challenges to PBE solvers that do not use a LSR or ACG.
Figure 5.
(a), (b), and (c) show three views of the electrostatic potential (ϕ) surface map of the Host factor for Q beta (Hfq) protein with its companion RNA shown in black (PDBid: 1KQ2). (b) shows a close-up view of (a), highlighting the RNA-binding region. (c) shows the back view of (a). (d), (e), and (f) show isopotential contours around the Hfq protein. The blue contour has a ϕ of +1 kT/e, and the red contour has a ϕ of −1 kT/e. The dipolar nature of the Hfq protein is clearest in (e), which is a side view of (d). The ϕ scale is as follows: (G,B,W,R,Y) = (3,1.5,0, −1.5, −3) kT/e.
Figure 6.
Two views of the electrostatic potential (ϕ) surface map of the rRNA (PDBid: 1HC8) obtained with the nonlinear Poisson-Boltzmann equation and a finest grid spacing of 0.1 Å. The ϕ scale is as follows: (G,B,W,R,Y) = (5.5,2.75,0, −2.75, −5.5) kT/e. The Mg2+ binding sites are displayed as gray spheres. Panel (a) highlights the two Mg2+-binding sites (MG1163 and MG1167) with the largest negative ϕ’s.
Figure 7.
(a) shows the electrostatic potential (ϕ) surface map (EPSM) for the 30S ribosomal subunit immersed in a 0.1 M NaCl solution (PDBid: 1FJG). The black arrow points to the binding site of the paromomycin, which is represented as a translucent gray surface. A close-up view of the binding site showing the high quality of the generated EPSM is portrayed in Figure 2b (b) shows a similar EPSM for the satellite panicum mosaic viral capsid (PDBid: 1STM) at 0.1 M NaCl. The ϕ scale is as follows: (G,B,W,R,Y) = (4,2,0, −2, −4) kT/e. The nonlinear PBE was solved using a finest grid spacing of 0.3 Å.
The generation of isopotential surfaces or contours is another way to visualize the ϕ around molecules. Such depictions have been used to infer the role of electrostatics in the formation of encounter complexes51. Isopotential contours have also been employed to examine electrostatic similarity between families of proteins52. To examine the quality of CPB’s isopotential contours we considered the Hfq protein whose dipolar nature, which is common to many nucleic acid binding proteins, is evident in Figure 5. Another application of PBE methods is to calculate ϕ at sites outside the molecular surface in an attempt to locate binding sites for ligands or ions39,44. In Table 2 the ϕ’s at the locations of Mg2+ ions located in the crystal structure of the 23S ribosomal RNA (PDBid: 1HC8, Figure 6) are reported. Arrows in Figure 6 indicate the two Mg2+ sites with the most negative ϕ. Table 2 shows that the LPBE gives very different answers than the NLPBE for ϕ at these sites, so the NLPBE is likely necessary for these calculations. Fortunately, the CPB solves the NLPBE nearly as fast as the LPBE. For instance, from an analysis of 10 RNA structures, which range in size from 2032 and 5569 atoms and have net charges that range from −56e to −171e, considered in a PB study performed by Luo and co-workers53 the CPU time for the NLPBE was larger than that of the LPBE by at most a factor of 1.2 (results not shown). In other codes, the times to solve the NLPBE can be substantially higher than to solve the LPBE. For example, the popular UHBD solver takes about 5 times longer to solve the NLPBE than LPBE for a set of 55 proteins54.
Table 2.
The electrostatic potentials (ϕ’s) at Mg2+ binding sites near the 23S ribosomal RNA (PDBid: 1HC8) shown in Figure 5. These ϕ’s were computed with both the linear (LPBE) and nonlinear (NLPBE) Poisson-Boltzmann equation (PBE) and a finest grid spacing of 0.1 Å.
| MG site* | NLPBE | LPBE |
|---|---|---|
| 1159 | −4.12 | −32.32 |
| 1160 | −4.15 | −23.36 |
| 1161 | −4.78 | −24.04 |
| 1163 | −6.04 | −43.40 |
| 1164 | −4.03 | −12.90 |
| 1165 | −3.05 | −4.26 |
| 1166 | −0.95 | −2.24 |
| 1167 | −42.93 | −77.38 |
| 1168 | −2.57 | −8.25 |
| 1172 | −4.10 | −18.78 |
These numbers were taken from the PDB file. Some of these Mg2+ sites are shown in Figure 6.
Conclusions
CPB performs all of the standard PB calculations, including computing ΔΔGel, ESPMs, isopotential surfaces, and ϕ’s. In addition to solving the LPBE and NLPBE, CPB can also solve the SMPBE to account for finite ion sizes with minimal computational overhead. The use of an ACG, solving for ϕrf rather than ϕ in the molecular interior, and using charge-conserving outer boundary conditions lead to grids with smaller numbers of points on the solution grid than some other PBE solvers and reduce computational times and memory requirements. The use of an LSR at the molecular surface and analytical surface definitions increase the accuracy of ϕ and related quantities without adding significant overhead. CPB’s speed and low memory requirements allow it to be used on large biomolecular assemblies (e.g., viruses and ribosomes) with standard laptops and workstations.
Acknowledgments
This work was supported by NIH grant number 5R44GM073391-03.
References
- 1.Fogolari F, Zuccato P, Esposito G, Viglino P. Biophys J. 76:1–16. doi: 10.1016/S0006-3495(99)77173-0. [DOI] [PMC free article] [PubMed] [Google Scholar]
- 2.Ren P, Chun J, Thomas DG, Schnieders MJ, Marucho M, Zhang J, Baker NA. Q Rev Biophys. 2012;45:427. doi: 10.1017/S003358351200011X. [DOI] [PMC free article] [PubMed] [Google Scholar]
- 3.Grochowski P, Trylska J. Biopolymers. 2008;89:93. doi: 10.1002/bip.20877. [DOI] [PubMed] [Google Scholar]
- 4.Kollman PA, Massova I, Reyes C, Kuhn B, Huo S, Chong L, Lee M, Lee T, Duan Y, Wang W. Acc Chem Res. 2000;33:889. doi: 10.1021/ar000033j. [DOI] [PubMed] [Google Scholar]
- 5.Boschitsch AH, Fenley MO. J Chem Theory Comput. 2011;7:1524. doi: 10.1021/ct1006983. [DOI] [PMC free article] [PubMed] [Google Scholar]
- 6.Lu BZ, Zhou YC, Holst MJ, McCammon JA. Commun Comput Phys. 2008;3:973. [Google Scholar]
- 7.Li C, Li L, Petukh M, Alexov E. Molecular Based Math Biol. 2013;1:2299. doi: 10.2478/mlbmb-2013-0002. [DOI] [PMC free article] [PubMed] [Google Scholar]
- 8.Boschitsch AH, Fenley MO. J Comput Chem. 2004;25:935. doi: 10.1002/jcc.20000. [DOI] [PubMed] [Google Scholar]
- 9.Boschitsch AH, Fenley MO, Zhou HX. J Phys Chem B. 2002;106:2741. [Google Scholar]
- 10.Fenley MO, Mascagni M, McClain J, Silalahi ARJ, Simonov NA. J Chem Theory Comput. 2009;6:300. doi: 10.1021/ct9003806. [DOI] [PMC free article] [PubMed] [Google Scholar]
- 11.Bardhan JP. Comput Sci Discovery. 2012;5:013001. [Google Scholar]
- 12.Shephard MS, Georges MK. International Journal for Numerical Methods in Engineering. 1991;32:709–749. [Google Scholar]
- 13.Yerry MA, Shephard MS. International Journal for Numerical Methods in Engineering. 1984;20:1965. [Google Scholar]
- 14.Samet H. The Design and Analysis of Spatial Structures. Addison-Wesley Publishing Company, Inc; 1990. [Google Scholar]
- 15.Aftosmis MJ, Berger MJ, Melton JE. AIAA. 1997;97:0196. [Google Scholar]
- 16.Berger MJ, Aftosmis MJ. AIAA. 2012. p. 1301. [Google Scholar]
- 17.Fenley MO, Olson WK, Chua K, Boschitsch AH. J Comput Chem. 1996;17:976. [Google Scholar]
- 18.Boschitsch AH, Fenley MO, Olson WK. J Comput Phys. 1999;151:212. [Google Scholar]
- 19.Harris RC, Boschitsch AH, Fenley MO. J Chem Theory Comput. 2013;9:3677. doi: 10.1021/ct300765w. [DOI] [PMC free article] [PubMed] [Google Scholar]
- 20.Harris RC, Boschitsch AH, Fenley MO. J Chem Phys. 2014;140:075102. doi: 10.1063/1.4864460. [DOI] [PMC free article] [PubMed] [Google Scholar]
- 21.Boschitsch AH, Fenley MO, editors. The Adaptive Cartesian Grid-Based Poisson-Boltzmann Solver: Energy and Surface Electrostatic Properties. Springer; 2014. [Google Scholar]
- 22.LeVeque RJ, Li Z. SIAM J Numer Anal. 1994;31:1019. [Google Scholar]
- 23.Zhou YC, Zhao S, Feig M, Wei GWJ. Comput Phys. 2006;213:1. [Google Scholar]
- 24.Wang J, Cai Q, Li ZL, Zhao HK, Luo R. Chemical Physics Letters. 2009;468(4–6):112–118. doi: 10.1016/j.cplett.2008.12.049. [DOI] [PMC free article] [PubMed] [Google Scholar]
- 25.Boschitsch AH, Danilov PV. J Comput Chem. 2012;33:1152. doi: 10.1002/jcc.22946. [DOI] [PMC free article] [PubMed] [Google Scholar]
- 26.Silalahi ARJ, Boschitsch AH, Harris RC, Fenley MO. J Chem Theory Comput. 2010;6:3631. doi: 10.1021/ct1002785. [DOI] [PMC free article] [PubMed] [Google Scholar]
- 27.Kirmizialtin S, Silalahi ARJ, Elber R, Fenley MO. Biophys J. 2012;102:829. doi: 10.1016/j.bpj.2011.12.055. [DOI] [PMC free article] [PubMed] [Google Scholar]
- 28.Boschitsch A, Fenley M. J Comput Chem. 2007;28:909–921. doi: 10.1002/jcc.20565. [DOI] [PubMed] [Google Scholar]
- 29.Lu XJ, Olson WK. Nucleic Acids Res. 2003;31:5108–5121. doi: 10.1093/nar/gkg680. [DOI] [PMC free article] [PubMed] [Google Scholar]
- 30.Cornell WD, Cieplak P, Bayly CI, Gould IR, Merz KM, Ferguson DM, Spellmeyer DC, Fox T, Caldwell JW, Kollman PA. J Am Chem Soc. 1995;117:5179. [Google Scholar]
- 31.Dolinsky TJ, Nielsen JE, McCammon JA, Baker NA. Nucleic Acids Res. 2004;32(suppl 2):W665. doi: 10.1093/nar/gkh381. [DOI] [PMC free article] [PubMed] [Google Scholar]
- 32.Pettersen EF, Goddard TD, Huang CC, Couch GS, Greenblatt DM, Meng EC, Ferrin TE. J Comput Chem. 2004;25:1605. doi: 10.1002/jcc.20084. [DOI] [PubMed] [Google Scholar]
- 33.Ma C, Baker NA, Joseph S, McCammon JA. J Am Chem Soc. 2002;124:1438. doi: 10.1021/ja016830+. [DOI] [PubMed] [Google Scholar]
- 34.Li B. SIAM J Math Anal. 2009;40:2536. [Google Scholar]
- 35.Chu VB, Bai Y, Lipfert J, Herschlag D, Doniach S. Biophys J. 2007;93:3202. doi: 10.1529/biophysj.106.099168. [DOI] [PMC free article] [PubMed] [Google Scholar]
- 36.Borukhov I, Andelman D, Orland H. Phys Rev Lett. 1997;79:435. [Google Scholar]
- 37.He Z, Chen SJ. J Chem Theory Comput. 2012;8:2095. doi: 10.1021/ct300227a. [DOI] [PMC free article] [PubMed] [Google Scholar]
- 38.Humphrey W, Dalke A, Schulten K. J Mol Graphics. 1996;14:33. doi: 10.1016/0263-7855(96)00018-5. [DOI] [PubMed] [Google Scholar]
- 39.Xu D, Landon T, Greenbaum NL, Fenley MO. Nucleic Acids Research. 2007;35:3836. doi: 10.1093/nar/gkm274. [DOI] [PMC free article] [PubMed] [Google Scholar]
- 40.Banatao DR, Altman RB, Klein TE. Nucl Acids Res. 2003;31:4450. doi: 10.1093/nar/gkg471. [DOI] [PMC free article] [PubMed] [Google Scholar]
- 41.Petukh M, Zhenirovskyy M, Li C, Li L, Wang L, Alexov E. Biophys J. 2012;102:2885. doi: 10.1016/j.bpj.2012.05.013. [DOI] [PMC free article] [PubMed] [Google Scholar]
- 42.Fenley MO, Harris RC, Jayaram B, Boschitsch AH. Biophys J. 2010;99:879. doi: 10.1016/j.bpj.2010.04.066. [DOI] [PMC free article] [PubMed] [Google Scholar]
- 43.Xu D, Greenbaum NL, Fenley MO. Nucl Acids Res. 2005;33:1154. doi: 10.1093/nar/gki249. [DOI] [PMC free article] [PubMed] [Google Scholar]
- 44.Harris RC, Mackoy T, Machado ACD, Xu D, Rohs R, Fenley MO. In: In Innovations in Biomolecular Modeling and Simulation. Schlick T, editor. Royal Society of Chemistry Publishing; London, UK: 2012. pp. 53–80. [Google Scholar]
- 45.Jones S, Shanahan HP, Berman HM, Thornton JM. Nucleic Acids Res. 2003;31:7189. doi: 10.1093/nar/gkg922. [DOI] [PMC free article] [PubMed] [Google Scholar]
- 46.Nimrod G, Szilágyi A, Leslie C, Ben-Tal N. J Mol Biol. 2009;387:1040. doi: 10.1016/j.jmb.2009.02.023. [DOI] [PMC free article] [PubMed] [Google Scholar]
- 47.Misra VK, Draper DE. Proc Nati Acad Sci USA. 2001;98:12456. doi: 10.1073/pnas.221234598. [DOI] [PMC free article] [PubMed] [Google Scholar]
- 48.Schumacher MA, Pearson RF, Møller T, Valentin-Hansen P, Brennan RG. EMBO J. 2002;21:3546. doi: 10.1093/emboj/cdf322. [DOI] [PMC free article] [PubMed] [Google Scholar]
- 49.Baker NA, Sept D, Joseph S, Holst MJ, McCammon JA. Proc Natl Acad Sci USA. 2001;98:10037. doi: 10.1073/pnas.181342398. [DOI] [PMC free article] [PubMed] [Google Scholar]
- 50.Devkota B, Petrov AS, Lemieux S, Boz MB, Tang L, Schneemann A, Johnson JE, Harvey SC. Biopolymers. 2009;91:530. doi: 10.1002/bip.21168. [DOI] [PMC free article] [PubMed] [Google Scholar]
- 51.Ubbink M. FEBS Lett. 2009;583:1060. doi: 10.1016/j.febslet.2009.02.046. [DOI] [PubMed] [Google Scholar]
- 52.Blomberg N, Gabdoulline RR, Nilges M, Wade RC. Proteins: Struct Funct Bioinf. 1999;37:379. doi: 10.1002/(sici)1097-0134(19991115)37:3<379::aid-prot6>3.0.co;2-k. [DOI] [PubMed] [Google Scholar]
- 53.Cai Q, Hsieh MJ, Wang J, Luo R. J Chem Theory Comput. 2009;6:203. doi: 10.1021/ct900381r. [DOI] [PMC free article] [PubMed] [Google Scholar]
- 54.Tjong H, Zhou HX. J Chem Phys. 2007;126:195102. doi: 10.1063/1.2735322. [DOI] [PubMed] [Google Scholar]


