

Abstract
BACKGROUND & AIMS
The intestine efficiently incorporates and rapidly secretes dietary fat as chylomicrons (lipoprotein particles comprising triglycerides, phospholipids, cholesterol, and proteins) that contain the apolipoprotein isoform apoB-48. The gut can store lipids for many hours after their ingestion, and release them in chylomicrons in response to oral glucose, sham feeding, or unidentified stimuli. The gut hormone glucagon-like peptide-2 (GLP-2) facilitates intestinal absorption of lipids, but its role in chylomicron secretion in human beings is unknown.
METHODS
We performed a randomized, single-blind, cross-over study, with 2 study visits 4 weeks apart, to assess the effects of GLP-2 administration on triglyceride-rich lipoprotein (TRL) apoB-48 in 6 healthy men compared with placebo. Subjects underwent constant intraduodenal feeding, with a pancreatic clamp and primed constant infusion of deuterated leucine. In a separate randomized, single-blind, cross-over validation study, 6 additional healthy men ingested a high-fat meal containing retinyl palmitate and were given either GLP-2 or placebo 7 hours later with measurement of TRL triglyceride, TRL retinyl palmitate, and TRL apoB-48 levels.
RESULTS
GLP-2 administration resulted in a rapid (within 30 minutes) and transient increase in the concentration of TRL apoB-48, compared with placebo (P = .03). Mathematic modeling of stable isotope enrichment and the mass of the TRL apoB-48 suggested that the increase resulted from the release of stored, presynthesized apoB-48 from the gut. In the validation study, administration of GLP-2 at 7 hours after the meal, in the absence of additional food intake, robustly increased levels of TRL triglycerides (P = .007), TRL retinyl palmitate (P = .002), and TRL apoB-48 (P = .04) compared with placebo.
CONCLUSIONS
Administration of GLP-2 to men causes the release of chylomicrons that comprise previously synthesized and stored apoB-48 and lipids. This transiently increases TRL apoB-48 levels compared with placebo.
Keywords: Enterocyte, Plasma Lipid, Fatty Acid, Human Trial
Dietary triglycerides (TGs) are digested in the intestine by lipase enzymes, yielding monoacylglycerol and fatty acids, which are absorbed from the lumen of the gut, re-esterified to TGs, and assembled into apolipoprotein (apo)B-48–containing chylomicron particles within the enterocyte.1,2 Chylomicrons are secreted from the basolateral surface of enterocytes into the lamina propria and the lymphatic system3 before reaching the circulation.2 TG digestion and absorption is extremely efficient and rapid, with more than 95% of ingested TGs absorbed by the intestine.2 Despite the efficiency of TG absorption and chylomicron production and release, the gut has the capacity to store TGs from a meal. The stored TGs subsequently can be released rapidly as chylomicrons in response to factors such as glucose,3 sham feeding,4 and further mixed meal ingestion.5
The gut hormone glucagon-like peptide-2 (GLP-2) is encoded by the proglucagon gene and secreted by L cells in response to nutrient ingestion.6 Studies in the Syrian Golden hamster have shown that GLP-2 acutely enhances chylomicron secretion.7,8 In addition, GLP-2 enhances nutrient absorption, gut barrier function, intestinal blood flow, crypt cell proliferation, and reduces inflammation.6 As a result, GLP-2 is of proven therapeutic benefit in patients with malabsorption secondary to short-bowel syndrome.9,10 The GLP-2 analogue teduglutide is now approved in a number of countries for treatment of this condition.6,11 Only 1 study has previously examined the effects of GLP-2 on plasma lipids in human beings.12 Intravenous infusion of native GLP-2 was shown to increase postprandial plasma TG and free fatty acid (FFA) concentrations.12 The effect of GLP-2 on apoB-100 (indicative of VLDL) and apoB-48 (indicative of intestinal chylomicrons) metabolism is not known.
We examined the acute effects of a single, subcutaneous dose of GLP-2 on intestinal and hepatic lipoprotein production in healthy human beings, during constant high-fat, mixed-macronutrient formula infusion, through a nasoduodenal tube and under conditions of a pancreatic clamp as previously described13 (study A). Because hypothesis-generating non–steady-state solutions suggested that GLP-2 increases intestinal triglyceride-rich lipoprotein (TRL) (chylomicron) concentration by releasing previously synthesized apoB-48 rather than stimulating secretion of newly synthesized particles, we performed an additional study to test this hypothesis (study B). Volunteers were given a liquid meal enriched with retinyl palmitate, thus labeling the lipid absorbed from that meal.14 In the absence of further food ingestion, a single dose of GLP-2 administered 7 hours after the high-fat meal increased TRL TG, apoB-48, and retinyl palmitate levels, suggesting that GLP-2 releases chylomicrons comprising previously synthesized and stored apoB-48 and lipid from the gut in human beings.
Materials and Methods
Six healthy normoglycemic and normolipidemic volunteers, on no medication, participated in study A, and a further 6 volunteers participated in study B. Both studies were randomized, single-blind, cross-over studies with 2 visits separated by 4 weeks (GLP-2 was administered during one visit and placebo was administered during the other). Baseline demographics and biochemistry are shown in Table 1. For study A, participants underwent lipoprotein kinetic studies with constant intraduodenal feeding and administration of a pancreatic clamp and L-[5,5,5-2H3]-leucine (d3-leucine) (Figure 1A).13 The primary outcome was the change in TRL apoB-48 concentration. Further details about mathematic modeling and biochemical assays are available online in the Supplementary Materials and Methods section. For study B, participants had a liquid meal along with retinyl palmitate to label chylomicrons produced from the meal (Figure 5A). Seven hours later, in the absence of food intake, GLP-2 or placebo was administered and the increment in TRL TG, apoB-48, and retinyl palmitate concentration was assessed (primary outcome). Further details are available in the Supplementary Information section. All authors had access to the study data and reviewed and approved the study manuscript.
Table 1.
Baseline Demographics and Biochemistry
| Characteristic | Study A (n = 6), mean ± SEM |
Study B (n = 6), mean ± SEM |
|---|---|---|
| Age, y | 40.0 ± 5 | 48.8 ± 3.3 |
| Body weight, kg | 74.8 ± 5.1 | 81.5 ± 4.6 |
| Body mass index, kg/m2 | 24.4 ± 1.2 | 25.4 ± 0.7 |
| Fasting plasma glucose level, mmol/L |
5.1 ± 0.1 | 4.8 ± 0.2 |
| Fasting plasma TG level, mmol/L |
0.9 ± 0.1 | 0.6 ± 0.04 |
Figure 1.
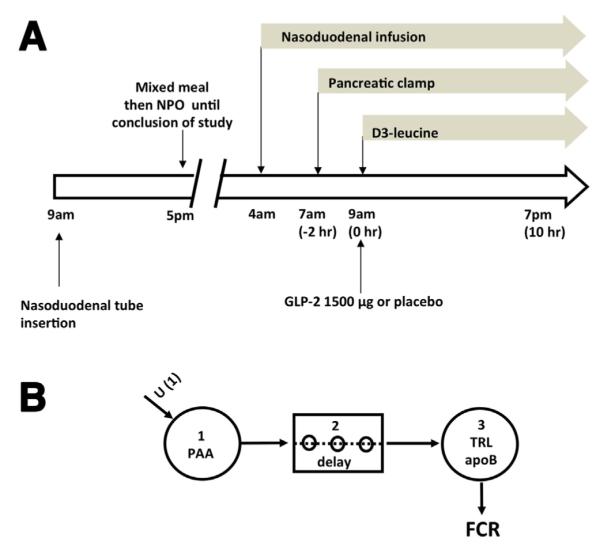
(A) Outline of lipoprotein kinetic study (study A). Volunteers had a nasoduodenal tube inserted the day before the study. After an overnight fast, a liquid mixed macronutrient formula was infused through the nasoduodenal tube for 15 hours from 4 AM on the day of the study. A pancreatic clamp (with infusion of somatostatin, insulin, glucagon, and growth hormone) was started at 7 AM. TRL kinetics were studied with a primed, constant infusion of deuterated leucine (d3-leucine) for 10 hours starting at 9 AM. At 9 AM volunteers received a subcutaneous dose of either GLP-2 (1500 ug) or placebo. NPO, Nil per oral except water. (B) Multicompartmental model for analysis of TRL apoB-100 kinetics and TRL apoB-48 placebo treatment. Infused d3-leucine enters the plasma amino acid pool (PAA) (compartment 1). After a delay (compartment 2), it is incorporated into TRL apoB (compartment 3). Enrichment time-course curves were analyzed with the multicompartmental model to derive FCR.
Figure 5.

(A) Outline of Study B. Volunteers ingested a liquid meal along with 120,000 IU of vitamin A (retinyl palmitate) at 7 am (T = −7 hours). At 2 pm (T = 0 hours) volunteers received a subcutaneous dose of either GLP-2 (1500 mcg) or placebo and blood sampling was performed for a further 3 hours until 5 pm (T = 3 hours). No food was permitted after ingestion of the meal at 7 am until 5 pm. Representative (n = 1) concentration curve of (B) plasma triglyceride (TG), (C) triglyceride rich lipoprotein (TRL) TG, and (D) TRL retinyl palmitate from a single volunteer (placebo, black diamond and dotted line; GLP-2, black square and solid line) following ingestion of the liquid meal containing retinyl palmitate at −7 hours. GLP-2 or placebo was administered at 0 hours. GLP-2 acutely increased the concentration or all of these parameters for approximately 2 hours following its administration.
Study Oversight
Both studies were performed according to the principles of the Declaration of Helsinki and were approved by the institutional research ethics board (University Health Network Research Ethics Board, Toronto, Ontario, Canada). All participants provided their written informed consent.
Results
Study A: Determination of Intestinal and Hepatic TRL Particle Secretion in Response to GLP-2
GLP-2 administration increases plasma GLP-2 concentration
Administration of 1500 μg of GLP-2 subcutaneously significantly increased plasma total GLP-2 concentration compared with placebo (Supplementary Figure 1A). GLP-2 concentration decreased at 4 hours to approximately half of the level at 2 hours.
GLP-2 transiently increases plasma TG concentration
GLP-2 treatment transiently increased plasma TG concentration with a significant increment in plasma TG in the first 3 hours after administration by analysis of variance (ANOVA) of the increment (P = .001). In addition, both the peak concentration at 1 hour (placebo, 0.92 ± 0.13 vs GLP-2, 1.23 ± 0.20 mmol/L; P = .03) and the area under the concentration curve in the first 3 hours (AUC0–3) after administration (placebo, 2.7 ± 0.4 vs GLP-2, 3.1 ± 0.4 mmol/L/h; P = .03) were significantly higher with GLP-2 compared with placebo (Figure 2A). There was an increase in TRL TG with GLP-2 treatment by ANOVA (P = .04). The peak concentration at 1 hour (placebo, 0.61 ± 0.11 vs GLP-2, 0.79 ± 0.09 mmol/L; P = .15) and the AUC0–3 (placebo, 1.7 ± 0.3 vs GLP-2, 1.9 ± 0.2 mmol/L/h; P = .24) (Figure 2B) were not significantly different.
Figure 2.

Mean (n = 6) plasma (A) TG concentration, (B) TRL TG, (C) TRL apo-B48, and (D) TRL apoB-100 concentrations after subcutaneous administration of either GLP-2 or placebo (placebo, black diamond and dotted line; GLP-2, black square and solid line) was assessed during the course of the kinetic study. The mean AUC for the first 3 hours after either GLP-2 or placebo administration is shown in the inset for each of these parameters (placebo, white bar; GLP-2, black bar). (A) GLP-2 treatment caused a transient increase in plasma TG level with a significant increase in both AUC in the first 3 hours and peak concentration at 1 hour. †P = .03, *P = .03. (B) There was no change in TRL TG concentration as assessed by AUC in the first 3 hours and peak concentration at 1 hour. (C) GLP-2 treatment caused a transient increase in TRL apoB-48 concentration, with a significant increase in both AUC in the first 3 hours and peak concentration at 1 hour. ††P = .02, **P = .02. (D) GLP-2 did not affect TRL apoB-100 concentration.
GLP-2 increases TRL apoB-48 but does not affect TRL apoB-100 concentration
GLP-2 treatment resulted in an acute, transient increase in TRL apoB-48 concentration in the first 3 hours after administration based on ANOVA of the increment (P < .001). In addition, the peak concentration 1 hour after administration (placebo, 3.6 ± 1.0 vs GLP-2, 9.5 ± 2.6 mg/L; P = .02) (Figure 2C) and AUC0–3 (placebo, 9.3 ± 2.3 vs GLP-2, 19.3 ± 5.0 mg/L/h; P = .02) (Figure 2C) were significantly higher with GLP-2 treatment. GLP-2 treatment did not affect the TRL apoB-100 concentration by ANOVA (P = .4). The mean concentration for the 10-hour kinetics study (placebo, 71.1 ± 7.9: vs GLP-2, 74.8 ± 7.4 mg/L; P = .5) and AUC0–3 (placebo, 215.3 ± 27.6 vs GLP-2, 216 ± 21.9 mg/L/h; P = .95) (Figure 2D) were not significantly different.
GLP-2 Does Not Affect TRL ApoB-100 Kinetics
Because the TRL apoB-100 concentration was relatively constant over time, with or without GLP-2 treatment, a conventional steady-state compartmental model was used to assess TRL apoB-100 kinetics. GLP-2 treatment did not affect the TRL apoB-100 enrichment time course (Figure 3A). GLP-2 treatment did not significantly affect the steady-state TRL apoB-100 fractional catabolic rate (FCR) (placebo, 8.3 ± 1.9 vs GLP-2, 5.9 ± 1.0 pools/day; P = .1) or production rate (PR) (Figure 3B) (placebo, 250.6 ± 49.7 vs GLP-2, 179.0 ± 26.7 mg/kg/day; P = .08), although there was a possible trend toward a reduction in both FCR and PR with GLP-2 treatment, resulting in no net effect on TRL apoB-100 concentration.
Figure 3.

(A) Mean TRL apoB-100 enrichment for the duration of the study for placebo and GLP-2 are depicted. Both model generated curves (placebo, dotted line; GLP-2, solid line) and actual data are shown (placebo, black diamond; GLP-2, black square). MFL: Mole fraction labeled. (B) Steady state multi-compartmental modeling was carried out to assess TRL apoB-100 FCR (fractional catabolic rate) and PR (production rate) (placebo, white bars; GLP-2, black bars). There were no significant differences in either FCR or PR between GLP-2 and placebo treatments. (C) Mean TRL apoB-48 enrichment for the duration of the study for placebo and GLP-2 treatments are depicted. Both models generated curves (placebo, dotted line; GLP-2, solid line) and actual data are shown (placebo, black diamond; GLP-2, black square).
Non–Steady-State Modeling Suggests That GLP-2 Treatment Increases the TRL ApoB-48 Concentration by Releasing Preformed, Unlabeled TRL ApoB-48
TRL apoB-48 enrichment showed a steady increase toward plateau with placebo (Figure 3C). Because TRL apoB-48 concentrations were approximately constant during the kinetic study (Figure 2C), a conventional steady-state model was used to derive kinetic parameters for the placebo treatment, which yielded a TRL apoB-48 FCR of 15.4 ± 2.9 pools/day and a PR of 23.3 ± 9.0 mg/kg/day. However, because GLP-2 induced a large transient increase in TRL apoB-48 concentrations (Figure 2C), steady-state modeling was not applied and no kinetic parameters were obtained. Instead, non–steady-state modeling of TRL apoB-48 mass and tracer enrichment data was used to test various hypotheses. Specifically, the following 3 hypotheses were tested to shed light on the potential mechanisms whereby GLP-2 caused this transient increase in TRL apoB-48 concentration.
Hypothesis 1 proposes that GLP-2 causes a transient Gaussian-shaped increase in the PR with a constant FCR of TRL apoB-48 over time (ie, the change in TRL apoB-48 concentration in response to GLP-2 was owing to increased TRL apoB-48 de novo synthesis but not catabolism). This model was very consistent with the measured TRL apoB-48 concentrations (Figure 4A). However, the predicted TRL apoB-48 tracer enrichment with this model was much higher than the measured enrichments, especially during the early time points (Figure 4B). This was because a very large (~50-fold) and rapid, transient increase of apoB-48 de novo synthesis was required to fit the concentration data. At 5 minutes after the d3-leucine priming dose, plasma leucine enrichment was approximately 50% higher than the plateau enrichment owing to an initial overpriming condition. Thus, if the increased TRL apoB-48 concentration was entirely owing to de novo synthesis as postulated by this model, an extremely high early enrichment in TRL apoB-48 must result as the small TRL apoB-48 pool becomes dominated by highly enriched de novo synthesized apoB-48. This suggests that increased production of TRL apoB-48 is unlikely to be the major contributor to increased TRL apoB-48 concentration in response to GLP-2.
Figure 4.

(A, B) Non-steady state modeling of TRL apoB-48 kinetics after GLP-2 administration (Hypothesis 1) was carried out. This model hypothesizes that GLP-2 transiently increases TRL apoB-48 de novo synthesis (production rate, PR) and the FCR is constant over time. TRL apoB-48 concentrations (A, solid line) and TRL apoB-48 enrichment (B, solid line) predicted by this model are compared to actual values (black squares). This hypothesis was consistent with the observed transient increase in TRL apoB-48 concentration, but it predicted that TRL apoB-48 enrichment was much higher than the actual values during the early time points. (C, D) Non-steady state modeling of TRL apoB-48 kinetics after GLP-2 administration (Hypothesis 2) was carried out. This model hypothesizes that GLP-2 transiently decreases TRL apoB-48 FCR and the PR of de novo synthesized apoB-48 is constant over time. TRL apoB-48 concentrations (C, solid line) and TRL apoB-48 enrichment (D, solid line) predicted by this model are compared to actual values (black squares). This hypothesis was consistent with the measured TRL apoB-48 enrichment, but was inconsistent with measured TRL apoB-48 concentrations. (E, F) Non-steady state modeling of TRL apoB-48 kinetics after GLP-2 administration (Hypothesis 3) was carried out. This model predicts that GLP-2 transiently releases unlabelled TRL apoB-48 into the circulation and the PR of newly synthesized apoB-48 and FCR are constant over time. TRL apoB-48 concentrations (E, solid line) and TRL apoB-48 enrichment (F, solid line) predicted by this model are compared to actual values (black squares). This hypothesis was consistent with both the measured TRL apoB-48 concentrations and enrichments.
Hypothesis 2 proposes that GLP-2 causes a transient reduction in FCR without affecting PR because the majority of TRL apoB-48 in the early part of the kinetic study was unlabeled and therefore likely not newly synthesized (ie, the change in TRL apoB-48 concentration in response to GLP-2 was owing to increased TRL apoB-48 catabolism but not de novo synthesis). This hypothesis was consistent with the measured TRL apoB-48 enrichment (Figure 4D) but was inconsistent with the concentration data (Figure 4C). The solution illustrated proposed that the FCR decreased to almost zero immediately after t = 0, and was held at that level for 2.5 hours before returning to the starting value. Because TRL apoB-48 turns over at approximately 0.64 pools/h (15.4 pools/day as indicated by the placebo arm of study A), it is impossible to account for the approximately 4-fold increase in apoB-48 concentration within 1 hour even if clearance is completely turned off. This suggests that decreased clearance is unlikely to be a major contributor to the increased concentration of TRL apoB-48.
We considered whether a combination of reduced FCR and increased PR could explain the increase in TRL apoB-48 concentration. In the model proposed earlier (hypothesis 2), GLP-2 reduced TRL apoB-48 FCR to almost zero for 2.5 hours, enabling the predicted enrichment curves to fit the actual data. If one were to impose an increase in PR on this model, the predicted enrichment curve would no longer be concordant with the actual data. Therefore, a combination of decreased FCR and increased PR is unlikely to account for the increase in TRL apoB-48 concentration.
Hypothesis 3 proposes that GLP-2 causes a Gaussian-shaped transient release of preformed (unlabeled) TRL apoB-48 into plasma immediately after treatment to transiently increase TRL apoB-48 concentration. The Gaussian function (centered ~0.5 h with a 0.1-h width) allowed a rapid, transient, approximately 20-fold increase in the total rate of appearance of unlabelled TRL apoB-48 into plasma. It was assumed that the PR from de novo synthesis and the FCR were constant across time. This hypothesis was consistent with both the measured TRL apoB-48 concentration (Figure 4E) and enrichment (Figure 4F) data, thus representing the most plausible explanation for the observed effects of GLP-2.
Study B: Examination of the Effect of GLP-2 on the Mobilization and Release of Intestinal Lipid Storage
In a separate set of experiments, we further directly tested the hypothesis that GLP-2 causes mobilization and release of chylomicrons comprising previously synthesized and stored apoB-48 and lipids from the gut.
GLP-2 Acutely Increases Plasma TG, TRL TG, and TRL Retinyl Palmitate, 7 Hours After a Mixed Meal Containing Retinyl Palmitate, in the Absence of Further Food Ingestion
Representative figures are depicted from 1 study participant treated with GLP-2 and placebo, for plasma TG (Figure 5B), TRL TG (Figure 5C), and TRL retinyl palmitate (Figure 5D) concentrations over time. After the meal, plasma TG, TRL TG, and TRL RP increased, and then gradually decreased. After administration of placebo, this gradual decrease in concentrations of these parameters continued and reached the baseline by the end of the study period. In contrast, immediately after GLP-2 treatment there was a rapid, transient increase in these parameters, with a return to baseline by the end of the study at t = 3 hours. This pattern was seen in all subjects. ANOVA of the mean data showed a significant difference in the increment of plasma TG (P < .001), TRL TG (P < .001), and TRL RP (P < .001) with GLP-2 treatment. The mean data from all volunteers have been expressed as a bar chart showing the incremental area under the curve in the first 3 hours after treatment (iAUC0–3) for concentration over time for these parameters with (Figure 6A–C). GLP-2 treatment increased plasma TG concentration (iAUC0–3: placebo, −0.82 ± 0.19 vs GLP-2, 0.31 ± 0.19 mmol/L/h; P = .01; [Figure 6A, N = 6], peak increment, placebo, −0.3 ± 0.07 vs GLP-2, 0.45 ±=0.1 mmol/L; P = .005), as well as TRL TG (iAUC0–3: placebo, −0.71 ± 0.18 vs GLP-2, 0.28 ± 0.16 mmol/L/h; P = .002 [Figure 6B, N = 6], peak increment: placebo, −0.14 ± 0.02 vs GLP-2, 0.42 ± 0.11; P = .003). GLP-2 treatment increased TRL retinyl palmitate (iAUC0–3: placebo, −0.79 ± 0.37 vs GLP-2, 0.86 ± 0.21 μmol/L/h; P = .002) [Figure 6C, N = 6], peak increment: placebo, −0.23 ± 0.09 vs GLP-2, 0.62 ± = 0.14; P < .001).
Figure 6.

(A–D) Bar charts illustrating the mean (n = 6) incremental AUC curve vs time (with the T = 0 hour concentration taken as the baseline) (positive bars above zero indicate an increase in concentration and negative bars below zero indicate a decrease in concentration) for the first 3 hours after administration of either GLP-2 or placebo at T = 0 (placebo, white bar and black outline; GLP-2, black bar) for the following parameters: (A) plasma TG, (B) TRL TG, (C) TRL retinyl palmitate, and (D) TRL apoB-48. GLP-2 significantly increased plasma TG (‡P = .01), TRL TG (‡‡P .007), TRL retinyl palmitate (‡‡‡P = .002), and TRL apoB-48 (¶P = .04) concentrations compared with a decrease in these parameters with placebo. (E) Mean concentration curves of chylomicron retinyl palmitate immediately before (T = 0 hours) and up to 60 minutes after administration of GLP-2 and placebo (placebo, black diamond and dotted line; GLP-2, black square and solid line) (n = 5). GLP-2 significantly increased the chylomicron retinyl palmitate concentration at 60 minutes (¶¶P = .003).
GLP-2 Acutely Increases TRL ApoB-48
Consistent with the findings from study A, GLP-2 treatment increased TRL apoB-48 concentrations during study B as judged by ANOVA of the increment in the first 3 hours (P = .02). In addition, the iAUC0–3 (placebo, −2.51 ± 0.87 vs GLP-2, 1.45 ± 1.72 mg/L/h; P = .04, n = 6) (Figure 6D) and peak increment (placebo, −0.7 ± 0.3 vs GLP-2, 2.1 ± 0.8; P = .006) were higher with GLP-2 treatment. This indicates that GLP-2 caused an increase in circulating TRL particles of intestinal origin.
GLP-2 Acutely Increases Release of Chylomicrons (Svedberg Floatation Rate > 400) Labeled With Retinyl Palmitate
We further examined whether GLP-2 caused the release of chylomicrons by measuring retinyl palmitate specifically in the chylomicron fraction (Svedberg floatation rate [Sf] > 400). GLP-2 increased the chylomicron retinyl palmitate concentration (peak concentration at 60 minutes: placebo, 0.06 ± 0.01 vs GLP-2, 0.38 ± 0.06 μmol/L; P = .003, n = 5) (Figure 6E).
Discussion
Animal studies7,8 previously have suggested that the gut hormone GLP-2 stimulates intestinal lipid uptake and lipoprotein secretion. This human study assessed the effects of GLP-2 on intestinal and hepatic lipoprotein production. We showed the following: (1) GLP-2 acutely increases TRL apoB-48 concentration; (2) this increase in TRL apoB-48 concentration most likely occurs as a result of the rapid release of chylomicrons containing previously synthesized and retained apoB-48 and lipid from the gut; and (3) GLP-2 does not affect TRL apoB-100 concentration. This novel action of GLP-2 on chylomicron secretion is in contrast to that of most known regulators,1,15 which modulate de novo synthesis and secretion of apoB-48–containing lipoproteins. This study expands our knowledge of the biology of GLP-2 action and the regulation of chylomicron secretion.
Because GLP-2 caused an acute and transient increase in TRL apoB-48 concentration, we used hypothesis-generating non–steady-state modeling as a tool to shed light on the potential underlying mechanism(s). By using this approach, the most likely solution supports the hypothesis that the increase in TRL apoB-48 concentration was due to the release of previously synthesized apoB-48 into the circulation as chylomicron particles. Enterocytes can store lipid absorbed from a previous meal3 as well as previously synthesized minimally lipidated primordial apoB-48-containing particles.16 In addition, preformed chylomicrons produced from a previous meal can be stored in the mesenteric lymphatic system.3 Furthermore, these stored lipids and previously synthesized apoB-48 can be released rapidly by a second stimulus.3,4 We therefore further examined whether GLP-2 functioned as such a second stimulus to cause the rapid and transient increase in circulating chylomicron concentration. We administered a liquid meal along with retinyl palmitate that labels lipid absorbed from the meal and secreted in chylomicrons. A single subcutaneous dose of GLP-2, administered 7 hours after that meal and in the absence of additional food intake, caused an acute increase in retinyl palmitate–labeled TRL TG and chylomicrons as well as TRL apoB-48 concentration. This strongly suggests that GLP-2 releases previously synthesized apoB-48 and stored lipids into the circulation as chylomicrons. In study A, GLP-2 treatment increased TRL apoB-48 robustly with a more modest increase in plasma TG and TRL TG, suggestive of the release of smaller, less-lipidated chylomicron particles. Given the small sample size, further studies are needed to establish whether GLP-2 treatment releases smaller chylomicron particles.
The mechanism underlying GLP-2–induced release of intestinal storage of lipids and apoB-48 remains to be elucidated. GLP-2 is known to increase mesenteric blood flow, most likely by up-regulating endothelial nitric oxide synthase and increasing nitric oxide activity.6,17,18 Increased blood flow with ensuing improved interstitial hydration potentially can release stored, preformed chylomicrons within the lamina propria and lymphatic system.19 Newly synthesized chylomicrons (generated from stored enteral lipids being hydrolyzed, re-esterified, and conjugated to previously synthesized primordial apoB-48 particles) also potentially could contribute to the increase in chylomicron concentration, although GLP-2 is not known to affect this process. Further studies will be needed to confirm whether enhanced blood flow leads to the release of preformed chylomicrons in response to GLP-2 and/or whether GLP-2 can mobilize cytosolic enteral lipid deposits. It is worth noting that the GLP-2 receptor is not expressed on enterocytes but has been reported in enteric neurons, subepithelial myofibroblasts, and enteroendocrine cells,6 suggesting that the effects of GLP-2 on chylomicron secretion likely are indirect.
We attempted to control for other known regulators of intestinal lipoprotein metabolism that could have affected chylomicron secretion in the present study (study A). Insulin has been shown previously to inhibit,20 whereas FFA stimulates, de novo intestinal lipoprotein production in human beings.21 There were no significant differences in insulin (Supplementary Figure 1B) or FFA concentrations (Supplementary Figure 1C). As shown previously, GLP-2 treatment was associated with a significant increase in plasma glucagon concentration,12 despite the administration of a pancreatic clamp in our study (Supplementary Figure 1D). We previously showed, however, that hyperglucagonemia has no effect on intestinal TRL apoB-48–containing particle production or clearance,22 and hence this is unlikely to contribute to the increased chylomicron secretion. Despite concomitant with the marked hyperglucagonemia, there was a modest increase in plasma glucose concentration (mean plasma glucose: placebo, 8.0 ± 0.3 vs GLP-2, 8.7 ± 0.3 mmol/L; P = .049) (Supplementary Figure 2A). It is unlikely that the modest increase in plasma glucose concentration in study A was a major contributor to the increasein TRL apoB-48 because arobust increase in TRL apoB-48 after GLP-2 administration was seen without changes in plasma glucose levels in study B (Supplementary Figure 2B).
We previously showed that the GLP-1 analogue exenatide reduces chylomicron secretion13 in human beings, concordant with the findings in Syrian Golden hamsters and mice.23 Both GLP-1 and GLP-2 are encoded by the proglucagon gene and secreted by L cells, in equimolar amounts, in response to nutrient ingestion, but have opposing effects on chylomicron secretion.8 In Syrian Golden hamsters, co-infusion of GLP-1 and GLP-2 after oral gavage show that GLP-2 has the dominant effect. Both GLP-1 and GLP-2 are degraded by the ubiquitous protease dipeptidyl peptidase IV (DPP-IV), with the former being degraded more rapidly.8 This likely explains the predominant GLP-2 effect when hamsters are co-infused with GLP-1 and GLP-2 for a short time course.8 Consistent with this, administration of a DPP-IV inhibitor or a more prolonged infusion of GLP-1 and GLP-2 elicits a GLP-1–predominant effect. We recently showed that the DPP-IV inhibitor sitagliptin acutely reduces chylomicron production in human beings.24 Intriguingly, hamsters rendered insulin resistant by high-fructose feeding are more sensitive to GLP-2 and/or less responsive to GLP-1 in terms of chylomicron production.8 It remains to be determined, however, whether in human beings one of these peptides has a dominant effect with regard to chylomicron secretion and whether this response is dysregulated in hypertriglyceridemic states such as insulin resistance. In the current study we administered a pharmacologic dose of GLP-2, resulting in a supraphysiologic plasma concentration of GLP-2 that was consistent with a previous study.25 The relative contribution of endogenous GLP-2 to postprandial chylomicron secretion in normal physiology and hypertriglyceridemic states such as insulin resistance is unknown and warrants further investigation. Of note, 2 known regulators of the release of stored enteral lipids are glucose and mixed meals, both of which stimulate GLP-2 secretion.6 There are, to our knowledge, currently no GLP-2 antagonists available for use in human beings. Data from animal studies using acute and short-term inhibitors of GLP-2 as well as studies in GLP-2–receptor knockout mice, have shown a role of endogenous GLP-2 in regulating adaptive small-bowel growth to stimuli such as refeeding and toxins.26–29 These studies did not assess triglyceride or chylomicron concentration. Future studies with these animal models are needed to evaluate the role of endogenous GLP-2 in regulating chylomicron secretion in normal health and hypertriglyceridemic states. If indeed endogenous GLP-2 plays a role in regulating chylomicron secretion, antagonizing GLP-2 action may be a potential therapeutic target for postprandial hypertriglyceridemia, a risk factor for atherosclerosis. Recent studies have suggested that genetic variants associated with low plasma triglyceride levels are athero-protective.30,31 Reassuringly, bowel morphology, nutrient absorption, and body weight do not appear to be affected with short- or long-term inhibition of GLP-2 action, suggesting that it might be a safe therapeutic target.26–29 GLP-2 treatment, at pharmacologic doses, increases bone mineral density (BMD).32 These aforementioned animal studies did not report BMD measurements and therefore it is unknown whether antagonizing GLP-2 action reduces BMD.
Although GLP-2 treatment did not affect TRL apoB-100 concentration, there was a trend toward reduced production as well as clearance. Given the small sample size, it is not possible to exclude an effect of GLP-2 on TRL apoB-100 kinetics. Future studies with a larger sample size are necessary to assess definitively whether GLP-2 affects TRL apoB-100 kinetics.
In conclusion, we have shown that GLP-2 acutely increases intestinal TRL concentration in human beings, most likely by increasing secretion of chylomicrons comprising preformed but retained apoB-48. This novel facet of GLP-2 action is of particular relevance because the GLP-2 analogue teduglutide is an approved treatment for patients with short-bowel syndrome and is being investigated as a potential treatment for malabsorption secondary to other bowel disorders.6,33 Whereas stimulation of fat absorption and enhancement of chylomicron secretion may be clinically beneficial in patients with short bowel syndrome and other intestinal disorders associated with malabsorption, endogenously secreted GLP-2 stimulation of chylomicron secretion in healthy individuals may contribute to hyperlipidemia, which could promote atherosclerosis. Antagonizing GLP-2 action potentially may be a viable therapeutic strategy to reduce postprandial increases in TRL, which ultimately might reduce atherosclerotic risk. Finally, this study also showed the utility and potential of using non–steady-state kinetic models to generate hypotheses for explaining novel biological phenomena and to direct the design of subsequent confirmatory studies.
Supplementary Material
Supplementary Figure 1. Mean plasma total GLP-2 concentration (A) after administration of GLP-2 and placebo (placebo, black diamond and dotted line; GLP-2, black square and solid line). Total GLP-2 concentration was significantly higher 2 and 4 hours after GLP-2 administration compared with placebo. §P < .005, §§P < .05. Plasma insulin (B), FFAs (C), and glucagon (D) (placebo, black diamond and dotted line; GLP-2, black square and solid line) were assessed during the course of the kinetic study (study A). There was no significant difference in concentration of insulin or FFA between treatments whereas glucagon was significantly higher with GLP-2 treatment vs placebo (mean concentration: placebo, 85.3 ± 15.9 vs GLP-2, 143.3 ± 14.2 pg/mL; P = .01).
Supplementary Figure 2. Plasma glucose concentrations (placebo, black diamond and dotted line; GLP-2, black square and solid line) were assessed during the course of study A (A) and study B (B). Glucose concentration was modestly higher with GLP-2 treatment (mean concentration: placebo, 8.0 ± 0.3 vs GLP-2, 8.7 ± 0.3 mmol/L; P = .049) in study A (A). There was no significant difference in glucose concentration between treatments in study B (B).
Acknowledgments
The authors are grateful to Dr David Sigalet (Alberta Children’s Hospital, University of Calgary, Alberta, Canada) for his collaboration in procuring native GLP-2. The authors are indebted to Brenda Hughes and Patricia Harley for their nursing assistance in conducting the clinical protocol, and to Linda Szeto for technical assistance.
The authors would like to thank Dr. Daniel Drucker (Lunenfeld-Tanenbaum Research Institute, University of Toronto) for his advice in the preparation of the manusript.
Funding This work was supported by an operating grant from the Canadian Institutes of Health Research (G.F.L.) and a National Institutes of Health grant from the Washington University Nutrition Obesity Research Center (DK056341 to B.W.P.). Gary Lewis holds the Sun Life Financial Chair in Diabetes and the Drucker Family Chair in Diabetes Research, Satya Dash and Cecilia Morgantini are recipients of postdoctoral fellowship awards from the Banting and Best Diabetes Centre (University of Toronto), and Satya Dash is also the recipient of a Focus on Stroke 12 Fellowship Award from the Heart and Stroke Foundation of Canada.
Abbreviations used in this paper
- ANOVA
analysis of variance
- apoB
apolipoprotein B
- AUC0–3
area under the concentration curve in the first 3 hours after treatment
- BMD
bone mineral density
- DPP-IV
dipeptidyl peptidase IV
- FCR
fractional catabolic rate
- FFA
free fatty acid
- GLP-2
glucagon-like peptide-2
- iAUC0–3
incremental area under the curve in the first 3 hours after treatment
- PR
production rate
- Sf
Svedberg floatation rate
- TG
triglyceride
- TRL
triglyceride-rich lipoprotein
Footnotes
Supplementary Material Note: To access the supplementary material accompanying this article, visit the online version of Gastroenterology at www.gastrojournal.org, and at http://dx.doi.org/10.1053/j.gastro.2014.08.037.
Conflicts of interest The authors disclose no conflicts.
References
- 1.Xiao C, Hsieh J, Adeli K, et al. Gut-liver interaction in triglyceride-rich lipoprotein metabolism. Am J Physiol Endocrinol Metab. 2011;301:E429–E446. doi: 10.1152/ajpendo.00178.2011. [DOI] [PubMed] [Google Scholar]
- 2.Pan X, Hussain MM. Gut triglyceride production. Biochim Biophys Acta. 2012;1821:727–735. doi: 10.1016/j.bbalip.2011.09.013. [DOI] [PMC free article] [PubMed] [Google Scholar]
- 3.Robertson MD, Parkes M, Warren BF, et al. Mobilisation of enterocyte fat stores by oral glucose in humans. Gut. 2003;52:834–839. doi: 10.1136/gut.52.6.834. [DOI] [PMC free article] [PubMed] [Google Scholar]
- 4.Chavez-Jauregui RN, Mattes RD, Parks EJ. Dynamics of fat absorption and effect of sham feeding on postprandial lipema. Gastroenterology. 2010;139:1538–1548. doi: 10.1053/j.gastro.2010.05.002. [DOI] [PMC free article] [PubMed] [Google Scholar]
- 5.Evans K, Kuusela PJ, Cruz ML, et al. Rapid chylomicron appearance following sequential meals: effects of second meal composition. Br J Nutr. 1998;79:425–429. doi: 10.1079/bjn19980072. [DOI] [PubMed] [Google Scholar]
- 6.Drucker DJ, Yusta B. Physiology and pharmacology of the enteroendocrine hormone glucagon-like peptide-2. Annu Rev Physiol. 2014;76:561–583. doi: 10.1146/annurev-physiol-021113-170317. [DOI] [PubMed] [Google Scholar]
- 7.Hsieh J, Longuet C, Maida A, et al. Glucagon-like peptide-2 increases intestinal lipid absorption and chylomicron production via CD36. Gastroenterology. 2009;137:997–1005. 1005, e1–4. doi: 10.1053/j.gastro.2009.05.051. [DOI] [PubMed] [Google Scholar]
- 8.Hein GJ, Baker C, Hsieh J, et al. GLP-1 and GLP-2 as yin and yang of intestinal lipoprotein production: evidence for predominance of GLP-2-stimulated postprandial lipemia in normal and insulin-resistant states. Diabetes. 2012;62:373–381. doi: 10.2337/db12-0202. [DOI] [PMC free article] [PubMed] [Google Scholar]
- 9.Jeppesen PB, Pertkiewicz M, Messing B, et al. Teduglutide reduces need for parenteral support among patients with short bowel syndrome with intestinal failure. Gastroenterology. 2012;143:1473–1481. e3. doi: 10.1053/j.gastro.2012.09.007. [DOI] [PubMed] [Google Scholar]
- 10.Jeppesen PB, Lund P, Gottschalck IB, et al. Short bowel patients treated for two years with glucagon-like peptide 2: effects on intestinal morphology and absorption, renal function, bone and body composition, and muscle function. Gastroenterol Res Pract. 2009;2009:616054. doi: 10.1155/2009/616054. [DOI] [PMC free article] [PubMed] [Google Scholar]
- 11.Jeppesen PB. Pharmacologic options for intestinal rehabilitation in patients with short bowel syndrome. JPEN J Parenter Enteral Nutr. 2014;38(Suppl):45S–52S. doi: 10.1177/0148607114526241. [DOI] [PubMed] [Google Scholar]
- 12.Meier JJ, Nauck MA, Pott A, et al. Glucagon-like peptide 2 stimulates glucagon secretion, enhances lipid absorption, and inhibits gastric acid secretion in humans. Gastroenterology. 2006;130:44–54. doi: 10.1053/j.gastro.2005.10.004. [DOI] [PubMed] [Google Scholar]
- 13.Xiao C, Bandsma RH, Dash S, et al. Exenatide, a glucagon-like peptide-1 receptor agonist, acutely inhibits intestinal lipoprotein production in healthy humans. Arterioscler Thromb Vasc Biol. 2012;32:1513–1519. doi: 10.1161/ATVBAHA.112.246207. [DOI] [PubMed] [Google Scholar]
- 14.Lemieux S, Fontani R, Uffelman KD, et al. Apolipoprotein B-48 and retinyl palmitate are not equivalent markers of postprandial intestinal lipoproteins. J Lipid Res. 1998;39:1964–1971. [PubMed] [Google Scholar]
- 15.Xiao C, Dash S, Morgantini C, et al. New and emerging regulators of intestinal lipoprotein secretion. Atherosclerosis. 2014;233:608–615. doi: 10.1016/j.atherosclerosis.2013.12.047. [DOI] [PubMed] [Google Scholar]
- 16.Morel E, Demignot S, Chateau D, et al. Lipid-dependent bidirectional traffic of apolipoprotein B in polarized enterocytes. Mol Biol Cell. 2004;15:132–141. doi: 10.1091/mbc.E03-04-0215. [DOI] [PMC free article] [PubMed] [Google Scholar]
- 17.Guan X, Stoll B, Lu X, et al. GLP-2-mediated up-regulation of intestinal blood flow and glucose uptake is nitric oxide-dependent in TPN-fed piglets 1. Gastroenterology. 2003;125:136–147. doi: 10.1016/s0016-5085(03)00667-x. [DOI] [PubMed] [Google Scholar]
- 18.Bremholm L, Hornum M, Andersen UB, et al. The effect of glucagon-like peptide-2 on mesenteric blood flow and cardiac parameters in end-jejunostomy short bowel patients. Regul Pept. 2011;168:32–38. doi: 10.1016/j.regpep.2011.03.003. [DOI] [PubMed] [Google Scholar]
- 19.Tso P, Balint JA. Formation and transport of chylomicrons by enterocytes to the lymphatics. Am J Physiol. 1986;250:G715–G726. doi: 10.1152/ajpgi.1986.250.6.G715. [DOI] [PubMed] [Google Scholar]
- 20.Pavlic M, Xiao C, Szeto L, et al. Insulin acutely inhibits intestinal lipoprotein secretion in humans in part by suppressing plasma free fatty acids. Diabetes. 2010;59:580–587. doi: 10.2337/db09-1297. [DOI] [PMC free article] [PubMed] [Google Scholar]
- 21.Duez H, Lamarche B, Valero R, et al. Both intestinal and hepatic lipoprotein production are stimulated by an acute elevation of plasma free fatty acids in humans. Circulation. 2008;117:2369–2376. doi: 10.1161/CIRCULATIONAHA.107.739888. [DOI] [PMC free article] [PubMed] [Google Scholar]
- 22.Xiao C, Pavlic M, Szeto L, et al. Effects of acute hyper-glucagonemia on hepatic and intestinal lipoprotein production and clearance in healthy humans. Diabetes. 2011;60:383–390. doi: 10.2337/db10-0763. [DOI] [PMC free article] [PubMed] [Google Scholar]
- 23.Hsieh J, Longuet C, Baker CL, et al. The glucagon-like peptide 1 receptor is essential for postprandial lipoprotein synthesis and secretion in hamsters and mice. Diabetologia. 2010;53:552–561. doi: 10.1007/s00125-009-1611-5. [DOI] [PubMed] [Google Scholar]
- 24.Xiao C, Dash S, Morgantini C, et al. Sitagliptin, a dipeptidyl peptidase-4 inhibitor, acutely inhibits intestinal lipoprotein particle secretion in healthy humans. Diabetes. 2014;63:2394–2401. doi: 10.2337/db13-1654. [DOI] [PMC free article] [PubMed] [Google Scholar]
- 25.Hartmann B, Harr MB, Jeppesen PB, et al. In vivo and in vitro degradation of glucagon-like peptide-2 in humans. J Clin Endocrinol Metab. 2000;85:2884–2888. doi: 10.1210/jcem.85.8.6717. [DOI] [PubMed] [Google Scholar]
- 26.Hartmann B, Thulesen J, Hare KJ, et al. Immunoneutralization of endogenous glucagon-like peptide-2 reduces adaptive intestinal growth in diabetic rats. Regul Pept. 2002;105:173–179. doi: 10.1016/s0167-0115(02)00013-7. [DOI] [PubMed] [Google Scholar]
- 27.Shin ED, Estall JL, Izzo A, et al. Mucosal adaptation to enteral nutrients is dependent on the physiologic actions of glucagon-like peptide-2 in mice. Gastroenterology. 2005;128:1340–1353. doi: 10.1053/j.gastro.2005.02.033. [DOI] [PubMed] [Google Scholar]
- 28.Bahrami J, Yusta B, Drucker DJ. ErbB activity links the glucagon-like peptide-2 receptor to refeeding-induced adaptation in the murine small bowel. Gastroenterology. 2010;138:2447–2456. doi: 10.1053/j.gastro.2010.03.006. [DOI] [PubMed] [Google Scholar]
- 29.Lee SJ, Lee J, Li KK, et al. Disruption of the murine Glp2r impairs Paneth cell function and increases susceptibility to small bowel enteritis. Endocrinology. 2012;153:1141–1151. doi: 10.1210/en.2011-1954. [DOI] [PMC free article] [PubMed] [Google Scholar]
- 30.Crosby J, Peloso GM, Auer PL, et al. Loss-of-function mutations in APOC3, triglycerides, and coronary disease. N Engl J Med. 2014;371:22–31. doi: 10.1056/NEJMoa1307095. [DOI] [PMC free article] [PubMed] [Google Scholar]
- 31.Jorgensen AB, Frikke-Schmidt R, Nordestgaard BG, et al. Loss-of-function mutations in APOC3 and risk of ischemic vascular disease. N Engl J Med. 2014;371:32–41. doi: 10.1056/NEJMoa1308027. [DOI] [PubMed] [Google Scholar]
- 32.Henriksen DB, Alexandersen P, Hartmann B, et al. Four-month treatment with GLP-2 significantly increases hip BMD: a randomized, placebo-controlled, dose-ranging study in postmenopausal women with low BMD. Bone. 2009;45:833–842. doi: 10.1016/j.bone.2009.07.008. [DOI] [PubMed] [Google Scholar]
- 33.Buchman AL, Katz S, Fang JC, et al. Teduglutide, a novel mucosally active analog of glucagon-like peptide-2 (GLP-2) for the treatment of moderate to severe Crohn’s disease. Inflamm Bowel Dis. 2010;16:962–973. doi: 10.1002/ibd.21117. [DOI] [PubMed] [Google Scholar]
Associated Data
This section collects any data citations, data availability statements, or supplementary materials included in this article.
Supplementary Materials
Supplementary Figure 1. Mean plasma total GLP-2 concentration (A) after administration of GLP-2 and placebo (placebo, black diamond and dotted line; GLP-2, black square and solid line). Total GLP-2 concentration was significantly higher 2 and 4 hours after GLP-2 administration compared with placebo. §P < .005, §§P < .05. Plasma insulin (B), FFAs (C), and glucagon (D) (placebo, black diamond and dotted line; GLP-2, black square and solid line) were assessed during the course of the kinetic study (study A). There was no significant difference in concentration of insulin or FFA between treatments whereas glucagon was significantly higher with GLP-2 treatment vs placebo (mean concentration: placebo, 85.3 ± 15.9 vs GLP-2, 143.3 ± 14.2 pg/mL; P = .01).
Supplementary Figure 2. Plasma glucose concentrations (placebo, black diamond and dotted line; GLP-2, black square and solid line) were assessed during the course of study A (A) and study B (B). Glucose concentration was modestly higher with GLP-2 treatment (mean concentration: placebo, 8.0 ± 0.3 vs GLP-2, 8.7 ± 0.3 mmol/L; P = .049) in study A (A). There was no significant difference in glucose concentration between treatments in study B (B).