

Abstract
Nuclear genome sequencing from extremophilic eukaryotes has revealed clues about the mechanisms of adaptation to extreme environments, but the functional consequences of extremophily on organellar genomes are unknown. To address this issue, we assembled the mitochondrial and plastid genomes from a polyextremophilic red alga, Galdieria sulphuraria strain 074 W, and performed a comparative genomic analysis with other red algae and more broadly across eukaryotes. The mitogenome is highly reduced in size and genetic content and exhibits the highest guanine–cytosine skew of any known genome and the fastest substitution rate among all red algae. The plastid genome contains a large number of intergenic stem-loop structures but is otherwise rather typical in size, structure, and content in comparison with other red algae. We suggest that these unique genomic modifications result not only from the harsh conditions in which Galdieria lives but also from its unusual capability to grow heterotrophically, endolithically, and in the dark. These conditions place additional mutational pressures on the mitogenome due to the increased reliance on the mitochondrion for energy production, whereas the decreased reliance on photosynthesis and the presence of numerous stem-loop structures may shield the plastome from similar genomic stress.
Keywords: Galdieria sulphuraria, red algae, facultative heterotrophy, polyextremophily, GC skew, substitution rate
Introduction
Red algae (Rhodophyta) are one of the three ancient lineages of photosynthetic eukaryotes (along with green plants and glaucophytes) derived from the primary endosymbiosis event that established the plastid (Reyes-Prieto et al. 2007). Taxonomic relationships within red algae have undergone extensive reorganization in recent years, culminating in the formation of seven organismal classes comprising about 6,000 species (reviewed in Yoon et al. 2010). Cyanidiophyceae, which was estimated to have split from the rest of the red algal lineage over one billion years ago (Yoon et al. 2002, 2004), includes mostly thermophilic and acidophilic species from three currently recognized genera (Cyanidioschyzon, Cyanidium and Galdieria), although sequencing surveys suggest that additional biodiversity is present within this group (Ciniglia et al. 2004; Yoon et al. 2006). Galdieria sulphuraria, like other members of Cyanidiophyceae, thrives at high temperatures (50–55 °C) and low pH (0.5–1.5) and tolerates high concentrations of salt and toxic metals, but it stands out by its ability to grow endolithically and to survive heterotrophically for long periods of time in the dark, where it can grow on more than 50 carbon sources (Barbier et al. 2005; Reeb and Bhattacharya 2010).
Although there are many genomes sequenced from bacterial and archaeal extremophiles (Bult et al. 1996; Deckert et al. 1998; Nelson et al. 1999; Saunders et al. 2003), relatively few genomes are available from extremophilic eukaryotes, such as halotolerant or thermophilic fungi (Dujon et al. 2004; Amlacher et al. 2011), a halophilic plant (Dassanayake et al. 2011), and the thermoacidophilic red algae Cyanidioschyzon merolae and G. sulphuraria (Matsuzaki et al. 2004; Schonknecht et al. 2013). Many of these studies focused on the adaptive genomic changes which may have enabled the survival of the species in extreme conditions. For instance, G. sulphuraria’s metabolic flexibility and tolerance of extreme environments were facilitated by the horizontal acquisition of numerous critical genes from extremophilic bacteria (Schonknecht et al. 2013). However, none of the eukaryotic studies have examined the potentially adaptive or consequential changes in their mitochondrial or chloroplast genomes.
To date, complete sequences have been published for more than a dozen mitochondrial and plastid genomes from various red algae in Florideophyceae, Bangiophyceae, and Cyanidiophyceae (Campbell et al. 2014; Kim et al. 2014). Sequenced red algal mitochondrial genomes, ranging in size from 25 to 42 kb, are generally smaller than genomes from green algae and glaucophytes, although gene content is roughly comparable. In contrast, the 150–218 kb plastid genomes among red algae are typically larger and more gene rich than those in green algae and glaucophytes. In this study, we present the mitochondrial and plastid genomes of the polyextremophile G. sulphuraria. We performed a comparative analysis of red algal mitochondrial and plastid genomes to understand organellar genomic diversity in this group and to assess the effects of an extremophilic lifestyle on organellar genomic size, structure, organization, and content.
Materials and Methods
Genome Assembly
The mitochondrial genome sequence was assembled from five sets of whole genome 454 pyrosequencing reads, which were generated from G. sulphuraria strain 074 W by a previous study (Schonknecht et al. 2013). The five data sets were downloaded from the National Center for Biotechnology Information (NCBI) Sequence Read Archive (SRA accession numbers SRR039878–SRR039882). Each read data set was independently assembled with MIRA version 3.0.3 (http://mira-assembler.sourceforge.net/, last accessed January 24, 2015) by using the accurate, de novo, and no trace info assembly options. Mitochondrial contigs were identified by comparing known proteins from the C. merolae and Reclinomonas americana mitochondrial genomes (GenBank accession numbers D89861 and AF007261) with the assembled contigs using TBLASTN from BLAST+ version 2.2.27 (Camacho et al. 2009) with relaxed nondefault parameters (word size = 2, matrix = BLOSUM45, e-value = 100). Each assembly generated a single mitochondrial contig, all of which were virtually identical in sequence except for several small indels in repetitive regions. To resolve the discrepancies, all 454 reads were mapped back onto the genome using BLASTN with nondefault parameters (e-value = 1 × 10⁻²⁰, dust = no), and the final genomic sequence was corrected based on the sequence present in the majority of reads. The mitochondrial genome was circularized based on overlapping sequences at the beginning and end of the single mitochondrial contig assembled from the SRR039878 read set.
The plastid genome sequence was assembled as part of the G. sulphuraria nuclear genome sequencing project from Sanger-sequenced shotgun reads that were supplemented with 454 data, as described previously (Schonknecht et al. 2013). The obtained consensus sequence covered nearly the entire genome. Gaps were closed either by direct sequence analysis of polymerase chain reaction products or by preparing sequencing templates using the illustra TempliPhi Amplification Kit (GE Healthcare Life Sciences). Total DNA for this analysis was isolated as described (Schonknecht et al. 2013). An independent plastid assembly was generated using 454 data and MIRA as described for the mitochondrial genome assembly. Discrepancies between the two plastid assemblies were corrected by mapping the Sanger and 454 reads against the two sequences using BLASTN (e-value = 1 × 10⁻²⁰, dust = no) and taking the sequence present in the majority of mapped reads.
To confirm that all segments of the mitochondrial and plastid genomes were identified and included in the finished genome sequences, we used depth of coverage and guanine–cytosine frequency (GC%) as reported by the MIRA assembler to evaluate contigs from the SRR039878 read set assembly (supplementary table S1, Supplementary Material online). The mitochondrial contig representing the full genome had 85 × coverage and 44% GC. Two additional contigs matched the small repeats in the mitochondrial genome, but their lower coverage depth suggests that they represent minor repeat variants among individuals. The plastid genome was represented by 24 contigs with about 30 × coverage and 28% GC. These contigs totaled 163 kb in length, which, after accounting for the 5-kb inverted repeat, is equal to the 168-kb length of the finished genome sequence. We used BLASTN to evaluate all remaining contigs that were >200 bp and supported by 15 × depth of read coverage. The remaining contigs either matched Galdieria nuclear sequences or had no match in the GenBank nonredundant database, likely representing contaminant sequences. Importantly, no additional mitochondrial or plastid contigs were identified.
Genome Annotation
Initial annotation of protein-coding, transfer RNA (tRNA), and ribosomal RNA (rRNA) genes in the mitochondrial and plastid genomes was done using DOGMA (Wyman et al. 2004). Protein-coding genes were independently evaluated by searching all open reading frames (ORFs) >80 AA against the nonredundant protein sequence database using BLASTP with relaxed parameters (word size = 2, matrix = BLOSUM45, e-value = 100). Detection of rRNAs and tRNAs was also performed using the RNA prediction tools RNAweasel (http://megasun.bch.umontreal.ca/RNAweasel/, last accessed January 24, 2015), tRNAscan-SE version 1.21 (Lowe and Eddy 1997), and BLASTN with relaxed parameters (word size = 7, penalty = −1, reward = 1, e-value = 100). We were unable to determine the precise end points of the mitochondrial small subunit and large subunit rRNAs, so they were annotated approximately based on their length and position in C. merolae mitochondrial DNA. Repeats were identified by comparing the genome sequence against itself using BLASTN with modified parameters (minimum identity = 90%, e-value = 0.001, dust = no). Stem-loop structures were predicted with the EMBOSS program einverted (http://emboss.bioinformatics.nl/cgi-bin/emboss/einverted, last accessed January 24, 2015), requiring a ≥20-bp stem with ≥80% sequence identity and a ≤20-bp loop. Linear and circular genomic maps were drawn using OgDraw version 1.2 (Lohse et al. 2013). Genomic dot plots were generated using the mummer script with modified parameters (-b -c –maxmatch) and the mummerplot script with default parameters in MUMmer version 3.23 (Kurtz et al. 2004).
Reannotation of Previously Sequenced Red Algal Mitochondrial Genomes
To ensure consistent genomic annotations between G. sulphuraria and other red algae, we re-examined the previously released red algal mitochondrial genomes, which uncovered numerous unreported genes, identified several unknown ORFs, and corrected some misannotations (supplementary fig. S1, Supplementary Material online). The Gracilariopsis andersonii atp4 gene and Gracilariophila oryzoides atp8 and sdhC genes, which were previously scored as absent or pseudogenes (Hancock et al. 2010), are present and intact except for a single-nucleotide frameshift in a long (7–9 bp) mononucleotide repeat. Because such repeats can cause errors during sequencing, we resequenced all three genes and obtained intact gene sequences without any frameshifting mutations, indicating that these three genes are almost certainly functional (supplementary fig. S1A–C, Supplementary Material online). In Plocamiocolax pulvinata, orf135 is probably an atp8 homolog because it is highly similar to atp8 genes in other Florideophyceae species (supplementary fig. S1B, Supplementary Material online). All Bangiophyceae mitogenomes contain presumably functional rpl20 genes, although the gene was not annotated in three species, most likely due to the small size of this gene (supplementary fig. S1D, Supplementary Material online). All five sequenced Florideophyceae mitogenomes contain a homologous ORF located between trnA-ugc and trnW-uca. This ORF in Chondrus crispus (orf172) exhibits weak similarity to rpl5 from R. americana, suggesting that all five ORFs are divergent rpl5 homologs, including the frameshifted homolog in Gra. oryzoides that we corrected after resequencing (supplementary fig. S1E, Supplementary Material online). We identified a putative rrn5 gene in P. pulvinata, Cyanidium caldarium, and the three species in Gracilariales (supplementary fig. S1F, Supplementary Material online). In all species, the position of this previously unannotated rrn5 gene is syntenic with its closest relatives. Our comparative analysis indicated that the unique P. pulvinata trnA-ggc gene is highly similar to trnG-gcc genes in other red algae (supplementary fig. S1G, Supplementary Material online), suggesting either a recent anticodon shift or a potential sequencing error in P. pulvinata. We also identified a putative intron-containing trnI-gua gene in P. pulvinata and Gracilariales (supplementary fig. S1H, Supplementary Material online) and several unannotated tRNAs that were predicted by tRNAscan-SE or RNAWeasel (table 1). Finally, our intron distribution (table 1) accounts for the newly reported trnI-gua intron in P. pulvinata and Gracilariales (supplementary fig. S1G, Supplementary Material online) as well as the reannotation of intron cox1-i4 that is clearly shared among P. pulvinata, Pyropia haitanensis, and Pyropia yezoensis (supplementary fig. S1I, Supplementary Material online).
Table 1.
General Characteristics of Red Algal Mitogenomes
| Cyanidiophyceae |
Bangiophyceae |
Florideophyceae |
|||||||||
|---|---|---|---|---|---|---|---|---|---|---|---|
| Cmer | Gsul | Phai | Ppur | Pumb | Pyez | Ccri | Gand | Glem | Gory | Ppul | |
| Genome size (bp) | 32,211 | 21,428 | 37,023 | 36,753 | 29,123 | 41,688 | 25,836 | 27,036 | 25,883 | 25,161 | 25,894 |
| GC content (%) | 27.1 | 43.9 | 30.7 | 33.5 | 31.9 | 32.7 | 27.9 | 28.0 | 27.5 | 28.1 | 23.9 |
| Repeat content (%) | 0.04 | 2.85 | 0.32 | 1.24 | 0.37 | 1.97 | 0.50 | 0.33 | 0.33 | 0.00 | 0.53 |
| Gene-strand skew | 0.06 | 0.88 | 0.15 | 0.17 | 0.16 | 0.14 | 0.06 | 0.07 | 0.07 | 0.08 | 0.07 |
| Unique genes | 62 | 27 | 50 | 50 | 50 | 50 | 50 | 47 | 48 | 46 | 51 |
| rRNA | 3 | 2 | 2 | 2 | 2 | 2 | 3 | 3 | 3 | 3 | 3 |
| tRNA | 25 | 7 | 24 | 24 | 24 | 24 | 23 | 21 | 21 | 21 | 24 |
| Protein | 34 | 18 | 24 | 24 | 24 | 24 | 24 | 23 | 24 | 22 | 24 |
| Introns | 0 | 0 | 5 | 2 | 1 | 5 | 1 | 1 | 1 | 1 | 2 |
| With IEPs | 0 | 0 | 5 | 2 | 1 | 5 | 0 | 0 | 0 | 0 | 0 |
Note.—Cmer = Cyanidioschyzon merolae; Gsul = Galdieria sulphuraria; Phai = Pyropia haitanensis; Ppur = Porphyra purpurea; Pumb = Porphyra umbilicalis; Pyez = Pyropia yezoensis; Ccri = Chondrus crispus; Gand = Gracilariopsis andersonii; Glem = Gracilariopsis lemaneiformis; Gory = Gracilariophila oryzoides; Ppul = Plocamiocolax pulvinata.
Sequence Composition Analyses
Protein domains were identified by searching the Pfam database (http://pfam.xfam.org/, last accessed January 24, 2015) and the Conserved Domain Database (http://www.ncbi.nlm.nih.gov/cdd/, last accessed January 24, 2015) using default parameters. Transmembrane domains were searched using the TMHMM version 2 server (http://www.cbs.dtu.dk/services/TMHMM/, last accessed January 24, 2015).
Nucleotide frequencies were calculated using BioEdit version 7.1.3 (Hall 1999) and custom Perl scripts. GC skew, AT skew, and coding skew were calculated with the following general formula:
Genomic GC skew was calculated using A = G% and B = C%, where the nucleotide frequencies were taken from one strand of the entire genome. For genomic AT skew, A = A% and B = T%, again based on genomic nucleotide frequencies. Exonic GC skew and exonic AT skew were calculated from a concatenated set of all protein-coding, rRNA, and tRNA exons in forward strand orientation. Gene-strand skew is a parameter introduced to quantify the amount of strand bias in the distribution of genes. For gene-strand skew, A = number of exonic nucleotides in plus strand orientation and B = number of exonic nucleotides in minus strand orientation. Both values include protein-coding, tRNA, and rRNA exons but exclude introns and unidentified ORFs.
Search for Mitochondrion-to-Nucleus Gene Transfers
For all genes present in the C. merolae mitogenome but absent from the G. sulphuraria mitogenome, we searched for homologs in the nuclear genome of G. sulphuraria. Each C. merolae protein sequence was used as a query in a TBLASTN search with relaxed parameters (word size = 2, matrix = BLOSUM45, e-value = 0.001) against contigs from the nuclear genome sequence project and from the red algal SRR039878 genome assembly described above. Hits to plastid contigs were ignored. All remaining matches with an e-value <10−3 were scored as potential transfer events.
Phylogenetic Analyses
The mitochondrial data set was generated from 12 red algal genomes: C. merolae (D89861), Cy. caldarium (Z48930), Ch. crispus (Z47547), G. sulphuraria (KJ700460), Gra. oryzoides (HQ586059), Gr. andersonii (HQ586060), Gracilariopsis lemaneiformis (JQ071938), P. pulvinata (HQ586061), Porphyra purpurea (AF114794), Porphyra umbilicalis (JQ388471), Py. haitanensis (JQ736808), and Py. yezoensis (JQ736809). For outgroups, we used the glaucophyte Cyanophora paradoxa (HQ849544) and two slowly evolving and gene-rich representatives from green algae, Chara vulagris (AY267353) and Nephroselmis olivacea (AF110138). Codon-based nucleotide alignments were generated using the “MUSCLE(codons)” command in MEGA version 5.1 (Edgar 2004; Tamura et al. 2011) for all 24 protein-coding genes (atp4, atp6, atp8, atp9, cob, cox1, cox2, cox3, mttB, nad1, nad2, nad3, nad4, nad4L, nad5, nad6, rpl16, rpl20, rps3, rps11, rps12, sdhB, sdhC, sdhD) that were present in the mitochondrial genomes of at least 8 taxa. Some alignments were corrected manually using BioEdit version 7.1.3. Gblocks version 0.91 b (Castresana 2000) was used to remove poorly aligned regions from each alignment, and the reduced alignments were concatenated using Gblocks with options “-t = c -a = y -c = y -w = y.” The final codon data set was 17,265 bp in length. A protein data set was also generated by translation of the final codon data set.
The plastid data set was generated from 9 red algal genomes: Calliarthron tuberculosum (KC153978), Ch. crispus (HF562234), C. merolae (AB002583), Cy. caldarium (AF022186), G. sulphuraria (KJ700459), Gracilaria tenuistipitata (AY673996), Po. purpurea (U38804), Py. haitanensis (KC464603), and Py. yezoensis (AP006715). The same three outgroup species were chosen: Cya. paradoxa (U30821), Cha. vulagris (DQ229107), and N. olivacea (AF137379). The final 39,324-bp data set was produced from 53 protein-coding genes (atpA, atpB, atpE, atpF, atpH, ccsA, chlI, petA, petB, petD, petG, psaA, psaB, psaC, psaI, psaJ, psbA, psbB, psbC, psbD, psbE, psbF, psbH, psbI, psbJ, psbK, psbL, psbN, psbT, rbcL, rpl2, rpl5, rpl12, rpl14, rpl16, rpl19, rpl20, rpl36, rpoA, rpoB, rpoC1, rpoC2, rps2, rps3, rps4, rps7, rps8, rps11, rps12, rps14, rps18, rps19, tufA) that were aligned, trimmed, and concatenated as described above. A protein data set was also generated by translation of the final codon data set.
Phylogenetic analyses were performed using maximum likelihood (ML) and Bayesian inference (BI) approaches on the nucleotide and protein data sets. The general time-reversible model with a gamma correction for rate variation and a proportion of invariable sites (the GTR + G + I model) was used for all nucleotide analyses based on model-testing results from jModeltest version 2.1.3 (Darriba et al. 2012), while the MtRev and CpRev protein models were used for the mitochondrial and plastid protein data sets, respectively. The ML trees were constructing with RAxML version 7.2.8-alpha (Stamatakis 2006), and branch support was evaluated using the rapid bootstrap option with 1,000 replicates (Stamatakis et al. 2008). BI was performed with MrBayes version 3.1.2 (Ronquist and Huelsenbeck 2003) using two individual runs with four chains for each data set. Trees were sampled every 100 generations and the first 25% of the sampled trees were discarded as burn-in. The analysis was run for at least 200,000 generations until the standard deviation of split frequencies was less than 0.01. The resulting ML and BI trees were rooted on green algae and glaucophytes. The data sets and trees were deposited in TreeBase under accession number S16775.
Results
Reduced Size and Content, Biased Organization, and Simplified Structure of the Mitogenome
The mitochondrial genome of G. sulphuraria was assembled into a 21,428-bp circular molecule (fig. 1) with a GC content of 43.9% and 2 sets of tandem repeats (2.6 copies of a 270-bp repeat and 2 copies of a 158-bp repeat) within its 1.5-kb nongenic portion, equating to a 2.8% repeat content. The genome contains 28 intronless genes encoding 2 rRNAs, 7 tRNAs, 18 proteins with known function, and 1 hypothetical protein. Gene distribution is highly biased, in which all but two genes (cob, orf181) are encoded on the same DNA strand (fig. 2). Using a novel metric called gene-strand skew, where a value of 1 indicates all exons are coded on one DNA strand while a value of 0 indicates exons are equally distributed on both strands, we show that G. sulphuraria has a mitochondrial gene-strand skew of 0.88. Compared with all other red algal mitogenomes sequenced to date, the G. sulphuraria mitogenome has the smallest size, the fewest genes and introns, the highest gene-strand skew, the highest GC content, and the greatest proportion of repeats (table 1).
Fig. 1.—
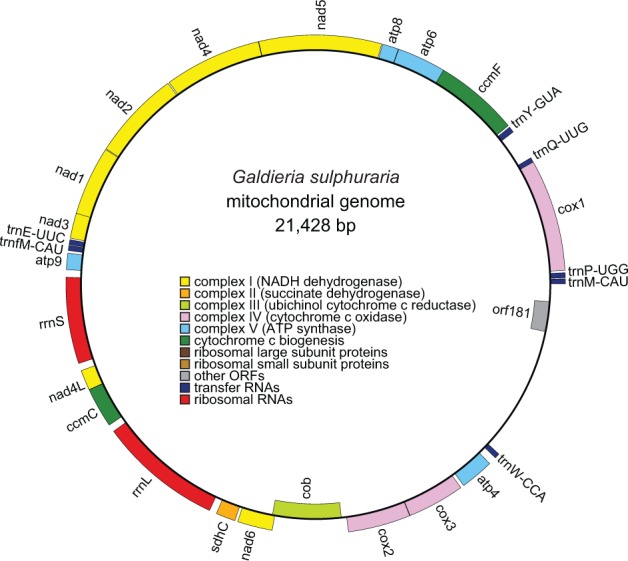
Galdieria sulphuraria mitochondrial genome map. Outer genes are transcribed counter clockwise; inner genes are transcribed clockwise. Gene colors correspond to the functional categories listed in the key. NADH = nicotinamide adenine dinucleotide; ATP = adenosine triphosphate.
Fig. 2.—

Comparison of mitochondrial gene order and content in Cyanidiophyceae. Maps were drawn to the scale shown at bottom right. Gene colors correspond to functional categories as shown in the key. Gray shading between genomes indicates syntenic gene blocks. Twisted shading indicates inversion events. Dashed lines between genomes indicate nonsyntenic tRNA genes.
Broader comparative analysis among sequenced red algae reveals numerous gene losses from the G. sulphuraria mitogenome (fig. 3). Conspicuously absent are all ribosomal protein genes, several respiratory genes, and the protein translocase gene (variably called tatC, mttB, orfX, or ymf16). Similar to many green plants (Adams and Palmer 2003), these missing mitochondrial genes were likely transferred to the nuclear genome after G. sulphuraria diverged from other Cyanidiophyceae species. Indeed, TBLASTN searches provide strong evidence (e-value = 1 × 10−96) for the presence of sdhB in the G. sulphuraria nuclear genome, and weaker evidence (e-values 10−3 to 10−10) for several other mitochondrion-to-nucleus gene transfer events. However, more conclusive evidence for such transfer events is limited by the accelerated evolution of G. sulphuraria mitochondrial genes (see below) and by the lack of any closely related gene homologs for similarity searching, as G. sulphuraria diverged from other Cyanidiophyceae species hundreds of millions of years ago. No mitochondrial rrn5 was detected, but we cannot rule out the existence of a divergent functional copy considering our difficulties in detecting rrnL and rrnS in this species and the previously reported difficulties in detecting rrn5 in many red algae and other eukaryotes (Valach et al. 2014). The mitogenome has a highly reduced set of seven tRNAs recognizing codons for only six amino acids (Gln, Glu, Met, Pro, Trp, Tyr), suggesting that the missing tRNAs are imported from the cytosol. No mitochondrial introns were found in G. sulphuraria (or in C. merolae), whereas all sequenced species in Bangiophyceae and Florideophyceae have between 1 and 5 group II introns variably present in the cox1, rrnL, and/or trnI-gua genes. All of the Bangiophyceae introns contain intron-encoded proteins (IEPs).
Fig. 3.—
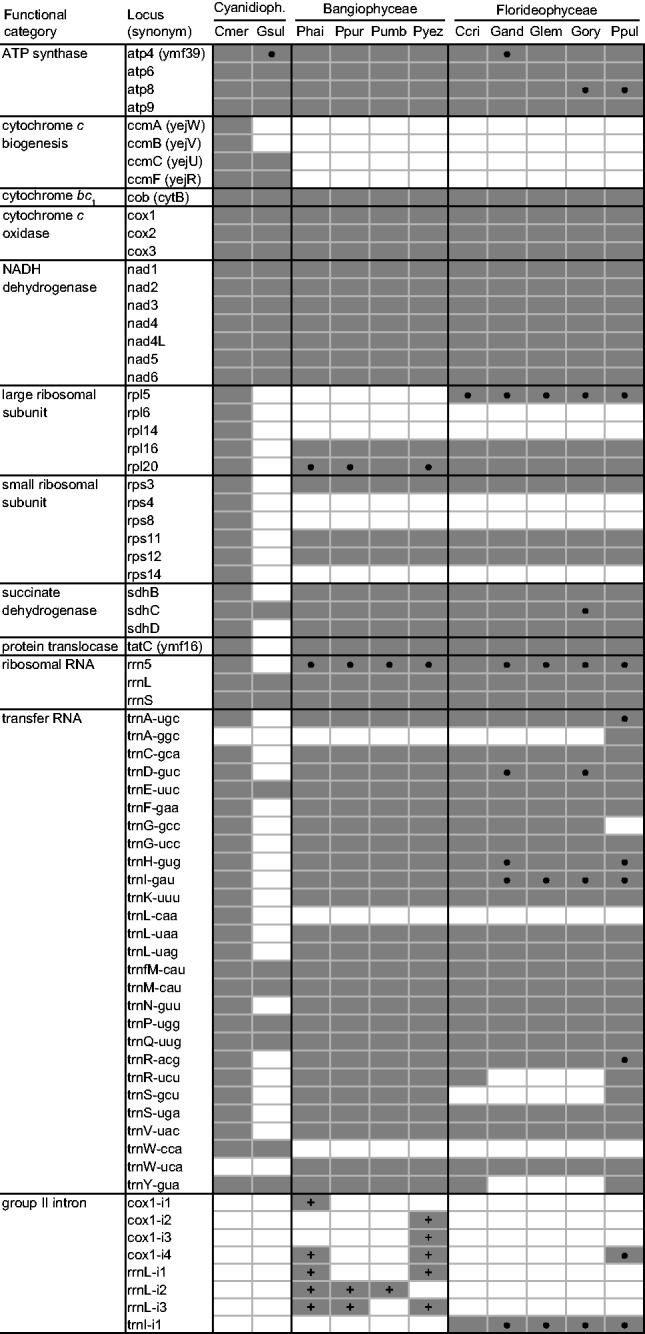
Comparison of red algal mitochondrial gene and intron content. Dark gray boxes indicate presence, white boxes indicate absencel. Black circles indicate that further information to support the identifications is provided in supplementary figure S1, Supplementary Material online. Plus symbols indicate that an IEP is present.
Despite the extensive gene loss, a comparison of mitochondrial gene order between G. sulphuraria and its closest completely sequenced relative, C. merolae, reveals a high level of colinearity (fig. 2). Both genomes share several syntenic gene blocks in the same genomic order, although two gene blocks are in inverted orientation and three tRNA genes are translocated. The G. sulphuraria rrnL and rrnS genes, which were difficult to identify due to their divergence (only a few short fragments match homologs in other red algae), nevertheless have a syntenic gene order of rrnS-nad4L-ccmC-rrnL-sdhC, confirming their genomic position. In addition, the size and genomic position of a 468-bp ORF suggests that it probably encodes a divergent ATP4 protein, which is further supported by results from a Pfam domain search (e-value = 0.057) and by the presence of a predicted transmembrane domain at position 21–43 in the protein, similar to other mitochondrion-encoded ATP4 proteins (Burger et al. 2003).
Extreme GC Skew and Moderate AT Skew in the Mitogenome
Chargaff’s second parity rule states that complementary nucleotides are at approximately equal frequencies within a single strand of DNA, such that A% ≈ T% and G% ≈ C% (Rudner et al. 1968). Surprisingly, we found that the G. sulphuraria mitogenome deviates significantly from this rule, with 38.3% G compared with only 5.7% C and 35.1% A but only 20.9% T on the gene-dominant strand, which makes this strand unusually G rich and pyrimidine poor compared with other red algae (fig. 4A). GC skew and AT skew are metrics used to measure the amount of deviation from Chargaff’s second parity rule. Plotting these metrics showed that G. sulphuraria’s genome-wide GC skew of 0.74 is highest among all eukaryotic mitogenomes sequenced to date, while the AT skew of 0.26 is highest among all non-Metazoans (fig. 4B). The two values are positively correlated for G. sulphuraria (and most red algae in general), indicating an excess of purines on the forward (predominantly sense) strand and an excess of pyrimidines on the reverse (predominantly template) strand. In contrast, GC and AT skew tends to be inversely correlated in other eukaryotes with the most skewed genomes, especially Metazoans.
Fig. 4.—

Nucleotide compositional analysis of mitochondrial genomes. (A) Genome-wide frequencies of guanine (black), cytosine (blue), adenine (red), and thymine (green) in sequenced red algal mitogenomes. (B) Scatter plot of genome-wide values for GC skew and AT skew from >3,600 eukaryote mitogenomes available at NCBI GenBank. (C) Sliding window analysis of GC skew (purple) and AT skew (blues) in Galdieria sulphuraria (top) and Cyanidioschyzon merolae (bottom). (D) Nucleotide frequencies for G. sulphuraria (top) and C. merolae (bottom) in the whole genome (genome), in intergenic regions (intergenic), in RNA genes (RNA), in plus strand genes at 0-fold degenerate (Prot+ 0D) or 4-fold degenerate sites (Prot+ 4D), or minus strand genes at 0-fold degenerate (Prot− 0D) or 4-fold degenerate sites (Prot− 4D). (E) Scatter plot of GC skew and AT skew for G. sulphuraria (purple) and C. merolae (blue) in the different genomic regions described in 4D.
To evaluate the selective versus mutational forces driving the skewed nucleotide composition in the G. sulphuraria mitogenome, we examined the variation in compositional skew within particular genomic regions. Sliding window analysis shows that GC skew and AT skew are pervasive throughout the genome, but there is some gene-to-gene variation (fig. 4C). For example, the nad and ccm genes tend to be highly GC skewed but only moderately AT skewed, whereas rRNA genes are highly AT skewed but only moderately GC skewed. Notably, the two genes located in an antisense orientation (cob and orf181) do not exhibit an inverted GC or AT skew pattern, arguing against transcriptional direction as a major force driving nucleotide compositional skew. The C. merolae mitogenome also exhibits some localized and gene-specific variation in GC skew and AT skew, although the magnitude of these deviations is generally much smaller than in G. sulphuraria.
We also examined nucleotide compositional biases in intergenic regions, in RNA genes, and in protein-coding genes at nonsynonymous sites and at 4-fold degenerate synonymous sites (fig. 4D and E). Overall, genomic regions in C. merolae are much less skewed than in G. sulphuraria. As already noted, G. sulphuraria’s RNA genes tend to be less GC skewed but more AT skewed, while the two protein-coding genes on the opposite DNA strand, now examined in their sense orientation, have strongly inverted GC and AT skews. In general, 4-fold degenerate synonymous sites, which are typically under little to no selective constraint, are more skewed than the genome average, suggesting that mutational biases are driving AT and GC skew. Nonsynonymous sites and RNA genes also exhibit large deviations from the genome average, suggesting that selective effects (both adaptive and constraining) are also acting to exacerbate or mitigate these mutational biases. These selective effects have resulted in unusual amino acid (AA) compositional biases compared with other red algae (supplementary table S2, Supplementary Material online), although there is no clear trend that emerges based on polarity, charge, or size of overrepresented and underrepresented AAs (i.e., we see both gains and losses of polar and nonpolar AAs, charged and uncharged AAs, and small and large AAs).
Reduced Protein Gene Content, an Abundance of Stem-Loop Structures, and an Inverted Repeat in the Plastid Genome
The G. sulphuraria plastid genome maps as a 167,741-bp circular molecule with 224 unique intronless genes encoding 158 proteins with known functions, 25 conserved hypothetical reading frames, 3 rRNAs, 36 tRNAs, and 2 RNAs with other functions (fig. 5). Synteny analysis between G. sulphuraria and other red algal plastid genomes revealed extensive reorganization, with numerous rearranged and inverted genomic blocks (fig. 6). Compared with other red algae, the G. sulphuraria genome is rather typical in size and does not exhibit any unusual strand-specific skews of gene distribution or nucleotide frequency, but it has the lowest GC content and the fewest protein-coding genes (table 2). Gene loss affects proteins in most functional categories including gene regulation, translation, energy production, and the biosynthesis of amino acids, cofactors, and lipids (supplementary table S3, Supplementary Material online).
Fig. 5.—

Galdieria sulphuraria plastid genome map. Outer genes are transcribed counter clockwise; inner genes are transcribed clockwise. Gene colors correspond to the functional categories listed in the key.
Fig. 6.—
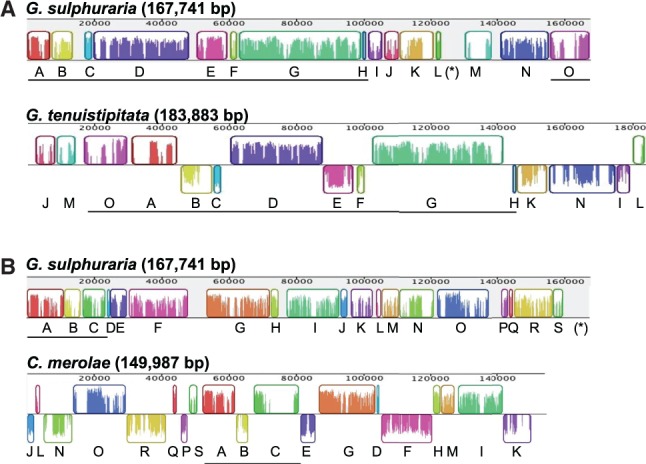
Colinearity between the plastid genomes of Galdieria sulphuraria, Gracilaria tenuistipitata, and Cyanidioschyzon merolae. Pairwise relative arrangements of gene clusters between (A) G. sulphuraria and G. tenuistipitata and (B) G. sulphuraria and C. merolae. Colinearity plots were generated with Mauve (Darling et al. 2004). Clusters of genes identified in each pair are shown as color-coded rectangles and were labeled alphabetically in the reference genome of G. sulphuraria. The longest colinear stretches of sequence are underlined. The level of similarity between blocks is shown as colored bars. Clusters appearing on the opposite strand in G. tenuistipitata or C. merolae indicate an inversion relative to G. sulphuraria. The asterisk in brackets denotes the area of one of the two inverted repeats containing the ribosomal operon of G. sulphuraria. This area is blank because it failed to find a corresponding sequence in the genomes of G. tenuistipitata or C. merolae, both of which have only one copy of this operon (included in clusters “O”).
Table 2.
General Characteristics of Red Algal Plastid Genomes
| Cyanidiophyceae |
Bangiophyceae |
Florideophyceae |
|||||||
|---|---|---|---|---|---|---|---|---|---|
| Ccal | Cmer | Gsul | Phai | Pyez | Ppur | Ccri | Ctub | Gten | |
| Genome size (bp) | 164,921 | 149,987 | 167,741 | 195,597 | 191,952 | 191,028 | 180,086 | 178,981 | 183,883 |
| GC content (%) | 32.7 | 37.6 | 28.5 | 33.0 | 33.1 | 33.0 | 28.7 | 29.2 | 29.2 |
| Gene-strand skew | 0.07 | 0.30 | 0.08 | 0.11 | 0.11 | 0.11 | 0.03 | 0.06 | 0.01 |
| rRNA repeat | None | None | Inverted | Direct | Direct | Direct | None | None | None |
| GC skew | 0.04 | 0.06 | 0.01 | 0.00 | 0.00 | 0.00 | −0.01 | 0.02 | 0.01 |
| AT skew | −0.07 | 0.04 | 0.00 | 0.01 | 0.01 | 0.01 | 0.01 | −0.01 | −0.01 |
| Unique genes | 223 | 229 | 224 | 246 | 246 | 246 | 236 | 235 | 237 |
| RNA | 34 | 36 | 41 | 41 | 41 | 41 | 36 | 37 | 36 |
| Protein | 189 | 193 | 183 | 205 | 205 | 205 | 200 | 198 | 201 |
| Introns | 0 | 0 | 0 | 0 | 0 | 0 | 1 | 2 | 1 |
| With IEPs | 0 | 0 | 0 | 0 | 0 | 0 | 1 | 2 | 1 |
Note.—Ccal = Cyanidium caldarium; Cmer = Cyanidioschyzon merolae; Gsul = Galdieria sulphuraria; Phai = Pyropia haitanensis; Pyez = Pyropia yezoensis; Ppur = Porphyra purpurea; Ccri = Chondrus crispus; Ctub = Calliarthron tuberculosum; Gten = Gracilaria tenuistipitata.
Notably, G. sulphuraria is the only sequenced red algal species that contains a repeat of the rRNA gene cluster in inverted orientation (fig. 5 and table 2). Similar inverted repeats (IRs) containing the entire ribosomal operon and varying numbers of protein and tRNA-encoding genes are commonly found in plastid genomes from land plants, green algae, glaucophytes, and many photosynthetic eukaryotes with red algal-derived plastids. The presence of an IR in G. sulphuraria and most other primary plastid-containing lineages suggests that the common ancestor of red algae also contained an IR that was either rearranged to become a direct repeat in Bangiophyceae or lost several times independently from the other red algal lineages.
Also unusual is the presence of 36 pairs of closely spaced repeats that are predicted to form hairpin-loop structures in single-stranded DNA/RNA or cruciform structures in double-stranded DNA. These stem-loop structures tend to reside in intergenic regions, and 20 have stems predicted to be >40 bp in length (supplementary fig. S2, Supplementary Material online). In contrast, our same search strategy uncovered only 2 to 9 stem-loop structures in any other sequenced red algal plastid genome, of which between 0 and 2 structures had stems >40 bp in length. Dot-plot analyses corroborated the abundance of stem-loop repeats and the presence of the larger rRNA-containing IR in G. sulphuraria, whereas other red algae have many fewer stem-loop repeats and no rRNA-containing IR (supplementary fig. S3, Supplementary Material online).
Increased Rate of Mitochondrial Sequence Evolution
Phylogenetic analysis of mitochondrial and plastid sequences from diverse red algae using ML and BI constructed a mostly well-supported topology (fig. 7), with strong support for the monophyly of all three sampled classes (Cyanidiophyceae, Bangiophyceae, Florideophyceae) and for the early divergence of Cyandiophyceae from the rest of the lineage, in agreement with recent taxonomic treatments in red algae (Verbruggen et al. 2010; Yoon et al. 2010). Within Cyanidiophyceae, G. sulphuraria grouped as sister to a clade including C. merolae and Cy. caldarium, as expected (Ciniglia et al. 2004; Yoon et al. 2006, 2010). With respect to branch lengths, it is clear that G. sulphuraria’s mitochondrial gene and protein sequences are highly divergent in comparison with other red algae (fig. 7A). Since they last shared a common ancestor, mitochondrial genes have evolved 5.7 times faster on average in G. sulphuraria relative to C. merolae, which is significantly different based on a relative rate test (P = 0.00; χ2 = 863.6; degrees of freedom = 1). In contrast, G. sulphuraria’s plastid genes do not exhibit any increased rate of evolutionary divergence compared with other red algae (fig. 7B). Mitochondrial and plastid evolutionary rates appear quite uniform in other red algae based on the similarity of their root-to-tip branch lengths. Unfortunately, synonymous sites in the G. sulphuraria mitogenome appear to be heavily saturated, precluding codon-based analyses to assess the rate of synonymous and nonsynonymous sites separately. Additional sampling of other Galdieria strains will be necessary to assess synonymous rates.
Fig. 7.—
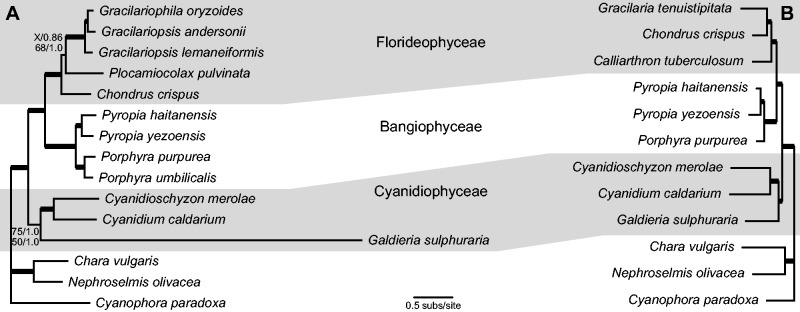
Phylogenetic analysis of red algal mitochondrial and plastid genes. The phylograms from the MrBayes analyses of (A) 24 mitochondrial genes and (B) 53 plastid genes are shown. Thick branches received ≥90% ML bootstrap support and ≥0.99 Bayesian posterior probability. Branches with weaker support values are labeled. The X indicates that the ML nucleotide analysis did not recover the particular branch, but instead grouped Plocamiocolax and Chondrus together with 49% bootstrap support.
Discussion
A Facultatively Heterotrophic Lifestyle Elicits Increased Mitochondrial Mutation
Although G. sulphuraria lives in extreme environments with high temperatures, low pH, and abundant salts and metals, it is unlikely that these conditions are directly responsible for the atypical organellar features. This is because other Cyanidiophyceae species are also polyextremophilic, yet their mitochondrial and plastid genomes do not share the same set of characteristics. In addition, the dramatic nucleotide and gene-strand skews in G. sulphuraria’s mitochondrial genome are not paralleled in the plastid genome, arguing against an underlying cause affecting the entire organism. What sets G. sulphuraria apart from other polyextremophilic red algae is the fact that it can grow heterotrophically, endolithically, and in the dark, conditions which require increased or total reliance on energy production from the mitochondrion and reduced or complete absence of demand for photosynthetic activity.
It is likely that this increased mitochondrial usage in certain environments generates a larger amount of reactive oxygen species (ROS) in G. sulphuraria mitochondria. If the scavenging mechanisms that are normally in place to prevent ROS-mediated damage are compromised or inefficient due to the extreme environmental conditions, or if the ROS levels become too high to be dealt with effectively, then the increased damage would lead to an increased mutation rate, which corresponds perfectly with our observations of accelerated mitochondrial protein evolution (fig. 7). Based on DNA sequence alignments, it is clear that the nucleotide substitution rate is also extremely elevated in G. sulphuraria mitochondrial genes, but reliable estimates of synonymous site evolution could not be obtained due to mutational saturation. Although the high temperatures, low pH, and abundant salts and metals in G. sulphuraria’s environment may not be directly responsible for the unusual mitochondrial genomic evolution, it is very possible that these extreme environmental conditions exacerbate the mutational effects. Many types of mutations, including deamination and depurination, increase in frequency under conditions of low pH, high temperature, and high salinity, while denatured DNA is more prone to mutations than double-stranded DNA (Lindahl and Nyberg 1972; Frederico et al. 1993). The increased mutation rate could also be exacerbated by inefficient mitochondrial repair mechanisms.
Mutational and Selective Mechanisms Promoting Strand-Specific Skews
The reasons for the extreme GC skew and moderate AT skew in the G. sulphuraria mitogenome likely derive, at least in part, from strand-specific biases in the accumulation and/or repair of particular types of mutations. GC skew is well known in bacteria and viruses, and to some extent in higher organisms, with the G-rich strand being the leading strand during replication (Frank and Lobry 1999; Qu et al. 2010). While the lagging strand is being replicated, its template (the leading strand from the last round of replication) is transiently single stranded because discontinuous replication loops it out between Okazaki fragment priming. During this single-stranded phase, deamination of C to U is more likely than otherwise. Such deamination will convert a C in the leading strand to a U, which if uncorrected will lead to a GC to AT transition mutation, resulting in a bias against C in the leading strand, and positive GC skew. The extreme GC skew seen in G. sulphuraria suggests that the entire genome is replicated in one direction, via a unidirectional replication fork or a rolling-circle mechanism. Cytosine deamination during replication can also lead to a slight bias toward T in the leading strand, and hence negative AT skew, although the effect is generally much smaller than the direct effect of mutagenesis of C by deamination (Worning et al. 2006). However, the AT skew in G. sulphuraria is large and in the opposite direction, favoring A rather than T in the G-rich strand, and arguing against cytosine deamination as the cause of the positive AT skew.
In addition to G. sulphuraria, a group of Gram-positive bacteria known as the Firmicutes also show the unusual combination of positive GC skew and positive AT skew in the leading strand as well as a highly biased gene distribution, with the sense strand most likely to be on the leading strand (Saha et al. 2014). In Firmicutes, the positive GC skew is most likely due to the cytosine deamination process described above, while the positive AT skew correlates with the presence of a novel DNA polymerase subunit. Most bacteria use a family C DNA polymerase encoded by the dnaE family of genes as the major replicative polymerase (Timinskas et al. 2014). The Firmicutes use a dnaE3 subtype polymerase for lagging strand replication and a second family C DNA polymerase, encoded by the polC gene, for the leading strand (McHenry 2011; Saha et al. 2014; Timinskas et al. 2014). It is not understood why this polC/dnaE3 system of replication generates positive AT skew in the leading strand, in contrast to the slightly negative AT skew of the other bacteria.
In eukaryotes, family C polymerases are virtually unknown, and organellar DNA polymerases (also known as gamma type or DNA PolI) are in family A (Koonin 2006). Interestingly enough, G. sulphuraria has a DNA polymerase of the dnaE type (XP_005703203.1) that is predicted to have mitochondrial targeting peptides by both iPSORT (http://ipsort.hgc.jp, last accessed January 24, 2015; Bannai et al. 2002) and TargetP (http://www.cbs.dtu.dk/services/TargetP/, last accessed January 24, 2015; Emanuelsson et al. 2000). However, it is most similar to the dnaE1 subtype of the cyanobacteria rather than the dnaE3 subtype found in the Firmicutes. Furthermore, there is no apparent copy of polC in G. sulphuraria, and the dnaE1 polymerases usually replicate both strands, rather than only the lagging strand (Timinskas et al. 2014). Nevertheless, there may be mutational effects that are due to the novel mitochondrial DNA polymerase and its particular fidelity spectrum. The dnaE-type polymerases rely on the separate dnaQ subunit for proofreading, and it is not clear what carries out that function in G. sulphuraria mitochondria, so there may be a specific mutational spectrum deriving from this novel replication protein (Bruck et al. 2003; McHenry 2011; Timinskas et al. 2014). That the AT skew of the two genes on the opposite strand is not inverted suggests that replication and mutation are likely to be the major processes driving the extreme GC and AT skew of the G. sulphuraria mitochondrial genome.
There are also selection-based hypotheses to explain the unusual strand biases for genes and nucleotides in the G. sulphuraria mitochondrial genome. The strong strand bias for genes may be selected for in order to avoid head-on collisions between replication forks and transcription machinery. Because the sense strands of genes are predominantly in the leading strand, the GC skew leads to G-rich mRNAs. Given that G can pair readily with both C and U in RNA, selection against double-stranded RNA would lead to a bias against both C and T in the leading strand, to produce mRNAs that will not fold into compact structures (Lao and Forsdyke 2000; Hu et al. 2007). G-rich mRNAs could also promote increased transcript stability, which may be required to prevent degradation in extreme conditions. Extended poly-G tracts have been shown to significantly increase transcript half-lives (Vreken and Raue 1992; Drager et al. 1998), providing a selective advantage for G-rich mRNAs.
Mutational Load and the Loss of Genes and Introns
Whatever the underlying cause, these strand-specific mutational biases in the mitochondrial genome undoubtedly generate increased mutational load and nonoptimal codon usage. In the absence of a functional repair mechanism, gene transfer to the nucleus is the only way to escape the mutational load and increasing nucleotide composition skew. Thus, these factors would be expected to preferentially drive genes into the nucleus, which likely explains the dramatic reduction of gene content in the G. sulphuraria mitogenome. Sequencing from additional strains of Galdieria and other Cyanidiophyceae species will be necessary to detect whether many of the missing mitochondrial genes were indeed transferred to the nuclear genome or were completely lost from G. sulphuraria. The observed GC and AT skews are also likely to disrupt stem formation in RNA secondary structure, prompting the dramatic reduction of tRNAs, absence of introns, and apparent loss of 5 S rRNA from the G. sulphuraria mitogenome.
The Functional Role of Plastid Stem-Loop Structures
These various factors influencing mitochondrial genomic structure and content should also affect the plastid genome of G. sulphuraria. However, the decreased reliance on photosynthesis in certain conditions would reduce the production of ROS in the chloroplast, and the absence of any mutation rate increase in plastid genes is consistent with this hypothesis. In addition, the presence of numerous stem-loop structures is intriguing, especially given G. sulphuraria’s extremophilic lifestyle. The large increase in the number of stem-loop structures in the plastid genome may be an adaptive strategy to prevent unwinding of DNA in extreme conditions and to limit the extent of DNA unwinding during replication and transcription. This genomic stabilization likely serves to limit the accumulation of mutations in the plastid genome.
Alternatively, the stem-loop structures in the G. sulphuraria plastid genome may play a functional role during replication, transcription, or translation. DNA hairpin and cruciform structures are known to initiate replication and to modulate transcription in other species (Bikard et al. 2010; Brazda et al. 2011). Furthermore, the stability of these DNA structures are affected by changes in DNA supercoiling, stem length, temperature, and metal and salt concentrations (Singleton 1983; Viglasky et al. 2005). At the transcript level, RNA hairpins have been shown in prokaryotes to regulate translation initiation in a temperature-dependent fashion (Kortmann and Narberhaus 2012; Deiorio-Haggar et al. 2013). RNA secondary structure can also increase transcript stability at elevated temperatures. It is possible that environmental cues alter the conformation of the DNA/RNA stem-loop structures to regulate plastid replication, transcription, and/or translation in G. sulphuraria.
Supplementary Material
Supplementary figures S1–S3 and tables S1–S3 are available at Genome Biology and Evolution online (http://www.gbe.oxfordjournals.org/).
Acknowledgments
The authors thank Chris Lane and Eric Salomaki for supplying DNA from Gracilariophila oryzoides and Gracilariopsis andersonii, members of the Mower laboratory and Sally Mackenzie’s laboratory for helpful discussions, and Ken Nickerson for discussions of Firmicutes. This work was supported by the National Science Foundation [IOS 1027529 and MCB 1125386 to J.P.M.] and the German Research Foundation [EXC 1028 and IRTG 1525 to A.P.M.W.].
Literature Cited
- Adams KL, Palmer JD. Evolution of mitochondrial gene content: gene loss and transfer to the nucleus. Mol Phylogenet Evol. 2003;29:380–395. doi: 10.1016/s1055-7903(03)00194-5. [DOI] [PubMed] [Google Scholar]
- Amlacher S, et al. Insight into structure and assembly of the nuclear pore complex by utilizing the genome of a eukaryotic thermophile. Cell. 2011;146:277–289. doi: 10.1016/j.cell.2011.06.039. [DOI] [PubMed] [Google Scholar]
- Bannai H, Tamada Y, Maruyama O, Nakai K, Miyano S. Extensive feature detection of N-terminal protein sorting signals. Bioinformatics. 2002;18:298–305. doi: 10.1093/bioinformatics/18.2.298. [DOI] [PubMed] [Google Scholar]
- Barbier G, et al. Comparative genomics of two closely related unicellular thermo-acidophilic red algae, Galdieria sulphuraria and Cyanidioschyzon merolae, reveals the molecular basis of the metabolic flexibility of Galdieria sulphuraria and significant differences in carbohydrate metabolism of both algae. Plant Physiol. 2005;137:460–474. doi: 10.1104/pp.104.051169. [DOI] [PMC free article] [PubMed] [Google Scholar]
- Bikard D, Loot C, Baharoglu Z, Mazel D. Folded DNA in action: hairpin formation and biological functions in prokaryotes. Microbiol Mol Biol Rev. 2010;74:570–588. doi: 10.1128/MMBR.00026-10. [DOI] [PMC free article] [PubMed] [Google Scholar]
- Brazda V, Laister RC, Jagelska EB, Arrowsmith C. Cruciform structures are a common DNA feature important for regulating biological processes. BMC Mol Biol. 2011;12:33. doi: 10.1186/1471-2199-12-33. [DOI] [PMC free article] [PubMed] [Google Scholar]
- Bruck I, Goodman MF, O'Donnell M. The essential C family DnaE polymerase is error-prone and efficient at lesion bypass. J Biol Chem. 2003;278:44361–44368. doi: 10.1074/jbc.M308307200. [DOI] [PubMed] [Google Scholar]
- Bult CJ, et al. Complete genome sequence of the methanogenic archaeon, Methanococcus jannaschii. Science. 1996;273:1058–1073. doi: 10.1126/science.273.5278.1058. [DOI] [PubMed] [Google Scholar]
- Burger G, Lang BF, Braun HP, Marx S. The enigmatic mitochondrial ORF ymf39 codes for ATP synthase chain b. Nucleic Acids Res. 2003;31:2353–2360. doi: 10.1093/nar/gkg326. [DOI] [PMC free article] [PubMed] [Google Scholar]
- Camacho C, et al. BLAST+: architecture and applications. BMC Bioinformatics. 2009;10:421. doi: 10.1186/1471-2105-10-421. [DOI] [PMC free article] [PubMed] [Google Scholar]
- Campbell MA, Presting G, Bennett MS, Sherwood AR. Highly conserved organellar genomes in the Gracilariales as inferred using new data from the Hawaiian invasive alga Gracilaria salicornia (Rhodophyta) Phycologia. 2014;53:109–116. [Google Scholar]
- Castresana J. Selection of conserved blocks from multiple alignments for their use in phylogenetic analysis. Mol Biol Evol. 2000;17:540–552. doi: 10.1093/oxfordjournals.molbev.a026334. [DOI] [PubMed] [Google Scholar]
- Ciniglia C, Yoon HS, Pollio A, Pinto G, Bhattacharya D. Hidden biodiversity of the extremophilic Cyanidiales red algae. Mol Ecol. 2004;13:1827–1838. doi: 10.1111/j.1365-294X.2004.02180.x. [DOI] [PubMed] [Google Scholar]
- Darriba D, Taboada GL, Doallo R, Posada D. jModelTest 2: more models, new heuristics and parallel computing. Nat Methods. 2012;9:772. doi: 10.1038/nmeth.2109. [DOI] [PMC free article] [PubMed] [Google Scholar]
- Dassanayake M, et al. The genome of the extremophile crucifer Thellungiella parvula. Nat Genet. 2011;43:913–918. doi: 10.1038/ng.889. [DOI] [PMC free article] [PubMed] [Google Scholar]
- Deckert G, et al. The complete genome of the hyperthermophilic bacterium Aquifex aeolicus. Nature. 1998;392:353–358. doi: 10.1038/32831. [DOI] [PubMed] [Google Scholar]
- Deiorio-Haggar K, Anthony J, Meyer MM. RNA structures regulating ribosomal protein biosynthesis in bacilli. RNA Biol. 2013;10:1180–1184. doi: 10.4161/rna.24151. [DOI] [PMC free article] [PubMed] [Google Scholar]
- Drager RG, Girard-Bascou J, Choquet Y, Kindle KL, Stern DB. In vivo evidence for 5′–>3′ exoribonuclease degradation of an unstable chloroplast mRNA. Plant J. 1998;13:85–96. doi: 10.1046/j.1365-313x.1998.00016.x. [DOI] [PubMed] [Google Scholar]
- Dujon B, et al. Genome evolution in yeasts. Nature. 2004;430:35–44. doi: 10.1038/nature02579. [DOI] [PubMed] [Google Scholar]
- Edgar RC. MUSCLE: multiple sequence alignment with high accuracy and high throughput. Nucleic Acids Res. 2004;32:1792–1797. doi: 10.1093/nar/gkh340. [DOI] [PMC free article] [PubMed] [Google Scholar]
- Emanuelsson O, Nielsen H, Brunak S, von Heijne G. Predicting subcellular localization of proteins based on their N-terminal amino acid sequence. J Mol Biol. 2000;300:1005–1016. doi: 10.1006/jmbi.2000.3903. [DOI] [PubMed] [Google Scholar]
- Frank AC, Lobry JR. Asymmetric substitution patterns: a review of possible underlying mutational or selective mechanisms. Gene. 1999;238:65–77. doi: 10.1016/s0378-1119(99)00297-8. [DOI] [PubMed] [Google Scholar]
- Frederico LA, Kunkel TA, Shaw BR. Cytosine deamination in mismatched base pairs. Biochemistry. 1993;32:6523–6530. doi: 10.1021/bi00077a005. [DOI] [PubMed] [Google Scholar]
- Hall TA. BioEdit: a user-friendly biological sequence alignment editor and analysis program for Windows 95/98/NT. Nucleic Acids Symp Ser. 1999;41:95–98. [Google Scholar]
- Hancock L, Goff L, Lane C. Red algae lose key mitochondrial genes in response to becoming parasitic. Genome Biol Evol. 2010;2:897–910. doi: 10.1093/gbe/evq075. [DOI] [PMC free article] [PubMed] [Google Scholar]
- Hu J, Zhao X, Yu J. Replication-associated purine asymmetry may contribute to strand-biased gene distribution. Genomics. 2007;90:186–194. doi: 10.1016/j.ygeno.2007.04.002. [DOI] [PubMed] [Google Scholar]
- Kim KM, Park JH, Bhattacharya D, Yoon HS. Applications of next-generation sequencing to unravelling the evolutionary history of algae. Int J Syst Evol Microbiol. 2014;64:333–345. doi: 10.1099/ijs.0.054221-0. [DOI] [PubMed] [Google Scholar]
- Koonin EV. Temporal order of evolution of DNA replication systems inferred by comparison of cellular and viral DNA polymerases. Biol Direct. 2006;1:39. doi: 10.1186/1745-6150-1-39. [DOI] [PMC free article] [PubMed] [Google Scholar]
- Kortmann J, Narberhaus F. Bacterial RNA thermometers: molecular zippers and switches. Nat Rev Microbiol. 2012;10:255–265. doi: 10.1038/nrmicro2730. [DOI] [PubMed] [Google Scholar]
- Kurtz S, et al. Versatile and open software for comparing large genomes. Genome Biol. 2004;5:R12. doi: 10.1186/gb-2004-5-2-r12. [DOI] [PMC free article] [PubMed] [Google Scholar]
- Lao PJ, Forsdyke DR. Thermophilic bacteria strictly obey Szybalski's transcription direction rule and politely purine-load RNAs with both adenine and guanine. Genome Res. 2000;10:228–236. doi: 10.1101/gr.10.2.228. [DOI] [PMC free article] [PubMed] [Google Scholar]
- Lindahl T, Nyberg B. Rate of depurination of native deoxyribonucleic acid. Biochemistry. 1972;11:3610–3618. doi: 10.1021/bi00769a018. [DOI] [PubMed] [Google Scholar]
- Lohse M, Drechsel O, Kahlau S, Bock R. OrganellarGenomeDRAW—a suite of tools for generating physical maps of plastid and mitochondrial genomes and visualizing expression data sets. Nucleic Acids Res. 2013;41:W575–W581. doi: 10.1093/nar/gkt289. [DOI] [PMC free article] [PubMed] [Google Scholar]
- Lowe TM, Eddy SR. tRNAscan-SE: a program for improved detection of transfer RNA genes in genomic sequence. Nucleic Acids Res. 1997;25:955–964. doi: 10.1093/nar/25.5.955. [DOI] [PMC free article] [PubMed] [Google Scholar]
- Matsuzaki M, et al. Genome sequence of the ultrasmall unicellular red alga Cyanidioschyzon merolae 10D. Nature. 2004;428:653–657. doi: 10.1038/nature02398. [DOI] [PubMed] [Google Scholar]
- McHenry CS. Breaking the rules: bacteria that use several DNA polymerase IIIs. EMBO Rep. 2011;12:408–414. doi: 10.1038/embor.2011.51. [DOI] [PMC free article] [PubMed] [Google Scholar]
- Nelson KE, et al. Evidence for lateral gene transfer between Archaea and bacteria from genome sequence of Thermotoga maritima. Nature. 1999;399:323–329. doi: 10.1038/20601. [DOI] [PubMed] [Google Scholar]
- Qu H, et al. Nucleotide compositional asymmetry between the leading and lagging strands of eubacterial genomes. Res Microbiol. 2010;161:838–846. doi: 10.1016/j.resmic.2010.09.015. [DOI] [PubMed] [Google Scholar]
- Reeb V, Bhattacharya D. The thermo-acidophilic Cyanidiophyceae (Cyanidiales) In: Seckbach J, Chapman DJ, editors. Red algae in the genomic age. Dordrecht (The Netherlands): Springer; 2010. pp. 409–426. [Google Scholar]
- Reyes-Prieto A, Weber AP, Bhattacharya D. The origin and establishment of the plastid in algae and plants. Annu Rev Genet. 2007;41:147–168. doi: 10.1146/annurev.genet.41.110306.130134. [DOI] [PubMed] [Google Scholar]
- Ronquist F, Huelsenbeck JP. MrBayes 3: Bayesian phylogenetic inference under mixed models. Bioinformatics. 2003;19:1572–1574. doi: 10.1093/bioinformatics/btg180. [DOI] [PubMed] [Google Scholar]
- Rudner R, Karkas JD, Chargaff E. Separation of B. subtilis DNA into complementary strands. 3. Direct analysis. Proc Natl Acad Sci U S A. 1968;60:921–922. doi: 10.1073/pnas.60.3.921. [DOI] [PMC free article] [PubMed] [Google Scholar]
- Saha SK, Goswami A, Dutta C. Association of purine asymmetry, strand-biased gene distribution and PolC within Firmicutes and beyond: a new appraisal. BMC Genomics. 2014;15:430. doi: 10.1186/1471-2164-15-430. [DOI] [PMC free article] [PubMed] [Google Scholar]
- Saunders NF, et al. Mechanisms of thermal adaptation revealed from the genomes of the Antarctic Archaea Methanogenium frigidum and Methanococcoides burtonii. Genome Res. 2003;13:1580–1588. doi: 10.1101/gr.1180903. [DOI] [PMC free article] [PubMed] [Google Scholar]
- Schonknecht G, et al. Gene transfer from bacteria and archaea facilitated evolution of an extremophilic eukaryote. Science. 2013;339:1207–1210. doi: 10.1126/science.1231707. [DOI] [PubMed] [Google Scholar]
- Singleton CK. Effects of salts, temperature, and stem length on supercoil-induced formation of cruciforms. J Biol Chem. 1983;258:7661–7668. [PubMed] [Google Scholar]
- Stamatakis A. RAxML-VI-HPC: maximum likelihood-based phylogenetic analyses with thousands of taxa and mixed models. Bioinformatics. 2006;22:2688–2690. doi: 10.1093/bioinformatics/btl446. [DOI] [PubMed] [Google Scholar]
- Stamatakis A, Hoover P, Rougemont J. A rapid bootstrap algorithm for the RAxML Web servers. Syst Biol. 2008;57:758–771. doi: 10.1080/10635150802429642. [DOI] [PubMed] [Google Scholar]
- Tamura K, et al. MEGA5: molecular evolutionary genetics analysis using maximum likelihood, evolutionary distance, and maximum parsimony methods. Mol Biol Evol. 2011;28:2731–2739. doi: 10.1093/molbev/msr121. [DOI] [PMC free article] [PubMed] [Google Scholar]
- Timinskas K, Balvociute M, Timinskas A, Venclovas C. Comprehensive analysis of DNA polymerase III alpha subunits and their homologs in bacterial genomes. Nucleic Acids Res. 2014;42:1393–1413. doi: 10.1093/nar/gkt900. [DOI] [PMC free article] [PubMed] [Google Scholar]
- Valach M, Burger G, Gray MW, Lang BF. Widespread occurrence of organelle genome-encoded 5 S rRNAs including permuted molecules. Nucleic Acids Res. 2014;42:13764–13777. doi: 10.1093/nar/gku1266. [DOI] [PMC free article] [PubMed] [Google Scholar]
- Verbruggen H, et al. Data mining approach identifies research priorities and data requirements for resolving the red algal tree of life. BMC Evol Biol. 2010;10:16. doi: 10.1186/1471-2148-10-16. [DOI] [PMC free article] [PubMed] [Google Scholar]
- Viglasky V, Danko P, Adamcik J, Valle F, Dietler G. Detection of cruciform extrusion in DNA by temperature-gradient gel electrophoresis. Anal Biochem. 2005;343:308–312. doi: 10.1016/j.ab.2005.05.017. [DOI] [PubMed] [Google Scholar]
- Vreken P, Raue HA. The rate-limiting step in yeast PGK1 mRNA degradation is an endonucleolytic cleavage in the 3′-terminal part of the coding region. Mol Cell Biol. 1992;12:2986–2996. doi: 10.1128/mcb.12.7.2986. [DOI] [PMC free article] [PubMed] [Google Scholar]
- Worning P, Jensen LJ, Hallin PF, Staerfeldt HH, Ussery DW. Origin of replication in circular prokaryotic chromosomes. Environ Microbiol. 2006;8:353–361. doi: 10.1111/j.1462-2920.2005.00917.x. [DOI] [PubMed] [Google Scholar]
- Wyman SK, Jansen RK, Boore JL. Automatic annotation of organellar genomes with DOGMA. Bioinformatics. 2004;20:3252–3255. doi: 10.1093/bioinformatics/bth352. [DOI] [PubMed] [Google Scholar]
- Yoon H, Zuccarello G, Bhattacharya D. Evolutionary history and taxonomy of red algae. In: Seckbach J, Chapman DJ, editors. Red algae in the genomic age. Dordrecht (The Netherlands): Springer; 2010. pp. 25–42. [Google Scholar]
- Yoon HS, Hackett JD, Ciniglia C, Pinto G, Bhattacharya D. A molecular timeline for the origin of photosynthetic eukaryotes. Mol Biol Evol. 2004;21:809–818. doi: 10.1093/molbev/msh075. [DOI] [PubMed] [Google Scholar]
- Yoon HS, Hackett JD, Pinto G, Bhattacharya D. The single, ancient origin of chromist plastids. Proc Natl Acad Sci U S A. 2002;99:15507–15512. doi: 10.1073/pnas.242379899. [DOI] [PMC free article] [PubMed] [Google Scholar]
- Yoon HS, et al. Establishment of endolithic populations of extremophilic Cyanidiales (Rhodophyta) BMC Evol Biol. 2006;6:78. doi: 10.1186/1471-2148-6-78. [DOI] [PMC free article] [PubMed] [Google Scholar]
Associated Data
This section collects any data citations, data availability statements, or supplementary materials included in this article.